Article

Research on Marine Ecological Carrying Capacity of Ningbo City in China Based on System Dynamics

College of Biology and Environmental Engineering, Zhejiang Shuren University, Hangzhou 310015, China
*
Author to whom correspondence should be addressed.
Sustainability 2022, 14(8), 4568; https://doi.org/10.3390/su14084568
Submission received: 13 February 2022 / Revised: 7 April 2022 / Accepted: 8 April 2022 / Published: 11 April 2022

Abstract

:
In order to quantitatively analyze the comprehensive impact of population growth, economic development, and environmental pollution on marine ecology, a system dynamics (SD) model was constructed to evaluate and predict the marine ecological carrying capacity (MECC) of Ningbo city, China. Population, gross domestic product, chemical oxygen demand, and marine economic development were selected as the influencing factors of Ningbo MECC. Using the established SD model, the current situation and development forecast of Ningbo MECC from 2012 to 2023 were simulated and analyzed. A consistency test showed that the difference between the simulated value and historical data was within 5%, and the data were consistent in reflecting the evolution of the actual system with high credibility and effective simulation. The results indicated that the model could objectively reflect the relationship between marine ecology, economic development, and population growth. According to the prediction by the SD model, the MECC index would slightly rise year by year under the current development mode, while it would be still below 1.0 by 2023. By reducing the economic growth rate and increasing the pollutant treatment rate, the goal of improving MECC could be effectively achieved.

1. Introduction

Since the reform and opening up, the economy of Zhejiang’s coastal and bay areas has ushered in a golden period of rapid development. However, increasingly exhausted marine resources, degraded marine ecology, and a decline in marine environmental quality are expected to emerge with this rapid development and to become a bottleneck that restricts the economic and social development of coastal regions [1,2]. Until now, several methodological approaches have been carried out to better manage and recover the complex coastal and bay areas. For example, García-Ayllón developed the socio-ecological system (SES) based on GIS tools to diagnose and achieve a sustainable cohabitation between human anthropization and natural values [3]. Lin [4] proposed a coupling coordination degree model with an index system weight using the information entropy method and successfully analyzed the relationship between the marine economy and ecology of Shanghai from 2005 to 2014. Among these studies, the carrying capacity, originally a concept from ecology, has become a basic principle for sustainable development and a valuable tool for environmental planning and management [5,6,7,8,9]. The marine ecological carrying capacity (MECC) here refers to the capacity of coastal zone ecosystem that can support population, social, and economic development by self-regulation and self-sustaining, without significant adverse impacts on sustainable use of marine environmental resources in a certain period of time [10,11]. The level of MECC is an important basis for formulating reasonable development plans and goals to control marine development activities within an acceptable range. Carrying out research on MECC can provide early warnings for specific development strategies from the perspective of sustainable development and guide human development activities.
Quantitative assessment of ecological carrying capacity can provide an in-depth understanding of the relationship between the environment and human activities [12]. Existing quantitative analysis of ecological carrying capacity has been carried out mainly by establishing relevant mathematical models such as fuzzy comprehensive evaluation model [6,13], ecological footprint model [14,15], state-pace method model [2], and vector-surplus ratio of carrying capacity model based on stress and carrying capacity [16]. The MECC ought to be able to reflect the status of marine environment and socio-economic environment interactions, which is a complex large-scale system involving numerous factors. System dynamics (SD) is an effective tool for the analysis of complex systems, which can reflect the various feedback relationships of the system through the use of computer simulation technology [17]. It has been widely used to assess the water environment carrying capacity in China, namely in Suzhou by Cheng [18], in Baita River Basin by Zeng et al. [19], and in Siping area of Jinlin Province by Zhang et al. [20]. By simulating developmental changes of variables under different development plans through the SD model, the development plan that is suitable for the sustainable ecological development of the region and the corresponding carrying capacity can be identified.
In this study, Ningbo, a developed city in the southern China coastal area, was selected for the evaluation of MECC in an overpopulated environment and the SD method was used to build a model for simulating the socio-economic-environmental system. Data from 2012~2018 were collected to assess the current situation of Ningbo MECC and validate the SD model. The future variation tendency of Ningbo MECC in 2019~2023 was simulated under two different development scenarios which provide scientific references for its sustainable coastal planning and management.

2. Construction of the Ningbo MECC
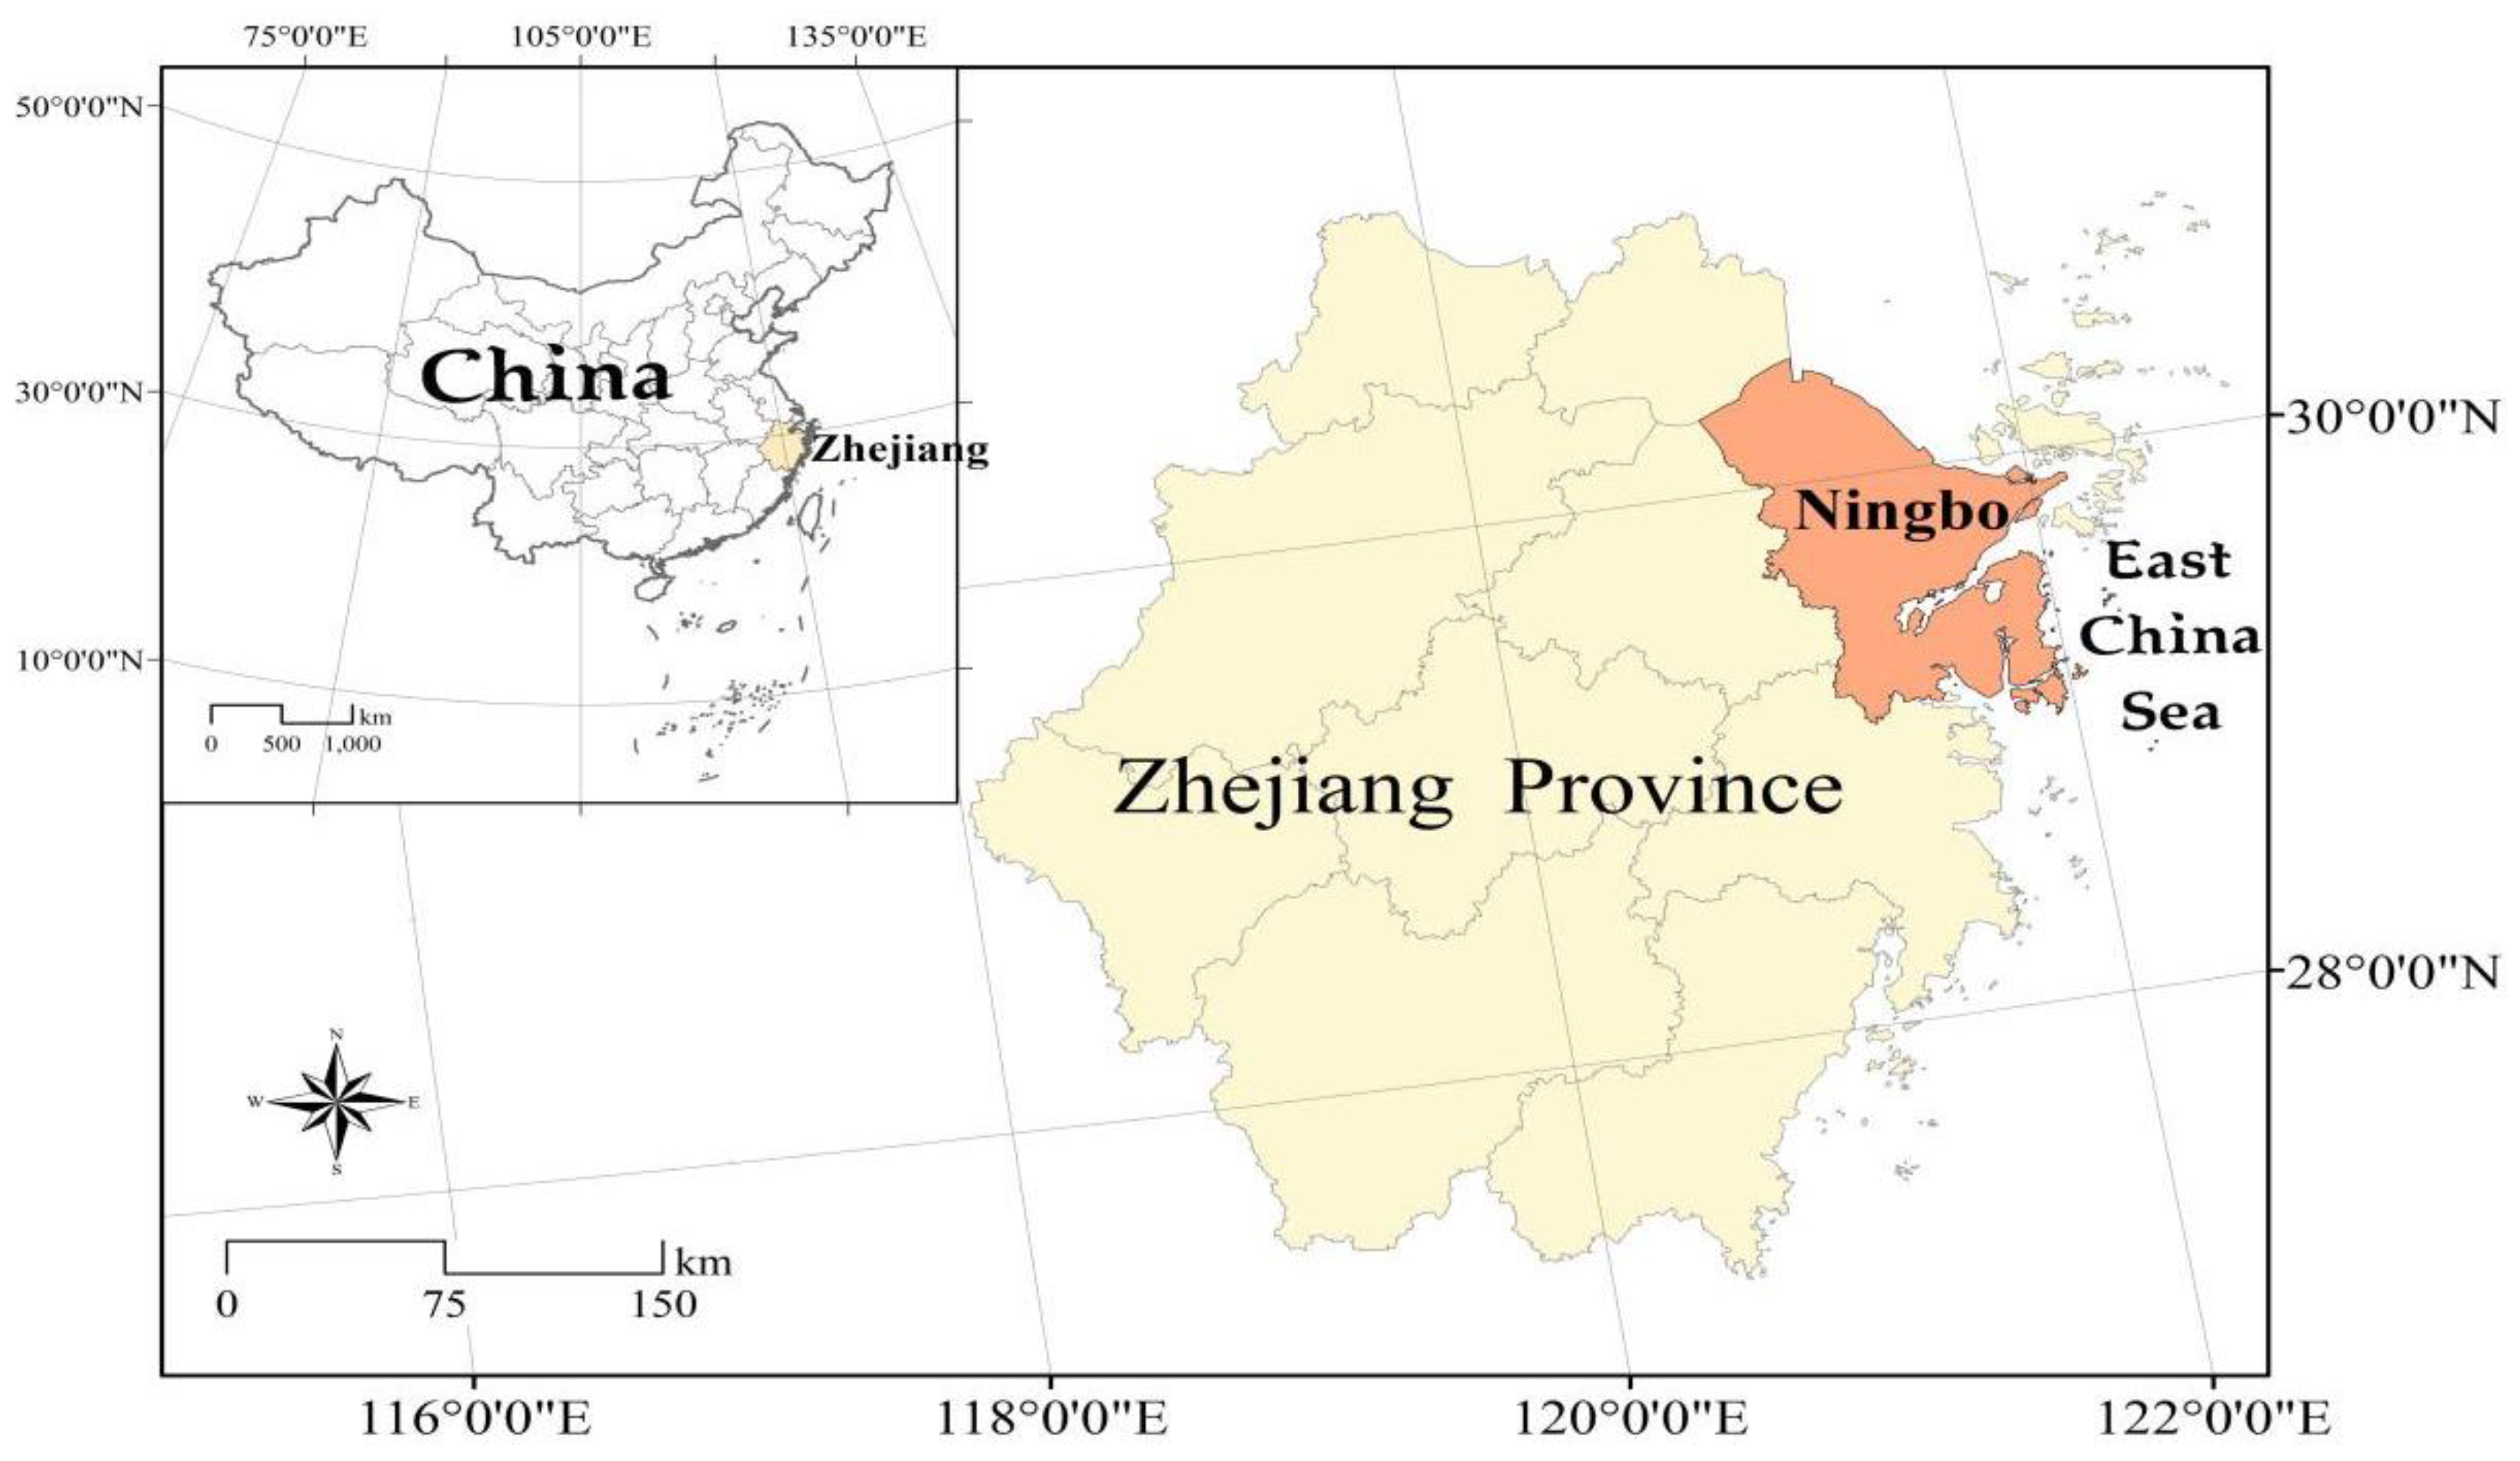
2.1. Study Site

Ningbo city is located in the middle of the eastern seaboard of mainland China, at the southern wing of the Yangtze River Delta (Figure 1). It is a typical Jiangnan water town and seaport city. It is rich in marine resources and has a total sea area of 8355.8 km2 with a coastline of 1594.4 km and a population of six million. It is the economic center of the southern wing of the Yangtze River Delta and the port of origin of the “Maritime Silk Road” of the East. Ningbo’s marine industry developed early from fishery and the shipping, harbor, and tourism industries, with a balanced and comprehensive industrial distribution. It is the core area of Zhejiang province’s model marine economic development zone and has an important strategic position in promoting the development of Zhejiang’s marine economy. At present, Ningbo’s marine economic development is in the optimization and upgrading stage. It is focusing on strengthening the construction of the marine ecological civilization and striving to achieve a strategic transformation from a city with an extensive marine economy to a city with a strong marine economy. Therefore, it is expected to become a core model area for China’s marine economic development. In 2012, its marine gross domestic product (GDP) accounted for 16% of the total GDP (about $98.2 billion), with an annual increase rate of 6.5% during the last decade. This tremendous marine economic achievement has placed a heavy burden on the environment of Ningbo (e.g., marine pollution and coastal reclamation).

2.2. Spatial and Temporal Model Boundary

The ocean is not only affected by its own natural resources and ecosystems but also human activities in coastal areas. Moreover, it is a giant, open, and complex system. The model divides the factors that have a direct and important impact on water resources within the boundary which include population, economy, environment, and resources. These factors interact, influence, restrict, and promote each other and jointly affect the marine ecological systems [21,22]. Taking into account the integrity of the administrative boundary and the implementability of the policy, this study identified the spatial boundary of the SD model for Ningbo MECC as the whole land area and coastal waters within the administrative jurisdiction of Ningbo.
The period revised was from 2012 to 2018. The period selected was based on a quite high growth rate of the marine economy in China, and rapid development might cause a spillover on the MECC [1,10,23]. The simulated period was from 2019 to 2023 and the base year was 2012. The simulation time interval was one year as the interval of data collection. The validity of the SD model was tested by using the 2012 index values to simulate the 2012–2018 index values from the initial data. On this basis, the SD model was adjusted so that the errors of each simulation index were within a certain range. To maintain and protect the normal basic functions of the Ningbo marine network ecosystem, the future variation tendency of the Ningbo MECC from 2019 to 2023 under two different configuration plans was calculated and simulated by the SD model.

2.3. Index System and Data Collection

The selection of indicators in the index system had to meet principles of comprehensive objectiveness including a combination of quantitative and qualitative factors, operability, independent representation, and predictability [24,25]. Based on the above-mentioned principles, indicators that tended to have a great impact on the Ningbo MECC were selected. The indicators were selected from the authoritative data published by local government or administration, and the inter-index multicollinearity was eliminated by using the multiple linear regression method using SPSS software. In multiple linear regression analysis in SPSS, as long as there are two or more linear correlations, multicollinearity can occur. The variables enter the regression analysis by the multiple linear regression method of SPSS software in the order of correlation degree between independent variable data and dependent variable data from high to low, and the independent variables with small relationships with the dependent variables are eliminated. Based on this principle, the selected indicators are shown in Table 1. The seventeen indicators constituted an evaluation index system that could comprehensively reflect the status of the marine ecosystem.
The index data during the evaluation period from 2012 to 2018 were collected from the Ningbo Municipal Statistic Bureau (http://tjj.ningbo.gov.cn/col/col1229042824/index.html, accessed on 1 July 2020), Ningbo Marine Quality Bulletin, Ningbo Marine Fisheries Bureau, Ningbo Environmental Quality Bulletin (http://sthjj.ningbo.gov.cn/col/col1229051263/index.html, accessed on 1 July 2020), monitoring data and project reports from local government and published literatures. According to their effect on MECC, these indicators were divided into two categories: positive effect and negative effect. The positive indicators represented the increase in their values and would increase MECC, while the negative indicators represented the increase in their values and would decrease MECC (Table 1).

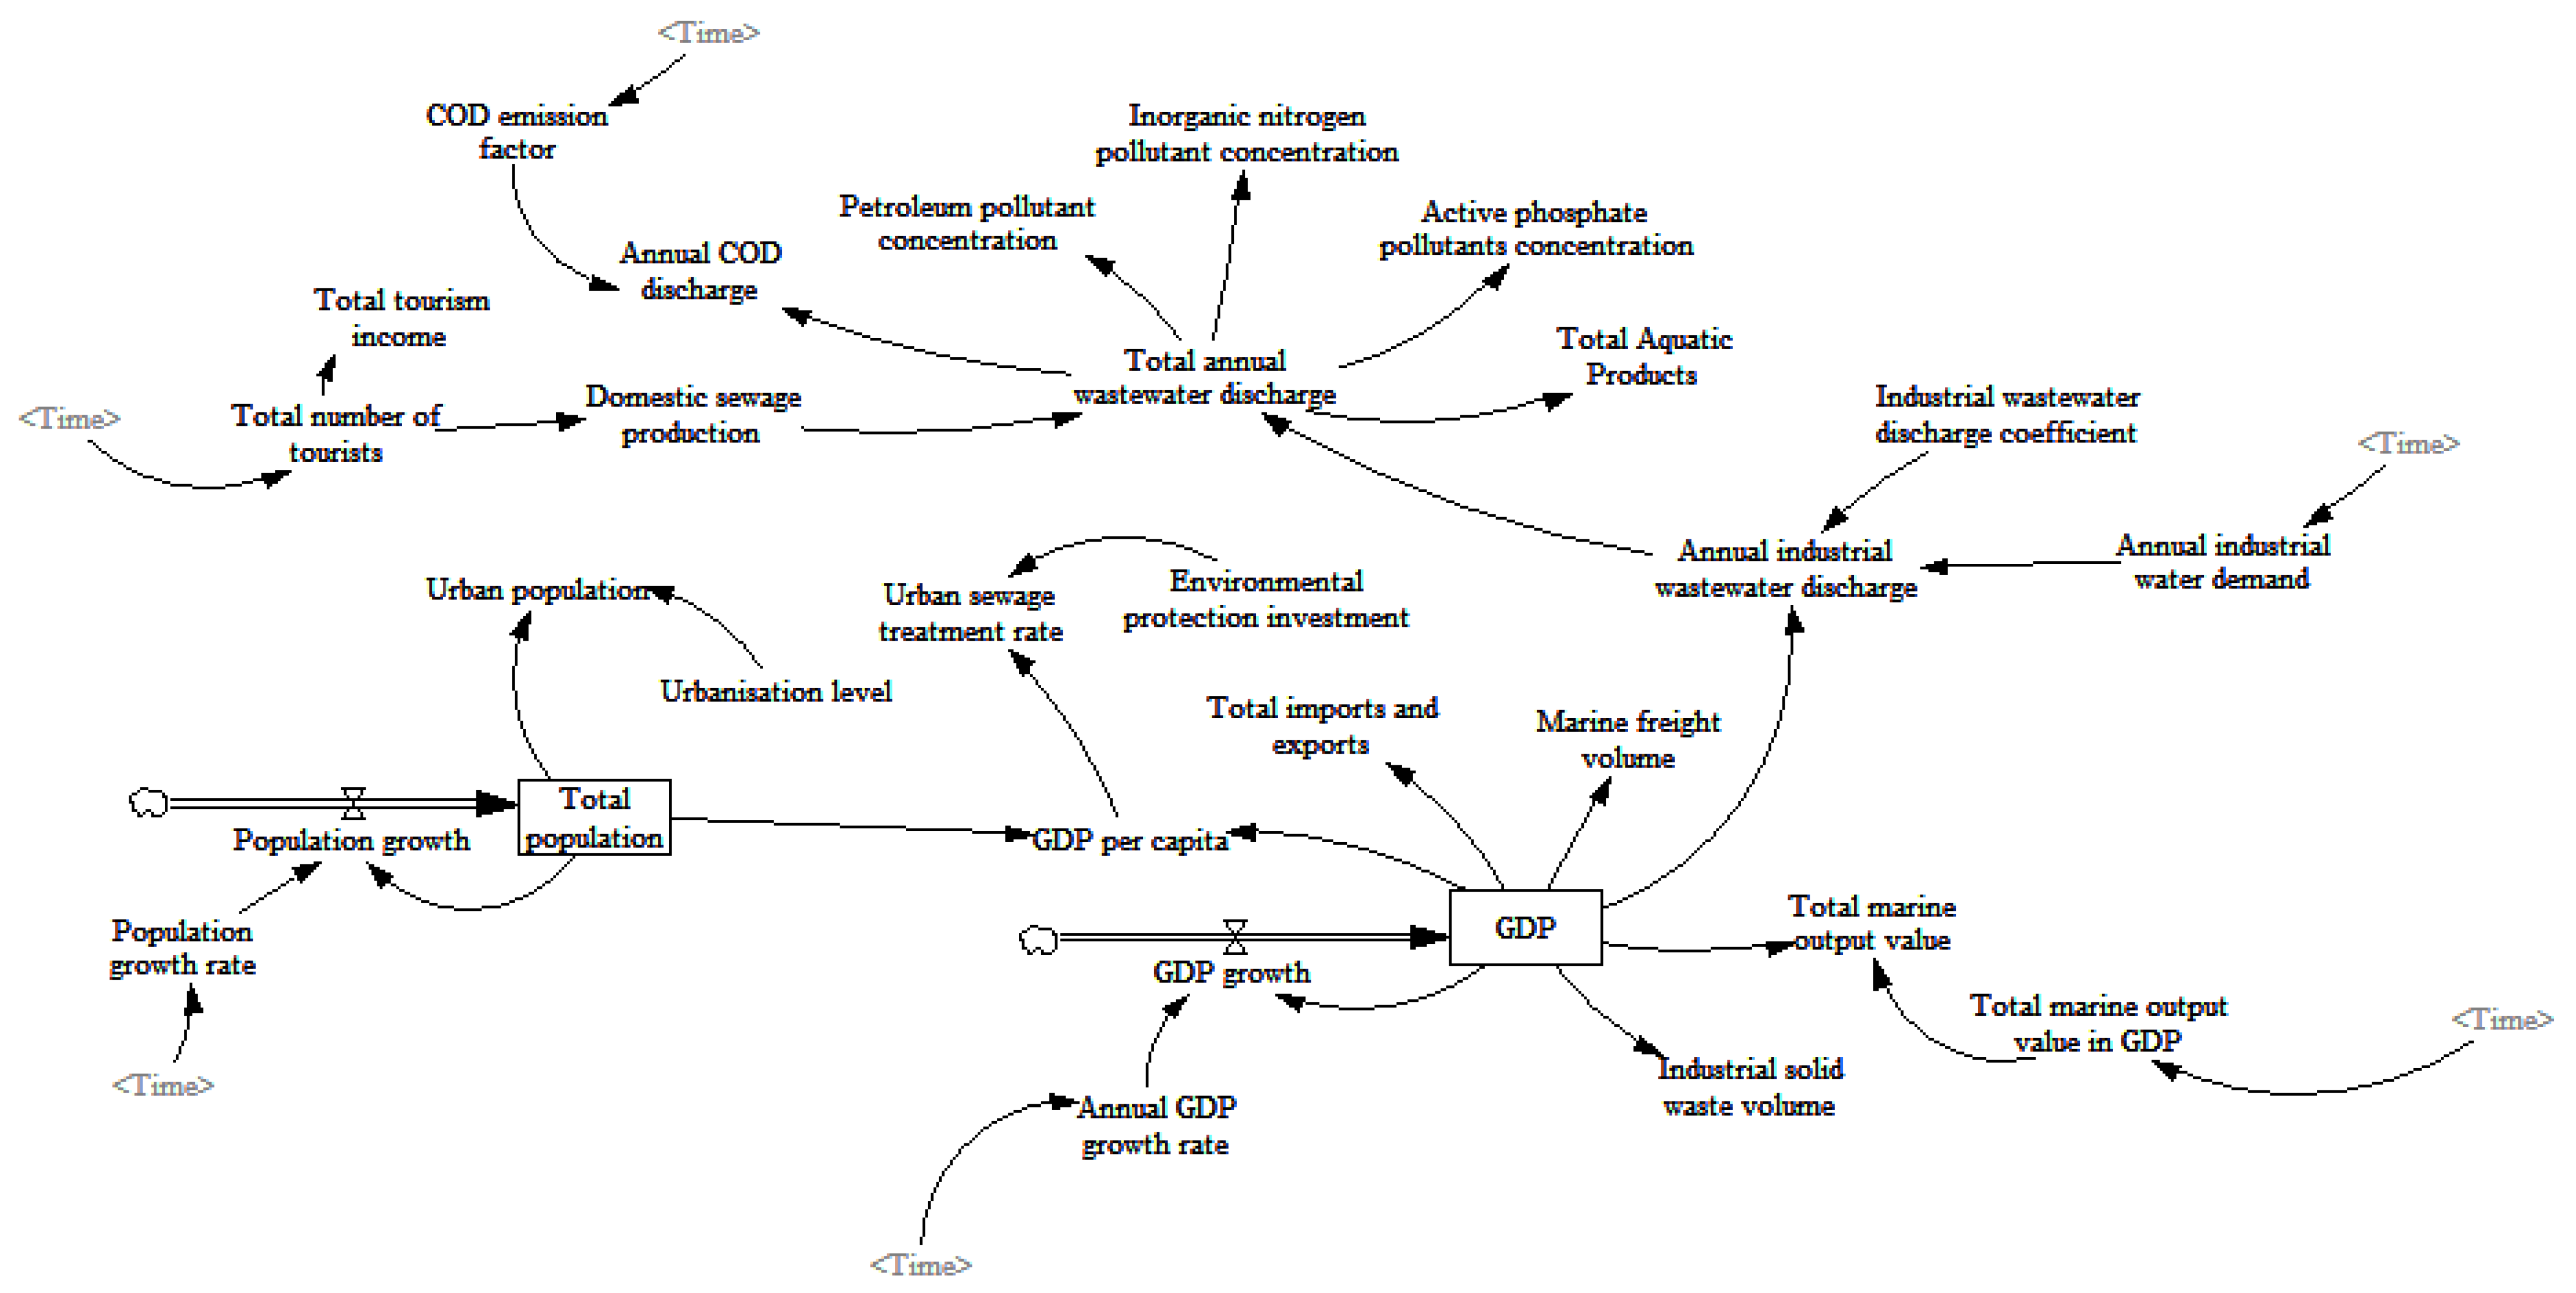
2.4. Overall Model Structure

The marine system was divided into four components: marine resources, society, economy, and eco-environment. The total population, GDP per capita, total marine output value, annual industrial wastewater discharge, and annual chemical oxygen demand (COD) discharge were chosen as the main indicators that reflect social and economic development, population growth, and wastewater discharge, which all have a greater impact on the marine ecological environment. Based on relevant literature and the indicators selected in Table 1, the annual population growth rate, the annual GDP growth rate, the percentage of total marine output value in GDP, the annual industrial water demand, and the total annual wastewater discharge were selected as decision variables [21,26,27]. The total population was determined by the annual population growth rate. Further, the annual GDP growth rate was used to determine the annual GDP growth, and the GDP per capita was determined by the total population and GDP. The percentage of total marine output value in GDP was related to the total marine output value and GDP. Moreover, the annual industrial wastewater discharge was set to equal the product of the industrial water demand and the industrial wastewater discharge coefficient [28]. Referring to the Gray-Markov model (GM) modified by Li et al. [29], the annual COD discharge was set to equal the product of the total amount of wastewater and the COD discharge concentration. According to the analysis of the relationships between the various subsystems and the feedback relationship between the variables in the system, the SD model flow chart of Ningbo MECC was established by a special SD model software, Vensim PLE (Figure 2).

3. The Weight of the Index System

Indicator weights reflect the degree to which indicators contribute to the overall system and how they differ from one another and need to be assigned quantitatively. The variation coefficient method was adopted in this study to determine the weight of the index system [30]. The basic principle of this method was to give a higher weight to the indicators that had obvious differences in the degree of change in the observed values and could distinguish the levels of the evaluation objects in the multi-index comprehensive evaluation. The weight was calculation by the following equations:
V i = σ i X ¯ i
W i = V i i = 1 n V i
where σi is the standard deviation of the i-th index, X ¯ i is the mean values of the i-th index, Vi is the variation coefficient of the i-th index, and Wi is the weight of the i-th index.
Figure 3 illustrates the calculated results of the weights of the indicators. It can be seen that there were big differences in the degree of the impact of various indicators on MECC. GDP per capita (P11) was the most influential indicator with a weight of 0.112. It was followed successively by annual COD discharge (P3, 0.094), total population (P5, 0.093), annual industrial wastewater discharge (P2, 0.092), total marine output value (P9, 0.089) and other less influential indicators. The indicators with higher weights in the index system were generally consistent with the main environmental problems and the ecological characteristics of the coastal environment.

4. Current Status of the Ningbo MECC

Since the historical data of the indicators in the evaluation index system were different in dimensions and distribution intervals, they could not be directly compared and calculated. To evaluate each index data more accurately and objectively, all variables were standardized into the range of 0–1 with the vector norm method [20], among which the positive indicators and negative indicators were standardized by Equations (3) and (4), respectively.
X ¯ ij = E ij min ( E ij ) max ( E ij ) min ( E ij )
X ¯ ij = max ( E ij ) E ij max ( E ij ) min ( E ij )
where Eij is the original value of the i-th indicator in the j-th year, max (Eij) is the maximal value of the i-th indicator within the study period, min (Eij) is the minimum value of the i-th indicator within the study, and X ¯ ij is standardized value of the i-th indicator in the j-th year.
The relative index of the support strength of various indicators in the index system was calculated by Equation (5). The weighted summation method was adopted to calculate the comprehensive evaluation index SMECC for MECC (Equation (6)) [31], so as to obtain the evaluation model of the relative MECC size.
S ij = X ij ¯ E ij ¯
S MECC = i = 1 m S ij W i
where SMECC is the size of the MECC, Sij is the relative index of the support strength of the i-th index to the MECC in the j-th year, and E ij ¯ is the relative weight of i-th indicator in the j-th year, which was calculated as follows: E ij ¯ = E ij / j = 1 m E ij .
Figure 4 shows the evaluation status of Ningbo MECC from 2012 to 2018. SMECC value was positively correlated with the MECC. The larger SMECC value was, the greater the MECC was. The Ningbo MECC from 2012 to 2018 fluctuated and reached the highest value of 0.865 in 2016. From 2016 to 2018, the overall carrying capacity showed a downward trend, which sounded an alarm for coastal management.

5. Model Validation

Prior to using the SD model, it was necessary to conduct effective tests to verify whether the model structure was consistent with the actual system. Historical tests were carried out to validate the SD model of Ningbo MECC. The historical parameters were input to the model and the simulated results were compared with historical data from 2012 to 2018 to verify their degree of correspondence. Because of the complex structure of the model and many parameters, historical verification was only conducted on the annual discharge of industrial wastewater, GDP per capita, and total population over the time period of 2012 to 2018. As shown in Table 2, the simulated values were basically consistent with the actual values, with the errors of simulated values being less than 5%. It indicated that the SD model of Ningbo MECC had high credibility and could truly reflect the evolution of the actual system.

6. Simulated Plan Design and Result Analysis

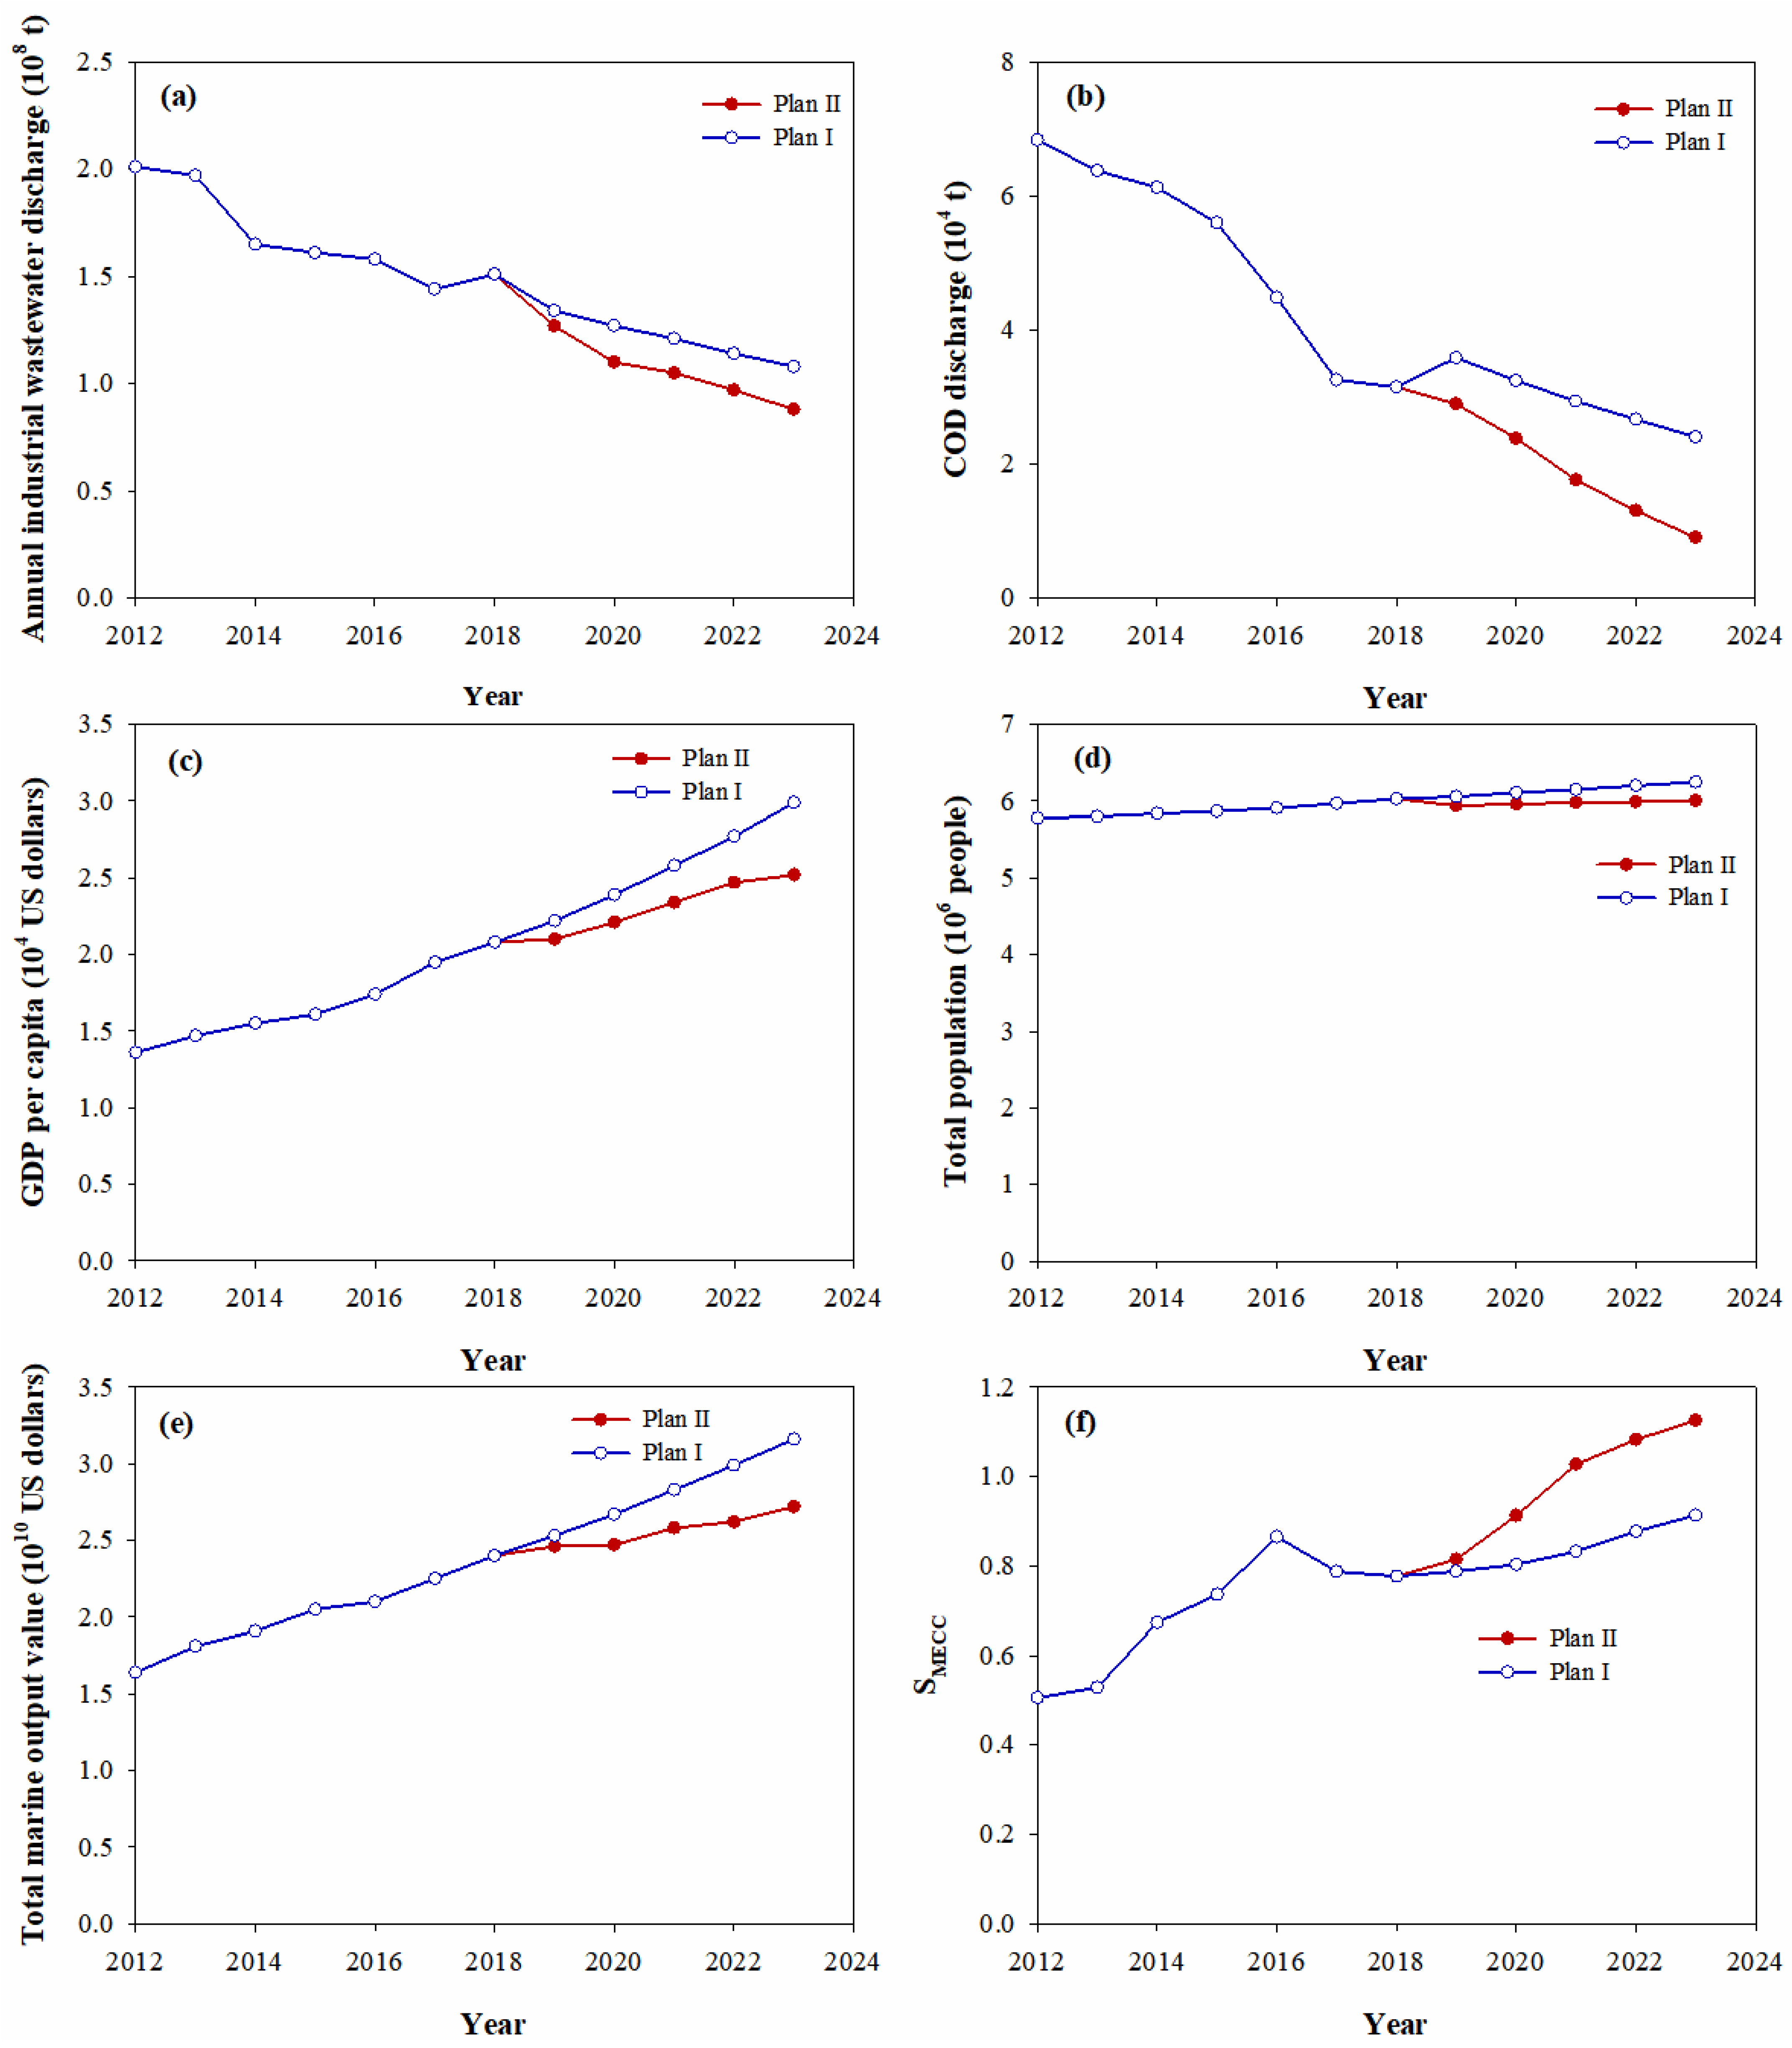
6.1. Simulated Plan Design

In this study, two plans were designed to simulate Ningbo MECC:
  • State-of-affairs-continued scenario (Plan I): The selected main indicators from 2019 to 2023 were predicted and simulated by using grey prediction model-GM (1, 1) [32,33]. The data obtained were thus brought into the SD model for calculation to obtain the main indicator prediction diagram under the state-of-affairs-continued scenario.
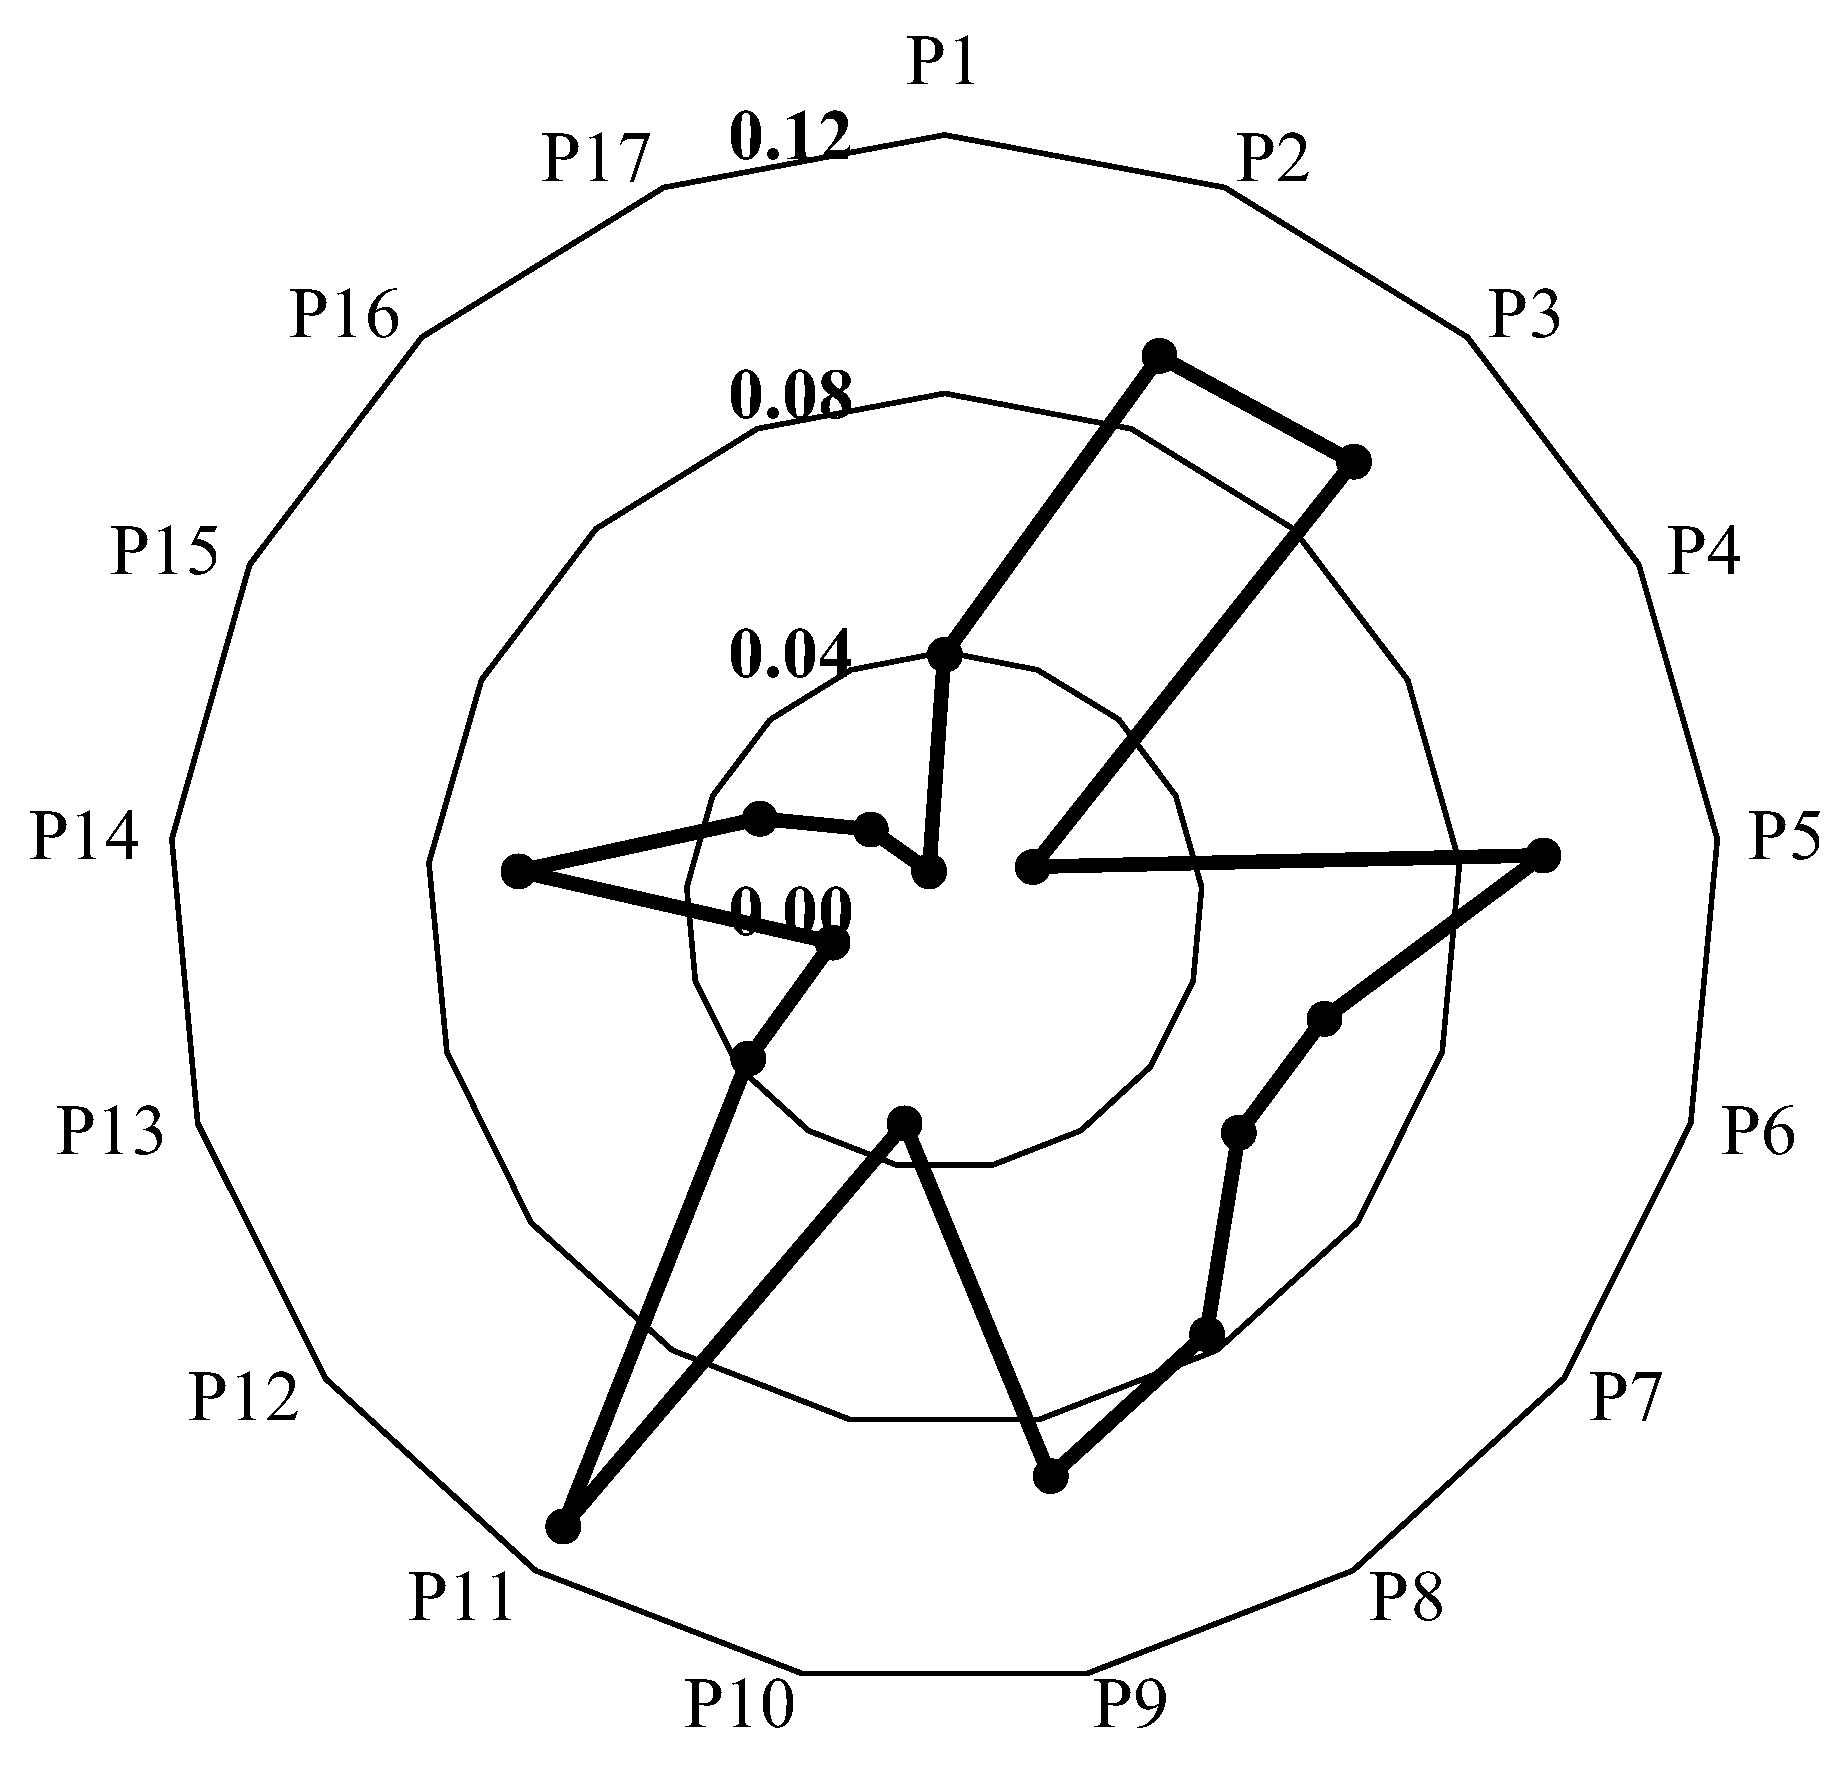
  • Coordinated-development scenario (Plan II): As the Ningbo MECC exhibited a downward trend from 2016 to 2018, the contradiction between marine ecology, economic development, and population growth needed to be reconciled for the sustainable development of marine ecology. Therefore, the relevant main indicators were adjusted to effectively improve MECC. Based on Figure 3, indicators that had great influence on MECC included GDP per capita, annual COD discharge, total population, annual industrial wastewater discharge, and total marine output value. These indicators were controlled by the following variables in the SD model: annual GDP growth rate, total annual wastewater discharge, annual industrial water demand, annual population growth rate, and percentage of total marine output value in GDP. The adjustment plan was as follows: the annual population growth rate was adjusted to 1.97%, the annual GDP growth rate was adjusted to 5.3%, the total marine output value was adjusted to 12.7% of the total GDP, the annual industrial water demand was adjusted to 5.88 × 10⁴ t, and the total annual wastewater discharge was adjusted to 8.23 × 10⁸ t. The parameter comparison of the two plans is shown in Table 3.

6.2. Model Simulated Result Analysis

According to the parameter adjustment in Table 3, the SD model of Ningbo MECC was run, and the simulated results are shown in Figure 5. It could be concluded that the change of the indictor values in the two programs were similar during the time period of 2012 to 2018. The annual industrial wastewater discharge in the two programs showed a trend of decrease over time (Figure 5a). The decrease rate of Plan II was larger than that of Plan I from 2019 to 2023, and the annual industrial wastewater discharge was only 81.4% that of Plan I by 2023. This is because of a low annual industrial water demand in Plan II. A decrease in the annual industrial waste water discharge resulted in a decrease in the annual COD discharge (Figure 5b), except that the annual COD discharge rebounded from 2018 to 2019. It reflected that the COD discharge was also expected to grow even the annual industrial waste water discharge was controlled. The GDP per capita, total population, and total marine output values in the two programs grew over time (Figure 5c–e). The growth rates in Plan II from 2019 to 2023 were lower than those in Plan I. By 2019, the GDP per capita in Plan I was only 1.06 times that of Plan II. However, it was 1.19 times that of Plan II by 2023. The growth trend of the total population was close in the two programs, and the difference in the total population between Plan I and Plan II remained within 250,000 people. The adjustment in the population growth rate of Plan II slowed population expansion to some extent.
Based on the simulated results of the indicators by the SD model, the Ningbo MECC values in the two programs were calculated by Equations (1)–(6). As shown in Figure 5f, the MECC value decreased after 2016 and it grew slowly if the state-of-affairs continued (Plan I). By 2023, the MECC value still did not exceeded that of 2016. However, due to increased efforts in coordinated development in Plan II such as the decrease in the annual industrial water demand, the population, and GDP growth rates, the MECC value significantly improved from 2019 to 2023. It was 1.23 times that of Plan I. It indicated that Plan II would be more effective to alleviate the contradictions between marine ecology and social and economic development. By comparing the trend of MECC in the two programs, the economic development goals of Ningbo should be appropriately lowered in the next five years so as to obtain a more sustainable and marine development.

7. Discussion and Suggestions

Recently, the safety of environmental resources has drawn more attention because it directly influences the social and economic development of an area and thus human survival. Marine ecosystem is an important part of environmental resources. The rapid development of a marine economy puts significant stress on marine ecology and is a frontier problem in the research field of environmental resource safety. Gao et al. [34] applied the Lotka-Volterra symbiosis model to calculate the symbiosis degree between coastal socio-economic system and marine ecosystem. They found that socio-economic development and marine damage coexisted, and the damaged marine ecology had begun to restrain the further expansion of economy and society. In order to realize sustainable marine development, researchers proposed many evaluation approaches for the study of the relationship between marine economy and marine ecology. Most of the studies focused on the coastal zone or the ecological-economic system [3,4], while few researches covered the whole coastal region or the ecological-socio-economic system. Yu et al. [35] carried out research on the comprehensive carrying capacity prediction of coastal zones based on the ecological-socio-economic system. The research objective was the coastal zone rather than the entire coastal region, which only reflected the comprehensive carrying capacity of the coastal environmental resource ecosystem to human activities. MECC is an effective tool to evaluate the ability that the coastal region can support population and social and economic development and has been proved to be suitable for the current situation in China [10,36]. Lin et al. [37] selected indictors from resource, ecology, culture, governance, economy, and society to development an evaluation system for marine eco-civilization construction in Zhejiang Province, China. They found that the performance level of coastal districts and counties in Zhejiang was increased steadily and the coordination degree however was relatively low spatially. Ningbo city is located nearby Hangzhou Bay and has an important strategic position in promoting the development of Zhejiang’s marine economy. This study developed the method to evaluate Ningbo MECC based on SD, which could systematically analyze the causal feedback relationship among population increment, economic growth, pollutant discharge, and environmental improvement. The SD software of Vensim was applied to develop an SD model of Ningbo MECC, which could successfully simulate the variation of Ningbo MECC after validation. Some parameters in the SD model were estimated, which could bring some uncertainties to the simulation results. However, SD focused on the system structure rather than the parameter estimation, reducing the impact of these uncertainties. Jin et al. [21] built an evaluation index system of MECC based on SD and carried out simulation and prediction, which realized the analysis, simulation, and prediction of the marine resources, ecology, and MECC of Huizhou city, China. It could be seen that it is feasible to apply the SD model to assess MECC.
Therefore, the study simulated the variation of MECC by adjusting the development goal and resetting the model parameters. The suggestions that could be drawn from the outcome of the model simulation for the sustainable coastal planning and management in the future are as follows:
  • Build a new pattern to protect the marine ecological system and improve the management and control system of marine space. Optimization of the marine use limit for the industries with high consumption and pollution in coastal areas is essential to reduce water demand and wastewater discharge at the source. The environmental quality of offshore marine areas should be improved by implementing accurate governance and strengthening the treatment of contaminants entering the ocean.
  • Reduce water consumption by applying water-saving technologies and improve the reuse utilization rate of water. Therefore, the discharge of wastewater and pollutant from industry can be eliminated.
  • Increase the environmental protection investment and strengthen the publicity of marine ecological environment. The government should call on the people to protect the marine ecological environment and raise awareness of marine environmental protection in the whole society.

8. Conclusions

Marine environmental resources are particularly important in Ningbo, and MECC is an important assessment tool for promoting the sustainable development of marine ecosystems. In this paper, the current situation of Ningbo MECC in 2012–2018 and the tendency of Ningbo MECC in 2019~2023 under two different development scenarios were studied comprehensively based on system dynamics. The conclusions that could be drawn from the above theoretical analysis and simulation results are as follows:
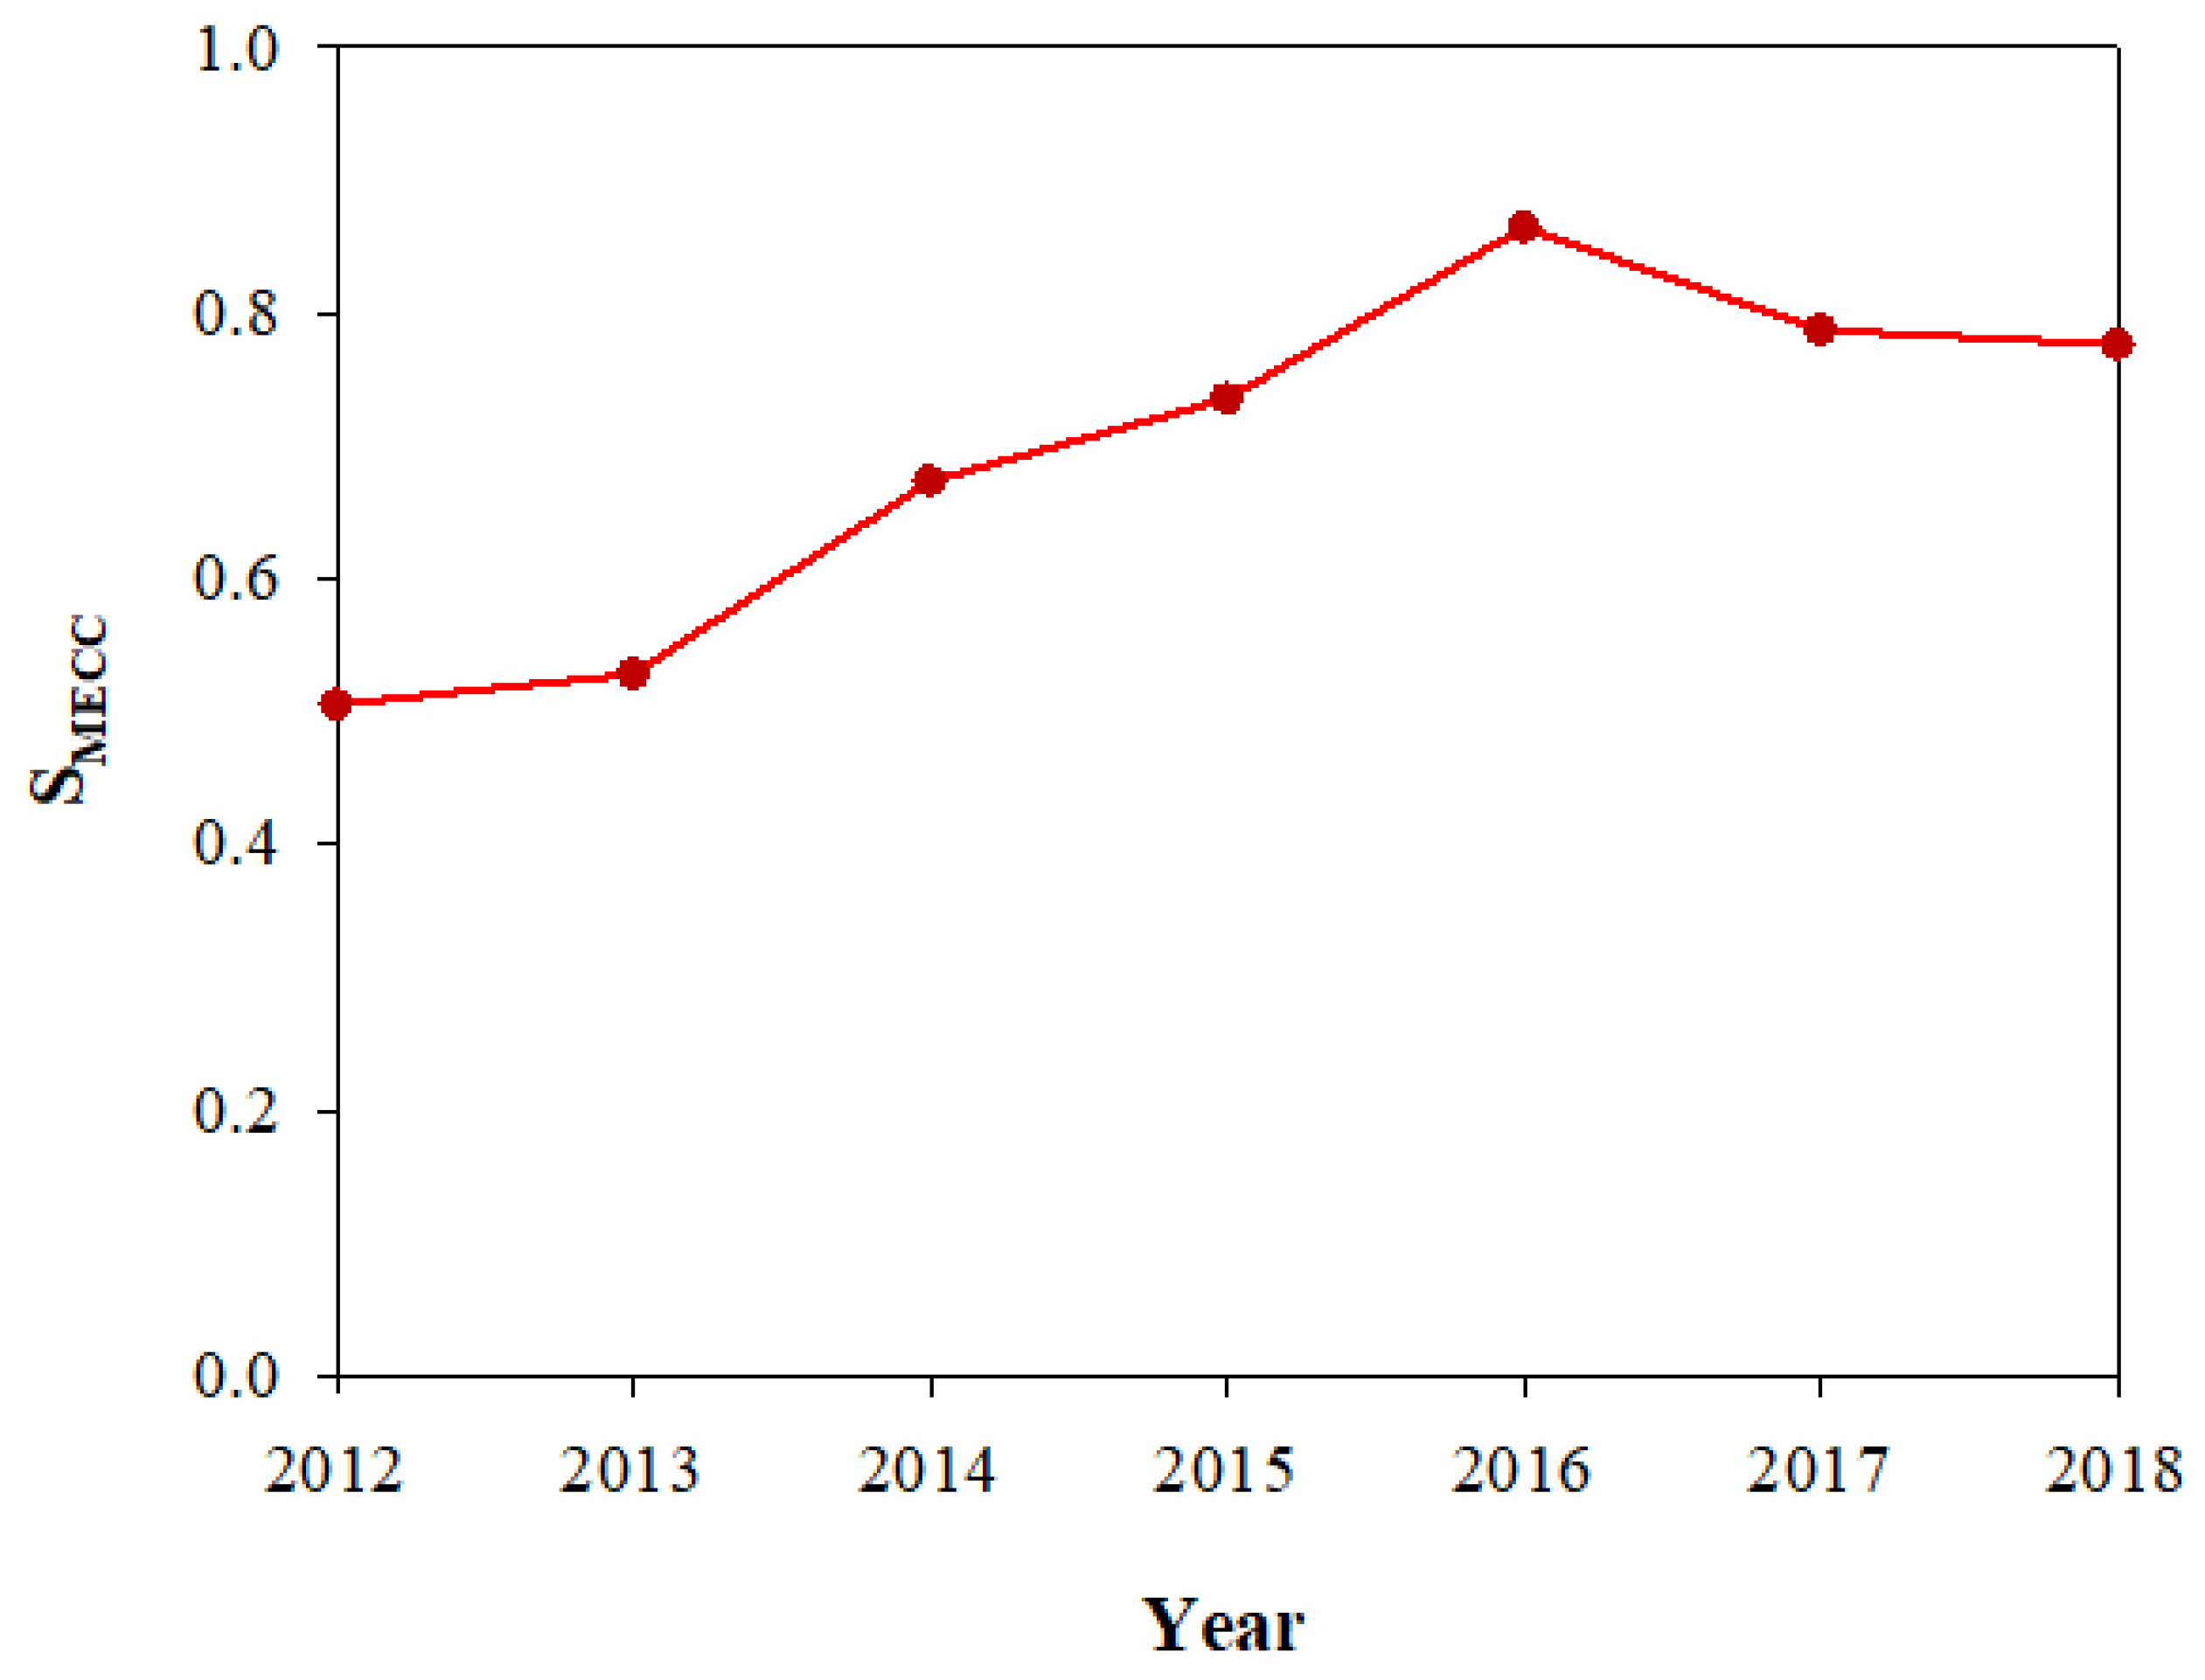
  • An assessment system incorporating 17 individual indicators was established to quantitatively assess the state of Ningbo MECC in 2012–2018. Using the variation coefficient method and the vector norm method, the support strength of Ningbo MECC was obtained by calculating the spatial state vector of each indicator. GDP per capita was the most influential indicator of MECC. The Ningbo MECC reached the highest value in 2016 and showed a downward trend from 2016 to 2018.
  • An SD model of Ningbo MECC was constructed to reflect the relationship between marine ecology, and economic development, and population growth objectively. By conducting the consistency test, it was found that the relative error between the simulated value and the historical data was within 5%, indicating that the model accurately reflected the evolution of the system and could be used for simulation.
  • By adjusting the relationship between marine ecology, economic development, and population growth as well as the decision-making parameters, the future trend of Ningbo MECC under two different situations (the state-of-affairs-continued scenario and the coordinated-development scenario) was predicted by the SD model. The results indicated that the current development pattern in Ningbo cannot meet the requirements necessary for the sustainable development and the SMECC value would be still below 1.0 by 2023. The coordinated development pattern in Ningbo can greatly improve the MECC, which may be a suitable solution for Ningbo coastal management.

Author Contributions

Conceptualization, H.Y. and Y.M.; writing—original draft preparation, H.Y. and S.C.; writing—review and editing, Y.M.; supervision, Y.M.; funding acquisition, H.Y. and Y.M. All authors have read and agreed to the published version of the manuscript.

Funding

This research was funded by Program for the Philosophy and Social Research of Zhejiang Province (20NDJC20Z), Natural Science Foundation of Zhejiang Province (LQ20E080015), Top Young Talents of the Ten Thousand Talents Program of Zhejiang Province (ZJWR0308003), and Zhejiang Shuren University Basic Scientific Research Special Funds (2021XZ016).

Institutional Review Board Statement

Not applicable.

Informed Consent Statement

Not applicable.

Data Availability Statement

Not applicable.

Conflicts of Interest

The authors declare no conflict of interest.

References

  1. Halpern, B.S.; Walbridge, S.; Selkoe, K.A.; Kappel, C.V.; Micheli, F.; D’Agrosa, C.; Bruno, J.F.; Casey, K.S.; Ebert, C.; Fox, H.E. A global map of human impact on marine ecosystems. Science 2008, 319, 948–952. [Google Scholar] [CrossRef] [PubMed] [Green Version]
  2. Song, F.; Yang, X.; Liu, T.; Xue, Q. Evaluation of urban ecological carrying capacity based on state-space method. IOP Conf. Ser. Earth Environ. Sci. 2019, 237, 032106. [Google Scholar] [CrossRef]
  3. García-Ayllón, S. New Strategies to improve co-management in enclosed coastal seas and wetlands subjected to complex environments: Socio-economic analysis applied to an international recovery success case study after an environmental crisis. Sustainability 2019, 11, 1039. [Google Scholar] [CrossRef] [Green Version]
  4. Lin, Y.Q. Coupling analysis of marine ecology and economy: Case study of Shanghai, China. Ocean Coast. Manag. 2020, 195, 105278. [Google Scholar] [CrossRef]
  5. Kessler, J.J. Usefulness of the human carrying capacity concept in assessing ecological sustainability of land-use in semi-arid regions. Agric. Ecosyst. Environ. 1994, 48, 273–284. [Google Scholar] [CrossRef]
  6. Gong, L.; Jin, C. Fuzzy comprehensive evaluation for carrying capacity of regional water resources. Water Resour. Manag. 2009, 23, 2505–2513. [Google Scholar] [CrossRef]
  7. Yang, J.; Lei, K.; Khu, S.; Meng, W.; Qiao, F. Assessment of water environmental carrying capacity for sustainable development using a coupled system dynamics approach applied to the Tieling of the Liao River Basin, China. Environ. Earth Sci. 2015, 73, 5173–5183. [Google Scholar] [CrossRef]
  8. Yang, Z.; Song, J.; Cheng, D.; Xia, J.; Li, Q.; Ahamad, M.I. Comprehensive evaluation and scenario simulation for the water resources carrying capacity in Xi’an city, China. J. Environ. Manag. 2019, 230, 221–233. [Google Scholar] [CrossRef]
  9. Graymore, M.; Sipe, N.G.; Rickson, R.E. Sustaining human carrying capacity: A tool for regional sustainablity assessment. Ecol. Econ. 2010, 69, 459–468. [Google Scholar] [CrossRef]
  10. Han, Y.; Wei, F.; Ye, G.; Yang, S.; Ma, P.; Hu, W. A study on evaluation the marine carrying capacity in Guangxi Province, China. Mar. Policy 2018, 91, 66–74. [Google Scholar] [CrossRef]
  11. Kang, M.J.; Luan, W.X. Marine environmental carrying capacity monitoring system: A monitoring framework to achieve marine environment adaptive management. Adv. Mat. Res. 2013, 726–731, 1504–1507. [Google Scholar] [CrossRef]
  12. Alemi-Ardakani, M.; Milani, A.S.; Yannacopoulos, S.; Shokouhi, G. On the effect of subjective, objective and combinative weighting in multiple criteria decision making: A case study on impact optimization of composites. Expert Syst. Appl. 2016, 46, 426–438. [Google Scholar] [CrossRef]
  13. Tan, Q.; Huang, G.H.; Cai, Y.P. Multi-source multi-sector sustainable water supply under multiple uncertainties: An inexact fuzzy-stochastic quadratic programming. Water Resour. Manag. 2013, 27, 451–473. [Google Scholar] [CrossRef]
  14. Cheng, C.Z.; Lin, Z.S.; Wang, H. The simulation of human maximum sunstainable marine footprint. Acta Ecol. Sinica 2008, 28, 656–660. (In Chinese) [Google Scholar]
  15. Wang, S.; Yang, F.L.; Ling, X.; Jing, D. Multi-scale analysis of the water resources carrying capacity of the Liaohe Basin based on ecological footprints. J. Clean. Prod. 2013, 53, 158–166. [Google Scholar] [CrossRef]
  16. Liu, R.Z.; Borthwick, A.G. Measurement and assessment of carrying capacity of the environment in Ningbo, China. J. Environ. Manag. 2011, 92, 2047–2053. [Google Scholar] [CrossRef]
  17. Davies, E.G.R.; Simonovic, S.P. Global water resources modeling with an integrated model of the social–economic–environmental system. Adv. Water Resour. 2011, 34, 684–700. [Google Scholar] [CrossRef]
  18. Cheng, L. System dynamic model of Suzhou water resources carrying capacity and its application. Water Sci. Eng. 2010, 3, 144–155. [Google Scholar]
  19. Zeng, C.; Liang, C.; Tong, X. Control research of carrying capacity on water environment of Baita River basin in Shenyang based on SD model. J. Shenyang Agric. Univ. 2013, 2, 195–201. (In Chinese) [Google Scholar]
  20. Zhang, Z.; Lu, W.X.; Zhao, Y.; Song, W.B. Development tendency analysis and evaluation of the water ecological carrying in the Siping area of Jilin Province in China based on system dynamics and analytic hierarchy process. Ecol. Modell. 2014, 275, 9–21. [Google Scholar] [CrossRef]
  21. Jin, C.; Zhou, J.F.; Li, Y.C.; Chen, W. Research on marine ecological carrying capacity based on system dynamics: A case study of Huizhou city. Mar. Environ. Sci. 2017, 36, 537–543. (In Chinese) [Google Scholar]
  22. Zhang, P.; Zhang, H.R.; Yang, H.; Li, J. Research on marine ecological carrying capacity of indicator: A case in Nantong. Mar. Environ. Sci. 2017, 36, 143–148. (In Chinese) [Google Scholar]
  23. Jackson, J.B.; Kirby, M.X.; Berger, W.H.; Bjorndal, K.A.; Botsford, L.W.; Bourque, B.J.; Bradbury, R.H.; Cooke, R.; Erlandson, J.; Estes, J.A.; et al. Historical overfishing and the recent collapse of coastal ecosystems. Science 2001, 293, 629–637. [Google Scholar] [CrossRef] [PubMed] [Green Version]
  24. Lane, M. The carrying capacity imperative: Assessing regional carrying capacity methodologies for sustainable land-use planning. Land Use Policy 2010, 27, 1038–1045. [Google Scholar] [CrossRef] [Green Version]
  25. Ma, P.; Ye, G.; Peng, X.; Liu, J.; Qi, J.; Jia, S. Development of an index system for evaluation of ecological carrying capacity of marine ecosystems. Ocean Coast. Manag. 2017, 144, 23–30. [Google Scholar] [CrossRef]
  26. Miao, L.; Wang, Y.; Zhang, Y.; Wang, Q. Assessing index system for bearing capacity of marine ecological environment. Mar. Environ. Sci. 2006, 35, 75–77. (In Chinese) [Google Scholar]
  27. Di, Q.; Zhang, J.; Wu, J. Assessment of marine ecological carrying capacity in Liaoning Province based on the ecosystem health. J. Nat. Resour. 2014, 29, 256–264. (In Chinese) [Google Scholar]
  28. Li, L.; Pan, H.L. Prediction of industrial wastewater discharge amount based on multivariate nonlinear regression. J. Jiangnan Univ. (Nat. Sci. Ed.) 2011, 10, 309–313. (In Chinese) [Google Scholar]
  29. Li, X.; Sun, B.; Si, Z. Forecasting of urban wastewater discharge based on Gray-Markov Model. Chin. J. Environ. Eng. 2013, 7, 237–241. (In Chinese) [Google Scholar]
  30. Kobayashi, K.; Salam, M.U. Comparing simulated and measured values using mean deviation and its components. Agron. J. 2000, 92, 345–352. [Google Scholar] [CrossRef]
  31. Shen, Z.; Zhu, Y.; Jia, C.; Chen, L. Calculation method of water environment carrying capacity based on dynamics simulation-recurion algorithm and vector norm method. Water Resour. Prot. 2015, 31, 32–39. (In Chinese) [Google Scholar]
  32. Guo, J.; Ren, J.; Huang, X.; He, G.; Shi, Y. The dynamic evolution of the ecological footprint and ecological capacity of Qinghai Province. Sustainability 2020, 12, 3065. [Google Scholar] [CrossRef] [Green Version]
  33. Peng, B.; Wang, Y.; Elahi, E.; Guo, W. Evaluation and prediction of the ecological footprint and ecological carrying capacity for Yangtze River urban agglomeration based on the grey model. Int. J. Environ. Res. Public Health 2018, 15, 2543. [Google Scholar] [CrossRef] [PubMed] [Green Version]
  34. Gao, L.; Ning, J.; Bao, W.; Yan, A.; Ying, Q. A study on the marine ecological security assessment of Guangdong-Hong Kong-Macao Great Bay Area. Mar. Pollut. Bull. 2022, 176, 113416. [Google Scholar] [CrossRef]
  35. Yu, H.; Tao, L.; Bai, J.; Peng, S. Research on comprehensive carrying capacity prediction of Binhai New Area based on system dynamics. China Pop. Resour. Environ. 2012, 22, 297–300. (In Chinese) [Google Scholar]
  36. Song, X.; Kong, F.; Zhang, C. Assessment of water resources carrying capacity in Tianjin city of China. Water Resour. Manag. 2011, 25, 857–873. [Google Scholar] [CrossRef]
  37. Lin, Y.; Yang, Y.; Li, P.; Feng, C.; Ding, J.; Zhou, J.; Jiang, Q.; Ye, G. Spatial-temporal evaluation of marine ecological civilization of Zhejiang Province, China. Mar. Policy 2022, 135, 104835. [Google Scholar] [CrossRef]
Figure 1. Map of the study area location in China.
Sustainability 14 04568 g001
Figure 2. Overall SD flow chart of Ningbo MECC.
Sustainability 14 04568 g002
Figure 3. The weight of each indicator.
Sustainability 14 04568 g003
Figure 4. Current status evaluation of Ningbo MECC.
Sustainability 14 04568 g004
Figure 5. Changes in various indicators and MECC under the two development models. (a) Annual industrial wastewater discharge; (b) COD discharge; (c) GDP per capita; (d) total population; (e) total marine output value; and (f) SMECC.
Sustainability 14 04568 g005
Table 1. The index of Ningbo MECC from 2012 to 2018.
Indicator2012201320142015201620172018Effect
(P1) Total annual wastewater discharge (108 t)5.635.626.176.527.317.537.84Negative
(P2) Annual industrial wastewater discharge (108 t)2.011.971.651.611.581.441.51Negative
(P3) Annual COD discharge (104 t)6.846.386.135.603.493.263.15Negative
(P4) Industrial solid waste volume (107 t)1.251.341.201.151.161.211.25Negative
(P5) Total population (106 person)5.785.805.845.875.915.976.03Negative
(P6) Inorganic nitrogen pollutant concentration (mg/L)1.812.410.840.911.341.922.34Negative
(P7) Active phosphate pollutant concentration (mg/L)0.0540.05850.02850.03970.0490.0610.083Negative
(P8) Petroleum pollutant concentration (mg/L)0.0780.0370.0170.0190.0290.040.051Negative
(P9) Total marine output value (1010 US dollars)1.641.811.912.052.102.252.40Negative
(P10) Total imports and exports (1010 US dollars)9.6610.0310.4710.049.4911.2213.01Negative
(P11) GDP per capita (104 US dollars)1.361.471.551.611.741.952.08Negative
(P12) Total tourism income (1010 US dollars)1.281.421.601.942.272.693.15Positive
(P13) Environmental protection investment (109 US dollars)0.380.200.580.690.670.290.68Positive
(P14) Total aquatic products (104 t)100.4101.3102.6103.3106.1106.6107.4Positive
(P15) Marine freight volume (108 t)1.411.541.611.681.822.112.63Positive
(P16) Proportion of the marine areas in categories one and two (%)18.1416.9216.1215.214.313.813.6Positive
(P17) Urbanization level (%)68.269.970.671.171.972.472.9Negative
Table 2. Historical test results of the SD model of Ningbo MECC.
YearTotal Marine Output Value
(1010 US Dollars)
Total Population
(106 People)
Annual Industrial Wastewater Discharge (108 t)
Actual ValueSimulated ValueError (%)Actual ValueSimulated ValueError (%)Actual ValueSimulated ValueError (%)
20121.641.714.25.785.841.12.011.94−3.5
20131.811.863.25.805.850.81.971.88−4.4
20141.912.005.15.845.860.41.651.61−3.0
20152.052.123.85.875.890.31.611.54−4.2
20162.102.162.85.915.89−0.21.601.53−4.1
20172.252.312.35.975.91−0.91.441.504.3
20182.412.504.16.035.93−1.61.511.563.6
Table 3. Prediction plan parameter adjustment.
Indicator20202023
Plan IPlan IIPlan IPlan II
Annual population growth rate (%)2.872.272.761.97
Annual GDP growth rate (%)6.96.16.55.3
Percentage of total marine output value in GDP (%)15.813.715.612.7
Annual industrial water demand (104 t)6.115.856.275.88
Total annual wastewater discharge (108 t)8.557.0010.438.23
Publisher’s Note: MDPI stays neutral with regard to jurisdictional claims in published maps and institutional affiliations.

