Abstract
A study was conducted to assess the effects of organic amendments on soil aggregates, carbon (C) sequestration, and energy use efficiency (EUE) during five consecutive Boro and Transplanted Aman rice seasons in Bangladesh during 2018–2020. Five treatments (viz., control (only inorganic fertilizers), cow dung (CD), vermicompost (VC), rice straw (RS), and poultry manure (PM)) were used. The organic materials were applied at 2 t C ha−1 season−1 to all the plots, except in the control treatment. Inorganic fertilizers were applied in all treatments in both seasons following integrated nutrient management (INM). The data reveal that PM was found to be more efficient at increasing the water-stable soil aggregates (WSA), followed by the RS, CD, and VC. The WSA in smaller-sized soil aggregates were found to be higher than those in larger-sized soil aggregates. VC was found to be the most effective in terms of C sequestration (29%), followed by PM (26%), CD (22%), and RS (20%). The highest EUE was attributed to the control treatment (9.77), followed by the CD (8.67), VC (8.04), RS (2.10), and PM (1.18), which showed energy wastage in the organic treatments. The system productivity (SP) followed the opposite trend of the EUE. The INM is a better approach to improve the soil health, the C sequestration, and the SP, but it appeared as an energy-inefficient strategy, which suggests that a balanced application of organic and inorganic nutrients is needed in order to achieve yield sustainability and EUE.
1. Introduction
Soil aggregates and carbon (C) sequestration play vital roles in conserving soil, maintaining soil health, and sustaining crop productivity [1,2]. Soil health degradation is the outcome of the intensive cultivation of the land with high-yielding crop varieties, and of the application of mostly inorganic fertilizers, with small quantities of organic fertilizers [2,3,4]. Furthermore, the climatic conditions in the tropical and subtropical regions are very much conducive to the rapid microbial decomposition of soil organic matter (SOM). For the global existence and the continued progress of modern civilization, the protection of the soil from degradation is an imperative task. An estimate of Rashid et al. [4] discloses that about 30% of the world’s cultivated soil has degraded, which is a serious threat to agriculture. The SOM plays a role as a life support for degraded soil by revitalizing it and by maintaining the productivity of the soil over generations, as was emphasized in the theme of World Soil Day 2020: “Keep soil alive, protect soil biodiversity”. The addition of C-enriched materials, such as crop residues, rice straw (RS), cow dung (CD), poultry manure (PM), vermicompost (VC), farmyard manure, composts, etc., improves the soil’s physical, chemical, physico-chemical, and biological characteristics, and enhances the C accumulation in the soil [2,5]. It was also found that a combined application of organic and inorganic nutrients increased both the water-stable soil aggregates (WSA) and the crop yields [3,6,7]. The application of organic carbon (OC) through RS, CD, and PM accounted for 10, 30, and 49% of the C sequestration, respectively [8], and contributed to soil aggregation and fertility improvement [2,9].
On the other hand, it is a great challenge to achieve a synergy between energy use efficiency (EUE) and soil health improvement through the combined application of organic and inorganic fertilizers. Paddy is one of the highest-energy-demanding crops in the world [10,11]. Globally, in 2019, the extent of the paddy cultivation reached 162.06 million hectares (Mha) and it produced 755.47 million tons (Mt) of paddy [12]. The areas under paddy production in 2019 in Bangladesh, India, China, Thailand, and Vietnam were 11.51, 43.78, 29.96, 9.71, and 7.46 Mha, respectively, while the paddy production was 54.58, 177.64, 211.46, 28.35, and 43.44 Mt, respectively [12]. The energy inputs (EI) in paddy production are huge and are comprised of inorganic and organic fertilizers, irrigation, tillage, pesticides, seeds, labor, etc., while higher energy outputs (EO) are expected to achieve higher EUE [11]. Better management of the EI, the soils, and the crops may help to reduce greenhouse gas (GHG) emissions and increase the EUE [13]. Balanced fertilization, by using nutrients from organic and inorganic fertilizers, might assure agricultural and environmental sustainability, as well as higher energy productivity (EP) and EUE [14].
The OM content in the soil of Bangladesh is mainly low and it ranges from 1.0–1.7% [15]. Agricultural production is solely dependent on inorganic fertilizers, in which nitrogenous fertilizers, especially urea alone, contributes to 55% of the total inorganic fertilizers [16]. An awareness of the benefits of applying organic fertilizers along with inorganic fertilizers in order to keep the soil alive and productive has recently developed among the farmers. In most of the cases, farmers implement the integrated nutrient management (INM) approach rather than integrated plant nutrition systems (IPNS). The basic difference between the two approaches is that organic fertilizers are applied in addition to the recommended doses of inorganic fertilizers in the former, while, in the latter, the recommended quantities of nutrients are provided by using both organic and inorganic sources [15]. However, it was revealed that the energy inputs are higher in INM compared with IPNS, which may be attributed to the lower EUE in the INM approach. In rice production, the quantification of the net energy (NE), the EP, the specific energy (SE), and the EUE may help with the identification of suitable management practices for agricultural sustainability and for the promotion of clean development mechanisms [17]. However, such studies have, so far, been scanty in Bangladesh. It was hypothesized that the combined application of organic and inorganic fertilizers in rice cultivation may help to reduce the tradeoff between the soil health improvement and the EUE. Therefore, the present study was undertaken to determine the effects of organic amendments on water-soluble soil aggregates (WSA) in order to ascertain the efficiency of organic materials on the C sequestration in the soil, and on the EUE, in wetland paddy cultivation in Bangladesh. The findings of the study will help to identify a suitable fertilizer management option, and the formulation of appropriate policy guidelines for achieving an energy-efficient, climate-smart, and sustainable production environment.
2. Materials and Methods
2.1. Characteristics of the Study Area
The study was conducted in the research field of the Department of Soil Science, Bangabandhu Sheikh Mujibur Rahman Agricultural University (BSMRAU), Gazipur, Bangladesh. The area is located at 24.09° N latitude and 90.25° E longitude, with an elevation of 8.2 m. Rice was grown from January 2018 to May 2020, which included five consecutive paddy growing seasons of Boro and Transplanted Aman rice (T. Aman). Boro rice is grown during the rabi (dry) season (from January to May) under complete irrigation. T. Aman rice is grown in the monsoon period, from July to November, under rain-fed conditions. However, supplementary irrigation is needed during periods of insufficient rainfall. The soil of the study site is classified as Inceptisol, according to USDA soil taxonomy, and it is locally known as Salna series under Shallow Red Brown Terrace Soil [18]). This study site is under the agro-ecological zone of Madhupur Tract [18]. The site contains silty clay loam soil within 50 cm of the surface, which is acidic in nature. The experimental area experiences a subtropical monsoon climate, which is characterized by wide seasonal variations in the rainfall, temperature, and humidity.
2.2. Treatments and Design of the Experiment
Five treatments (viz. control (only inorganic fertilizers), rice straw (RS), cow dung (CD), poultry manure (PM), and vermicompost (VC)) were tested during five consecutive cropping seasons (three Boro and two T. Aman periods) in a randomized complete block design with four replications. Two rice varieties, which were developed by the Bangladesh Rice Research Institute (BRRI) (namely, BRRI dhan28 and BRRI dhan49), were tested. BRRI dhan28 is a Boro rice, while BRRI49 is a T. Aman rice variety.
The plot size was 4 m × 5 m, and the plots were separated into 0.5 m areas. The organic materials were applied to the corresponding plots (experimental units) at the rate of 2 t C ha−1 during each crop season, following the INM concept. Well-decomposed CD, VC, RS, and PM were applied to the assigned plots one week prior to the final land preparation. The nutrient contents of the organic materials that were applied are shown in Table 1.

Table 1.
Nutrient concentrations in the different organic materials used in the experiment.
Inorganic fertilizer elements on nitrogen (N), phosphorus (P), potassium (K), sulfur (S), and zinc (Zn) were applied at the rates of 115, 47, 93, 16, and 2 kg ha−1, respectively, for the Boro rice. In the case of the T. Aman rice, N, P, and K only were applied at the rates of 75, 15, and 55 kg ha−1, respectively, for every plot, including the control. Phosphorous, potassium, sulfur, and zinc were applied at the final land preparation by using triple super phosphate, muriate of potash (MoP), gypsum, and zinc sulphate (monohydrate), respectively. Nitrogen (N) was applied by using urea in three equal splits. One-third of the urea was applied at the time of the final land preparation, and the remaining two-thirds was top-dressed at active tillering and at the panicle initiation stages. The total amounts of nutrients, and especially N, P, and K, that were added to the experimental plots from organic and inorganic sources during both seasons are provided in Table 2. The first crop of the experiment was in the Boro season, and the crop was established by transplanting thirty-five-day-old rice seedlings on 3 January 2018.
Table 2.
Total amounts of N, P, and K added to experimental plots using organic and inorganic sources.
2.3. Soil Sampling and Analysis
Replicated soil samples from all the treatments were collected by using core samplers at the harvest of Boro rice in April 2020 from the plough depth layer (0–15 cm). The weight of the empty core, the fresh weight of the soil, including the core, and a small part of the soil from each of the cores was recorded. Then, the abovementioned small amount of soil sample was oven dried at 105 °C for 24 h. The dry mass of the soil of each core was then calculated by using the abovementioned information. The volume of the core sampler was 98.17 cm3, and it had a radius of 2.5 cm, and a height of 5 cm. The bulk density was calculated by dividing the dry soil mass by the total volume of the soil core, which included the volume of the soil plus the pore space [19]. The study soil was silty clay loam, and it did not contain any gravels or stones. Bulk soil samples were also collected from the same depths, which were air dried and divided into two parts. One part of the air-dried soil sample was ground by a grinding mill and was sieved by a 2 mm-sized sieve to determine the organic C by the wet oxidation method [20], while the other part was not ground by mill but was benignly broken into a smaller size by using a hand-driven wooden mortar and pestle, and was divided into four different-sized soil aggregates (2, 1, 0.5, and 0.25 mm) by sieving. The WSA for each sized soil aggregate were determined by the wet-sieving method, as described by Patton et al. [21].
The carbon stock was calculated by using Equation (1) [8]. The carbon sequestration efficiency was calculated by using Equation (2):
where Bd, Sd, Co, Cc, and Cap denote the soil bulk density, the soil depth, the C stock in the organic amended plot, the C stock in the control plot, and the amount of C applied during the five consecutive seasons (10 tons), respectively.
2.4. Energy Calculation
The energy inputs and outputs under different treatments were calculated by using the energy equivalents that are provided in Table 3. The EI, EO, NE, EUE, EP, and SE were calculated by using Equations (3)–(8), respectively [17], while the SP was calculated by using Equation (9) [11]:
where I1, I2, and Ii indicate different inputs, and SP, GY, SY, Gp, and Sp indicate the system productivity, the grain yield, the straw yield, the grain price, and the straw price, respectively. The prices of grain and straw were considered as 15 and 0.5 Taka kg−1, respectively. All the energy-related parameters were calculated individually for the Boro and T. Aman, and they are presented as the mean values.
Table 3.
Inputs and outputs used in the present study and their energy equivalents (EEs).
2.5. Statistical Data Analysis
The data that were collected on the different parameters were subjected to statistical analysis by using a one-way ANOVA, as described by Gomez and Gomez [29]. The Statistix 10 software program was used to perform the statistical analysis. The treatment differences were determined by using the Fisher’s least significant difference (LSD) test at the 5% level of significance. The Microsoft Excel program was used to draw the box and whisker charts, and the other figures, in order to present the different study parameters.
3. Results
3.1. Soil Organic Carbon and Water-Stable Soil Aggregates under Different Treatments
The organic carbon content in the initial soil was found to be very low (5.0–6.1 g kg−1), while, after five paddy seasons, it increased significantly under different organic amendments, over the control (Figure 1). After the harvesting of the five rice paddies, the OC content in the soil of the control treatment was also increased to 6.3 g kg−1, while, in the CD, VC, RS, and PM treatments, the values were 8.7, 8.5, 8.6, and 8.3 g kg−1, respectively, and the status changed from very low to low (8.3–8.7 g kg−1), as is shown in Figure 1. The rates of the C increments in the soils were found to be the highest in the PM treatment (50%), followed by the RS (49%), cow dung (48%), VC (38%), and control (27%) treatments.
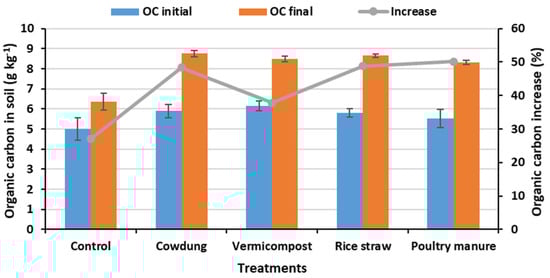
Figure 1.
Soil OC contents and its increments through organic amendments after five consecutive paddy seasons.
The water-stable soil aggregates of various-sized soil aggregates in all the treatments greatly increased over the initial condition (Figure 2). With the increase in the size from 0.25 mm to 0.5, 1.0, and 2.0 mm, the number of WSA decreased in all the treatments, including in the control (Figure 2a–d). Soil aggregates of a 0.25 mm size produced the highest number of WSA in all the treatments. At the initial condition, the WSA of 0.25 mm-sized soil aggregates were 123.24, 114.70, 133.29, 163.87, and 151.04 g kg−1 in the control, CD, VC, RS, and PM treatments, respectively, while, after five rice seasons, the values increased to 210.04, 351.50, 325.09, 325.67, and 333.68 g kg−1, respectively. In the case of 2 mm-sized soil aggregates, the WSA in the initial soil were 21.21, 37.87, 19.81, 22.90, and 29.15 g kg−1 in the control, CD, VC, RS, and PM treatments, respectively, while, after five seasons, the values increased to 66.03, 129.58, 140.28, 100.03, and 136.21 g kg−1, respectively. The same trend was found at the initial condition and after five consecutive seasons for 1 mm- and 0.5 mm-sized soil aggregates.
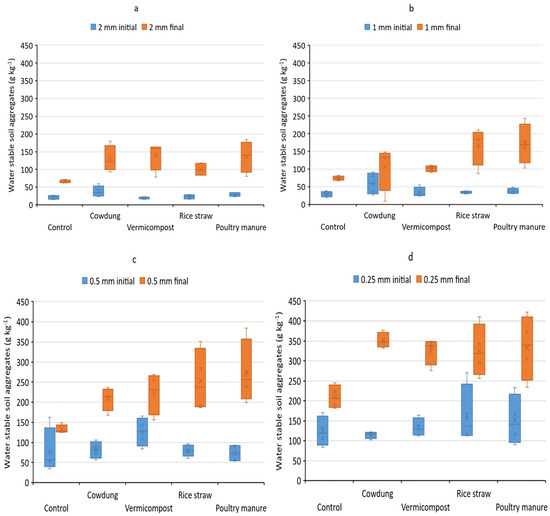
Figure 2.
Improvement in WSA of various-sized soil particles (a–d) represent 2, 1, 0.5 and 0.25 mm sized soil aggregates, respectively) under different treatments after five consecutive paddy growing seasons.
Irrespective of the sizes of the soil aggregates, the performances of the different treatments to form stable aggregates are shown in Figure 3. In the control treatment, the stable soil aggregates increased by 92%, compared to the initial aggregates. Among the four organic materials applied, PM was found to be more efficient at increasing the soil aggregates compared to RS, CD, and VC. Compared to the initial condition, the WSA increased by 214, 180, 171, and 152% in the PM, RS, CD, and VC treatments, respectively (Figure 3).
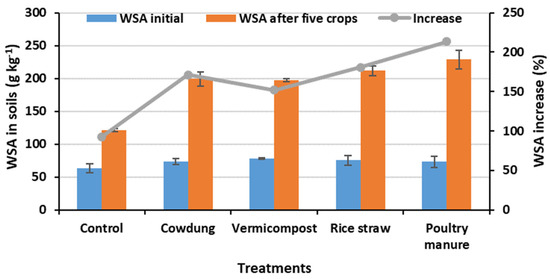
Figure 3.
Development of total water-stable soil aggregates (WSA) under different treatments after five consecutive rice growing seasons.
3.2. Carbon Sequestration in Soils under Different Organic Amendments
The different organic treatments showed variable effects for their C sequestration efficiencies (Figure 4). The carbon sequestration efficiencies ranged from 17 to 31, 24 to 36, 17 to 25, and 22 to 32% in the CD, VC, RS, and PM treatments, respectively. The average efficiencies were 22, 29, 20, and 26% in the CD, VC, RS and PM treatments, respectively. This reveals that the VC was the most effective organic amendment in terms of carbon sequestration, followed by PM, CD, and RS.
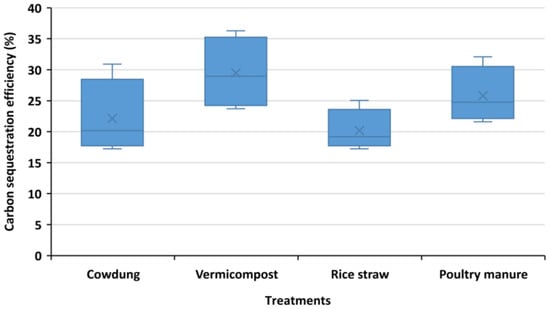
Figure 4.
Carbon sequestration efficiencies of different organic treatments in soil after five consecutive rice growing seasons.
3.3. Energy Indices in Paddy Cultivation under Different Organic Amendments
Table 4 articulates the EI, EO, NE, EP, and SE under different treatments. The highest amount of EI was observed in the PM (144,046 MJ ha−1) treatment, followed by the RS (80,022 MJ ha−1), VC (23,046 MJ ha−1), CD (21,773 MJ ha−1), and control (19,046 MJ ha−1). The treatments did not show significant effects on the energy outputs, which followed the same trend that was revealed in the case of the EI. The highest EO was found in the PM (170,493 MJ ha−1) treatment, while the lowest was in the control treatment (155,659 MJ ha−1). The NE, EP, and SE were significantly affected by the treatments (Table 4). The highest (significantly) NE was attributed to the CD (143,614 MJ ha−1) and VC (143,524 MJ ha−1) treatments, compared to the other treatments, while the lowest NE was observed in the PM (26,447 MJ ha−1) treatment. The highest (significantly) EP appeared in the control (0.36 kg MJ−1) treatment, while the lowest originated in the PM (0.04 kg MJ−1) treatment. The SE followed the reverse trend to the EP (i.e., the highest SE was documented in the PM (23.01 MJ kg−1), and the lowest value was documented in the control (3.09 MJ kg−1) treatment (Table 4)). The EUE and SP were significantly influenced by different treatments (Figure 5). The highest (significantly) EUE was attributed to the control (9.77) treatment, followed by the CD (8.66), VC (8.04), RS (2.10), and PM (1.18) treatments. The SP followed the reverse trend to the EUE (Figure 5). The highest SP was credited to the PM (6306 kg ha−1 season−1) treatment, followed by the RS (6120 kg ha−1 season−1), VC (6000 kg ha−1 season−1), CD (5941 kg ha−1 season−1), and control (5750 kg ha−1 season−1) treatments.
Table 4.
Average performances of different treatments on energetics in rice cultivation.
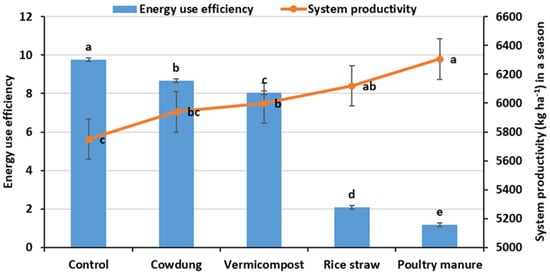
Figure 5.
Energy use efficiencies and system productivities as influenced by different treatments. Different letters on the columns represent significant differences in energy use efficiency, while letters across the line represent significant differences in system productivity among the treatments.
4. Discussion
4.1. Soil Organic Carbon and Water-Stable Soil Aggregates under Different Treatments
The initial soil was found to be very low in OC content (5.0–6.1 g kg−1), while, after five paddy seasons, it increased significantly to 8.3–8.7 g kg−1, and the status changed from very low to low (Figure 1). The highest rate of C increment in the soil was credited to the PM (50.0%) treatment, followed by the RS, CD, VC, and control treatments. Because of the addition of different organic materials, the OC contents in the soils increased significantly from the initial levels of the soil C (Figure 1). It has been reported by many researchers that the application of different organic materials contributed to the positive balance of the OC content of the post-harvest soil [7,8,30,31,32]. In fact, it is difficult to maintain and increase the OC levels in the soils of the tropical and subtropical regions [8,16]. High temperatures and humidity favor the faster mineralization of the organic matter in the soil, which also contributes to the lower OC in the soil [2]. Because of the faster mineralization of the added organic materials, the increments in the C in the soils might be low, which accentuates the continuous application of organic amendments to agricultural fields. However, even though the C increment in the soil is small, it greatly contributes to reducing greenhouse gas emissions and sustains the soil health and crop productivity [33,34,35]. The increment of C in the soil through the addition of organic materials also depends on the labile and nonlabile fractions of the C of the organic materials [8,36]. If the organic materials contain higher fractions of nonlabile C, its increments in the soils will generally be higher. Even though organic materials were not applied in the control treatment, the accumulated C was the result of the contribution of crop residues, which included roots and microbial biomass. The biomass of bacteria, fungi, and actinomycetes in the soils are reported to be 400–5000, 1000–15,000, and 400–5000 kg ha−1, respectively [37,38], which fulfills part of the organic matter need. Boyd [39] found that the bacterial and fungal body contained 50% C, while Rinnan and Baath [40] report that almost 90% of the soil microbial biomass is added from bacterial and fungi only. Therefore, it is confirmed that a significant amount of C accumulates in soils from the microbial biomass, which may vary, depending on the soil and the climatic conditions, the nature and composition of the organic materials added to the soil, etc.
The continuous addition of organic amendments contributed to the increase in the WSA over time, when compared to the initial level, and the smaller-sized soil aggregates resulted in the highest number of aggregates in all the treatments (Figure 2). Irrespective of the sizes of the soil aggregates, the WSA were increased by 214, 180, 171, and 152% in the PM, RS, CD, and VC treatments, respectively, compared to the initial conditions (Figure 3). The improvement in the soil aggregate formation of different organic treatments (Figure 3) is well correlated with the increase in the soil C (Figure 1). Soil aggregate is the result of the reorganization, flocculation, and cementation of a group of surrounding particles, which is facilitated by several factors, where the soil OC, the clay contents, the soil cations, and the microbial abundance and diversity play dominant roles [41,42,43]. On the other hand, the organic matter acts as a glue in binding the soil particles together, thereby making the soil aggregates stronger [43,44]. Thus, an improvement in the soil structure might contribute to nutrient retention as well as to erosion control [45]. The WSA of different-sized soil aggregates under different organic treatments indicate that the smaller-sized soil aggregate is more stable. Simansky and Bajcan [46] observed that microaggregates (<0.5 mm) are efficient at holding more C and at increasing the stable aggregates in soils. It has been reported that soil management practices have had a significant influence on the C sequestration capacities in the size fractions of soil aggregates [43,47].
4.2. Carbon Sequestration in Soils under Different Organic Amendments
In terms of the carbon sequestration efficiencies, the VC (29%) was the highest, and it was greater than the PM (26%) > CD (22%) > RS (20%), and, thus, the VC was the most effective organic amendment in terms of the C sequestration (Figure 4). Although organic materials were applied to the soil at 2 t C ha−1 season−1, there were differences in the C accumulation in the soils under different organic treatments because of their inherent qualities, C:N ratios, and mineralization potentials. In the case of materials that have almost decomposed and that contain the stable form of C during application, the rate of the C accumulation will be higher, and the mineralization will be slower [48]. Several research findings suggest that when mineralization continues, the carbon storage in the soil decreases [8,49]. Opposite scenarios may also be observed in situations where higher rates of organic matter mineralization contribute to higher C accumulation in soils. Higher rates of mineralization release essential nutrients to soils for plant uptake, which favors the robust growth of plant roots, harbors soil microbes, and, thus, increases the soil aggregate stability and the C content [4]. As soil is highly heterogeneous in nature, even at a closer distance, such variation in the C sequestration, even from the same organic source, may occur [8,50]. The application of organic matter alone, and with nitrogen fertilizer, are the major factors in the C accumulation in soils [2]. Yang et al. [51] demonstrated that the C in paddy soil was 40–60% higher when nutrients were applied by using organic and inorganic sources, compared to using only inorganic fertilizers. The annual C sequestration was 1.53 t ha−1 when both RS and farmyard manure were annually applied at the rate of 10–15 t ha−1 in a rice–wheat rotation [52]. Pan et al. [53] observed a close connection between the C sequestration and C conversion from organic amendments in paddy soil in a long-term experiment. During ten years of rice cultivation, Bhattacharyya et al. [54] observed that an annual RS application at the rate of 7.12 t ha−1 contributed to the C content in the soil by 1.23 t ha−1, and the RS application at the rate of 4.80 t ha−1 yr−1, along with inorganic fertilizers, contributed to 1.39 t C ha−1 yr−1. In a three-year study, Li et al. [7] report that the annual application of wheat straw (7.5 t ha−1) and farmyard manure (30 t ha−1) contributed to C sequestration efficiencies of 20 and 40%, respectively. Although the increment in the soil C is a must, it is difficult in the tropical and subtropical climatic environments. Soil may act either as a source of greenhouse gases or as a sink of C, depending on how the soil is managed [14]. Therefore, it can be concluded that the C sequestration in soil needs to be considered as a paramount event in the adoption of the best soil and crop management practices for the amendment of degraded soils, and for the sustainability of the productive capacity of agricultural land.
4.3. Energy Indices in Paddy Cultivation under Different Organic Amendments
The energy indices in the different treatments disclosed that the highest EI (144,046 MJ ha−1) and EO (170,493 MJ ha−1) were in the PM treatment, and the lowest EI (19,046 MJ ha−1) and EO (155,659 MJ ha−1) were in the control (i.e., only inorganic fertilizer treatment) (Table 4). As per Rahman and Halder [10], the energy inputs that were provided in the paddy cultivation varied from 29,283 to 72,339 MJ ha−1, while the energy outputs ranged from 51,641 to 141,593 MJ ha−1. Furthermore, Nguyen-Van-Hung et al. [55] state that the EI in paddy cultivation varies between 14,000 and 160,000 MJ ha−1. This indicates that the EI in the control treatment of the present study may be considered to be within the required limit; however, in all the other organic treatments, the EI are much higher than that of the required level. As organic amendments were applied in addition to the required nutrients that were supplied by inorganic fertilizers, the EI were higher in the organic treatments. Since the green revolution, energy use and its associated costs have increased in agriculture [56]. The paddy-rice-based cropping system is dominant in the Indo-Gangetic Plains; moreover, the cropping intensity is increasing in this region [57]. Such intensive agriculture requires more production inputs (viz., fertilizers, pesticides, irrigation, etc.). Therefore, the use of production inputs needs to be optimized in order to achieve a higher EUE and, thus, agricultural and environmental sustainability.
The SP was highest in the PM treatment, which contributed to the highest EO as well. Because of the much lower EI and a reasonable SP, the highest EP (0.36 kg MJ−1) and the lowest SE (3.09 MJ kg−1) were found in the control treatment. On the other hand, due to the highest EI and the lowest energy productivity (0.04 kg MJ−1), the highest SE (23.01 MJ kg−1) was attributed to the PM treatment. The EUE in different treatments followed the order of: control (9.77) > CD (8.66) > VC (8.04) > RS (2.10) > PM (1.18), while the SP followed the reverse order of the EUE (Figure 5). The findings of the different energy indices show that a large amount of energy remains unutilized in the organic treatments. In the control treatment, only the recommended rates of the inorganic fertilizers were applied, while, in the other treatments, organic fertilizers were applied in addition to the recommended rates of inorganic fertilizers. Therefore, the EI were higher in the treatments that received organic matter compared to the control treatment. As the EI requirement in agriculture has been increased, it is a prime need to make the production system energy efficient [58,59]. Excess nutrients were applied in all the organic treatments (Table 2), which might increase the greenhouse gas emissions and contribute to global warming and to climate change as well. Therefore, the required amount of nutrients should be supplied through a combined application of organic and inorganic sources of nutrients. Such management practices are expected to improve the soil health, increase the energy use efficiency and system productivity, and to eventually safeguard agricultural and environmental sustainability.
5. Conclusions
The findings of the study led us to conclude that different organic amendments significantly increased the WSA, where the PM was found to be more effective. The order of the increasing soil aggregates among the organic amendments were as follows: PM > RS > CD > VC. Irrespective of the treatments, 0.25 mm-sized soil aggregates contributed to the highest stability, compared to larger-sized soil aggregates, which followed the order of 0.25 > 0.5 > 1.0 > 2.0 mm-sized soil aggregates. Organic amendments also positively appeared for the increasing C contents and C sequestration in the soils. The carbon sequestration efficiencies revealed that the VC was far more effective as an organic amendment in terms of C sequestration, followed by PM, CD, and RS. In terms of the energy indices, the performance of the control (i.e., the recommended inorganic fertilizer treatment) was found to be the best. However, in order to achieve a tradeoff between the soil health and the system productivity, the energy-efficient combined application of organic and inorganic nutrients through an integrated plant nutrition system is a must.
Author Contributions
Conceptualization, M.M.R., S.R. and M.Z.U.K.; methodology, M.M.R. and M.S.A.; software, M.M.R., H.M.A. and M.A.A.; validation, M.K.A., S.A. and M.Z.U.K.; formal analysis, M.M.R., M.A.R.K. and M.M.I.; investigation, S.I.J., U.A.N., M.M.I. and J.C.B.; resources, M.A.A.M., F.A., S.A. and M.M.H.; data curation, M.S.A., M.A.A., M.Z.U.K. and U.A.N.; writing—original draft preparation, M.A.R.K., S.I.J. and M.M.; writing—review and editing, M.M.R., S.R., M.M. and J.C.B.; visualization, M.K.A., M.A.A., H.M.A. and M.A.A.M.; supervision, M.M.R.; project administration, M.M.R.; funding acquisition, M.M.R. All authors have read and agreed to the published version of the manuscript.
Funding
The study was funded by the Research Management Committee (RMC) of Bangabandhu Sheikh Mujibur Rahman Agricultural University (BSMRAU), Gazipur 1706, Bangladesh (Project ID 4829/18), and it was co-financed by the Modeling Climate Change Impact on Bangladesh Agriculture (MCCA), CRP II, Phase 2 (Project ID CN/FRPP), of the Krishi Gobeshona Foundation (KGF), Dhaka 1215, Bangladesh.
Institutional Review Board Statement
Not applicable.
Informed Consent Statement
Not applicable.
Data Availability Statement
The data that support the findings of this study are available from the corresponding author upon reasonable request.
Acknowledgments
The authors sincerely acknowledge the cooperation of the Department of Soil Science, BSMRAU, Bangladesh, for the chemical analysis of the soil and plant samples of the research project.
Conflicts of Interest
The authors declare no conflict of interest.
References
- Modak, K.; Ghosh, A.; Bhattacharyya, R.; Biswas, D.R.; Das, T.K.; Das, S.; Singh, G. Response of Oxidative Stability of Aggregate-Associated Soil Organic Carbon and Deep Soil Carbon Sequestration to Zero-Tillage in Subtropical India. Soil Till. Res. 2019, 195, 104370. [Google Scholar] [CrossRef]
- Rahman, M.M.; Alam, M.S.; Kamal, M.Z.U.; Rahman, G.K.M.M. Organic Sources and Tillage Practices for Soil Management. In Resources Use Efficiency in Agriculture; Kumar, S., Meena, R.S., Jhariya, M.K., Eds.; Springer: Singapore, 2020; pp. 283–328. [Google Scholar]
- Rahman, M.M. Nutrient-Use and Carbon Sequestration Efficiencies in Soils from Different Organic Wastes in Rice and Tomato Cultivation. Commun. Soil Sci. Plant Anal. 2013, 44, 1457–1471. [Google Scholar] [CrossRef]
- Rashid, M.I.; Mujawar, L.H.; Shahzad, T.; Almeelbi, T.; Ismail, I.M.; Oves, M. Bacteria and Fungi Can Contribute to Nutrients Bioavailability and Aggregate Formation in Degraded Soils. Microbiol. Res. 2016, 183, 26–41. [Google Scholar] [CrossRef] [PubMed]
- Karmakar, S.; Bhattacharyya, A.; Ghosh, B.; Roy, R.; Kumar, S.; Kar, B.; Saha, G. Suitability of Coupling Application of Organic and Inorganic Fertilizers for Crop Cultivation. In Ecological and Practical Applications for Sustainable Agriculture; Bauddh, K., Kumar, S., Singh, R., Korstad, J., Eds.; Springer: Singapore, 2020; pp. 149–177. [Google Scholar]
- Rahman, M.M. Potential Supplies and Use Efficiencies of Nutrients from Different Organic Wastes under Tomato Cultivation. Ann. Bangladesh Agric. 2012, 16, 25–39. [Google Scholar]
- Li, X.; Zhu, W.; Xu, F.; Du, J.; Tian, X.; Shi, J.; Wei, G. Organic Amendments Affect Soil Organic Carbon Sequestration and Fractions in Fields with Long-Term Contrasting Nitrogen Applications. Agric. Ecosyst. Environ. 2021, 322, 107643. [Google Scholar] [CrossRef]
- Rahman, F.; Rahman, M.M.; Rahman, G.M.; Saleque, M.A.; Hossain, A.S.; Miah, M.G. Effect of Organic and Inorganic Fertilizers and Rice Straw on Carbon Sequestration and Soil Fertility under a Rice–Rice Cropping Pattern. Carbon Manag. 2016, 7, 41–53. [Google Scholar] [CrossRef]
- Rahman, M.M.; Biswas, J.C.; Maniruzzaman, M.; Choudhury, A.K.; Ahmed, F. Effect of Tillage Practices and Rice Straw Management on Soil Environment and Carbon Dioxide Emission. Agriculturists 2017, 15, 127–142. [Google Scholar] [CrossRef]
- Rahman, M.; Halder, M. Energetics of Rice Cultivation in South-West Coastal Region of Bangladesh. Int. J. Ecol. Environ. Sci. 2013, 39, 203–208. [Google Scholar]
- Yadav, G.S.; Das, A.; Lal, R.; Babu, S.; Meena, R.S.; Saha, P.; Singh, R.; Datta, M. Energy Budget and Carbon Footprint in a No-till and Mulch Based Rice–Mustard Cropping System. J. Clean. Prod. 2018, 191, 144–157. [Google Scholar] [CrossRef]
- FAOSTAT. Agriculture Statistics from FAODATA Statistics. 2021. Available online: http://www.fao.org/faostat/en/#data (accessed on 20 July 2021).
- Yadav, G.S.; Lal, R.; Meena, R.S.; Datta, M.; Babu, S.; Das, A.; Layek, J.; Saha, P. Energy Budgeting for Designing Sustainable and Environmentally Clean/Safer Cropping Systems for Rainfed Rice Fallow Lands in India. J. Clean. Prod. 2017, 158, 29–37. [Google Scholar] [CrossRef]
- Sharath, M.C.; Naresh, R.K.; Vivek, S.P.K.; Harish, J.; Chandana, P.; Shivashankar, K. Energy Auditing and Carbon Footprint with Diverse Organic and Inorganic Fertilizer Management Options in Cereal based Cropping Systems under Conservation Agriculture: A Review. Int. J. Curr. Microbiol. App. Sci. 2020, 9, 2062–2081. [Google Scholar]
- Bangladesh Agricultural Research Council (BARC). Fertilizer Recommendation Guide; Farmgate: Dhaka, Bangladesh, 2018. [Google Scholar]
- Alam, M.A.; Rahman, M.M.; Biswas, J.C.; Akhter, S.; Maniruzzaman, M.; Choudhury, A.K.; Jahan, A.B.M.S.; Miah, M.M.U.; Sen, R.; Kamal, M.Z.U.; et al. Nitrogen Transformation and Carbon Sequestration in Wetland Paddy Field of Bangladesh. Paddy Water Environ. 2019, 17, 677–688. [Google Scholar] [CrossRef]
- Chaudhary, V.P.; Singh, K.K.; Pratibha, G.; Bhattacharyya, R.; Shamim, M.; Srinivas, I.; Patel, A. Energy Conservation and Greenhouse Gas Mitigation under Different Production Systems in Rice Cultivation. Energy 2017, 130, 307–317. [Google Scholar] [CrossRef]
- Brammer, H. Rice Soils of Bangladesh. In Soils and Rice; The International Rice Research Institute: Manila, Philippines, 1996; pp. 35–55. [Google Scholar]
- Blake, G.R.; Hartge, K.H. Bulk Density. In Methods of Soil Analysis. Part 1. Agronomy 9; Klute, A., Ed.; American Society of Agronomy (ASA): Madison, WI, USA, 1986; pp. 363–375. [Google Scholar]
- Walkley, A.; Black, C.A. An Examination of the Degtjareff Method for Determining Soil Organic Matter and a Proposed Modification of the Chromic Acid Titration Method. Soil Sci. 1934, 37, 29–38. [Google Scholar] [CrossRef]
- Patton, J.J.; Burras, L.; Konen, M.E.; Molstad, N.E. An Accurate and Inexpensive Apparatus and Method for Teaching and Measuring Stable Aggregate Content of Soils. J. Nat. Resour. Life Sci. Edu. 2001, 30, 84–88. [Google Scholar] [CrossRef]
- Datta, M.; Yadav, G.S.; Chakraborty, S. Integrated Nutrient Management in Groundnut (Arachis Hypogaea) in a Subtropical Humid Climate of North-East India. Indian J. Agron. 2014, 59, 322–326. [Google Scholar]
- Devasenapathy, P.; Senthil, K.G.; Shanmugam, P.M. Energy Management in Crop Production. Indian J. Agron. 2009, 54, 80–90. [Google Scholar]
- Tuti, M.D.; Prakash, V.; Pandey, B.M.; Bhattacharyya, R.; Mahanta, D.; Bisht, J.K.; Kumar, M.; Mina, B.L.; Kumar, N.; Bhatt, J.C.; et al. Energy Budgeting of Colocasia-Based Cropping Systems in the Indian Sub-Himalayas. Energy 2012, 45, 986–993. [Google Scholar] [CrossRef]
- Quiroga, G.; Castrillon, L.; Fernández-Nava, Y.; Marañón, E. Physico-Chemical Analysis and Calorific Values of Poultry Manure. Waste Manag. 2010, 30, 880–884. [Google Scholar] [CrossRef]
- Mohammadi, A.; Rafiee, S.; Jafari, A.; Keyhani, A.; Mousavi-Avval, S.H.; Nonhebel, S. Energy Use Efficiency and Greenhouse Gas Emissions of Farming Systems in North Iran. Renew. Sust. Energ. Rev. 2014, 30, 724–733. [Google Scholar] [CrossRef]
- Singh, K.P.; Prakash, V.E.D.; Srinivas, K.; Srivastva, A.K. Effect of Tillage Management on Energy-Use Efficiency and Economics of Soybean (Glycine Max) Based Cropping Systems under the Rainfed Conditions in North-West Himalayan Region. Soil Till. Res. 2008, 100, 78–82. [Google Scholar] [CrossRef]
- Heidari, M.D.; Omid, M. Energy Use Patterns and Econometric Models of Major Greenhouse Vegetable Productions in Iran. Energy 2011, 36, 220–225. [Google Scholar] [CrossRef]
- Gomez, K.A.; Gomez, A.A. Statistical Procedures for Agricultural Research; John Wiley & Sons: Hoboken, NJ, USA, 1984. [Google Scholar]
- Islam, M.A.F.; Khan, M.A.; Bari, A.F.; Hosain, M.T.; Sabikunnaher, M. Effect of Fertilizer and Manure on the Growth, Yield and Grain Nutrient Concentration of Boro Rice (Oryza sativa L.) under Different Water Management Practices. Agriculturists 2013, 11, 44–51. [Google Scholar] [CrossRef] [Green Version]
- Meena, R.S.; Lal, R.; Yadav, G.S. Long Term Impacts of Topsoil Depth and Amendments on Soil Physical and Hydrological Properties of an Alfisol in Central Ohio, USA. Geoderma 2020, 363, 114164. [Google Scholar] [CrossRef]
- Rahman, M.L.; Rahman, M.M.; Rahman, G.K.M.M.; Solaiman, A.R.M.; Karim, M.A.; Bokhtiar, S.M.; Hossain, M.B.; Meena, R.S. Influence of Tillage and Organic Amendments on Terrace Soil Bio-Physico-Chemical Properties and Carbon Sequestration Index. Commun. Soil Sci. Plant Anal. 2020, 51, 2683–2700. [Google Scholar] [CrossRef]
- Meena, R.S.; Kumar, S.; Yadav, G.S. Soil Carbon Sequestration in Crop Production. In Nutrient Dynamics for Sustainable Crop Production; Meena, R.S., Ed.; Springer: Singapore, 2020; pp. 1–39. [Google Scholar]
- Rahman, G.K.M.M.; Rahman, M.M.; Alam, M.S.; Kamal, M.Z.U.; Mashuk, H.A.; Datta, R.; Meena, R.S. Biochar and organic amendments for sustainable soil carbon and soil health. In Carbon and Nitrogen Cycling in Soil; Datta, R., Meena, R.S., Pathan, S.I., Ceccherini, M.T., Eds.; Springer Nature: Singapore, 2020; pp. 45–85. [Google Scholar]
- Wu, L.; Zhang, S.; Ma, R.; Chen, M.; Wei, W.; Ding, X. Carbon Sequestration under Different Organic Amendments in Saline-Alkaline Soils. Catena 2021, 196, 104882. [Google Scholar]
- Li, J.; Wen, Y.; Li, X.; Li, Y.; Yang, X.; Lin, Z.; Song, Z.; Cooper, J.M.; Zhao, B. Soil Labile Organic Carbon Fractions and Soil Organic Carbon Stocks as Affected by Long-Term Organic and Mineral Fertilization Regimes in the North China Plain. Soil Till. Res. 2018, 175, 281–290. [Google Scholar] [CrossRef] [Green Version]
- Weil, R.R.; Brady, N.C. The Natures and Properties of Soils, 15th ed.; Pearson: New York, NY, USA, 2016; p. 1104. [Google Scholar]
- Zhang, Q.; Wu, J.; Yang, F.; Lei, Y.; Zhang, Q.; Cheng, X. Alterations in Soil Microbial Community Composition and Biomass Following Agricultural Land Use Change. Sci. Rep. 2016, 6, 36587. [Google Scholar] [CrossRef] [Green Version]
- Boyd, C.E. Bottom Soils, Sediment and Pond Aquaculture; Chapman & Hall: New York, NY, USA, 1995; p. 348. [Google Scholar]
- Rinnan, R.; Baaath, E. Differential Utilization of Carbon Substrates by Bacteria and Fungi in Tundra Soil. Appl. Environ. Microbiol. 2009, 75, 3611–3620. [Google Scholar] [CrossRef] [Green Version]
- Duiker, S.W.; Rhoton, F.E.; Torrent, J.; Smeck, N.E.; Lal, R. Iron (Hydro) Oxide Crystallinity Effects on Soil Aggregation. Soil Sci. Soc. Am. J. 2003, 67, 606–611. [Google Scholar] [CrossRef]
- Bronick, C.J.; Lal, R. Soil Structure and Management: A Review. Geoderma 2005, 124, 3–22. [Google Scholar] [CrossRef]
- Roy, S.; Rahman, M.M.; Rahman, G.K.M.M.; Miah, M.G.; Kamal, M.Z.U. Structural Stability under Different Organic Fertilizers Management in Paddy Soil. Ann. Bangladesh Agr. 2019, 23, 15–24. [Google Scholar] [CrossRef]
- Sarker, T.C.; Incerti, G.; Spaccini, R.; Piccolo, A.; Mazzoleni, S.; Bonanomi, G. Linking Organic Matter Chemistry with Soil Aggregate Stability: Insight from 13C NMR Spectroscopy. Soil Biol. Biochem. 2018, 117, 175–184. [Google Scholar] [CrossRef]
- Ontl, T.A.; Schulte, L.A. Soil Carbon Storage. Nat. Edu. Knowl. 2012, 3, 35. [Google Scholar]
- Simansky, V.; Bajcan, D. Stability of Soil Aggregates and Their Ability of Carbon Sequestration. Soil Water Res. 2014, 9, 111–118. [Google Scholar] [CrossRef] [Green Version]
- Simansky, V. Soil Organic Matter in Water-Stable Aggregates under Different Soil Management Practices in a Productive Vineyard. Archives Agron. Soil Sci. 2013, 59, 1207–1214. [Google Scholar]
- Ennis, C.J.; Evans, A.G.; Islam, M.; Ralebitso-Senior, T.K.; Senior, E. Biochar: Carbon Sequestration, Land Remediation, and Impacts on Soil Microbiology. Crit. Rev. Env. Sci. Tech. 2012, 42, 2311–2364. [Google Scholar] [CrossRef] [Green Version]
- Halvorson, A.D.; Wienhold, B.J.; Black, A.L. Tillage, Nitrogen and Cropping System Effects on Soil Carbon Sequestration. Soil Sci. Soc. Am. J. 2002, 66, 906–912. [Google Scholar]
- Hossain, M.B.; Rahman, M.M.; Biswas, J.C.; Miah, M.M.U.; Akhter, S.; Maniruzzaman, M.; Choudhury, A.K.; Ahmed, F.; Shiragi, M.H.K.; Kalra, N. Carbon Mineralization and Carbon Dioxide Emission from Organic Matter Added Soil under Different Temperature Regimes. Int. J. Recycl. Org. Wastes Agr. 2017, 6, 311–319. [Google Scholar] [CrossRef] [Green Version]
- Yang, Z.H.; Singh, B.R.; Sitaula, B.K. Soil Organic Carbon Fractions under Different Land Uses in Mardi Watershed of Nepal. Commun. Soil Sci. Plant Nutr. 2004, 35, 615–629. [Google Scholar] [CrossRef]
- Beni, D.K.; Senapati, N. Soil Aggregation and Carbon and Nitrogen Stabilization in Relation to Residue and Manure AP-Plication in Rice–Wheat Systems in Northwest India. Nutr. Cycl. Agroecosyst. 2010, 87, 233–247. [Google Scholar] [CrossRef]
- Pan, G.X.; Zhou, P.; Zhang, X.H.; Li, L.Q.; Zheng, J.F.; Qiu, D.S.; Chu, Q.H. Effect of Different Fertilization Practices on Crop C Assimilation and Soil C Sequestration: A Case of a Paddy under a Long Term Fertilization Trial from the Tai Lake Region, China. Acta Ecol. Sin. 2006, 26, 3704–3710. [Google Scholar]
- Bhattacharyya, P.; Roy, K.S.; Neogi, S.; Chakravorti, S.P.; Behera, K.S.; Das, K.M.; Bardhan, S.; Rao, K.S. Effect of Long-Term Application of Organic Amendment on C Storage in Relation to Global Warming Potential and Biological Activities in Tropical Flooded Soil Planted to Rice. Nutr. Cycl. Agroecosyst. 2012, 94, 273–285. [Google Scholar] [CrossRef]
- Nguyen-Van-Hung; Sander, B.O.; Quilty, J.; Balingbing, C.; Castalone, A.G.; Romasanta, R.; Alberto, M.C.R.; Sandro, J.M.; Jamieson, C.; Gummert, M. An Assessment of Irrigated Rice Production Energy Efficiency and Environmental Footprint with In-Field and Off-Field Rice Straw Management Practices. Sci. Rep. 2019, 9, 16887. [Google Scholar]
- Singh, R.B. Environmental consequences of agricultural development: A case study from the Green Revolution state of Haryana, India. Agric. Ecosyst. Environ. 2000, 82, 97–103. [Google Scholar] [CrossRef]
- Choudhary, M.; Sharma, P.C.; Jat, H.S.; Dash, A.; Rajashekar, B.; McDonald, A.J.; Jat, M.L. Soil Bacterial Diversity under Conservation Agriculture-Based Cereal Systems in Indo-Gangetic Plains. 3 Biotech 2018, 8, 304. [Google Scholar] [CrossRef] [PubMed]
- Soni, P.; Sinha, R.; Perret, S.R. Energy Use and Efficiency in Selected Rice-Based Cropping Systems of the Middle-Indo Gangetic Plains in India. Energy Rep. 2018, 4, 554–564. [Google Scholar] [CrossRef]
- Jat, S.L.; Parihar, C.M.; Singh, A.K.; Kumar, B.; Choudhary, M.; Nayak, H.S.; Parihar, M.D.; Parihar, N.; Meena, B.R. Energy Auditing and Carbon Footprint under Long-Term Conservation Agriculture-Based Intensive Maize Systems with Diverse Inorganic Nitrogen Management Options. Sci. Total Environ. 2019, 664, 659–668. [Google Scholar] [CrossRef]
Publisher’s Note: MDPI stays neutral with regard to jurisdictional claims in published maps and institutional affiliations. |
© 2022 by the authors. Licensee MDPI, Basel, Switzerland. This article is an open access article distributed under the terms and conditions of the Creative Commons Attribution (CC BY) license (https://creativecommons.org/licenses/by/4.0/).