4.1. Descriptive Statistics
There were 604 participants in total, comprising 44.2% (
N = 267) men and 55.8% (
N = 337) women (
Table 1). In addition, the largest proportion represented within the sample was of participants between the ages of 30–39, constituting 33.6% (
N = 203); holding a bachelor’s degree (47.2%,
N = 285); being employed for wages (55.5%,
N = 335). Most of the participants’ income ranged less than USD 99,999 annually, and the majority of the participants in the study were located in the Makkah region (56.5%,
N = 341), where both the authors of the study are based. In addition, 78.1% (
N = 472) of the respondents completed the survey in English, while 21.9% (
N = 132) in Arabic.
Table 1 provides the detailed socio-demographic profile of the sample.
Table 2 provides the means of preventive behaviors, according to the demographics of the sample. While previous research has demonstrated that females tend to be more careful in adhering to preventive measures [
23], the results of this study show that differences between males and females are minor, with males being more compliant for certain preventive measures, such as washing hands for at least 20 s, refraining from going out unless absolutely necessary and practicing social distancing. While there were not significant differences based on the income level of the participants, generally, the participants in the group where annual income was less than USD 25,000 had lower levels of compliance compared to the rest of the sample, and participants in the group where annual income was USD 150,000 or higher had marginally higher levels of compliance, across most of the preventive measures. The Asir region had the highest levels of compliance compared to the other regions of Saudi Arabia; however, as the percentage of participants from the Asir region constitutes only 0.8% of the sample, this cannot be considered a conclusive result. Age and educational level did not show any significant differences between the categories; however, among the employment status, homemakers were marginally more compliant with the preventive measures than those in other categories.
Table 3 presents the means of vaccination status and motivations, according to the demographic distribution of the sample. Females were more likely to have either been vaccinated already or demonstrate a positive intent to get vaccinated soon (mean = 4.39), compared to males (mean = 4.09). However, both genders were similar in the fact that the overarching reason for getting vaccinated was to resume their usual pre-COVID lives at the earliest possible time (males = 4.14, females = 4.28). The means of the different categories within annual income did not show significant differences. Among the regions, the participants from the Asir region were more likely to have either been vaccinated already or planning to get vaccinated soon (mean = 4.6); however, as stated earlier, as the percentage of participants in the sample is very small, this result cannot be considered conclusive. Age did show some differences, with respondents between the ages of 18–29 less likely to have been vaccinated already or having vaccination plans in the near future (mean = 4.11), compared to respondents over the age of 60 (mean = 4.71). In addition, participants holding a bachelor’s degree were also more likely to have either been vaccinated already or show a positive intent to get vaccinated (mean = 4.33). Finally, in the employment status demographic, retired individuals were more likely to have either been vaccinated already or planning to get vaccinated soon (mean = 4.57), while self-employed individuals were less likely to do so (mean = 4.09). Across all demographics, however, the main motivating factor for getting vaccinated was to resume their usual pre-COVID lives at the earliest possible time.
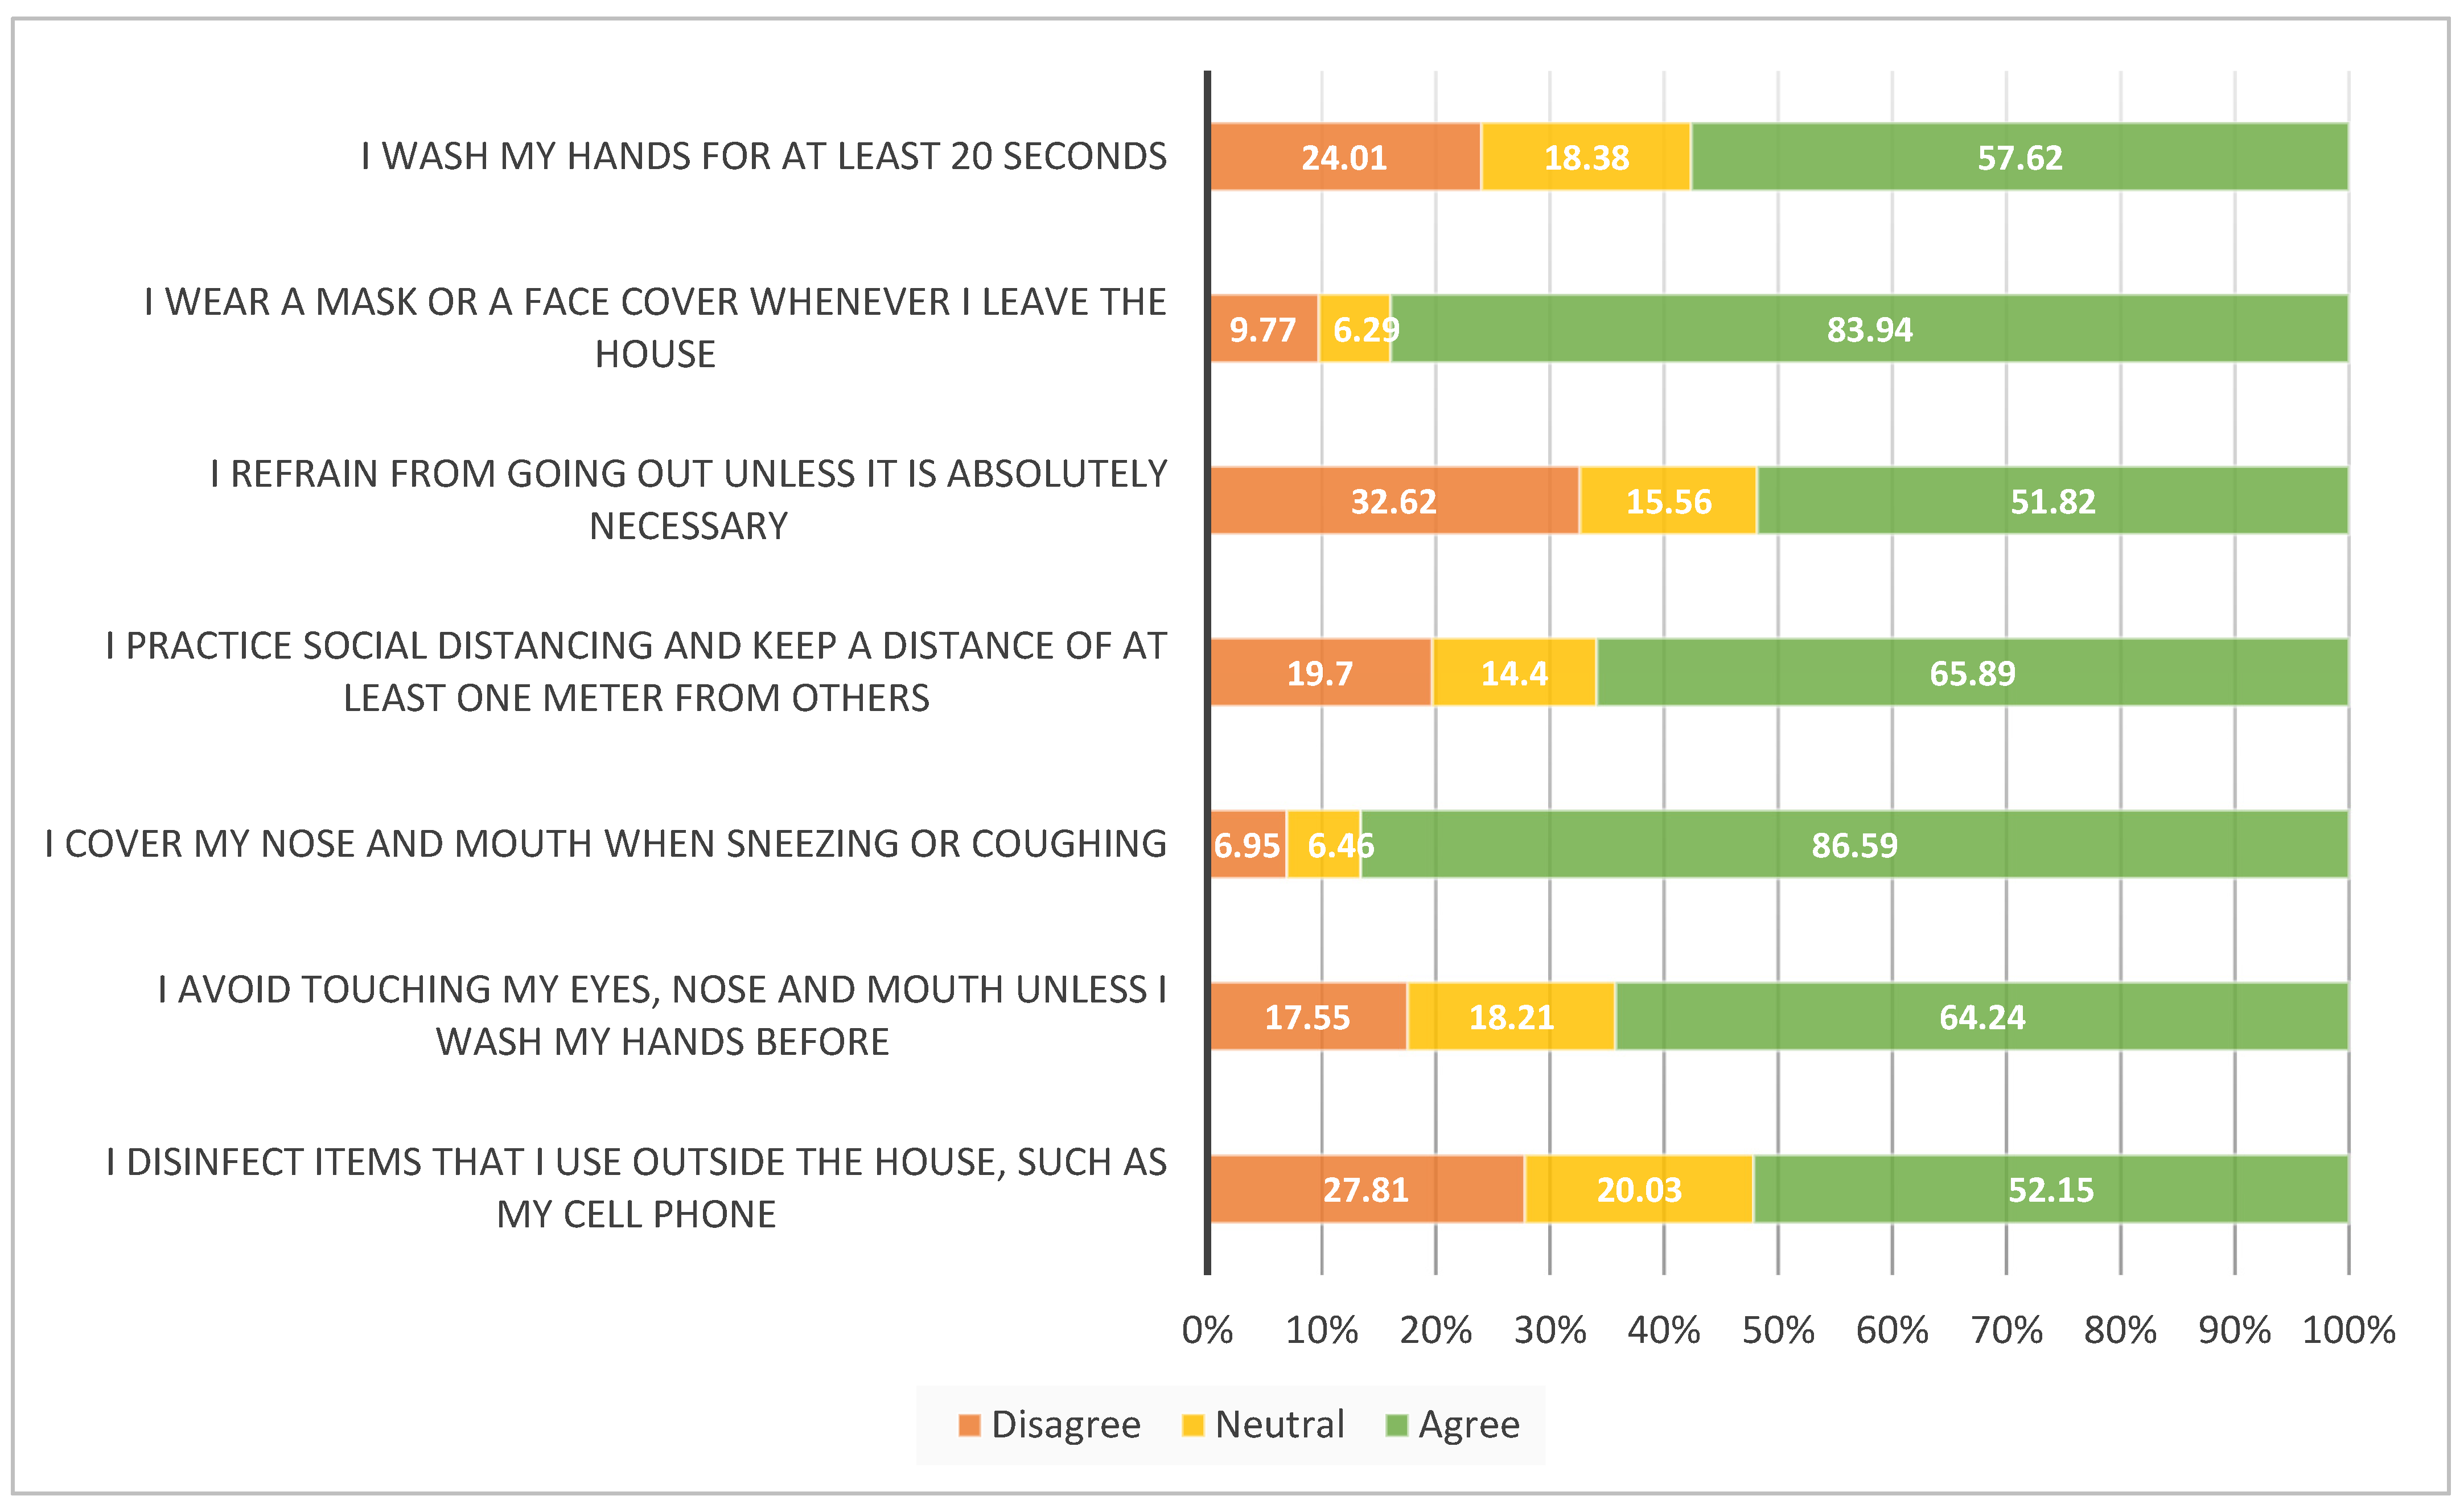
Figure 1 provides a basic frequency analysis of the seven COVID-19 preventive measures. Each item was originally measured on a five-point scale, but for the purpose of this analysis, was divided into three groups: Group 1 (‘Disagree’) includes all respondents who selected ‘Strongly Disagree’ or ‘Disagree’; Group 2 (‘Neutral’) includes all respondents who selected ‘Neither Agree nor Disagree’; Group 3 (‘Agree’) includes all respondents who responded with either ‘Agree’ or ‘Strongly Agree’. The results show that 83.94% of the people surveyed wear a mask or face covering whenever they leave the house. In this study, 86.59% of respondents reportedly cover their mouth and nose when sneezing or coughing. Items with low levels of compliance include refraining from going out unless necessary, with 32.62% of the respondents reporting non-compliance, disinfecting items used outside the house, with 27.81% stating non-adherence, and 24.01% of respondents reporting that they do not wash their hands for at least 20 s. These results suggest that while the majority of respondents (over 51%) are complying with all preventive measures, there is still a significant percentage of respondents that need to increase their compliance.
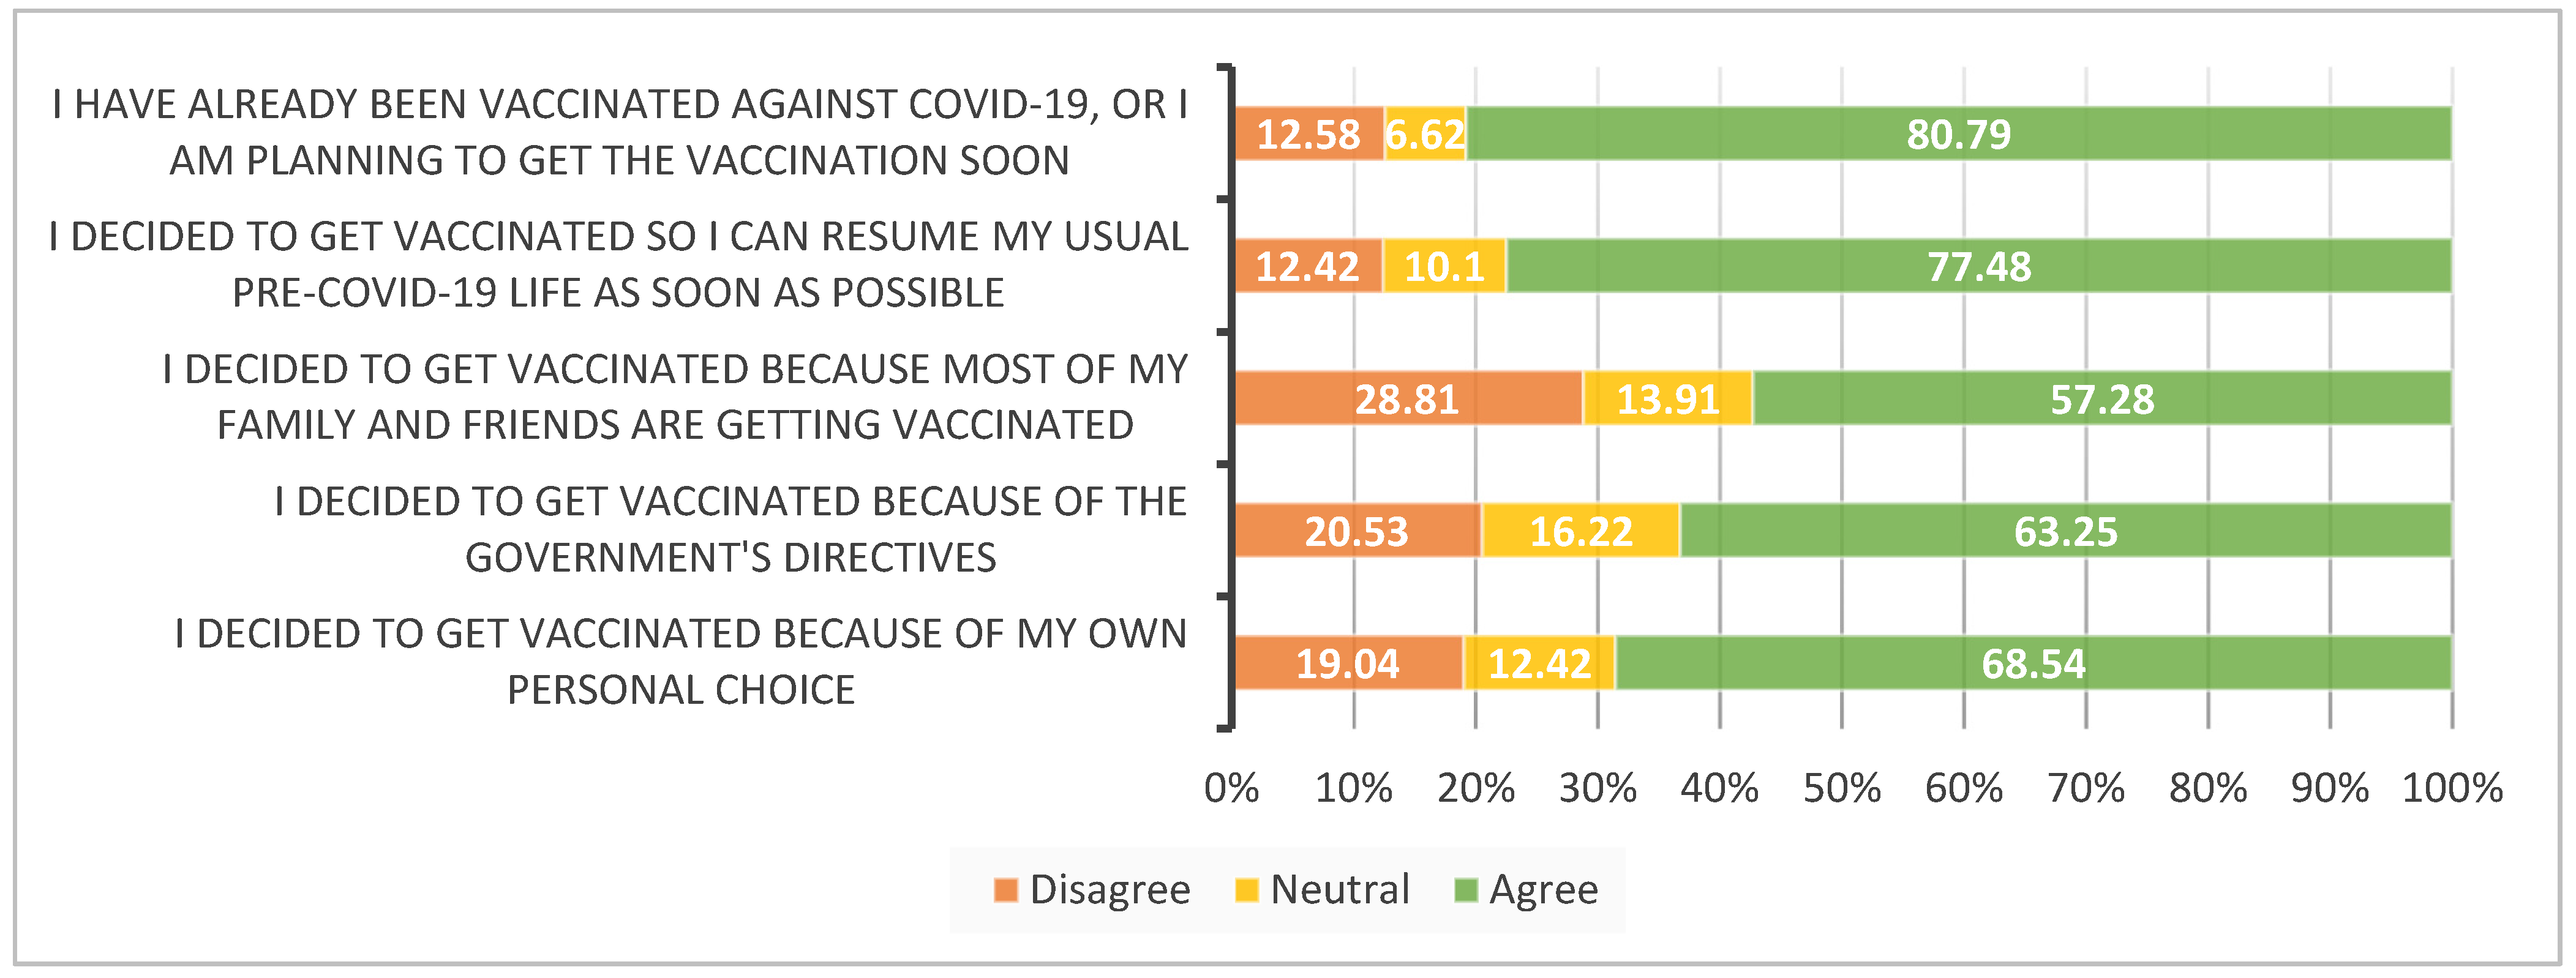
Figure 2 shows a basic frequency analysis of vaccine status and motivators for the COVID-19 vaccine. Similar to the frequency analysis reported above, each item was originally measured on a five-point scale, but for the purpose of this analysis, was divided into three groups: Group 1 (‘Disagree’), constituting of all respondents who selected ‘Strongly Disagree’ or ‘Disagree’; Group 2 (‘Neutral’), including all respondents who selected ‘Neither Agree nor Disagree’; Group 3 (‘Agree’), constituting all respondents who responded with either ‘Agree’ or ‘Strongly Agree’. The results show that 80.79% of the respondents have either already been vaccinated or are planning to get the vaccination soon. The main motivating factor to getting vaccinated for 77.48% of the respondents was so that they could resume their usual pre-COVID-19 life at the earliest possible time. The lowest motivator was the influence of family and friends getting vaccinated at 57.28%, which suggests that vaccine decisions are, to a large extent, determined by the personal choices of individuals (68.54%). After personal choice, the role of government directives is also an important determinant at 63.25%.
4.2. Correlations
A Spearman rank correlation was performed between the variables in the study. As shown by
Table 4, both novel items related to repetitive advice and instructions (RAI01) and expectations to adhere to the same instructions over continued periods of time (RAI02) have a statistically significant correlation (at the 0.001 level), with both Psychological Reactance as an overall scale (r = 0.572,
p ≤ 0.001 for RAI01; and r = 0.587,
p ≤ 0.001 for RAI02) and with the components of Psychological Reactance separately. The strongest correlation of both items was with the section on
resisting influence from others (for RAI01: r = 0.540,
p ≤ 0.001; and for RAI02: r = 0.548,
p ≤ 0.001), while RAI01 has the strongest correlation with
emotional response toward restricted choice (r = 0.575,
p ≤ 0.001).
Table 5 presents the correlation between adherence to COVID-19 preventive measures and the overall Psychological Reactance scale, its four components separately, and the two novel items, RAI01 and RAI02. When measuring the correlation of the overall Psychological Reactance scale, a statistically significant correlation was shown with the item related to washing hands for at least 20 s (r = 0.151,
p ≤ 0.001). Emotional response toward restricted choice, however, shows a statistically significant correlation with washing hands for at least 20 s (r = 0.127,
p = 0.002), wearing a mask or face covering outside the house (r = 0.146,
p ≤ 0.001), and covering mouth and nose when sneezing or coughing (r = 0.141,
p ≤ 0.001). There is also a correlation between washing hands for at least 20 s and reactance to compliance (r = 0.130,
p ≤ 0.001), and resisting influence from others (r = 0.188,
p ≤ 0.001). Reactance to advice and recommendations, however, is correlated with five of the seven preventive measures: wearing a mask or face covering outside the house (r = −0.152,
p ≤ 0.001); refraining from going out unless necessary (r = 0.104,
p = 0.010); covering mouth and nose when sneezing (r = −0.88,
p = 0.030); avoiding touching the face until hands have been washed (r = 0.89,
p = 0.029); disinfecting the items that are used outside the house (r = 0.101,
p ≤ 0.013). RAI01 was correlated with covering nose and mouth when sneezing (r = 0.127,
p = 0.002), and RAI02 demonstrated a correlation with social distancing (r = −0.131,
p = 0.001) and avoiding touching the face until hands have been washed (r = −0.123,
p = 0.003).
Correlations between overall Psychological Reactance, its four components and RAI01 and RAI02 were also assessed with the COVID-19 vaccine intentions and motivations of the residents of Saudi Arabia (
Table 6). The item measuring vaccination status and intent (“I have already been vaccinated against COVID-19, or I am planning to get the vaccination soon”) was correlated with emotional response toward restricted choice (r = 0.192,
p ≤ 0.001) and RAI01 (r = 0.138,
p ≤ 0.001). The item assessing the motivation to get vaccinated to resume pre-COVID-19 life demonstrated correlations with overall psychological reactance (r = 0.118,
p = 0.004), as well as two of its components: emotional response toward restricted choice (r = 0.228,
p ≤ 0.001) and resisting influence from others (r = 0.144,
p ≤ 0.001) and RAI01 (r = 0.201,
p ≤ 0.001). The item assessing the role of personal choice in getting vaccinated was correlated with resisting influence from others (r = 0.097,
p = 0.017). When looking at the impact of external factors, such as the role of government directives, this was correlated with emotional response toward restricted choice (r = 0.134,
p = 0.001) and RAI02 (r = 0.086,
p = 0.036). The influence of family and friends getting vaccinated demonstrated correlations with overall psychological reactance (r = 0.177,
p ≤ 0.001), as well as all four of its components: emotional response toward restricted choice (r = 0.165,
p ≤ 0.001); reactance to compliance (r = 0.137,
p ≤ 0.001); resisting influence from others (r = 0.188,
p ≤ 0.001) and reactance to advice and recommendations (r = 0.104,
p = 0.011), and both items RAI01 (r = 0.120,
p = 0.003) and RAI02 (r = 0.144,
p ≤ 0.001).
4.3. Kruskal–Wallis H Test
In order to conduct the Kruskal–Wallis H test, the mean psychological reactance scores of all participants were divided into four percentile groups. The percentile groups were created at the 25%, 50%, 75% and 100% levels. These were constituted of 151 participants with the lowest psychological reactance scores in quartile 1 (Q1), 149 participants in quartile 2 (Q2), 150 participants in quartile 3 (Q3) and 154 participants with the highest scores in quartile 4 (Q4).
The Kruskal–Wallis H test provided statistically significant evidence (
p < 0.05) of differences between the mean ranks for four of the preventive measures (
Table 7). For the item stating ‘I wash my hands for at least 20 seconds’, there was very strong evidence of a difference (
p < 0.001) between the mean ranks of at least one pair of groups. Dunn’s pairwise tests were carried out for the four pairs of groups. There was very strong evidence adjusted using the Bonferroni correction of differences between Q2 and Q4 (
p = 0.001) and between Q1 and Q4 (
p = 0.046). There was no evidence of a difference between the other pairs. For the preventive item stating ‘I refrain from going out unless it is absolutely necessary’, the Kruskal–Wallis H test provided strong evidence (
p = 0.002) of a difference between the mean ranks of at least one pair of groups. Results of Dunn’s pairwise tests adjusted using the Bonferroni correction provided very strong evidence of a difference between Q3 and Q4 (
p = 0.002). For the item ‘I practice social distancing and keep a distance of at least one meter from others’, there was evidence of a difference (
p = 0.017), and post-hoc Dunn–Bonferroni results provided evidence of a difference between Q3 and Q4 (
p = 0.030). For the item ‘I disinfect items that I use outside the house, such as my cell phone’, there was very strong evidence of a difference (
p < 0.001) between the mean ranks of at least one pair of groups. The Dunn–Bonferroni results provided very strong evidence of differences between three pairs: Q3 and Q2 (
p = 0.011); Q3 and Q1 (
p = 0.006) and between Q3 and Q4 (
p = 0.000). There was no evidence of a difference between the other pairs.
The Kruskal–Wallis H test was also conducted on the vaccine status and motivations of the four quartiles of scores for psychological reactance. The test provided statistically significant evidence (
p ≤ 0.05) of differences between the mean ranks for four of the vaccine-related items (
Table 8). The item stating ‘I have already been vaccinated against COVID-19, or I am planning to get the vaccination soon’ provided strong evidence of a difference between the mean ranks of at least one pair of groups (
p = 0.009). Results of Dunn’s pairwise tests adjusted using the Bonferroni correction provided very strong evidence of a difference between Q3 and Q4 (
p = 0.006). For the item ‘I decided to get vaccinated because most of my family and friends are getting vaccinated’, there was very strong evidence of a difference (
p ≤ 0.001) between the mean ranks of at least one pair of groups. The Dunn–Bonferroni results provided very strong evidence of differences between three pairs: Q1 and Q4 (
p = 0.003); Q1 and Q3 (
p = 0.001) and between Q2 and Q3 (
p = 0.024). The Kruskal–Wallis test conducted on the item ‘I decided to get vaccinated because most of my family and friends are getting vaccinated’, provided evidence (
p = 0.042) of a difference between the mean ranks of at least one pair of groups. Results of Dunn’s pairwise tests adjusted using the Bonferroni correction provided evidence of a difference between Q2 and Q4 (
p = 0.033). For the last item, which stated ‘I decided to get vaccinated because of my own personal choice’, the Kruskal–Wallis test provided evidence of a difference between the mean ranks (
p = 0.048); however, the Dunn–Bonferroni results did not show a difference between any of the pairs.
In addition, the authors wanted to assess the impact of the two novel items related to repetitive advice and instructions (RAI01) and expectations to adhere to the same instructions over continued periods of time (RAI02) on psychological reactance. The Kruskal–Wallis H test provided strong evidence of a difference between the mean ranks of at least one pair of groups for both the items:
p = 0.000 for RAI01 and
p = 0.000 for RAI02. Results of Dunn’s pairwise tests adjusted using the Bonferroni correction provided very strong evidence of a difference between all pairs for both items (
Table 9).
In order to conduct the Kruskal–Wallis H test, the means of all participants for the two items were divided into four percentile groups. The percentile groups were created at the 25%, 50%, 75% and 100% levels. For RAI01, these were constituted of 160 participants with the lowest means in quartile 1 (Q1), 144 participants in quartile 2 (Q2), 123 participants in quartile 3 (Q3) and 177 participants with the highest means in quartile 4 (Q4). For RAI02, these were constituted of 125 participants with the lowest means in quartile 1 (Q1), 110 participants in quartile 2 (Q2), 250 participants in quartile 3 (Q3) and 119 participants with the highest means in quartile 4 (Q4).
While conducting the Kruskal–Wallis H test for RAI01 and preventive measures, strong evidence of differences were provided for the following items: ‘I wear a mask or a face covering whenever I leave the house’ (
p = 0.007); ‘I refrain from going out unless it is absolutely necessary’ (
p = 0.024), and ‘I cover my nose and mouth when sneezing and coughing’ (
p = 0.008). The post-hoc Dunn pairwise tests adjusted with the Bonferroni correction are presented in
Table 10.
The Kruskal–Wallis H test for RAI01 and vaccine status and motivations also provided very strong evidence of differences in means for three of the items: ‘I have already been vaccinated against COVID-19, or I am planning to get the vaccination soon’ (
p = 0.009); ‘I decided to get vaccinated so I can resume my usual pre-COVID-19 life as soon as possible’ (
p ≤ 0.001), and ‘ I decided to get vaccinated because most of my family and friends are getting vaccinated’ (
p ≤ 0.001). The post-hoc Dunn–Bonferroni results are provided in
Table 11.
Table 12 presents the Kruskal–Wallis H test and the post-hoc Dunn–Bonferroni results for RAI02 and adherence to preventive measures. The Kruskal–Wallis H test demonstrated very strong evidence of differences in means for two of the preventive measures ‘I practice social distancing and keep a distance of at least one meter from others’ (
p ≤ 0.001), and ‘I avoid touching my eyes, nose, and mouth unless I wash my hands before’ (
p = 0.007).
Table 13 provides the Kruskal–Wallis H test along with the post-hoc Dunn–Bonferroni results for RAI02 and vaccine status and motivations. While the Kruskal–Wallis H test showed evidence of a difference in means for the item ‘I decided to get vaccinated so I can resume my usual pre-COVID-19 life as soon as possible’, the post-hoc tests did not show a difference between the pairs. For the item ‘I decided to get vaccinated because most of my family and friends are getting vaccinated’, the Kruskal–Wallis test demonstrated very strong evidence of differences in means for at least one group (
p ≤ 0.001). Dunn’s pairwise tests adjusted using the Bonferroni correction demonstrated very strong evidence of a difference in means between the following pairs: Q2 and Q4 (
p = 0.000); Q3 and Q1 (
p = 0.000) and between Q1 and Q3 (
p = 0.001).


