Article

Sex Differences in the Expression of c-fos in a Rat Brain after Exposure to Environmental Noise

by
David Fernández-Quezada
,
Sonia Luquín
,
Yaveth Ruvalcaba-Delgadillo
,
Joaquin García-Estrada
and
Fernando Jauregui-Huerta
*
Neuroscience Department, University Center of Health Sciences, University of Guadalajara, Sierra Nevada 950, Guadalajara 44340, Jalisco, Mexico
*
Author to whom correspondence should be addressed.
Sustainability 2022, 14(5), 2798; https://doi.org/10.3390/su14052798
Submission received: 9 November 2021 / Revised: 21 February 2022 / Accepted: 24 February 2022 / Published: 27 February 2022
(This article belongs to the Special Issue Sustainable Living Environments: Holistic Noise Pollution Management)

Abstract

:
Noise is an inarticulate stimulus that threatens health and well-being. It compromises audition and induces a strong stress response that activates the brain at several levels. In the present study, we expose male and female rats to environmental noise in order to investigate if acute or chronic stimulation produces differential brain activation patterns. The animals were exposed to a rat’s audiogram-fitted adaptation of a noisy environment and later sacrificed to quantify the expression of the brain activity marker c-fos. Additionally, the serum corticosterone (CORT) levels were measured to elucidate possible the stress-related effects of noise. It was found that environmental noise differentially increased the serum CORT levels in male and female rats. We identified 17 brain regions outside the classical auditory circuits with a high expression of c-fos, including the hypothalamus, prefrontal cortex, habenular complex, septum, cingulate cortex, nucleus accumbens, insular cortex, amygdala, and hippocampus. Overall, we evidenced that females exhibit less intense c-fos expression in most of the examined areas. We concluded that females might be less affected by the changes produced by environmental noise.

1. Introduction

Noise is one of the most important pollutants in the modern world [1]. Undesired sounds are everywhere. They derive from work environments, loud music, traffic (airway, railway, and roadway), or domestic appliances that exceed tolerable thresholds [2]. When sounds are excessive, they become annoying and interfere with adaptation [3]. While the effects of noise on auditory organs have been well attended, changes in brain circuitries outside audition remain less understood.
It is known that the brain is the most adaptable organ in the body, but also a major target for environmental threats. It integrates information and coordinates complex responses to ensure adaptation. The auditory system is a clear example of this. It obtains information about the environment from complex sound waves reaching the ears [4]. After reaching the ears, sounds follow the classical auditory pathway that connects inputs from the auditory nerve with serial stations in the brainstem (cochlear nucleus, inferior colliculus, geniculate body, and superior olivary complex) and the auditory cortex [5]. For an optimal adaptation, sounds may follow alternative pathways involving deep brain structures that enrich the sound experience. In undesired or traumatic sounds, stimuli could take these alternative pathways and even separate at the cochlear level [6]. Then, noxious sounds activate neural structures outside the classic auditory circuits, including the neuroendocrine stress regulatory system. Stress hormones (i.e., corticosterone) may exert numerous effects in the central nervous system, since many brain areas possess receptors to these hormones.
Immediate early gene (IEG) expression may be a powerful tool to identify extra-auditory structures activated by noise. The IEG c-fos and its protein product, c-fos, are reliable markers for neuronal activity [7]. It is expressed in low amounts during basal activity. However, it progresses after neural activity generated by extensive signals of physiological or environmental stimuli, inducing a rapid (~2 h) or long-lasting up-regulation of the c-fos protein members (c-fos, fos B, fra-1, and fra-2) [8]. Immunohistochemical identification of c-fos may help to reveal complementary brain regions activated by noise and to establish differences related to how individuals process undesired sounds [9].
Gender has been recognized as one of the most significant modulators of brain activity. It is known that females differ from males in a variety of conditions. Stress response and sound processing are well-documented examples of sex driven differences [10,11]. For instance, human females have better pure-tone thresholds at frequencies above 1–2 kHz, whereas males may be better below these frequencies [12]. Similarly, female auditory organs seem to be more resistant to deterioration over the years [13]. Consequently, environmental stressors could also trigger different activation patterns in brains of both genders. To gain knowledge on this, the present study employs the c-fos protein mapping to investigate the differences on how male and female brains respond to environmental noise.

2. Materials and Methods

2.1. Animals

The experiments were performed in 90-days-old Wistar rats. A total of 20 males and 20 females weighing 300.2 g ± 27.16 g were randomly divided and divided into 4 groups: acute effect of noise throughout 2 h (males n = 4; females n = 4) and 12 h (males n = 4; females n = 4) of exposure, and chronic effect of noise throughout 7 days (males n = 4; females n = 4) and 21 days (males n = 4; females n = 4) of exposure. Additionally, a non-exposed group was used as a control (males n = 4; females n = 4). All groups were maintained in a 12:12 light–dark cycle with lights on at 06:00 h. The temperature in the experimental room was maintained at 24 ± 2 °C and humidity at 70%. We guaranteed free access to tap water and balanced food. The cages were always changed in the testing room. All animal experiments obeyed the National Institute of Health guide (NIH Publications No. 8023, revised 1978) for the care and use of laboratory animals, and were approved by the health sciences ethics, biosafety and scientific board at the University of Guadalajara (CI. 068-2014). Figure 1 illustrates the procedure.

2.2. Noise Exposure

To produce a noisy environment, we exposed the animals of both sexes to an audiogram-fitted device provided with representative sounds of urban environments (i.e., turbines, hooters, horns, and others), as described by Rabat [14]. The administered sounds considered the rats’ lower capacity to detect low frequencies (under 500 Hz) and their improved capacity to perceive high frequencies (over 8000 Hz). We used metal grid cages to avoid sound refraction and housed the animals in groups of 4 in a soundproofed room. Professional tweeters (Yamaha, Inc. Osaka, Japan) were placed 1 m above the cages and connected to a Mackie amplifier (Mackie M1400; freq. 20 Hz to 70 kHz; 300 W at 8 Ω). The speakers’ characteristics and the tweeter allowed the sounds to be reproduced at frequencies between 20 and 50,000 Hz. Recordings of noisy environments were played randomly with noise exposures (18–39 s of a turbine, hooter, or horn sounds) and intervals of silence ranging from 20 to 165 s. Sound intensities were presented in a range of 70 to 105 dB to avoid cochlear damage. This protocol was offered for 2 h to the acute group 1, and for 12 h to the acute group 2; the chronic exposed groups remained in the noise chamber for 7 days (chronic group 1) and 21 days (chronic group 2) (Figure 1). A sound level meter was placed at every corner of the cages to ensure that all the animals received the same exposure dose. To avoid housing confounds, all the rats were transferred to the testing room 48 h before the start of the stimuli.

2.3. c-Fos Immunohistochemistry

For the neuronal activity evaluation of the exposed rats, the protein product (c-Fos) of the proto-oncogene, c-Fos, was immunohistochemically analyzed. We initiated exposures at 6:00 a.m. and perfused the animals when the time intervals (2 h, 12 h, 7 d, and 21 d) were completed. Immediately after exposure to the environmental noise, the rats were anesthetized with sodium pentobarbital (60 mg/kg) and transcardially perfused with 0.1 M phosphate-buffered saline (PBS), followed by 3.8% paraformaldehyde (PFA) in PBS pH 7.4. The brains were removed and postfixed in 3.8% paraformaldehyde for 2 h. Sections were cut at 40 μm in the coronal plane using a vibratome Leica VT1000E. Every third section (120 μm intervals) spanning from Bregma 2.6 mm to Bregma −3.8 mm [15] was collected in PBS. Endogenous peroxidase activity was blocked by incubating the sections in 3% hydrogen peroxide and PBS for 30 min. The sections were incubated in citrate buffer (10 mM citric acid, 0.05% Tween 20, pH 6.0) for 20 min at 85 °C. The blocking sections were incubated with 10% normal goat serum (NGS) in Tris-buffered saline (0.05 M, 0.9%, pH 7.4) plus 0.3% of Triton X-100 (TBST) for 30 min at 37 °C and 30 min at room temperature (25–28 °C). The sections were incubated in TBST + 1% NGS at 4 °C that contained a c-fos rabbit polyclonal antibody (Santacruz Biotechnology, Santa Cruz, CA, USA, polyclonal E-8, cat: sc-166940) for 18 h at 4 °C. Incubation was stopped and washed 3 times for 10 min with TBST, and sections were incubated in biotinylated a goat anti-rabbit antibody (1:500; Vectastain, Vector Laboratories Burlingame, CA, USA, cat: BA-1000) for 2 h at room temperature. The sections were then washed and incubated in the avidin-biotin–peroxidase complex (1:100, Vectastain Elite Kit, Vector Laboratories, cat: PK-6200) TBST solution for 1 h at room temperature. The reaction was visualized using diaminobenzidine 0.05% (Sigma Aldrich, Darmstadt, Germany; 500 μg/mL). The sections were washed and mounted with Permount mounting medium. The sections from experimental and control rats were processed simultaneously to ensure access to the same sets of solutions.

2.4. c-Fos+ Cell Analysis

The stained tissues from all of the groups were photographed with a Leica DFC 7000T camera attached to a DMi8 microscope. All the slices in every group were first checked to identify the regions that expressed the c-fos mark (from Bregma +2.6 mm to Bregma −3.10 approx. 1.8 cm of the brain). In every region identified, we counted the c-fos+ cells on an average of 8 to 10 coronal slices. Both hemispheres were quantified for every region expressing the mark. The 10X (0.864 μm/px) objective was used to obtain 2 photographs per region in an 8 bit grayscale. No adjustments (contrast, intensity, or gamma correction) were applied to the images. Every photograph represented a microscopic field, in which the dimensions of each region were completely covered. Image analysis was performed using ImageJ software and the plug-in: Cell Counter Notice (https://imagej.nih.gov/ij/ (accessed on 8 November 2021), 15 August 2018, ver.1.44, National Institutes of Health, Bethesda, MD, USA). The results were averaged and compared between the groups.

2.5. Corticosterone Assays

The blood samples were obtained from the animal’s tail and were gently warmed for 1 min in water at 40 °C. The tail was dried and cut with a razor blade, and an approximate 200 μL volume was collected in Eppendorf 1.5 mL tubes. The blood was allowed to clot for 3 min and centrifuged at 1000–2000× g for 10 min in a refrigerated centrifuge. Serum samples were frozen at −80 °C until all groups were collected. The serum corticosterone levels were measured using an enzyme immunoassay kit (Enzo Life Sciences Catalog No. ADI-900-097) following the manufacturer’s instructions. Blood samples were collected throughout exposure to noise at 2 h, 12 h, 7 d, and 21 days (always between 07:00 and 08:00 h, except for the 12 h group). Our corticosterone kit’s reported sensitivity was established at 27.0 pg/mL (range: 32–20,000 pg/mL).

2.6. Data Analysis

All the results were expressed as the mean ± standard error of the mean (SEM). The c-fos expression and serum levels of CORT data were analyzed by using a two-way ANOVA (sex (male/female) × noise condition (0 h, 2 h; 12 h; 7 d; 21 d)). The Dunn–Šidák correction and post hoc test were employed to evaluate the simple main effects. Values of * p < 0.05 (** p < 0.01, *** p < 0.001) were considered statistically significant. The statistical calculations were performed using SPSS software version 25 (SPSS Inc. Chicago, IL, USA) and, for the design and export of figures, we used GraphPad software Inc. Prism Version 7, San Diego, CA, USA.

3. Results

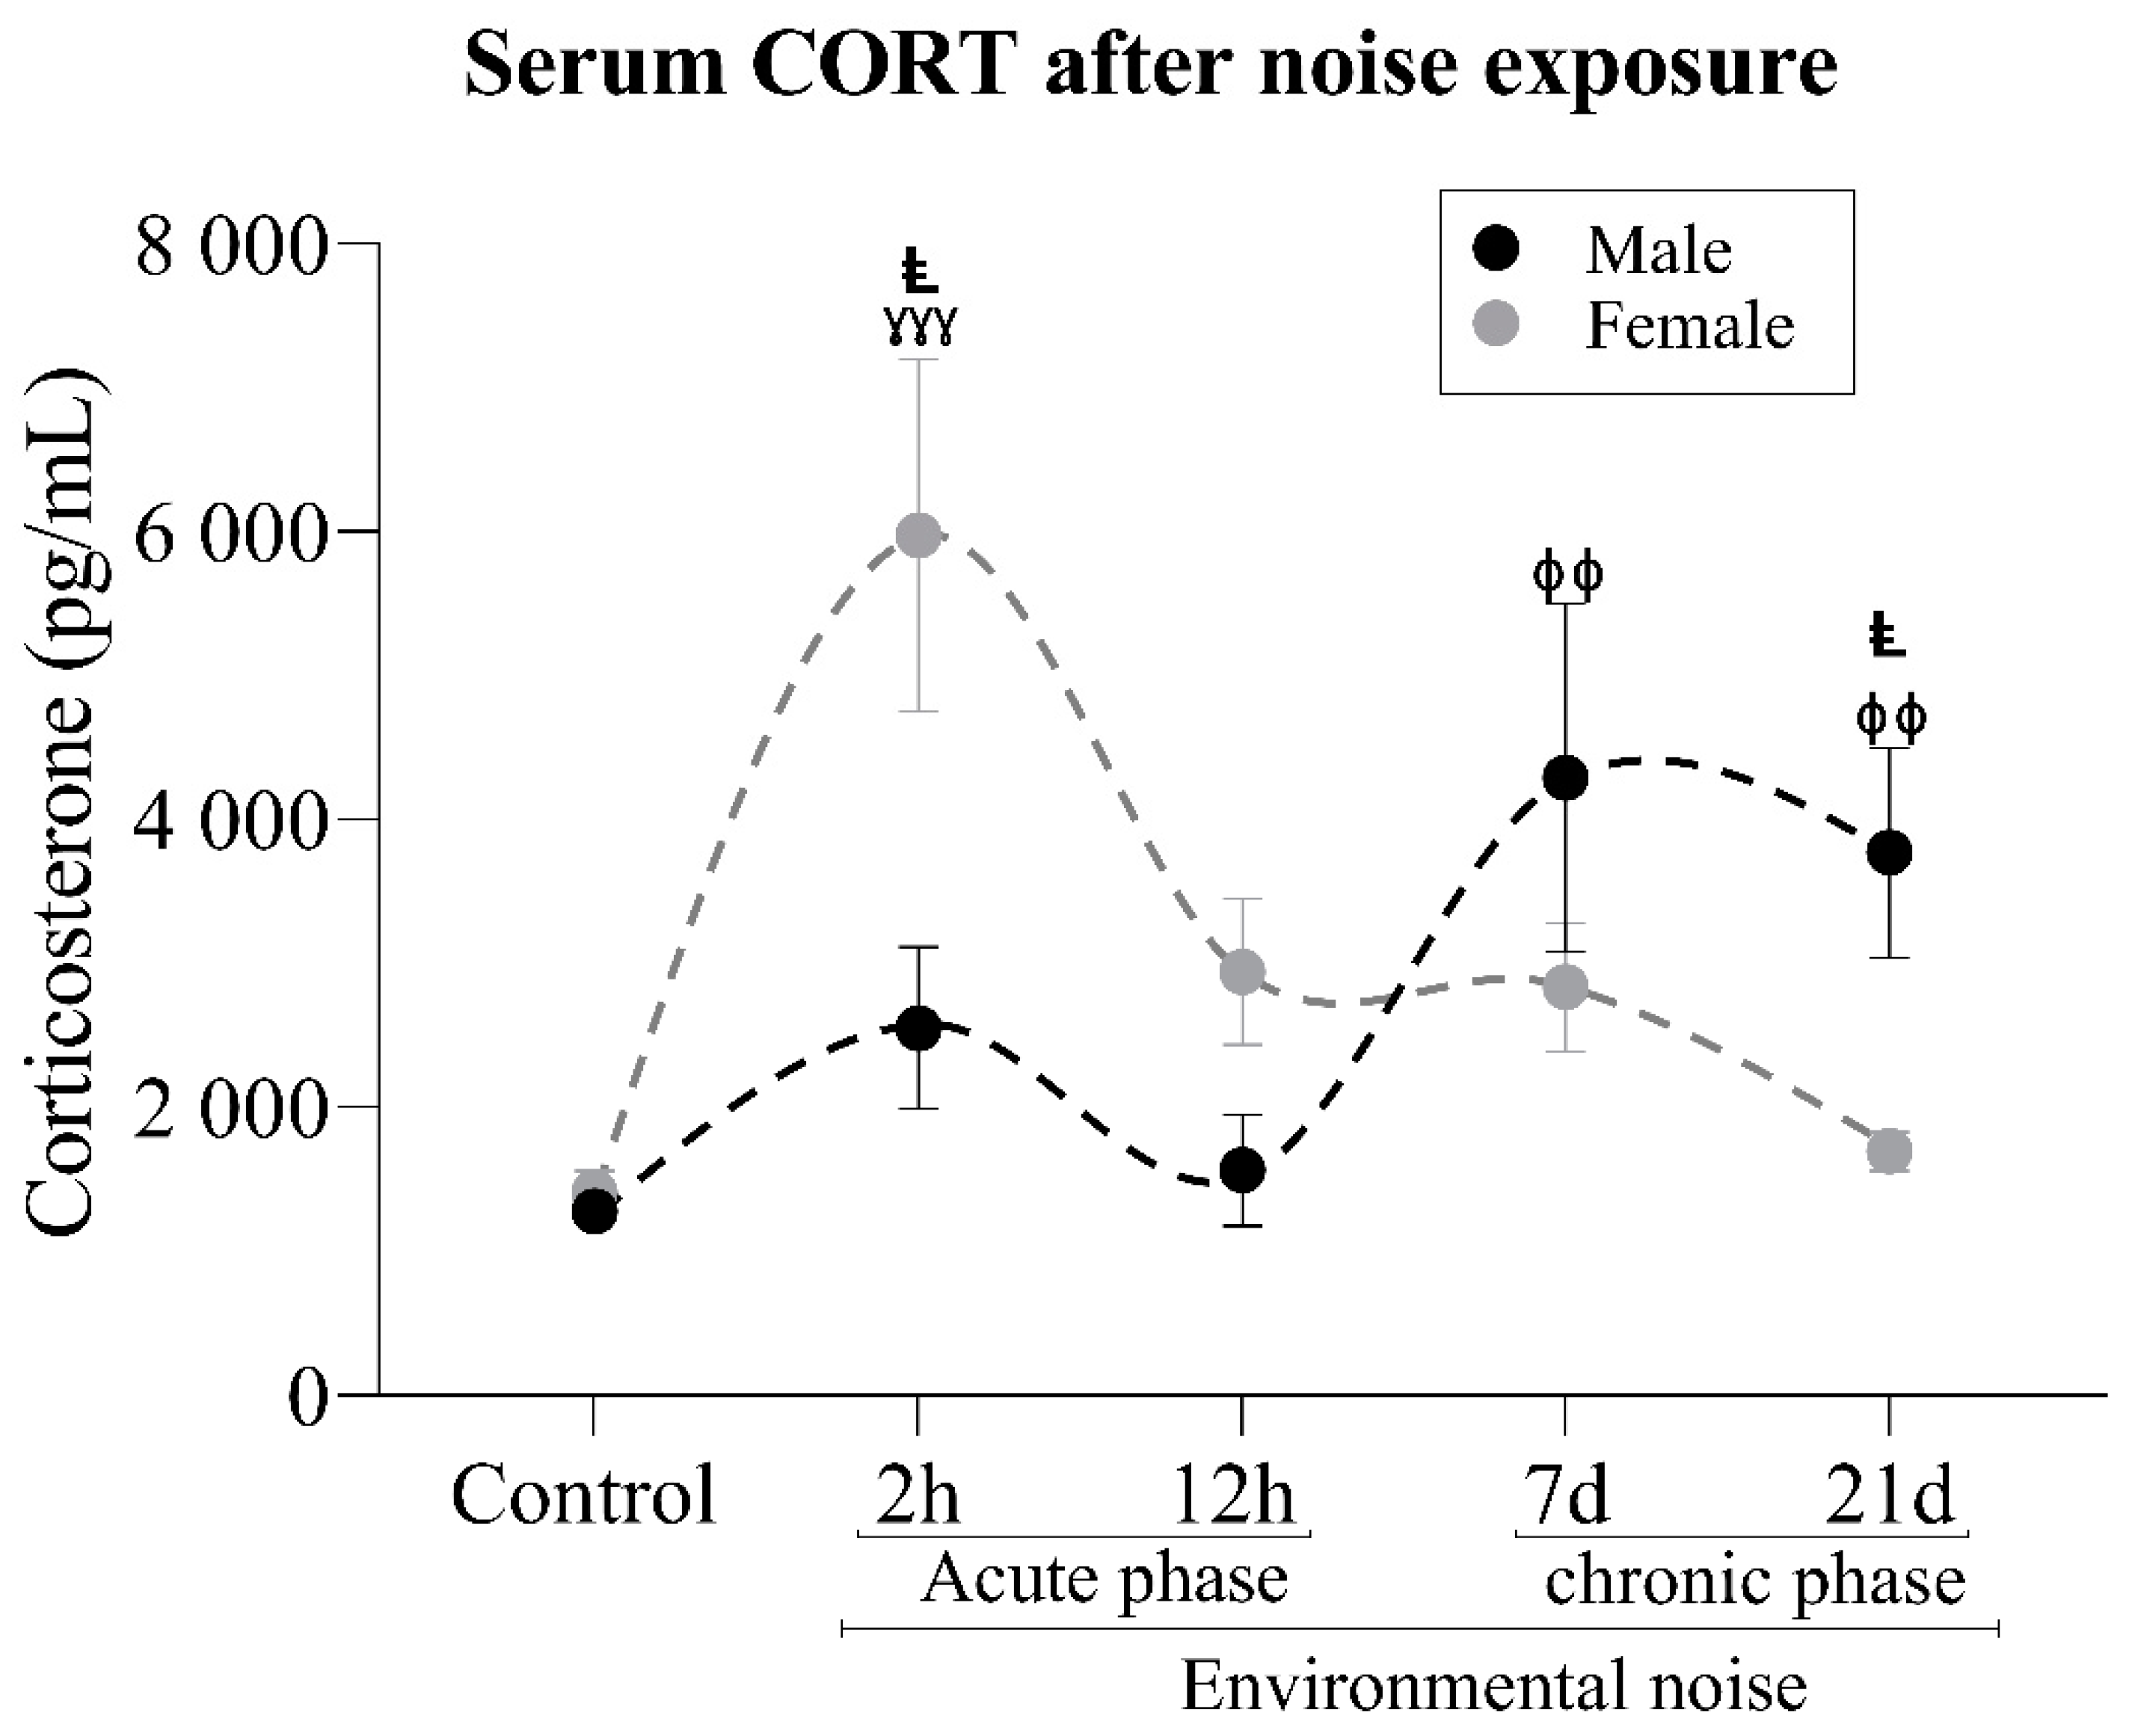
3.1. Corticosterone Analysis

The two-way ANOVA analysis showed no significant effect of sex on the serum CORT levels (main effect of sex, F(1, 110) = 0.4425, p = 0.5073). Nevertheless, the time of exposure significantly altered the CORT levels (main effect of time, F(4, 110) = 5.738, p = 0.0003). This effect differed between the males and females (sex × time interaction, F(4, 110) = 5.488, p = 0.0003). Post hoc comparisons showed that noise-exposed males increased their CORT levels on day 7 (p < 0.001) and 21 (p < 0.009). On the other hand, female differences were observed only after 2 h of exposure (p < 0.001). Between the sexes, differences were significant at 2 h when exposed females outpointed exposed males (p < 0.01). Figure 2 illustrates the results of the CORT analysis.

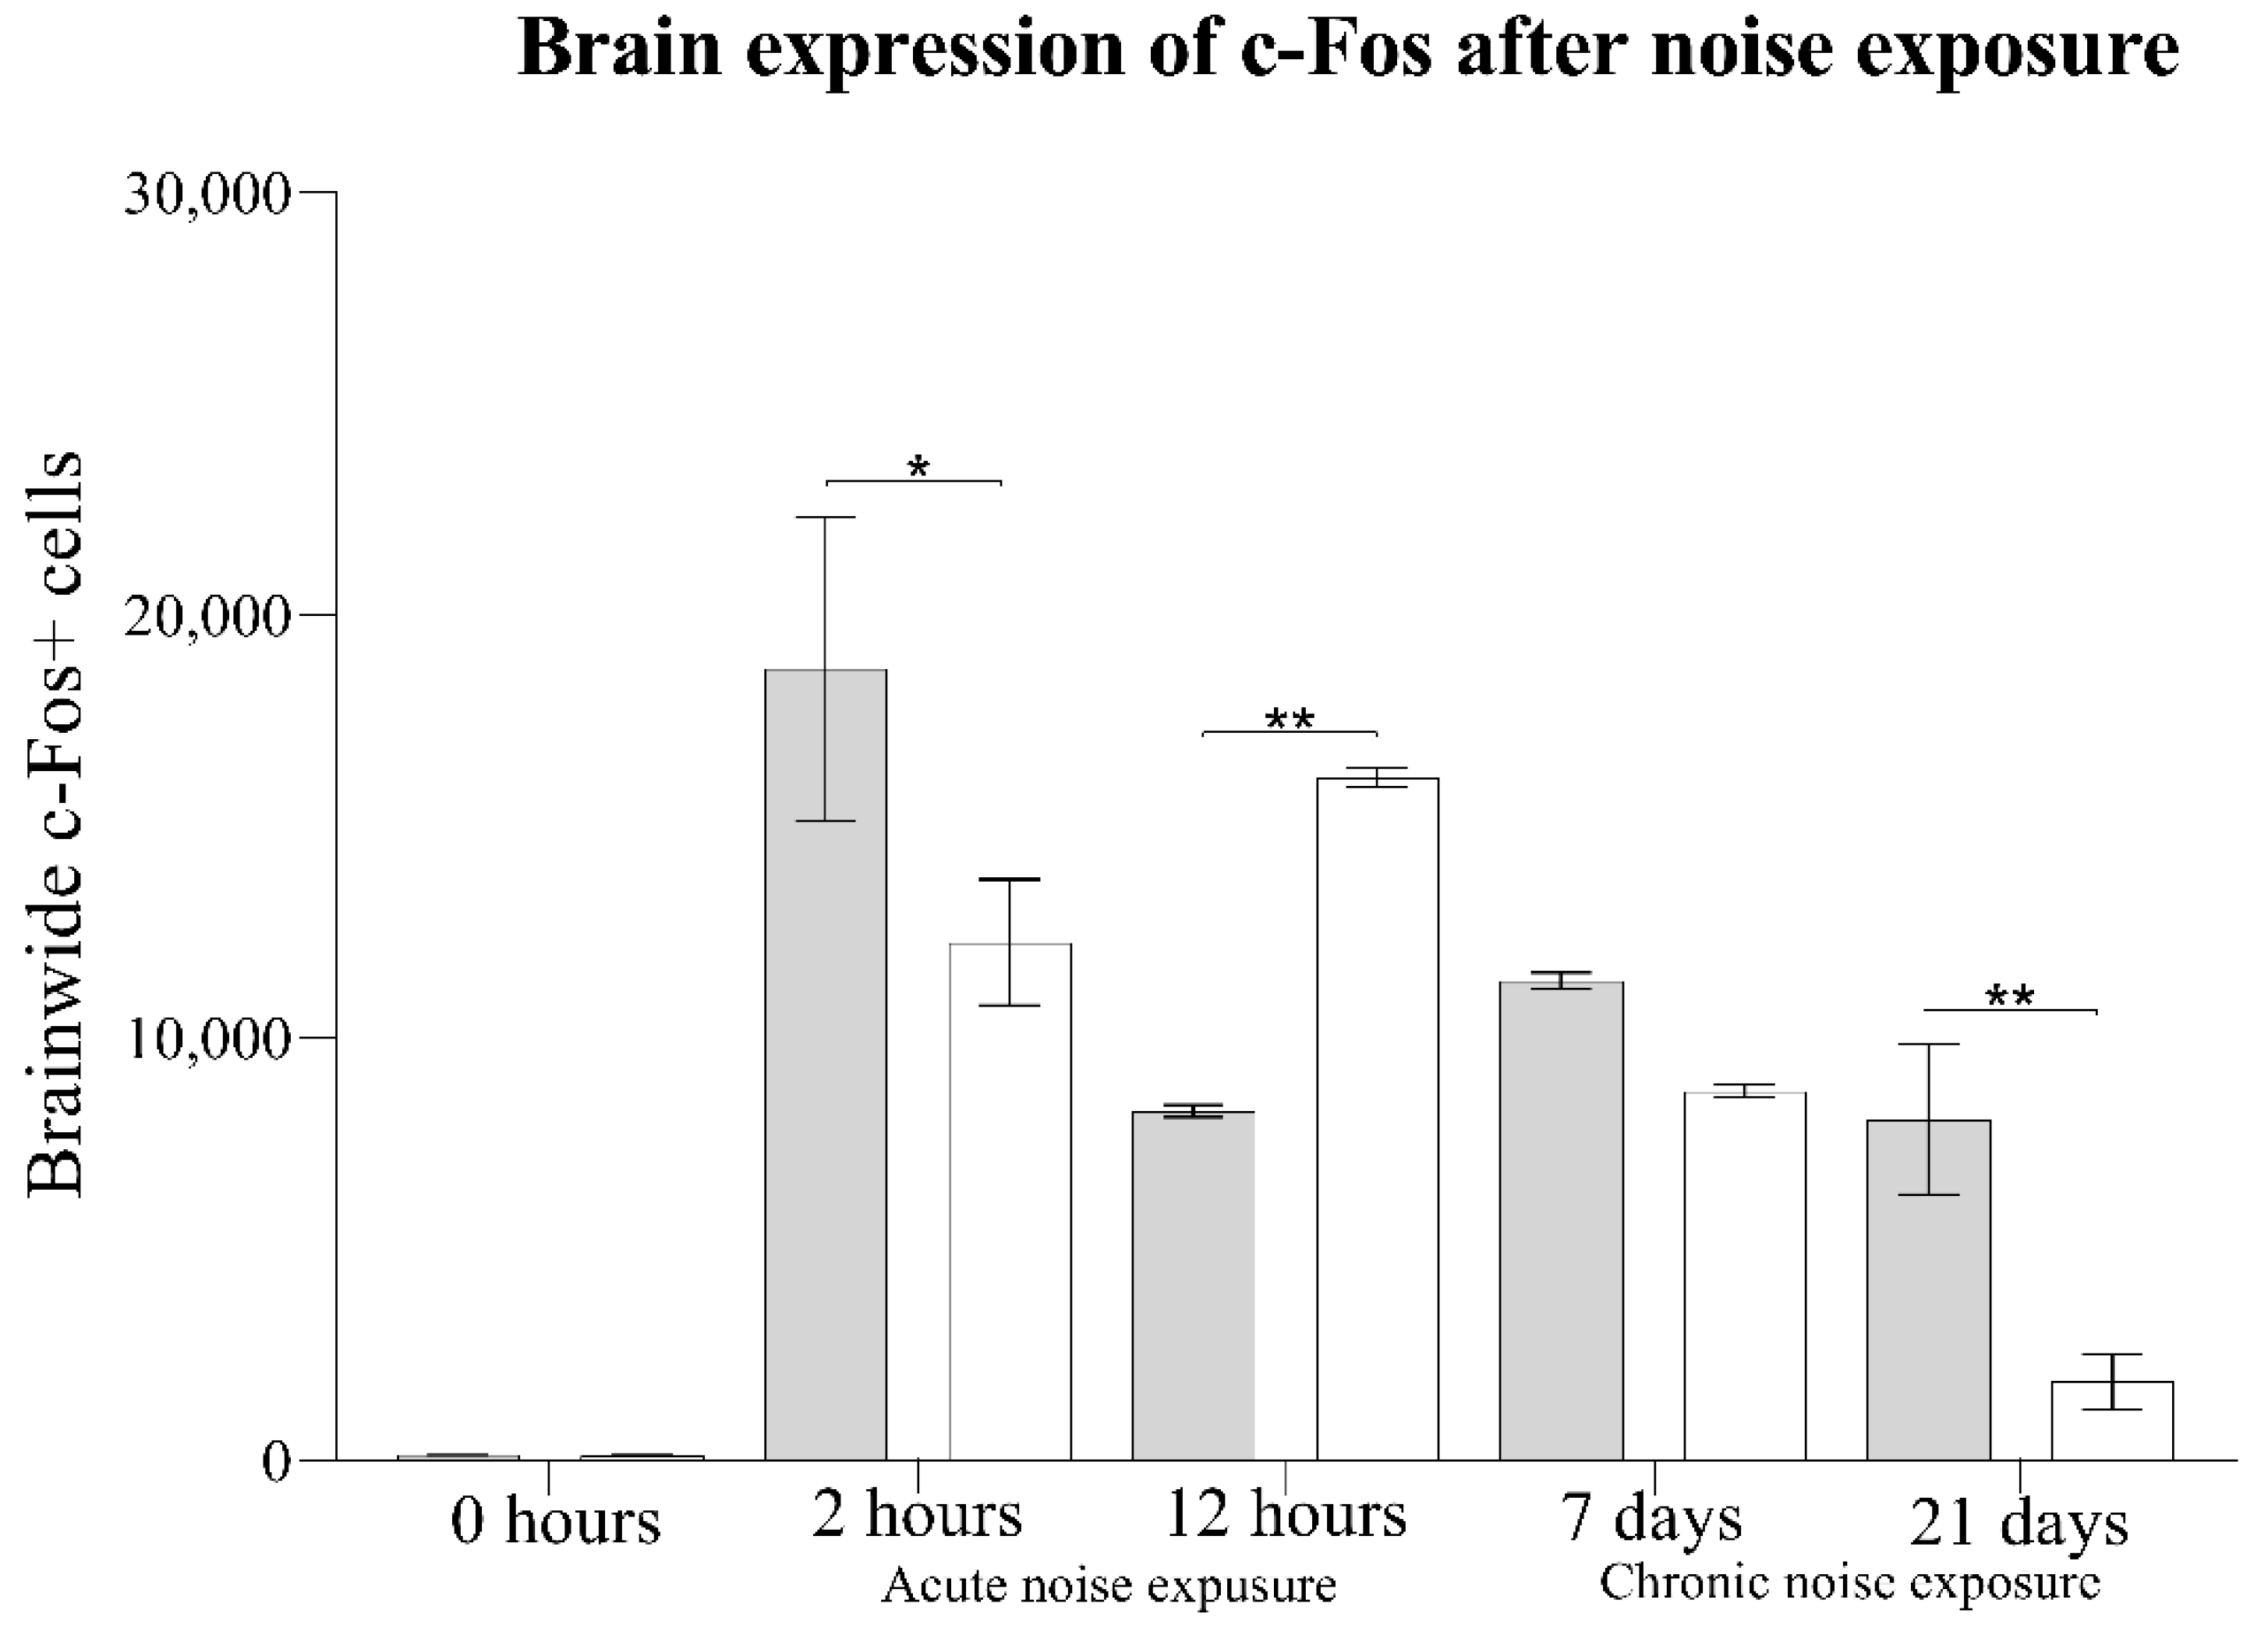
3.2. Brainwide Quantification of c-Fos+ Cells

First, we compared the total number of c-fos+ cells across the entire brain of the exposed subjects (Bregma +2.6 mm to Bregma −3.10). Two-way ANOVA evidenced that c-fos expression did not differ as a function of sex (main effect of sex, F(1, 30) = 1.730; p = 0.1984), but was significantly affected by the time (main effect of time, F(4, 30) = 29.61; p < 0.0001) and interaction (sex × time interaction, F(4, 30) = 6.787, p = 0.0005). Post hoc comparisons showed that males exposed to noise increased their expression levels at 2 h, 12 h, 7 d, and 21 d (p < 0.0001). Females also increased their expression levels at 2 h, 12 h, 7 d, and 21 d (p < 0.0001). The differences between the sexes were registered at 2 h, and 21 d when males showed higher c-fos expression levels than females (p < 0.01); and at 12 h when females expressed higher levels than males (p < 0.01). Figure 3 and Figure 4 illustrate this.
Next, we identified the regions in which the c-fos changes were pronounced. Regions that increased the c-fos expression included the caudate nucleus (CPu); lateral septum (LSV); claustrum (VCL); olfactory bulb (AOM); amygdala (MLA); habenula (Hb); dentate gyrus (DG); Cornu Ammonis (CA3, CA2, CA1); prelimbic cortex (PrL); infralimbic cortex (IL); cingulate cortex (Cg); insular cortex (INS); piriform cortex (Pir); secondary auditory cortex (AuD); primary auditory cortex (AU1); the paraventricular nucleus of the hypothalamus (PVN); ventromedial nucleus (VMH); and paraventricular nucleus of the thalamus (PV). Figure 4 illustrates the key regions that show c-fos expression after noise exposure. The results of the c-fos measures are summarized in Table 1 and described below.

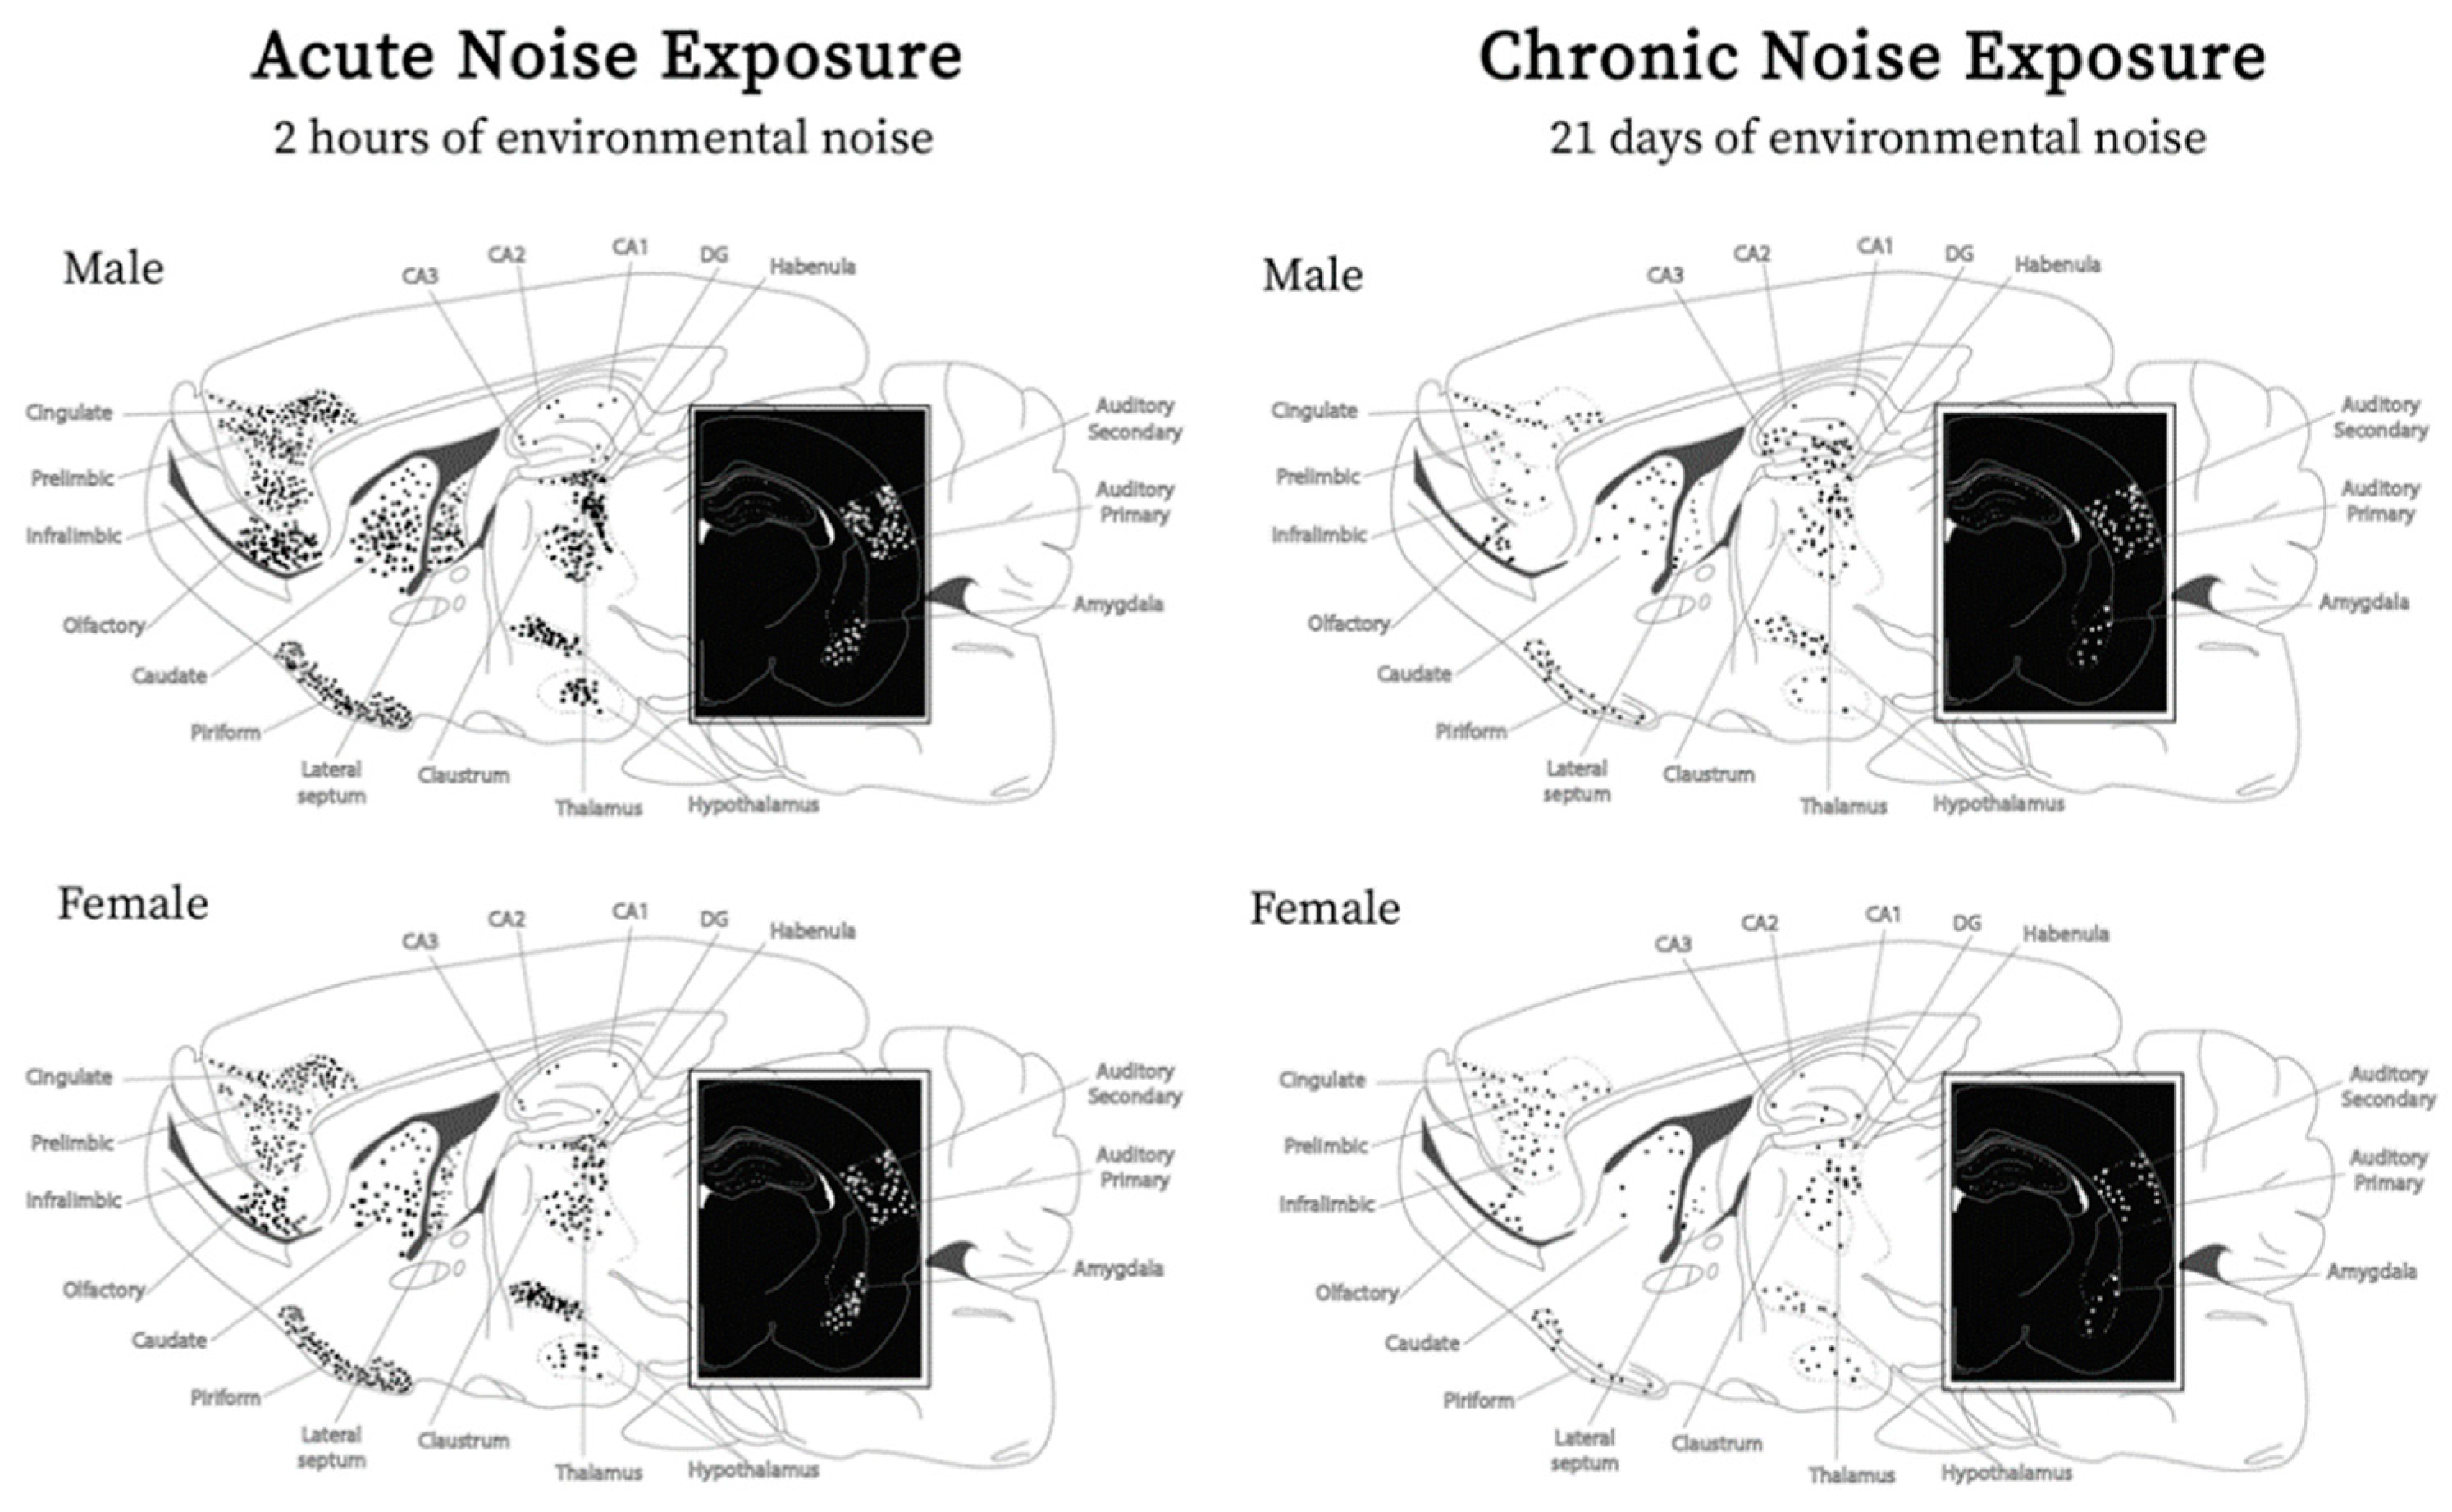
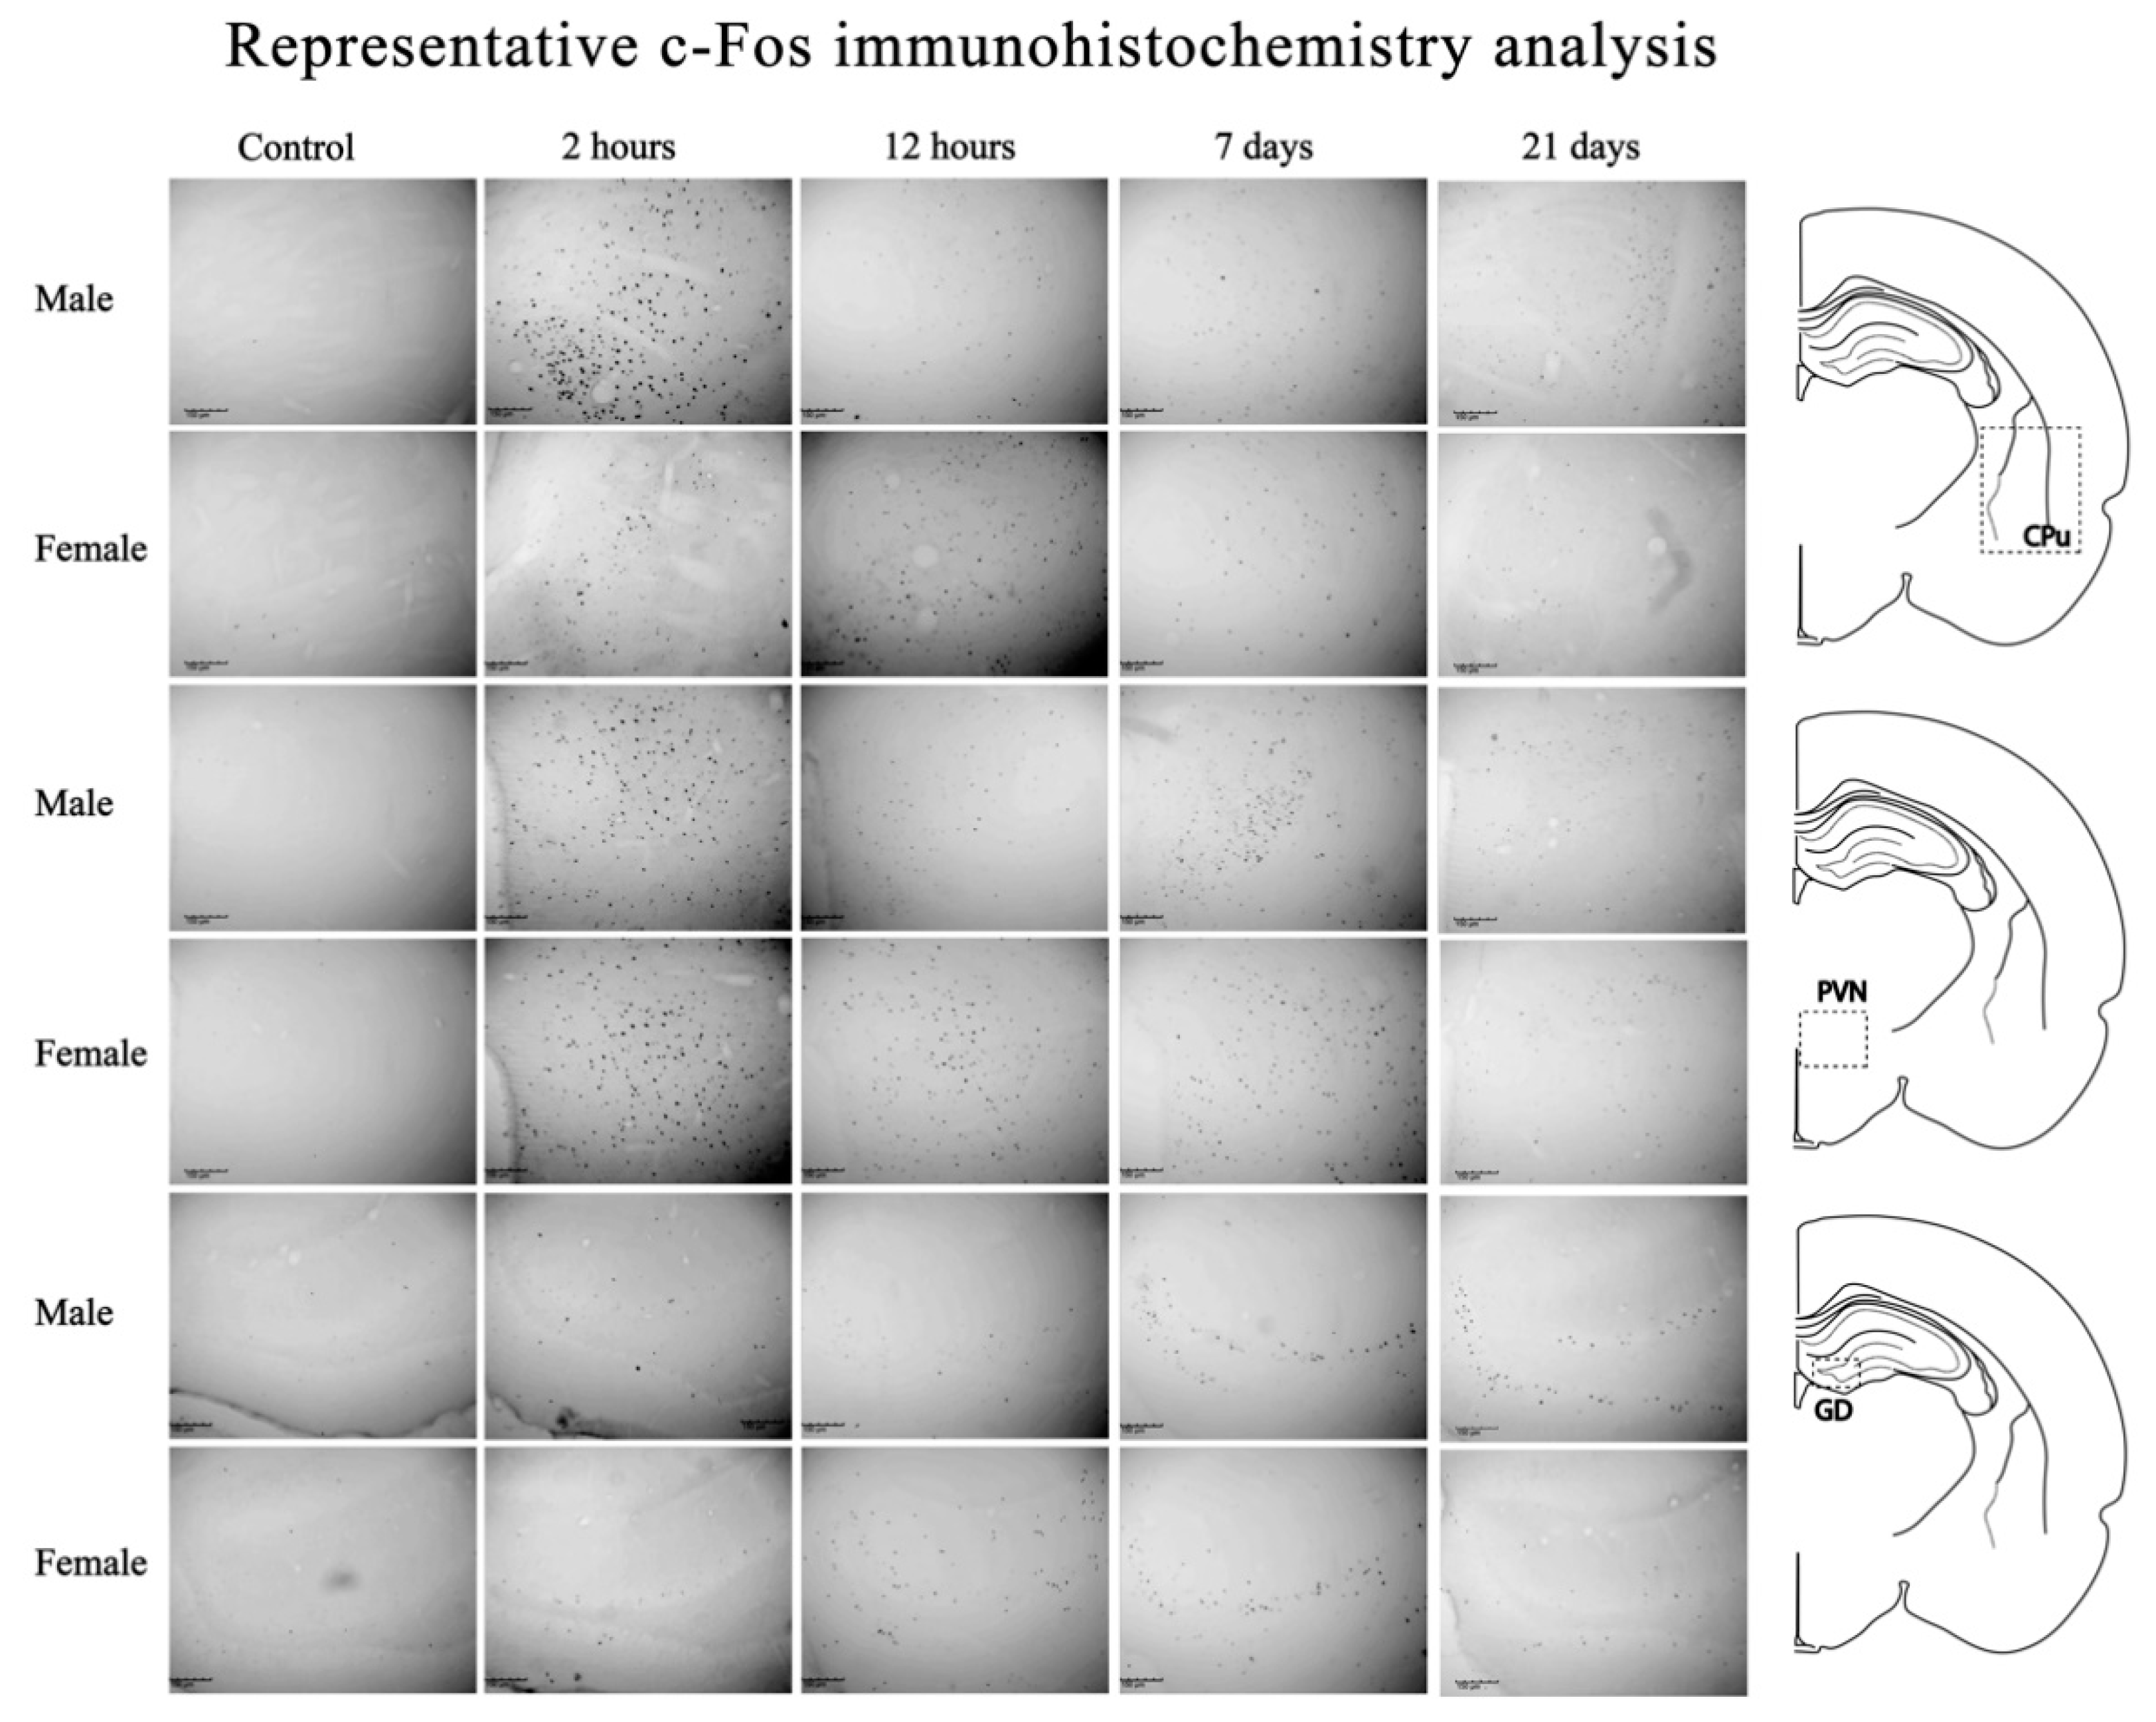
Brain Regions Affected by Noise

In the olfactory bulb, two-way ANOVA evidenced differences due to sex (the main effect of sex, F(1, 290) = 7.771, p = 0.0057) time (main effect of time, F(4, 290) = 73.84, p = 0.0001), and the interaction (sex × time interaction, F(4, 290) = 20.51, p = 0.0001). Šidák post hoc comparisons showed that males exposed to noise increased their expression levels at 2 h, 12 h, 7 d (p < 0.0001), and 21 d (p < 0.0154). Females exhibited higher expression levels at 2 h, 12 h, and 7 d (p < 0.001). The differences between the sexes were registered at 2 h and 7 d when males showed higher c-fos expression levels than females (p < 0.0001).
In the lateral septum, there was a significant effect of sex (F(1, 290) = 18.48, p = 0.0001), time (F(4, 290) = 70.97, p = 0.0001), and interaction (sex × time interaction, F(4, 290) = 19.84, p = 0.0001). Post hoc comparisons showed that exposed males increased their c-fos levels at 2 h, 12 h, 7 d, and 21 d (p < 0.001). Females also registered increases at 2 h, 12 h, and 21 d (p < 0.001). Intersex comparisons showed that males overexpressed c-fos at 2 h and 7 d, compared to females (p < 0.001).
In the claustrum, the density of c-fos+ cells did not differ between males and females (main effect of sex, F(1, 290) = 0.3096, p = 0.5783). Time significantly altered c-fos expression (main effect of time, F(4, 290) = 141.6, p = 0.0001), and this effect differed between males and females (sex × time interaction, F(4, 290) = 58.33, p = 0.0001). Increases were registered in males at 2 h, 12 h, 7 d (p < 0.001), and 21 d (p < 0.0154). Females also increased their expression levels at 2 h, 12 h, and 21 d (p < 0.001). Male vs. female comparisons revealed higher levels in males at 2 h and 7 d (p < 0.001).
In amygdala female rats had greater c-fos expression compared to males (main effect of sex, F(1, 290) = 39.77, p = 0.0001). Time of exposure altered the density of c-fos+ cells (main effect of time, F(4, 290) = 195.4, p = 0.0001) and this effect differed between males and females (sex × time interaction, F(4, 290) = 26.64, p = 0.0001). Both males and females increased their expression levels at 2 h, 12 h, 7 d, and 21 d (p < 0.001), with respect to controls. Increases were higher in females at 12 h and 7 days (p < 0.001), in comparison to males.
In the habenula, there was no significant effect of sex (F(1, 290) = 0.2757, p = 0.5999), but there was an effect of time (F(4, 290) = 86.58, p = 0.0001) and interaction (sex × time interaction, F(4, 290) = 15.26, p = 0.0001). Follow-up comparisons indicated that males increased their expression levels at 2 h, 12 h, 7 d (p < 0.001), and 21 d (p < 0.0154) in comparison to control, and after 21 days in comparison to females (p < 0.001). Otherwise, females showed higher levels at 2 h, 12 h (p < 0.001), and 7 d (p < 0.0038) compared to control and at 12 h (p < 0.0001), and 21 days (p < 0.0014) compared to exposed males.
In the caudate nucleus, the density of c-fos+ cells differed between the sexes (main effect of sex, F(1, 290) = 15.97, p = 0.0001), was affected by time (main effect of time, F(4, 290) = 69.87, p = 0.0001), and was significant for the interaction (sex × time interaction, F(4, 290) = 23.15, p = 0.0001). Exposed males increased their expression levels after 2 h, 12 h, 7 d, and 21 d (p < 0.001). Exposed females also increased their c-fos levels at 2 h, 12 h, 7 d, and 21 d, compared to control (p < 0.001). These increases were higher in females at 12 h and 7 days (p < 0.001) compared to males (Figure 5).
In the dentate gyrus, there was also a significant effect of sex (F(1, 290) = 19.14, p = 0.0001), time (F(4, 290) = 160.4, p = 0.0001), and interaction (sex × time interaction, F(4, 290) = 35.78, p = 0.0001). Males and females increased their expression levels at 2 h, 12 h, 7 d, and 21 d (p < 0.001). Males increased their numbers at 7 and 21 days (p < 0.001) compared to females (Figure 5).
In CA3 (the cornus amonis region 3) we found changes as a function of sex (main effect of sex, F(1, 290) = 31.19, p = 0.0001), time (main effect of time, F(4, 290) = 73.71, p = 0.0001), and interaction (sex × time interaction, F(4, 290) = 38.95, p = 0.0001). Male rats showed significant increases after 2 h, 12 h, 7 d, and 21 d of exposure (p < 0.001). Additionally, females augmented their expression levels after 2 h, 12 h, and 21 d (p < 0.001). Compared to females, males increased their numbers at 2 h and 21 d (p < 0.001).
In CA2 (cornus amonis region 2) there was a significant effect of sex (F(1, 290) = 54.82, p = 0.0001), time (F(4, 290) = 94.84, p = 0.0001), and interaction (F(4, 290) = 36.39, p = 0.0001). Males showed increases at 2 h, 12 h, 7 d (p < 0.001), and 21 d (p < 0.0154). Females also increased their c-fos levels at 2 h, 12 h (p < 0.001), and 7 d (p < 0.0038), with respect to controls. The increases were greater in males at 2 h and 7 d (p < 0.001), compared to females.
In CA1 (cornus Amonis region 1), there was a significant effect of sex (F(1, 290) = 6.362, p = 0.0001), time (F(4, 290) = 19.02, p = 0.0001), and interaction (F(4, 290) = 14.83, p = 0.0001). Increases in male levels were significant at 2 h, 7 d, and 21 d (p < 0.001). Females registered increases only at 12 h (p < 0.0129). Changes were higher in males at 2 h and 21 days (p < 0.001), with respect to females.
In the prelimbic cortex, there was no significant effect of sex (F(1, 290) = 0.2748, p = 0.6005), but time (F(4, 290) = 51.18, p = 0.0001) and interaction (F(4, 290) = 23.18, p = 0.0001) were significant. Males registered increases at 2 h, 7 d, and 21 d (p < 0.001). Female changes were significant at 2 h, 12 h, and 21 d (p < 0.001). Intersex differences were observed at 12 h and 7 d (p < 0.0001).
In the infralimbic cortex, the density of c-fos+ cells did not differ between males and females (F(1, 290) = 0.1482, p = 0.7005), but time (F(4, 290) = 78.01, p = 0.0001) and interaction (F(4, 290) = 27.04, p = 0.0001) were significant. Male increases in c-fos levels were significant at 2 h, 12 h, 7 d, and 21 d (p < 0.001). Females registered increases at 2 h, 12 h, and 21 d (p < 0.001). Intersex differences were observed at 2 h, 12 h, and 7 d (p < 0.0001).
In the cingulate cortex, the density of c-fos+ cells did not differ due to sex (F(1, 290) = 58.64, p = 0.4445), but was altered by time (F(4, 290) = 42.87, p = 0.0001) and interaction (F(4, 290) = 20.00, p = 0.0001). Exposed males increased their expression levels at 2 h, 7 d, and 21 d (p < 0.001). Exposed females also increased their c-fos levels at 2 h, 12 h (p < 0.001), 7 d (p < 0.0026), and 21 d (p < 0.0041). Changes were significantly elevated in males at 12 h (0.0001) and 7 days (p < 0.008), compared to females.
In the insular cortex, we found significant effects of sex (F(1, 290) = 5.034, p = 0.0256), time (F(4, 290) = 81.16, p = 0.0001), and interaction (F(4, 290) = 29.07, p = 0.0001). Males and females increased their expression levels after 2 h, 12 h, 7 d, and 21 d of exposure (p < 0.001). Differences between the sexes were registered at 12 h and 7 days (p < 0.0001) when males outpointed females.
In the piriform cortex, the number of c-fos+ cells did not differ between the males and females (F(1, 290) = 2.027, p = 0.1556), but was affected by time (F(4, 290) = 101.4, p = 0.0001) and interaction (F(4, 290) = 28.90, p = 0.0001). Males augmented their c-fos expression after 2 h, 12 h, 7 d, and 21 d (p < 0.001). Females also increased their c-fos levels at 2 h, 12 h (p < 0.001), and 7 d (p < 0.0185). These increases were greater in females at 12 h (p < 0.001).
In the auditory primary cortex, exposed males increased their expression levels after 2 h, 12 h, 7 d, and 21 d (p < 0.001). Exposed females also registered increases at 2 h, 12 h, 7 d (p < 0.001), and 21 d (p < 0.0324). The effects were higher in males at 2 h and 21 d (p < 0.001) than females.
In the auditory secondary cortex, we found the significant effect of sex (F(1, 290) = 0.2242, p = 0.6362), time (F(4, 290) = 164.2, p = 0.0001), and sex × time interaction (F(4, 290) = 24.55, p = 0.0001). Exposed males increased their expression levels after 2 h, 12 h, 7 d, and 21 d (p < 0.001). Female increases were significant at 2 h, 12 h, 7 d (p < 0.001), and 21 d (p < 0.0058). Males were more affected than females at 2 h, 12 h(p < 0.001), and 21 d (p < 0.0003).
In the hypothalamus paraventricular nucleus, male increases were significant after 2 h, 12 h, 7 d, and 21 d (p < 0.001), compared to controls. Female increases were significant at 2 h, 12 h, 7 d (p < 0.001), and 21 d (p < 0.0147). Males exhibited higher levels than females at 21 days (p < 0.001) (Figure 5).
In the hypothalamus ventromedial nucleus, there was no significant effect of sex (F(1, 290) = 1.198, p = 0.2745), but time (F(4, 290) = 80.88, p = 0.0001) and sex × time interaction (F(4, 290) = 15.74, p = 0.0001) were both significant. Follow-up comparisons evidenced that exposed males increased their expression levels after 2 h, 12 h, 7 d (p < 0.001), and 21 d (p < 0.0403). Females also increased their c-fos levels at 2 h, 12 h, 7 d (p < 0.001), and 21 d (p < 0.0065). These increases were statistically significant in females at 2 h (p < 0.0004) and 12 h (p < 0.0001), compared to males.
Finally, in the thalamus paraventricular nucleus, we found the significant effect of sex (F(1, 140) = 12.38, p = 0.0006), time (F(4, 140) = 67.75, p = 0.0001), and sex × time interaction (F(4, 140) = 8.409, p = 0.0001). Exposed males increased their expression after 2 h, 12 h, 7 d, and 21 d (p < 0.001). Exposed females also increased their c-fos levels at 2 h (p < 0.0138), 12 h (p < 0.0012), and 7 d (p < 0.0036). These increases were significantly higher in males at 2 h (p < 0.001), compared to females.

4. Discussion

Our results evidence a robust increase in the cerebral expression of c-fos as a consequence of environmental noise. Remarkably, noise produced strong increases in many brain areas proposed to regulate stress response: the hypothalamus, amygdala, hippocampus, habenula, insula, lateral septum, prefrontal cortex, cingulate cortex, claustrum, and caudate-putamen. These patterns of activation confirmed environmental noise as a potent stressor [16,17,18]. Measures showing that exposed rats elevated their serum CORT levels, confirmed that noise was able to activate the neuroendocrine stress regulatory system (Figure 2). Our results are supported by experiments demonstrating that artificial noise (i.e., white noise at 60 to 105 dBA) increases the c-fos expression in the hippocampus, hypothalamus, septal area, prefrontal cortex, and thalamus [16,19]. Then, we agree with the line of thought proposing that stressful audiogenic stimulus arriving at the auditory system may also use alternative pathways (for instance, the arcuate fasciculus, anterior cingulate, and prefrontal cortices) to activate the hypothalamic PVN and operate the complex stress regulatory system [18]. Then, it is possible that noise synergizes with conditions that are difficult to separate from the audiogenic experience (i.e., sleep deprivation and handling) to increase the c-fos/CORT response. Nonetheless, it is clear that in addition to the well-known effects of noise on audition, we should also be aware of the less-investigated effects of the concomitant stress.
Apart from confirming noise as a potent stressor, our results also evidence that c-fos fluctuates as a function of time. Similar to the other experiments, the rats evaluated in our experiment increased their expression levels at acute exposures, but diminished their counts at chronic exposures [19]. As expected, rapid increases (2 h) were registered in most of the analyzed areas, confirming the relevance of these regions in the processing of noxious sounds. However, and less expected, reduced levels were found at chronic exposures (21 days). This phenomenon attracts our attention, since it may suggest that subjects habituate over time and that the involved areas could be crucial for the adaptation/habituation to this stressor [20,21,22,23]. Fluctuations can also suggest that c-fos expression might presage/accompany the down-regulatory effect of stress on dendritic retraction, learning impairment, reduced neurogenesis, or impaired plasticity, commonly associated with the deterioration of these areas [24,25,26,27,28]. Then, chronic-fos expression changes could be interpreted as an indicator of a new functional state of a given structure [29]. In our experiment, the hippocampus adjusts to this idea since c-fos expression changes were initiated later, and maintained even when other structures dropped. Additional support for these time-dependent fluctuations can be extracted from reports showing that the fos family members may express protein variants at different time points. The c-fos protein used to be expressed during the first 2 h after an acute stimulus, while fosB used to be expressed for more extended periods. Instead, members of the fos family, fra-1 and fra-2, are expressed in response to chronic/repeated stimuli [8]. Consequently, differences could be justified at acute and chronic/repeated exposures. Additional experiments should be planned to fully elucidate the complex time-dependent dynamics of c-fos activation across the many brain regions identified in the present study.
Next, this experiment revealed that males and females were differentially affected by environmental noise. It seems that males exhibited the most pronounced effects. Differences between males and females were reported previously for sound processing [30,31] and stress response [32]. While, in some reports, females exhibited higher releases of CORT after stress [33,34], other experiments presented less effects on dendritic remodeling [35] or cognitive alterations [25,36,37]. In accordance with experiments showing fewer effects, our results suggest that females are more resilient to noise, since CORT rises and c-fos changes were significantly less intense. Available evidence on stress research sustains that rodents could be more or less sensitive to noisy conditions as a function of sex. Our results align with the data showing more intense effects on males [38]. Accordingly, other experiments reported less c-fos expression in females that faced novel stressors [39]. However, differing from models using foot and tail shock [33], neonatal handling [40], restraint, and immune challenge [41], where effects on males were less intense, our results suggest a stronger noise-specific effect for males. Coincidentally, there is an elegant series of experiments elucidating this. Babb and colleagues found that, contrary to males, females increased their CORT and c-fos expression levels after restraint stress, but not after noise [42]. Therefore, females could be more resistant than males to the adverse effects of noisy environments, but not to other stressors. Complementary experiments should elucidate this, keeping in mind that some structures are sexually dimorphic. According to our results, structures that include the hippocampus, amygdala, and habenula may represent key candidates to this outcome, since sex effects were noticeable for c-fos expression.
We conclude the following: (i) environmental noise is a potent stressor capable of activating at least 17 cerebral areas outside the classic auditory circuits; (ii) the sex (male/female) and time (acute/chronic) variables are strong modulators of these effects; and (iii) the effects of noise appear more pronounced and extended in males, at least in relation to rodents.

Author Contributions

Conceptualization, F.J.-H. and S.L.; methodology, D.F.-Q. and Y.R.-D.; software, D.F.-Q.; validation, J.G.-E., Y.R.-D., S.L., F.J.-H. and D.F.-Q.; formal analysis, F.J.-H. and D.F.-Q.; investigation, D.F.-Q.; resources, F.J.-H., S.L., J.G.-E. and Y.R.-D.; data curation, Y.R.-D., F.J.-H. and D.F.-Q.; writing—original draft preparation, F.J.-H.; writing—review and editing, D.F.-Q. and F.J.-H.; visualization, D.F.-Q. and Y.R.-D.; supervision, F.J.-H., S.L. and J.G.-E.; project administration, F.J.-H.; funding acquisition, F.J.-H. and Y.R.-D. All authors have read and agreed to the published version of the manuscript.

Funding

This work was supported by the ‘Consejo Nacional de Ciencia y Tecnología’ (CONACyT México) grant numbers 238313 for YRD, 221092 for FJH, and UdeG 2019-249876 for FJH.

Institutional Review Board Statement

The animal study protocol was approved by the Institutional Review Board of the University of Guadalajara (CI. 068-2014).

Informed Consent Statement

Not applicable.

Data Availability Statement

Not applicable.

Acknowledgments

We thank the Biomedical Sciences program at the University of Guadalajara for supporting our students’ activity in this project. We also thank the Department of Neurosciences for the provisions made to our lab. Thanks to Limei Zhang for recommendations and instructions on the use of c-fos techniques.

Conflicts of Interest

The authors declare no conflict of interest. The funders had no role in the design of the study; in the collection, analyses, or interpretation of data; in the writing of the manuscript, or in the decision to publish the results.

References

  1. Chepesiuk, R. Decibel Hell: The Effects of Living in a Noisy World. Environ. Health Perspect. 2005, 113, A34–A41. [Google Scholar] [CrossRef] [PubMed]
  2. Guski, R.; Schreckenberg, D.; Schuemer, R. WHO Environmental Noise Guidelines for the European Region: A Systematic Review on Environmental Noise and Annoyance. Int. J. Environ. Res. Public Health 2017, 14, 1539. [Google Scholar] [CrossRef] [PubMed] [Green Version]
  3. Stallen, P.J.M. A Theoretical Framework for Environmental Noise Annoyance. Noise Health 1999, 1, 69–80. [Google Scholar] [PubMed]
  4. Evans, E.F. Auditory Processing of Complex Sounds: An Overview. Philos. Trans. R Soc. Lond. B Biol. Sci. 1992, 336, 295–306. [Google Scholar] [CrossRef]
  5. Demanez, J.P.; Demanez, L. Anatomophysiology of the Central Auditory Nervous System: Basic Concepts. Acta Otorhinolaryngol. Belg. 2003, 57, 227–236. [Google Scholar]
  6. Flores, E.N.; Duggan, A.; Madathany, T.; Hogan, A.K.; Márquez, F.G.; Kumar, G.; Seal, R.P.; Edwards, R.H.; Liberman, M.C.; García-Añoveros, J. A Non-Canonical Pathway from Cochlea to Brain Signals Tissue-Damaging Noise. Curr. Biol. 2015, 25, 606–612. [Google Scholar] [CrossRef] [Green Version]
  7. Murphy, M.; Greferath, U.; Nag, N.; Nithianantharajah, J.; Wilson, Y.M. Tracing Functional Circuits Using C-Fos Regulated Expression of Marker Genes Targeted to Neuronal Projections. Front. Biosci. 2004, 9, 40–47. [Google Scholar] [CrossRef] [Green Version]
  8. Kovacs, K.J. C-Fos as a Transcription Factor: A Stressful (Re)View from a Functional Map. Neurochem. Int. 1998, 33, 287–297. [Google Scholar] [CrossRef]
  9. Chaudhuri, A.; Zangenehpour, S.; Rahbar-Dehgan, F.; Ye, F. Molecular Maps of Neural Activity and Quiescence. Acta Neurobiol. Exp. 2000, 60, 403–410. [Google Scholar]
  10. Baker, M.A.; Weiler, E.M. Sex of Listener and Hormonal Correlates of Auditory Thresholds. Br. J. Audiol. 1977, 11, 65–68. [Google Scholar] [CrossRef]
  11. Luine, V.; Gomez, J.; Beck, K.; Bowman, R. Sex Differences in Chronic Stress Effects on Cognition in Rodents. Pharmacol. Biochem. Behav. 2017, 152, 13–19. [Google Scholar] [CrossRef] [PubMed] [Green Version]
  12. Corso, J.F. Age and Sex Differences in Pure-Tone Thresholds. Survey of Hearing Levels from 18 to 65 Years. Arch. Otolaryngol. 1963, 77, 385–405. [Google Scholar] [CrossRef]
  13. Balogová, Z.; Popelář, J.; Chiumenti, F.; Chumak, T.; Burianová, J.S.; Rybalko, N.; Syka, J. Age-Related Differences in Hearing Function and Cochlear Morphology between Male and Female Fischer 344 Rats. Front. Aging Neurosci. 2017, 9, 428. [Google Scholar] [CrossRef] [PubMed] [Green Version]
  14. Rabat, A. Extra-Auditory Effects of Noise in Laboratory Animals: The Relationship between Noise and Sleep. J. Am. Assoc. Lab. Anim. Sci. 2007, 46, 35–41. [Google Scholar] [PubMed]
  15. Paxinos, G.; Watson, C. The Rat Brain in Stereotaxic Coordinates, 7th ed.; Elsevier: Amsterdam, The Netherlands, 2013; Available online: https://www.elsevier.com/books/the-rat-brain-in-stereotaxic-coordinates/paxinos/978-0-12-391949-6 (accessed on 26 October 2021).
  16. Watson, S.J. Neuroendocrine and Behavioral Responses and Brain Pattern of C-Fos Induction Associated with Audiogenic Stress. J. Neuroendocrinol. 1997, 9, 577–588. [Google Scholar] [CrossRef] [Green Version]
  17. Henkin, R.I.; Knigge, K.M. Effect of Sound on the Hypothalamic-Pituitary-Adrenal Axis. Am. J. Physiol. 1963, 204, 701–704. [Google Scholar] [CrossRef] [Green Version]
  18. Palkovits, M.; Dobolyi, A.; Helfferich, F.; Usdin, T.B. Localization and Chemical Characterization of the Audiogenic Stress Pathway. Ann. N. Y. Acad. Sci. 2004, 1018, 16–24. [Google Scholar] [CrossRef]
  19. Campeau, S.; Dolan, D.; Akil, H.; Watson, S.J. c-fos MRNA Induction in Acute and Chronic Audiogenic Stress: Possible Role of the Orbitofrontal Cortex in Habituation. Stress 2002, 5, 121–130. [Google Scholar] [CrossRef] [Green Version]
  20. Chen, X.; Herbert, J. Regional Changes in c-fos Expression in the Basal Forebrain and Brainstem during Adaptation to Repeated Stress: Correlations with Cardiovascular, Hypothermic and Endocrine Responses. Neuroscience 1995, 64, 675–685. [Google Scholar] [CrossRef]
  21. Martinez, M.; Phillips, P.J.; Herbert, J. Adaptation in Patterns of C-Fos Expression in the Brain Associated with Exposure to Either Single or Repeated Social Stress in Male Rats. Eur. J. Neurosci. 1998, 10, 20–33. [Google Scholar] [CrossRef]
  22. Stamp, J.A.; Herbert, J. Multiple Immediate-Early Gene Expression during Physiological and Endocrine Adaptation to Repeated Stress. Neuroscience 1999, 94, 1313–1322. [Google Scholar] [CrossRef]
  23. Watanabe, Y.; Stone, E.; McEwen, B.S. Induction and Habituation of C-Fos and Zif/268 by Acute and Repeated Stressors. Neuroreport 1994, 5, 1321–1324. [Google Scholar] [PubMed]
  24. Alkadhi, K.A.; Tran, T.T. Chronic Psychosocial Stress Impairs Early LTP but Not Late LTP in the Dentate Gyrus of At-Risk Rat Model of Alzheimer’s Disease. Brain Res. 2014, 1588, 150–158. [Google Scholar] [CrossRef] [PubMed]
  25. Fernández-Quezada, D.; Moran-Torres, D.; Luquin, S.; Ruvalcaba-Delgadillo, Y.; García-Estrada, J.; Jáuregui-Huerta, F. Male/Female Differences in Radial Arm Water Maze Execution After Chronic Exposure to Noise. Noise Health 2019, 21, 25–34. [Google Scholar] [CrossRef] [PubMed]
  26. Gerges, N.Z.; Aleisa, A.M.; Schwarz, L.A.; Alkadhi, K.A. Chronic Psychosocial Stress Decreases Calcineurin in the Dentate Gyrus: A Possible Mechanism for Preservation of Early Ltp. Neuroscience 2003, 117, 869–874. [Google Scholar] [CrossRef]
  27. Jáuregui-Huerta, F.; Garcia-Estrada, J.; Ruvalcaba-Delgadillo, Y.; Trujillo, X.; Huerta, M.; Feria-Velasco, A.; Gonzalez-Perez, O.; Luquin, S. Chronic Exposure of Juvenile Rats to Environmental Noise Impairs Hippocampal Cell Proliferation in Adulthood. Noise Health 2011, 13, 286–291. [Google Scholar] [CrossRef]
  28. Luczynski, P.; Moquin, L.; Gratton, A. Chronic Stress Alters the Dendritic Morphology of Callosal Neurons and the Acute Glutamate Stress Response in the Rat Medial Prefrontal Cortex. Stress 2015, 18, 654–667. [Google Scholar] [CrossRef]
  29. Ortiz, J.B.; Conrad, C.D. The Impact from the Aftermath of Chronic Stress on Hippocampal Structure and Function: Is There a Recovery? Front. Neuroendocr. 2018, 49, 114–123. [Google Scholar] [CrossRef]
  30. Burman, D.D.; Bitan, T.; Booth, J.R. Sex Differences in Neural Processing of Language among Children. Neuropsychologia 2008, 46, 1349–1362. [Google Scholar] [CrossRef] [Green Version]
  31. Krizman, J.; Skoe, E.; Kraus, N. Sex Differences in Auditory Subcortical Function. Clin. Neurophysiol. 2012, 123, 590–597. [Google Scholar] [CrossRef] [Green Version]
  32. Verma, R.; Balhara, Y.P.S.; Gupta, C.S. Gender Differences in Stress Response: Role of Developmental and Biological Determinants. Ind. Psychiatry J. 2011, 20, 4–10. [Google Scholar] [CrossRef]
  33. Heinsbroek, R.P.; Van Haaren, F.; Feenstra, M.G.; Endert, E.; Van de Poll, N.E. Sex- and Time-Dependent Changes in Neurochemical and Hormonal Variables Induced by Predictable and Unpredictable Footshock. Physiol. Behav. 1991, 49, 1251–1256. [Google Scholar] [CrossRef]
  34. Kitay, J.I. Sex Differences in Adrenal Cortical Secretion in the Rat. Endocrinology 1961, 68, 818–824. [Google Scholar] [CrossRef] [PubMed]
  35. Garrett, J.E.; Wellman, C.L. Chronic Stress Effects on Dendritic Morphology in Medial Prefrontal Cortex: Sex Differences and Estrogen Dependence. Neuroscience 2009, 162, 195–207. [Google Scholar] [CrossRef] [PubMed] [Green Version]
  36. Bowman, R.E.; Beck, K.D.; Luine, V.N. Chronic Stress Effects on Memory: Sex Differences in Performance and Monoaminergic Activity. Horm. Behav. 2003, 43, 48–59. [Google Scholar] [CrossRef]
  37. Wei, J.; Yuen, E.Y.; Liu, W.; Li, X.; Zhong, P.; Karatsoreos, I.N.; McEwen, B.S.; Yan, Z. Estrogen Protects against the Detrimental Effects of Repeated Stress on Glutamatergic Transmission and Cognition. Mol. Psychiatry 2014, 19, 588–598. [Google Scholar] [CrossRef]
  38. Zavala, J.K.; Fernandez, A.A.; Gosselink, K.L. Female Responses to Acute and Repeated Restraint Stress Differ from Those in Males. Physiol. Behav. 2011, 104, 215–221. [Google Scholar] [CrossRef] [Green Version]
  39. Moench, K.M.; Breach, M.R.; Wellman, C.L. Chronic Stress Produces Enduring Sex- and Region-Specific Alterations in Novel Stress-Induced c-Fos Expression. Neurobiol. Stress 2019, 10, 100147. [Google Scholar] [CrossRef]
  40. Panagiotaropoulos, T.; Papaioannou, A.; Pondiki, S.; Prokopiou, A.; Stylianopoulou, F.; Gerozissis, K. Effect of Neonatal Handling and Sex on Basal and Chronic Stress-Induced Corticosterone and Leptin Secretion. Neuroendocrinology 2004, 79, 109–118. [Google Scholar] [CrossRef]
  41. Seale, J.V.; Wood, S.A.; Atkinson, H.C.; Harbuz, M.S.; Lightman, S.L. Gonadal Steroid Replacement Reverses Gonadectomy-Induced Changes in the Corticosterone Pulse Profile and Stress-Induced Hypothalamic-Pituitary-Adrenal Axis Activity of Male and Female Rats. J. Neuroendocr. 2004, 16, 989–998. [Google Scholar] [CrossRef]
  42. Babb, J.A.; Masini, C.V.; Day, H.E.W.; Campeau, S. Stressor-Specific Effects of Sex on HPA Axis Hormones and Activation of Stress-Related Neurocircuitry. Stress 2013, 16, 664–677. [Google Scholar] [CrossRef] [PubMed]
Figure 1. The general procedure of the experiment. The groups, processes, and timelines are depicted as planned.
Sustainability 14 02798 g001
Figure 2. The mean level of serum corticosterone in male and female rats. The data represent the mean of CORT levels in control and 2 h, 12 h, 7 d, and 21 d of noise exposure. Multiple means comparisons evidenced significant increases at 2 h for females vs. control. Males registered increases at 7 days vs. control, and after 21 days vs. control and vs. females. Multiple mean comparisons: ((ᶲ) control vs. exposed males); ((ˠ) control vs. exposed females); ((Ⱡ) exposed males vs. exposed females). Statistically significant at a value * p < 0.05 (** p < 0.01, *** p < 0.001).
Sustainability 14 02798 g002
Figure 3. The mean number of c-fos+ cells at the global level. The bars illustrate the mean number ± SEM of the labeled cells. Significant differences between the males and females were encountered at 2 h, 12 h, and 21 d. Time points that reached statistical significance according to the two-way ANOVA are signaled with (*). Statistically significant at a value * p < 0.05 and ** p < 0.01.
Sustainability 14 02798 g003
Figure 4. The global activity of c-fos across the rat brain. Upper sagittal and coronal diagrams illustrate the characteristic expressions at the acute phase of the experiment. Lower diagrams represent the characteristic expressions at the chronic phase of the experiment. Data analyzed from Bregma +2.6 mm to Bregma −3.10 mm.
Sustainability 14 02798 g004
Figure 5. Representative photomicrographs of c-fos expression in the nucleus caudate (CPu), hypothalamus (PVN), and dorsal hippocampus (GD) of control, 2 and 12 h, and 7 and 21 days of noise exposure in male and female rats. The bar indicates the scale 150 μm (0.864 μm/px).
Sustainability 14 02798 g005
Table 1. Summary of the immunohistochemical quantification of c-fos expression after exposure to environmental noise. The data represent the mean number (±SEM) of c-fos+ cells in every region. Regions that reached statistical significance according to the two-way ANOVA are signaled with (*). Multiple means comparisons: (ᶲ) control vs. exposed males; (ˠ) control vs. exposed females; and (Ⱡ) exposed males vs. exposed females. Statistically significant at a value * p < 0.05 (** p < 0.01, *** p < 0.001).
Summary of Immunohistochemical Quantification of Brain c-Fos Protein Expression in Male and Female Wistar Rats
Brain RegionGenderControlAcute Noise ExposureChronic Noise Exposure
Experimental Group Means (± SEM)
0 h2 h 12 h7 days21 daysFactorFdfp
Forebrain
Caudate nucleus *Male0.7 (0.08)72.47 (10.6) ᶲ28 (0.8) ᶲ32.93 (1.8) ᶲ31.43 (2.9) ᶲSex43.114, 2900.0001
Female0.7 (0.08)53.47 (4.2) ˠ73.13 (1.8) ˠⱠ69.87 (2.6) ˠⱠ21.63 (4.7) ˠTime50.114, 2900.0001
Interaction40.114, 2900.0001
Lateral septum *Male1 (0.03)139.70 (15.3) ᶲⱠ61.03 (4.7) ᶲ58.53 (2.5) ᶲⱠ42.60 (7.0) ᶲSex18.481, 2900.0001
Female1 (0.03)64.2 (4.4) ˠ95.30 (5.4) ˠⱠ19.63 (1.9)33.27 (8.0) ˠTime70.974, 2900.0001
Interaction19.844, 2900.0001
Claustrum *Male0.5 (0.09)79.40 (6.1) ᶲⱠ19.40 (1.6) ᶲ56.70 (1.7) ᶲⱠ46.23 (3.3) ᶲSex0.30961, 2900.5783
Female0.5 (0.09)58.6 (3.4) ˠ71.93 (1.4) ˠⱠ29.43 (1.2) ˠ36.60 (4.0) ˠTime141.64, 2900.0001
Interaction58.334, 2900.0001
Olfactory bulb *Male1.1 (0.06)201 (26) ᶲⱠ74.97 (3.0) ᶲ107.90 (8.5) ᶲⱠ45.80 (2.7) ᶲSex7.7711, 2900.0057
Female1.1 (0.06)109.6 (13.4) ˠ154.67 (6.2) ˠⱠ51.60 (2.1) ˠ24.77 (4.2) ˠTime73.844, 2900.0001
Interaction20.514, 2900.0001
Amygdala complex *Male0.6 (0.08)52.27 (3.7) ᶲ35.50 (1.8) ᶲ44.13 (1.7) ᶲ36.40 (3.6) ᶲⱠSex39.771, 2900.0001
Female0.6 (0.08)60.53 (3.5) ˠ55.77 (1.9) ˠⱠ77.87 (2.3) ˠⱠ23.40 (2.3) ˠTime195.44, 2900.0001
Interaction26.644, 2900.0001
Habenular complex *Male0.5 (0.09)35.27 (4.9) ᶲ15 (1.0) ᶲ21.60 (1.5) ᶲ14.23 (1.6) ⱠSex0.27571, 2900.5999
Female0.5 (0.09)28.4 (2) ˠ30.77 (1.3) ˠⱠ27.50 (1.0) ˠ2.60 (0.4) ˠTime86.584, 2900.0001
Interaction15.264, 2900.0001
Hippocampus
Dentate gyrus *Male0.2 (0.07)12.77 (1.2) ᶲ18.53 (0.8) ᶲ38.87 (1.0) ᶲⱠ42 (3.5) ᶲⱠSex19.144, 2900.0001
Female0.2 (0.07)13.4 (0.6) ˠ28.60 (1.2) ˠⱠ31.60 (1.6) ˠ16.97 (1.7) ˠTime160.44, 2900.0001
Interaction35.784, 2900.0001
CA3 *Male0.2 (0.07)15.87 (0.8) ᶲⱠ09.57 (0.8) ᶲ22.17 (0.6) ᶲ27.20 (2.2) ᶲⱠSex31.194, 2900.0001
Female0.2 (0.07)8.8 (0.6) ˠ19.93 (0.9) ˠⱠ16.53 (0.9) ˠ7.60 (2.4) ˠTime73.714, 2900.0001
Interaction38.954, 2900.0001
CA2Male0.1 (0.06)17.8 (0.8) ᶲⱠ6.47 (0.4) ᶲ14.50 (0.4) ᶲⱠ5.70 (0.7)Sex54.824, 2900.0001
Female0.1 (0.06)6.8 (0.6) ˠ11.23 (0.5) ˠⱠ6.87 (0.4) ˠ2.53 (0.4)Time94.844, 2900.0001
Interaction36.394, 2900.0001
CA1 *Male0.1 (0.09)24.03 (4.4) ᶲⱠ2.23 (0.2)10.63 (0.5) ᶲ9.30 (1.04) ᶲⱠSex6.3621, 2900.0001
Female0.1 (0.09)4.5 (0.7) ˠ7.07 (0.7)6 (0.6) ˠ1.67 (0.2) ˠTime19.024, 2900.0001
Interaction14.834, 2900.0001
Cortex
Prelimbic *Male0.8 (0.6)113.9 (13.3) ᶲ20.17 (1.0)75.30 (5.3) ᶲ38.60 (5.6) ᶲSex0.27481, 2900.6005
Female0.8 (0.6)88.8 (8.4) ˠ92.67 (1.7)20.47 (1.1) ˠ57.80 (13.5) ˠTime51.184, 2900.0001
Interaction23.184, 2900.0001
Infralimbic *Male0.7 (0.07)115.1 (11.7) ᶲ30.57 (1.3) ᶲ58.50 (5.1) ᶲ32.87 (4.5) ᶲSex0.14821, 2900.7005
Female0.7 (0.07)81 (6.4) ˠ93.30 (2.0) ˠ18.57 (0.8)51.10 (9.4) ˠTime78.014, 2900.0001
Interaction27.044, 2900.0001
Cingulate *Male1.1 (0.05)154.3 (19.1) ᶲ41.57 (1.2)153.57 (6.6) ᶲⱠ92.90 (15.0) ᶲSex58.641, 2900.4445
Female1.1 (0.05)132.7 (14.8) ˠ146.73 (5.1) ˠⱠ59.33 (2.8) ˠ76.13 (19.6) ˠTime42.874, 2900.0001
Interaction20.004, 2900.0001
Insular *Male0.5 (0.09)40.1 (2.7) ᶲ27.57 (1.0) ᶲ49.40 (2.5) ᶲⱠ18.83 (3.0) ᶲSex5.0341, 2900.0256
Female0.5 (0.09)41.6 (4.2) ˠ59.97 (3.0) ˠⱠ23.50 (0.9) ˠ30.47 (4.8) ˠTime81.164, 2900.0001
Interaction29.074, 2900.0001
Piriform *Male1 (0.1)159.5 (23.2) ᶲ90.10 (2.4) ᶲ82.13 (2.4) ᶲ64.63 (5.8) ᶲSex2.0271, 2900.1556
Female1 (0.1)139.3 (16.1) ˠ225 (5.5) ˠⱠ42.30 (1.1)32.53 (4.8) ˠTime101.44, 2900.0001
Interaction28.904, 2900.0001
Temporal auditory * (secondary)Male0.6 (0.08)122.33 (10) ᶲⱠ128.73 (5.5) ᶲ77.03 (4.0) ᶲ69.00 (9.9) ᶲⱠSex0.22421, 2900.6362
Female0.6 (0.08)75.3 (6.9) ˠ153.67 (3.0) ˠ129.37 (6.1) ˠⱠ29.70 (4.2) ˠTime164.24, 2900.0001
Interaction24.554, 2900.0001
Temporal auditory * (primary)Male0.7 (0.08)129.8 (10.8) ᶲⱠ132.33 (4.7) ᶲⱠ61.73 (1.8) ᶲ61.83 (9.2) ᶲⱠSex16.621, 2900.0001
Female0.7 (0.08)85.13 (6.2) ˠ88.33 (3.1) ˠ115.60 (5.8) ˠⱠ24.00 (3.6)Time137.44, 2900.0001
Interaction27.914, 2900.0001
Hypothalamus
Paraventricular nucleus *Male1.2 (0.1)118.3 (14.7) ᶲ33.73 (1.3) ᶲ91.47 (2.4) ᶲ63.17 (5.4) ᶲⱠSex0.75014, 2900.3872
Female1.2 (0.1)127.6 (10.9) ˠⱠ100.03 (2.2) ˠ63.67 (2.9) ˠ30.07 (5.6) ˠTime94.124, 2900.0001
Interaction19.894, 2900.0001
Ventromedial nucleus *Male0.5 (0.09)114.2 (14.6) ᶲⱠ22.67 (1.4)45.23 (1.5) ᶲ22.70 (3.0)Sex1.1981, 2900.2745
Female0.5 (0.09)78.4 (5.1) ˠ74.43 (2.9) ˠⱠ44.23 (2.3) ˠ27.13 (6.3) ˠTime80.884, 2900.0001
Interaction15.744, 2900.0001
Thalamus
Paraventricular nucleus *Male0.7 (0.1)104.2 (10.8) ᶲⱠ55.77 (2.8) ᶲ85.60 (5.5) ᶲ57.73 (6.5) ᶲSex12.381, 1400.0006
Female0.7 (0.1)59 (5.2) ˠ71.67 (1.6) ˠ66.27 (5.9) ˠ44.27 (6.7) ˠTime67.754, 1400.0001
Interaction8.4094, 1400.0001
Publisher’s Note: MDPI stays neutral with regard to jurisdictional claims in published maps and institutional affiliations.

