Article

RSEI-Based Modeling of Ecological Security and Its Spatial Impacts on Soil Quality: A Case Study of Dayu, China

1
College of Surveying and Geo-Informatics, Tongji University, Shanghai 200092, China
2
Faculty of Geomatics, East China University of Technology, Nanchang 330013, China
*
Author to whom correspondence should be addressed.
Sustainability 2022, 14(8), 4428; https://doi.org/10.3390/su14084428
Submission received: 7 February 2022 / Revised: 24 March 2022 / Accepted: 28 March 2022 / Published: 8 April 2022
(This article belongs to the Special Issue Urban Expansion and Its Effect on Soil Sustainability)

Abstract

:
Rapid urbanization and industrialization have brought serious threats to urban ecological security, which refers to the health and integrity of urban ecosystems. By collecting multi-source data in the modeling of the ecological security pattern, we used the remote sensing ecological index (RSEI) to identify the ecological sources (ESOs), and applied five indicators to construct the resistance surface, including land-use type, normalized vegetation index (NDVI), normalized building index (NDBI), slope, and digital elevation model (DEM). Based on the ESOs and ecological resistance surface, we calculated the cost distance of each pixel to the nearest ESO using the minimum cumulative resistance model. With the natural breakpoint method, we classified the cost distance into five levels, and constructed the ecological security pattern of Dayu. In Dayu, there were areas of at least 40% with stable ecological security. We identified 39, 31, and 43 ESOs of Dayu in 2012, 2016, and 2020, respectively. During 2012 to 2016, the number of medium ESOs decreased from 16 to 5, and the number of small ESOs increased from 13 to 26. From 2016 to 2020, the number of medium-sized ESOs increased from 5 to 18, and the number of small-sized ESOs decreased from 26 to 20. The percentage of the Level-5 (the worst) ecological security was 5.84% in 2012, 6.80% in 2016, and 4.42% in 2020. The ecological security was negatively correlated with the intensity of the human activities and varied significantly in different towns. The soil quality was positively consistent with the ecological security, and the urbanization caused damage to the soil security. A few suggestions were finally provided for decision-makers to improve the ecological environments and the soil quality.

1. Introduction

In recent years, rapid urbanization and industrialization have led to increasingly severe pollution of environments, and thus serious threats to urban ecological security [1,2,3,4]. In ecosystem studies, ecological security refers to the health and integrity of ecosystems [5]. Ecological security reflects the degree of guarantee that human beings are not affected by ecological damage and environmental pollution in terms of production, life, and health, including basic elements such as soil safety, living conditions, and green environments [6,7]. Ecosystem problems such as soil nutrient loss [8] and the destruction of the urban green space exacerbate the contradictions between ecological security and urban expansion [9]. To promote the sustainable development of cities, modelers and decision-makers have made many efforts to understand and examine the ecological security pattern in rapidly urbanizing areas [10,11]. In fact, ecological security is an indicator of the balance between the region’s development and ecosystem health [12,13]. As such, it is necessary to conduct an in-depth examination of ecological security and its spatial impacts on environmental factors, such as soil quality, using various spatial data and remote sensing imagery.
To quantify the degree of ecological security and examine its spatial patterns, modelers have developed methods such as the source-sink theory, minimum cumulative resistance, and the circuit theory in recent years [14,15,16,17,18]. Among these, the source-sink theory was used to explore the relationship between landscape patterns and ecological security and/or processes [14,15]. MCR was applied for capturing the ecological security patterns in Shenzhen and Changzhou of China [16,17], and the circuit theory was adopted to examine the ecosystem services in Yunnan of China [18]. These useful works improved our understanding of the ecological security pattern in local areas, especially under the urgent demand for discovering the impacts of urban expansion on regional ecosystems. To study the spatiotemporal evolution of urban expansion and ecological security, two issues including the identification of ecological sources (ESOs) and the quantification of ecological security should be thoroughly addressed.
ESOs are ecological patches that maintain a high degree of ecological function. Even if ESOs are damaged by human activities and natural disasters, they can maintain a high ecological quality and strong self-regulation ability. As an important component of the regional ecosystem, ESOs can be the basis of constructing ecological security. Visual inspection is the initial method that identifies wetlands and forests as ESOs. Further studies using visual inspection selected habitats and ecological reserves as candidates of ESOs [19,20,21]. More studies have considered comprehensive indicators that were proposed to improve ESO identification, where the indicators included habitat importance [22,23], landscape connectivity [24,25], and ecological sensitivity [26,27,28], to name a few. The hot spot analysis [29] and ecosystem service value [30,31] were also used to improve ESO identification. The visual inspection is relatively subjective, because the results are different from person to person, while the comprehensive indicators need sufficient data to identify the ESOs that can be derived from various spatial data and remote sensing imagery.
Soil quality is another indicator of ecological security and is considered the capacity of soil to sustain the productivity of the plant and animal, maintain or enhance the quality of water and air, and support human food and habitation [32,33,34]. The degradation of ecological security usually causes significant environmental consequences such as increased soil erosion [35]. Soil erosion reduces the ecological security index (ESI) and damages the ecological function of the soil [36]. In this regard, the features of ecological security and the humidity of soil have been revealed by scientists, especially in a case study of the Chinese Loess Plateau, using the remote sensing ecological index (RSEI) [37]. RSEI is an ecological index calculated from remote sensing images that can be provided by many Earth observation satellites. The short revisiting periods of different satellites guarantee the quick update of images and their large-scale coverage [38,39]. Thus, remote sensing-based RSEI can quantify the changes in ecological security of different areas [37,40,41,42].
This study is aimed at identifying ESOs and examining the ecological security patterns using the RSEI method with the support of Landsat images. We also examined the impacts of ecological security on soil quality after analyzing the spatiotemporal patterns of ecological security and soil nutrition. The RSEI-based ESO identification method was applied in a small city, i.e., Dayu county of China. We first used RSEI to identify the candidate areas of ESOs, then analyzed the frequency of the RSEIs to select the accurate ESOs based on a predefined optimal threshold. Furthermore, we selected five ecological resisting factors to construct the ecological resisting index system for constructing the resistance surface. We derived the urban ecological security patterns using a minimum cumulative resistance (MCR) model. We finally analyzed the reasons for ecological security change, and indicated feasible suggestions for the local government to regulate useful policies of urban planning and ecological security protection.

2. Material and Methods
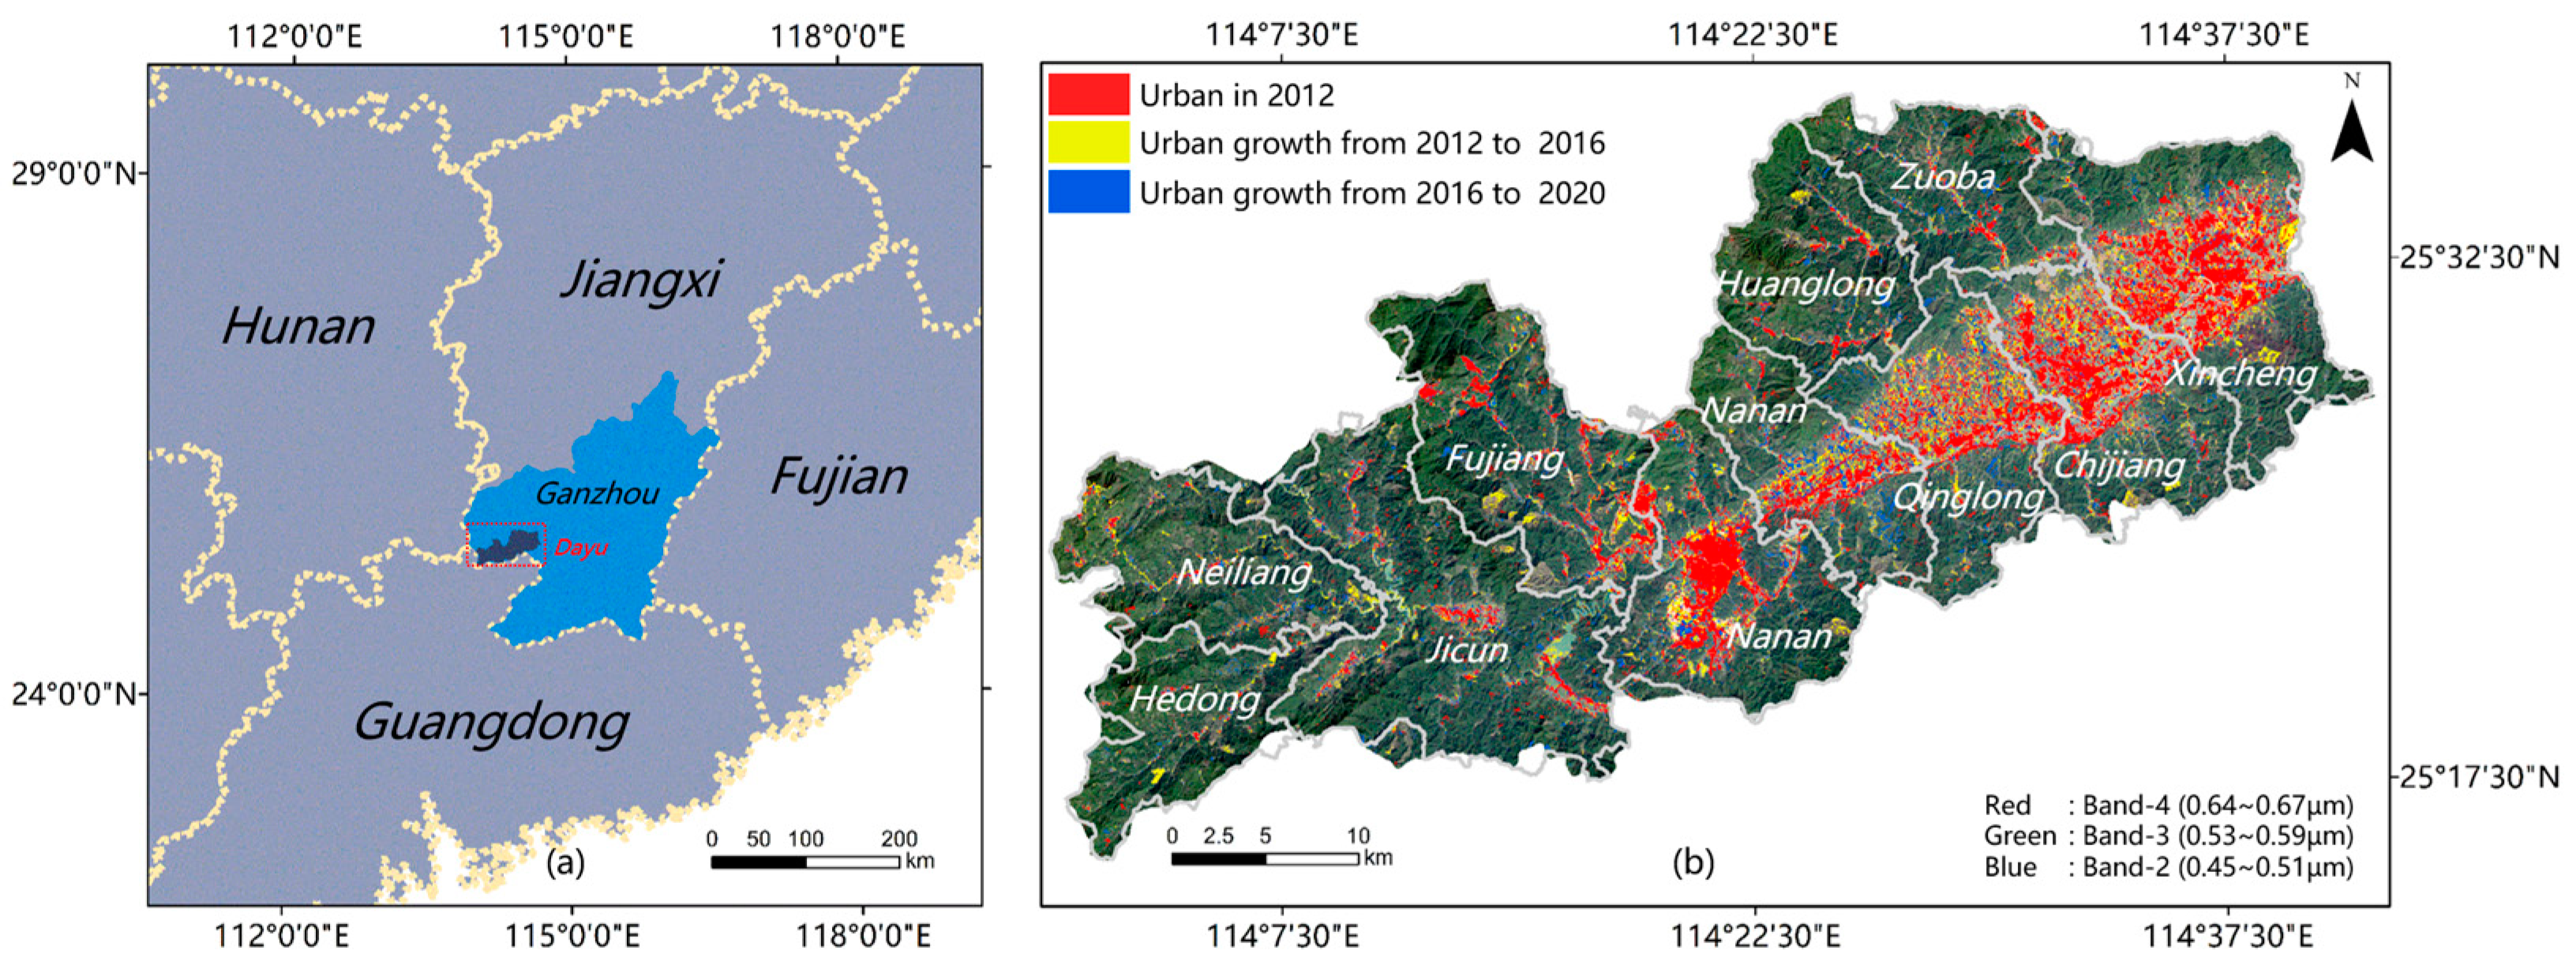
2.1. Study Area

Dayu is a county-level city covering 11 towns that are in the boundary of 114° E~114°44′ E/5°15′ N~25°37′ N, located in Ganzhou City of Jiangxi Province, China (Figure 1). The county has dense rivers to form the Zhangjiang River Basin with the Ganjiang tributary of Zhangshui as the mainstream. There are 530 tributaries in this area, with a total river length of 2084.54 km and a river density of 1.52 km per km2. The overall area of Dayu is 1367.63 km2 and the terrain elevation is high in the west and low in the east. The highest altitude is 1386.6 m above sea level, and the lowest is 124 m. The central and eastern parts form a hilly basin surrounded by mountains on three sides that open to the east. The central hills and mountains are generally 300 to 500 m above sea level, and the plains and hills on both sides of the Zhangjiang River in the east are about 200 m above sea level. The mountainous area of the county is 311.18 km2, accounting for 22.76% of the total area, and most of them are vein-shaped, undulating and overlapping with valleys and ravines. The hills cover an area of 804.65 km2 which accounts for 58.86% and forms a belt that is dominated by purplish-red rock soil. The plain area is 251.175 km2, which accounts for 18.38%, and is mainly consisted of red soil, yellow soil, and alluvial soil. The soil is soft and fertile, rich in calcium, magnesium, potassium, and other minerals. The average content of the organic matter, alkaline hydrolyzed nitrogen, and available phosphorus were lower in the soil of the western region than in the eastern region, whereas the average content of available potassium was higher in the western regions than in the eastern regions.
The urban center of Dayu is located in Nan’an, where both the slope and elevation are lower. Big villages with a high-density of population span three towns, including Qinglong, Chijiang, and Xincheng. These villages are scattered along main roads and around large mines and factories. From 2012 to 2020, the city expanded in the low-lying area of Dayu and was mainly shaped by the terrain. As of 2020, Dayu’s urban area was about 116 km2, and the newly built-up areas were minor and randomly distributed in Dayu’s mountainous areas (Figure 1). Dayu was rich in mineral resources, and the tungsten mine production was once ranked among the top in the world. Affected by intensive mining and economic activities, the ecological environment near mines and urban areas has been severely damaged, posing threats to the ecological security of the entire city [43]. Thus, the study of Dayu should be useful to improve our understanding of ecological security in mining towns of China and to test the effectiveness of the RSEI method.

2.2. Datasets

The remote sensing images used in this study were from the Enhanced Thematic Mapper (ETM) of Landsat-7 in 2012 and the Operational Land Imager (OLI) and the Thermal Infrared Sensor (TIRS) of Landsat-8 in 2016 and 2020 (Table 1). The pixel size of the images was 30 m and the revisiting period was 16 days. The images were provided by the geospatial data cloud (www.gscloud.cn). The 30 m digital elevation model (DEM) of Dayu was collected from the United States Geological Survey (www.usgs.gov). The statistical yearbooks of Dayu were collected from the Dayu local government (www.jxdy.gov.cn), which included datasets of the total land area, terrain, soil conditions, population, GDP, industrial production values, mining production, and grain outputs. The soil was sampled from an investigation named “Soil Nutrient Content Tests” of Dayu in 2012, 2015, and 2019, which were provided by the Department of Agriculture of Jiangxi Province (nync.jiangxi.gov.cn). The depth of the soil sampling was 20 cm and the sampling range covered the whole Dayu. The total number of samples was 780, which included information on the soil type, the content of the nutrients, the PH, the degree of erosion, and the soil structure. Among these, the content of the nutrients included organic matter, alkaline hydrolyzed nitrogen, available phosphorus, and available potassium.

2.3. The RSEI-Based Ecological Security Assessment Model

2.3.1. The ESO Identification Method

For identifying ESOs, RSEI integrates four elements, including humidity, greenness, temperature, and dryness, and quantifies the ecological quality of the land patches. The computation of RSEI needs to consider four variables, including humidity, normalized vegetation index (NDVI), normalized building index (NDBI), and bare soil index (BSI). RSEI ranged from 0 to 1, and was calculated by [39]:
RSEI = f (G,W,T,D)
where G represents the greenness, W represents the humidity, T represents the land surface temperature, and D represents the dryness.
Both the ETM and OLI images can be used to derive the humidity, which was calculated by [44]:
ETM: humidity = 0.2626 × Lblue + 0.2141 × Lgreen + 0.0926 × Lred + 0.0656 × Lnir − 0.7629 × Lsir − 0.5388 × Lmir
ORL: humidity = 0.1511 × Lblue + 0.1973 × Lgreen + 0.3283 × Lred + 0.3407 × Lnir − 0.7117 × Lmir1 − 0.4559 × Lmir2
where Lblue represents the blue band, Lgreen represents the green band, Lred represents the red band, Lnir represents the near-infrared band of all Landsat images, Lsir represents the short infrared band, Lmir represents the middle-infrared band of the Landsat-7 images, Lmir1 represents the first middle-infrared band, Lmir2 represents the second middle-infrared band of the Landsat-8 images.
The greenness can be represented by NDVI [45]:
NDVI = (LnirLred)/(Lnir + Lred)
The temperature can be derived from the thermal infrared brightness value [46]. The dryness was calculated using NDBI and BSI [47,48]:
NDBI = 2 L m i r   /   ( L m i r + L n i r ) [ L n i r   /   ( L n i r + L r e d ) + L g r e e n   /   ( L g r e e n + L m i r ) ] 2 L m i r   /   ( L m i r + L n i r ) + [ L n i r   /   ( L n i r + L r e d ) + L g r e e n   /   ( L g r e e n + L m i r ) ]
BSI = [(Lmir + Lred) − (Lmir + Lblue)]/[(Lmir + Lred) + (Lmir + Lblue)]
dryness = (NDBI + BSI)/2
We performed principal component analysis (PCA) on the four elements above, i.e., humidity, greenness, temperature, and dryness, and used the normalized PCA regression value as the RSEI. Because the forest is the dominant land type, which reaches 70% in Dayu, the mode of the RSEIs was considered as the RSEI of forests. To identify the ESOs from RSEIs, we defined the threshold as the modes of RSEIs. As such, the areas with RSEIs greater than the mode were identified as the candidate ESOs. Among these candidates, we selected ecological patches larger than 100 km2 as the final ESOs.

2.3.2. The Ecological Security Identification Method

The ecological resistance in the migration of plants and animals also reflected the ecological security of the environment. Comprehensively considering the human settlement environments, natural conditions, and landform characteristics of Dayu, we constructed the ecological resistance surface using five ecological resistance factors: land-use type, NDVI, NDBI, DEM, and slope. Land-use and NDBI were chosen because human activities and building conditions have impacts on soil [49]. Through the spectral operation of remote sensing images, NDVI can reflect whether the soil is suitable for vegetation survival, and DEM is the terrain factor that reflects the ecological resistance [50]. We classified land-use into the urban, forest, water, farm, and bare land [51] (Figure 2a). The overall accuracy was 91.66% in 2012, 95.09% in 2016, and 91.33% in 2020. NDVI represents the role of the natural conditions in constituting the ecological security pattern (Figure 2b) and NDBI represents the impacts of the built-up areas on ecological resistance (Figure 2c).
The ecological security pattern was analyzed based on an ecological resisting surface that was calculated using the resisting factors. However, different resisting factors have different impacts on the resisting surface; this suggests that each factor has its weight. In this study, we classified the resisting factors into three types, including the living environments, the natural environments, and the landform characteristics (Table 2). To define the weight, we then applied the expert scoring method by comparing each two of the three factors to identify the more important factor of each two. The determination matrix was generated using the 1–9 scaling method based on the initial importance of factors. The maximum eigenvalue and eigenvector were then calculated and, the normalized eigenvector component was the weight ratio. A further consistency test smaller than 0.1 indicated that the error was within the allowable range.
The land-use patterns are a direct reflection of the impacts of human activities on the ecosystems. Among human activities, urban development and economic activities cause many negative effects on the soil, while forest plantation greatly improves the stability of ecosystems. Due to the huge impacts of human activities on the environment and because the process is commonly irreversible, the weight of the land-use is considered stronger than the other factors. Among the different land-use types, those (e.g., water and forest) maintaining the natural situation have the lowest resisting scores. The scores of other land-uses were proportional to the intensity of human activities. For NDVI, the weight ranked second in the five resisting factors and the scores were inversely proportional to NDVI. For NDBI, the scores were proportional to NDBI. For DEM and slope, the resisting scores were inversely proportional to their values.
Based on the resisting factors, we established the ecological resistance surface of Dayu through the raster calculator in ArcGIS [10,52,53]. The ecological resistance surface reflected the obstacle strength encountered by species during species expansion. Combined with the ESOs, we constructed the urban ecological security pattern of Dayu based on the MCR model. The MCR was calculated by the following:
MCR   =   f m i n   j = n i = m ( D i j × R i )  
where f represents the positive correlation between MCR and ecological processes, Dij represents the spatial distance traveled by species from source j to landscape unit i, and Ri represents the resistance value of landscape unit i to species expansion.
Considering both the MCR and ESOs, we calculated the cost distance of each pixel to the nearest ESO. The distance was positively related to ecological security. To visualize the spatiotemporal pattern of the ecological security pattern, we applied the natural breakpoint method to divide the distance into five levels, with the first level having the highest ecological security and the fifth level having the lowest security. The division results thus indicated the ecological security patterns. The optimal threshold of the RSEIs was set based on the statistics, including the mean and standard deviation. Based on the RSEIs, the impacts of ecological security on soil quality were analyzed from the observation of the spatiotemporal evolution of ecological security and the four soil nutrition types.

3. Results

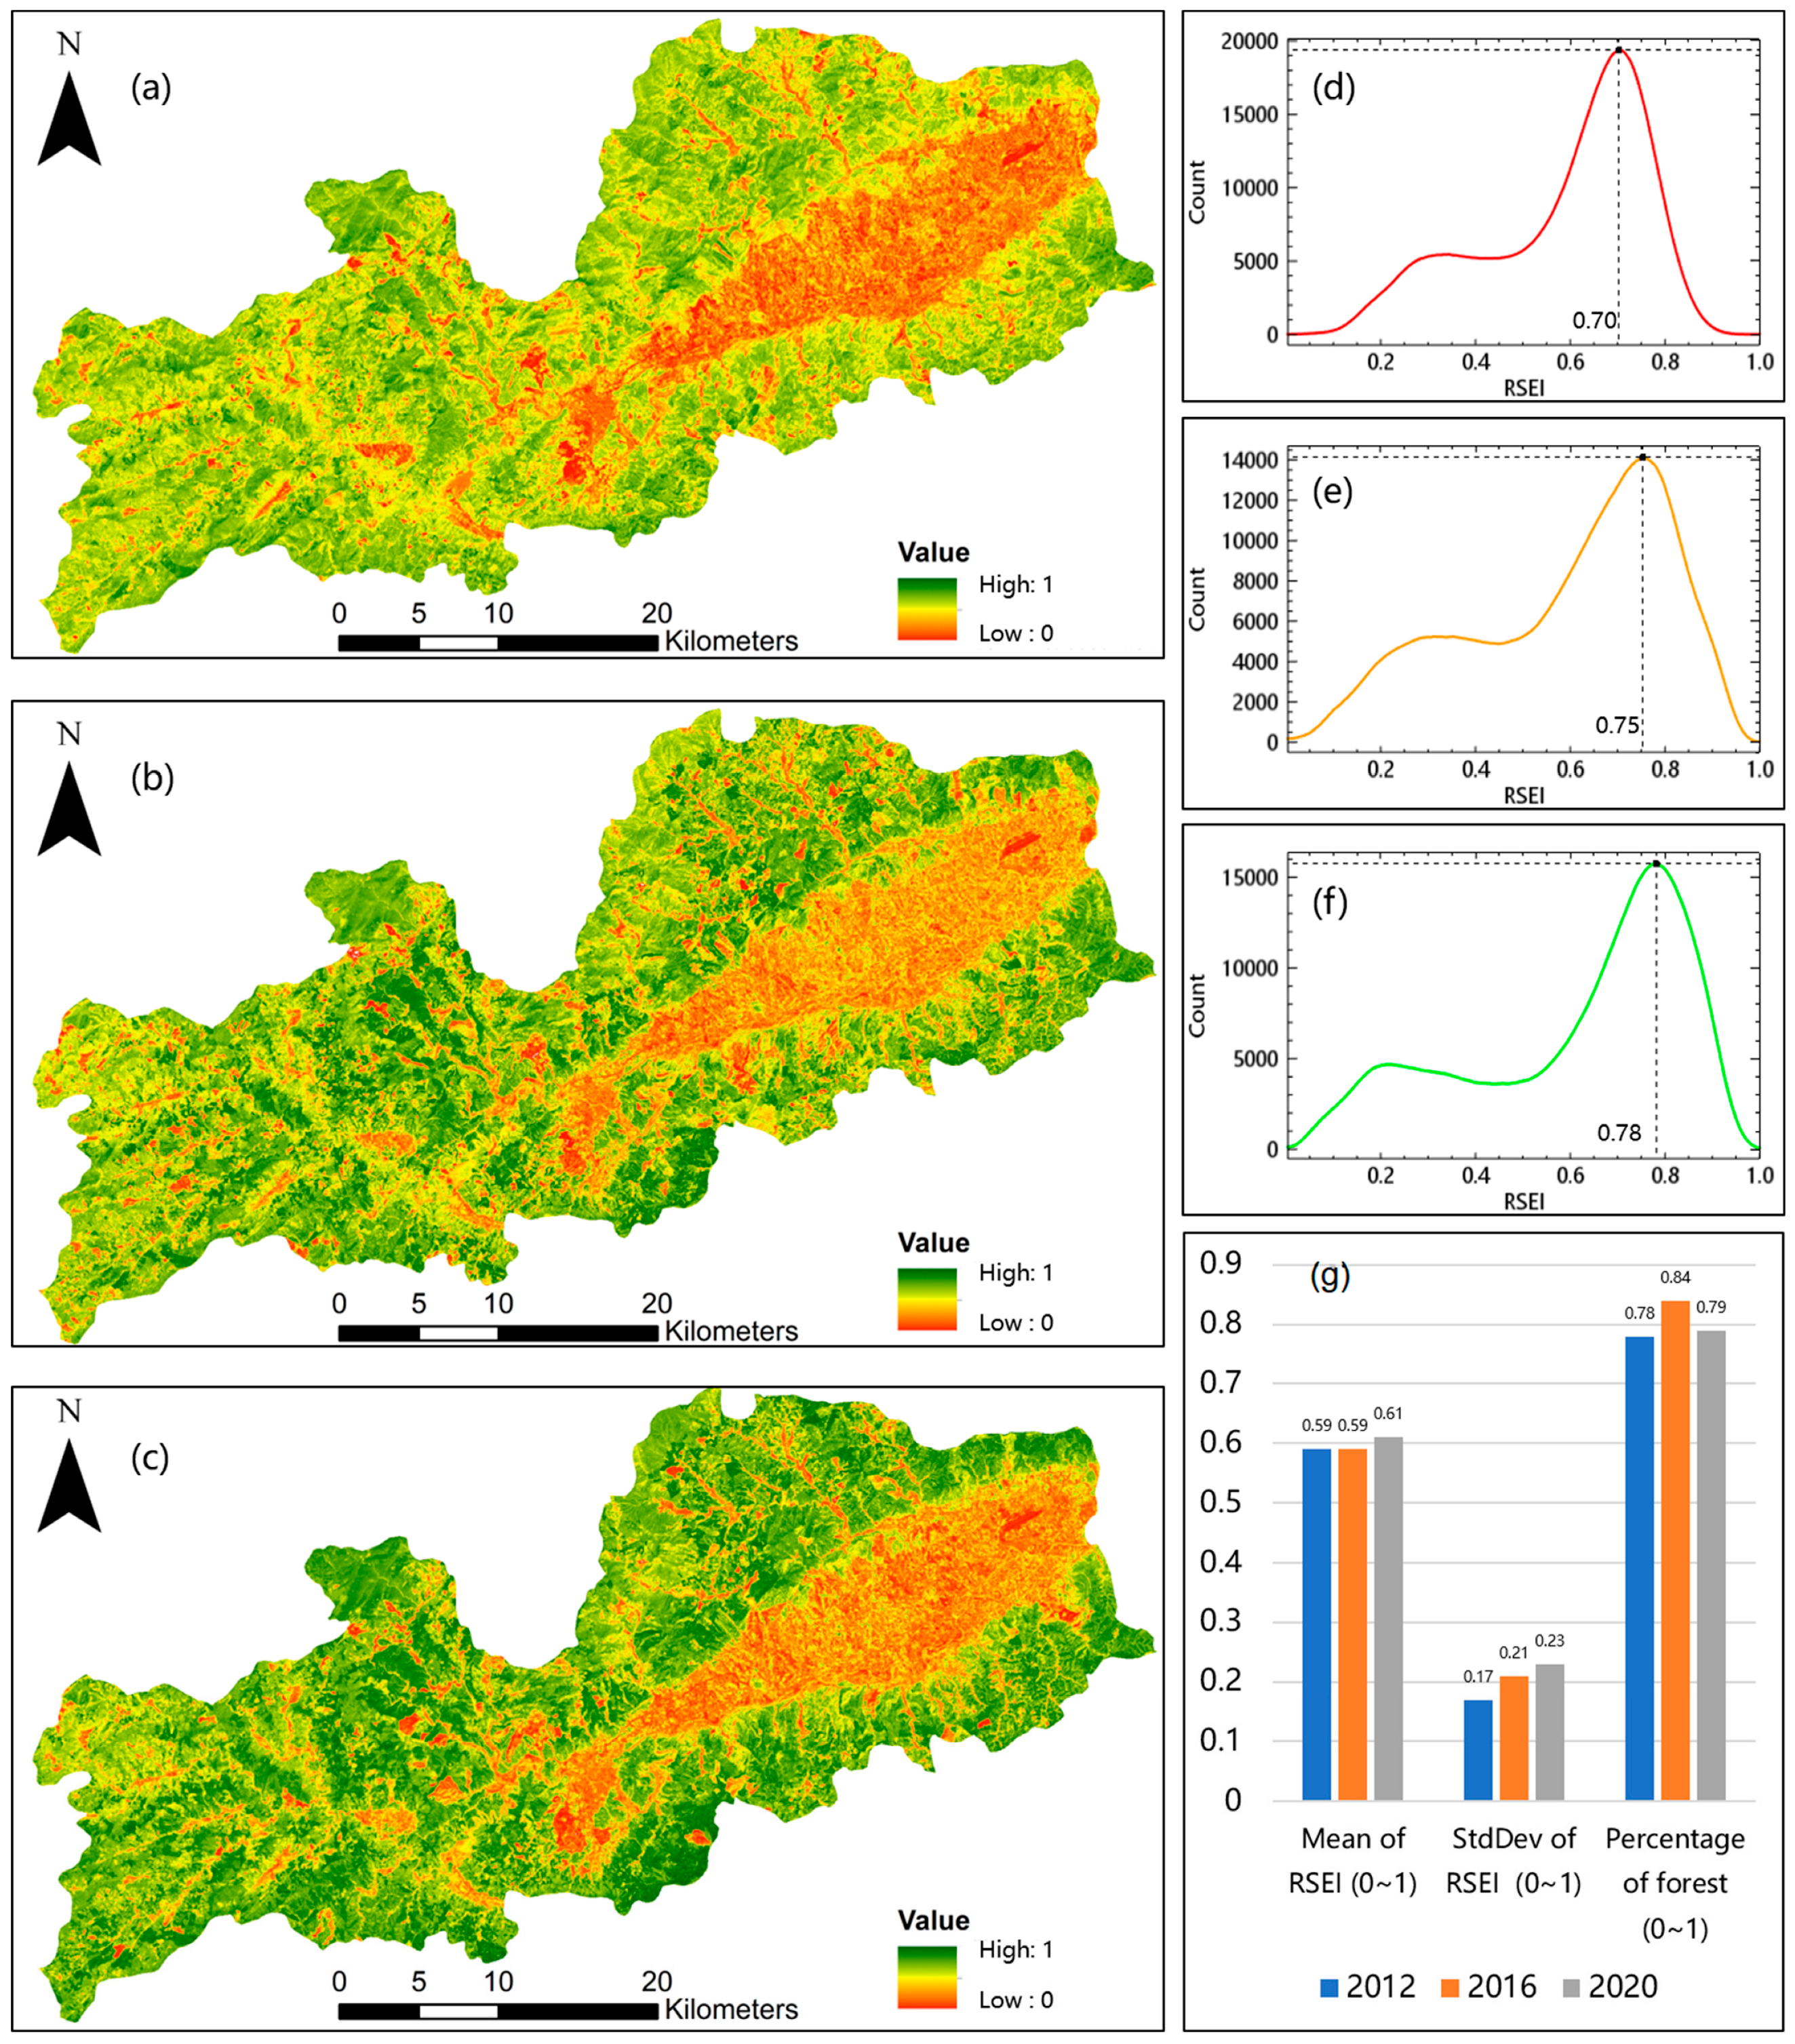
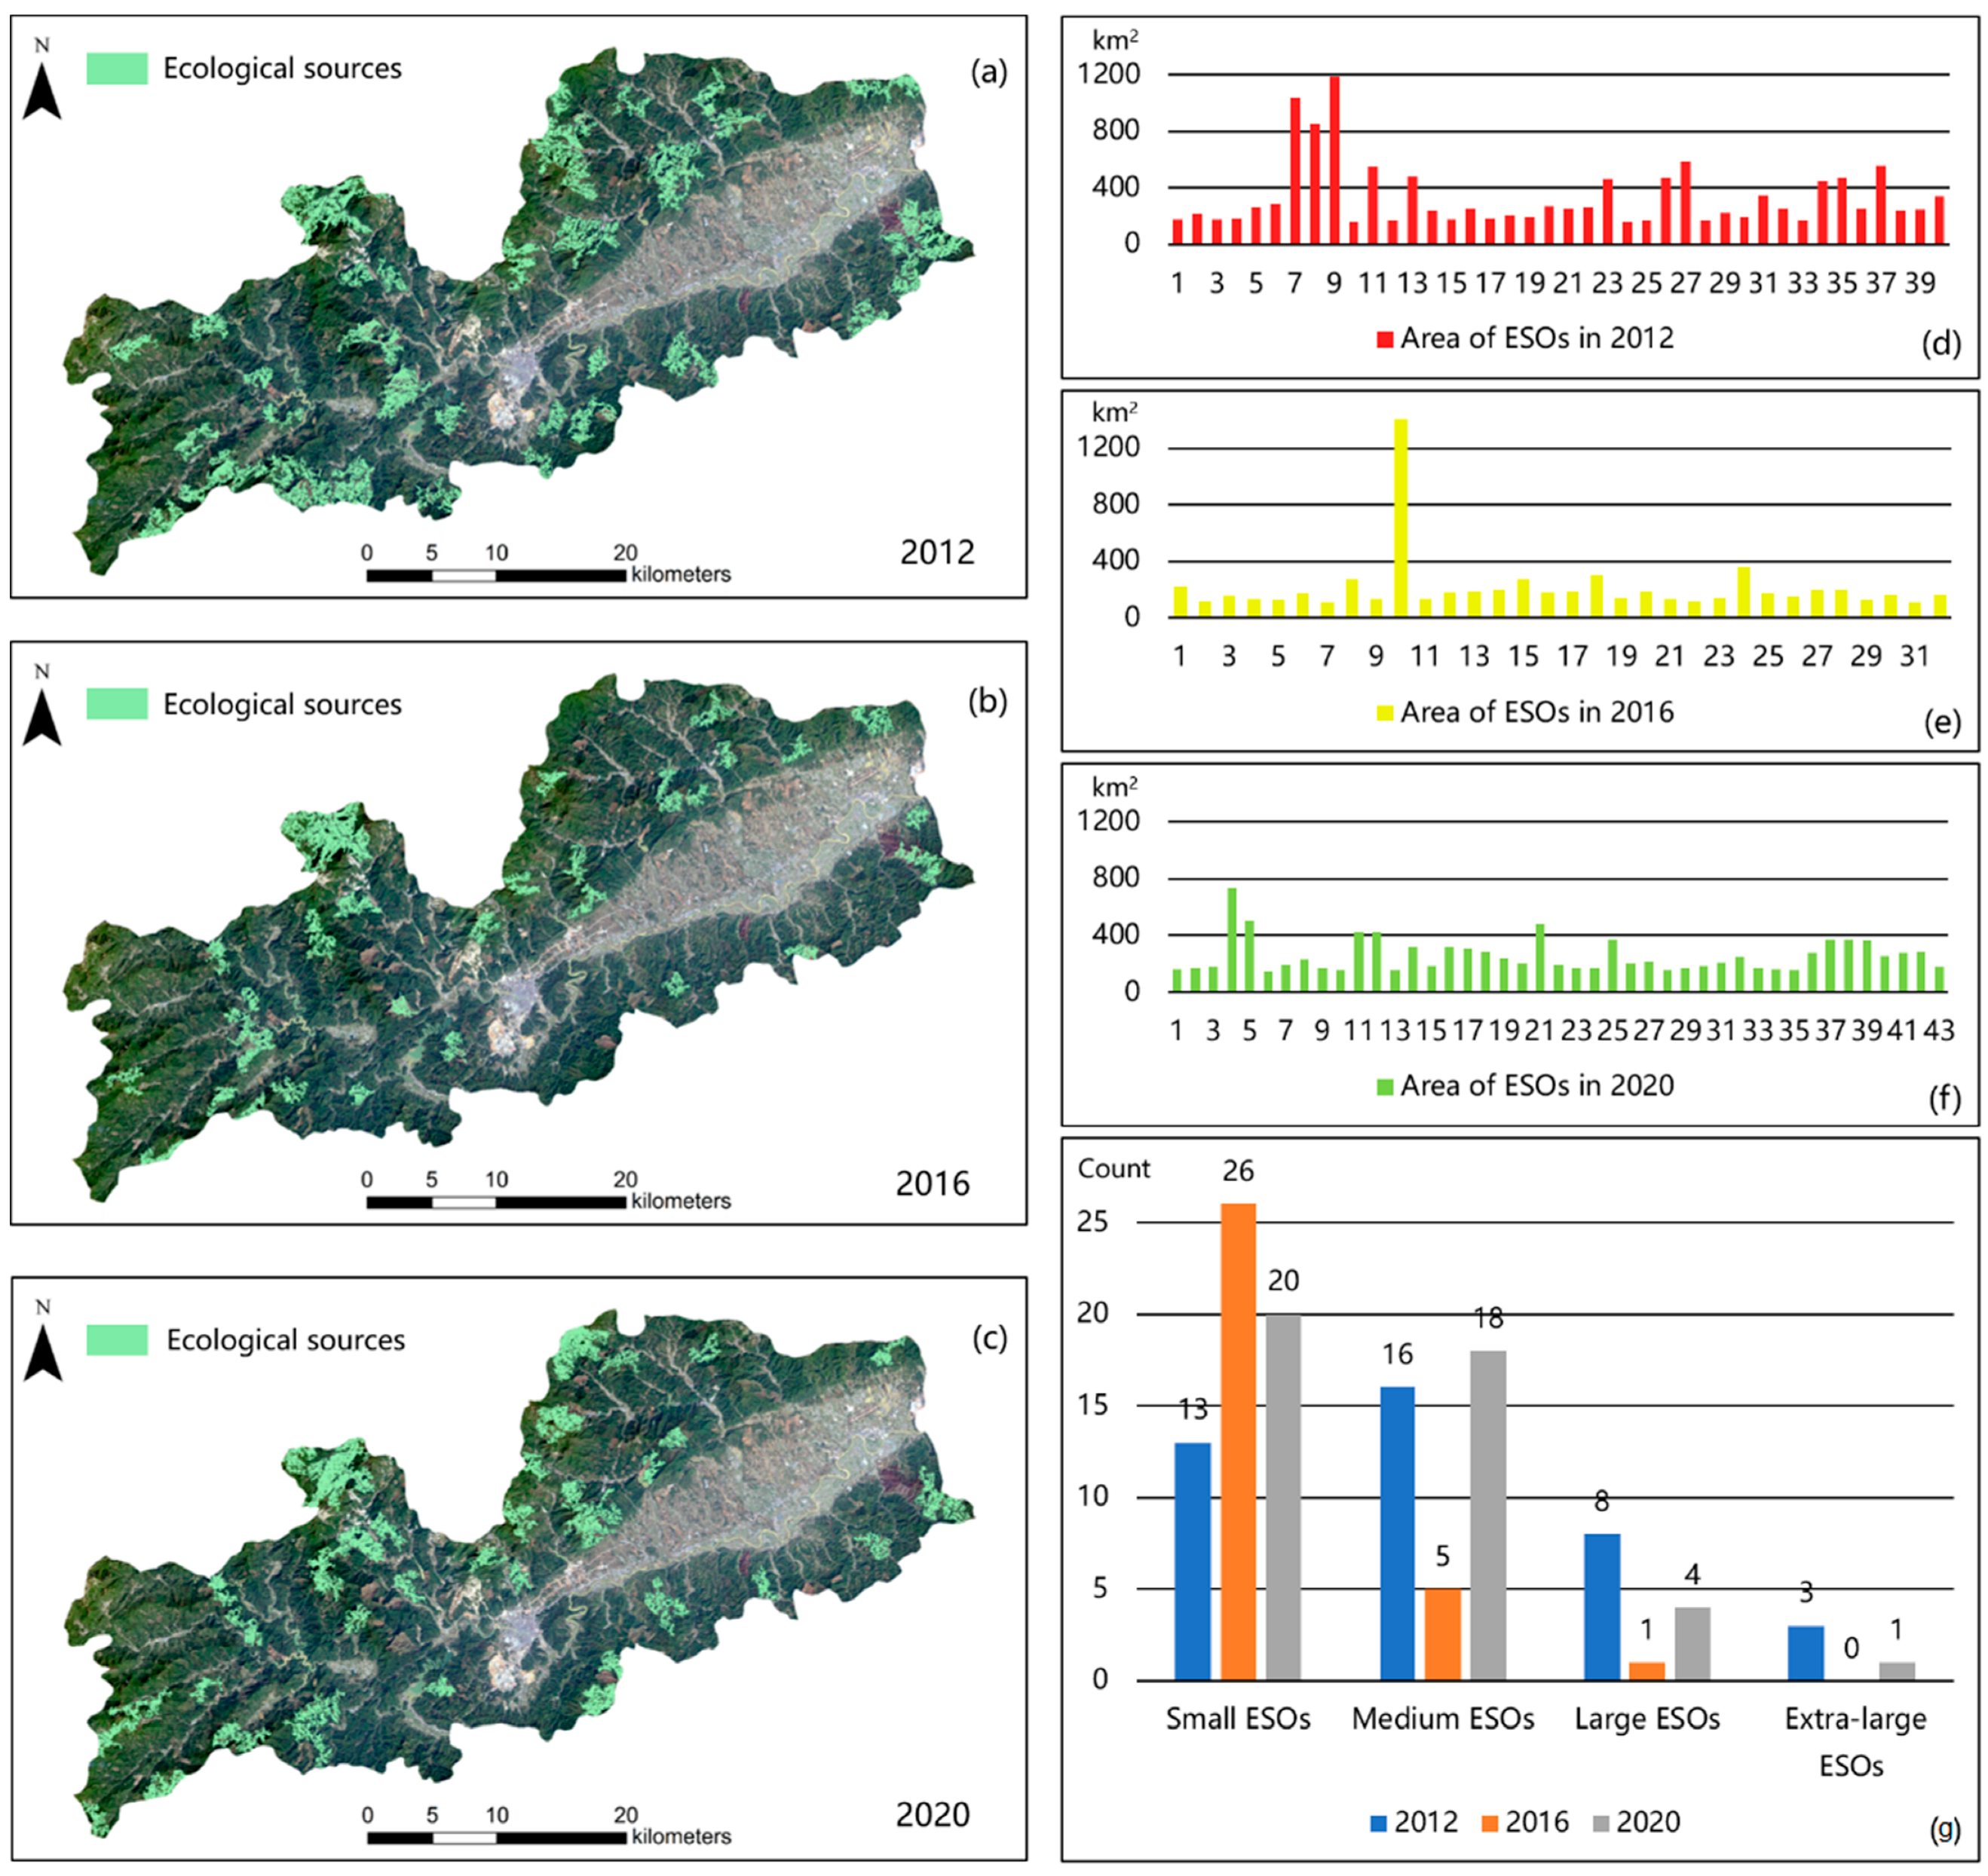
3.1. The ESOs Identification

In Dayu County, the RSEI indexes of the urban and forest land showed significant differences. In 2012, the RSEIs in the urban areas were smaller than 0.5, indicating poor ecological security (Figure 3a). In 2016, the RSEIs in the urban areas were higher than before, indicating improvement in the urban ecosystems (Figure 3b). In 2020, the high RSEIs were concentrated in the mountains and woodlands (Figure 3c). The statistics of the RSEIs show that the modes of the RSEIs were all ~0.70 in 2012, 2016, and 2020 (Figure 3d–f); the mean RSEIs were higher in 2020 than in 2012 and 2016, indicating the improvement of the ecosystems (Figure 3g); and the standard deviation increased from 2012 to 2020, indicating the increasingly clustered pattern of ecological security (Figure 3g).
By implementing the optimal threshold of 0.7 on the RSEIs, we identified 39 ESOs in 2012, 31 ESOs in 2016, and 43 ESOs in 2020 in the Dayu study area (Figure 4). In 2012, more than 20 ESOs were found in the west and north areas (Figure 4a); in 2016, no ESOs were found in the central urban areas (Figure 4b); and in 2020, relatively few ecological resources were found in the eastern areas (Figure 4c). In 2012, the 11 ESO areas exceeded 400 km2, of which three ESOs exceeded 800 km2 (Figure 4d); in 2016, the number of ESOs that were larger than 400 km2 was reduced to only one (Figure 4e); and in 2020, most ESOs increased in areas compared to those in 2016 (Figure 4f). We used the area as an index to divide the ESOs into four levels: small ESOs smaller than 400 km2, medium ESOs between 400 km2 and 800 km2, large ESOs between 800 km2 and 1200 km2, and extra-large ESOs larger than 1200 km2 (Figure 4g). During 2012–2016, while the number of total ESOs decreased, the small ESOs increased significantly; this suggests that the small ESOs in 2012 were fragmented into several smaller ESOs, which consequently disappeared in 2016. In contrast, the period of 2016–2020 witnessed significant growth, as proven by the increases in medium, large, and extra-large ESOs; however, the ecosystems had not recovered back to the status as in 2012.

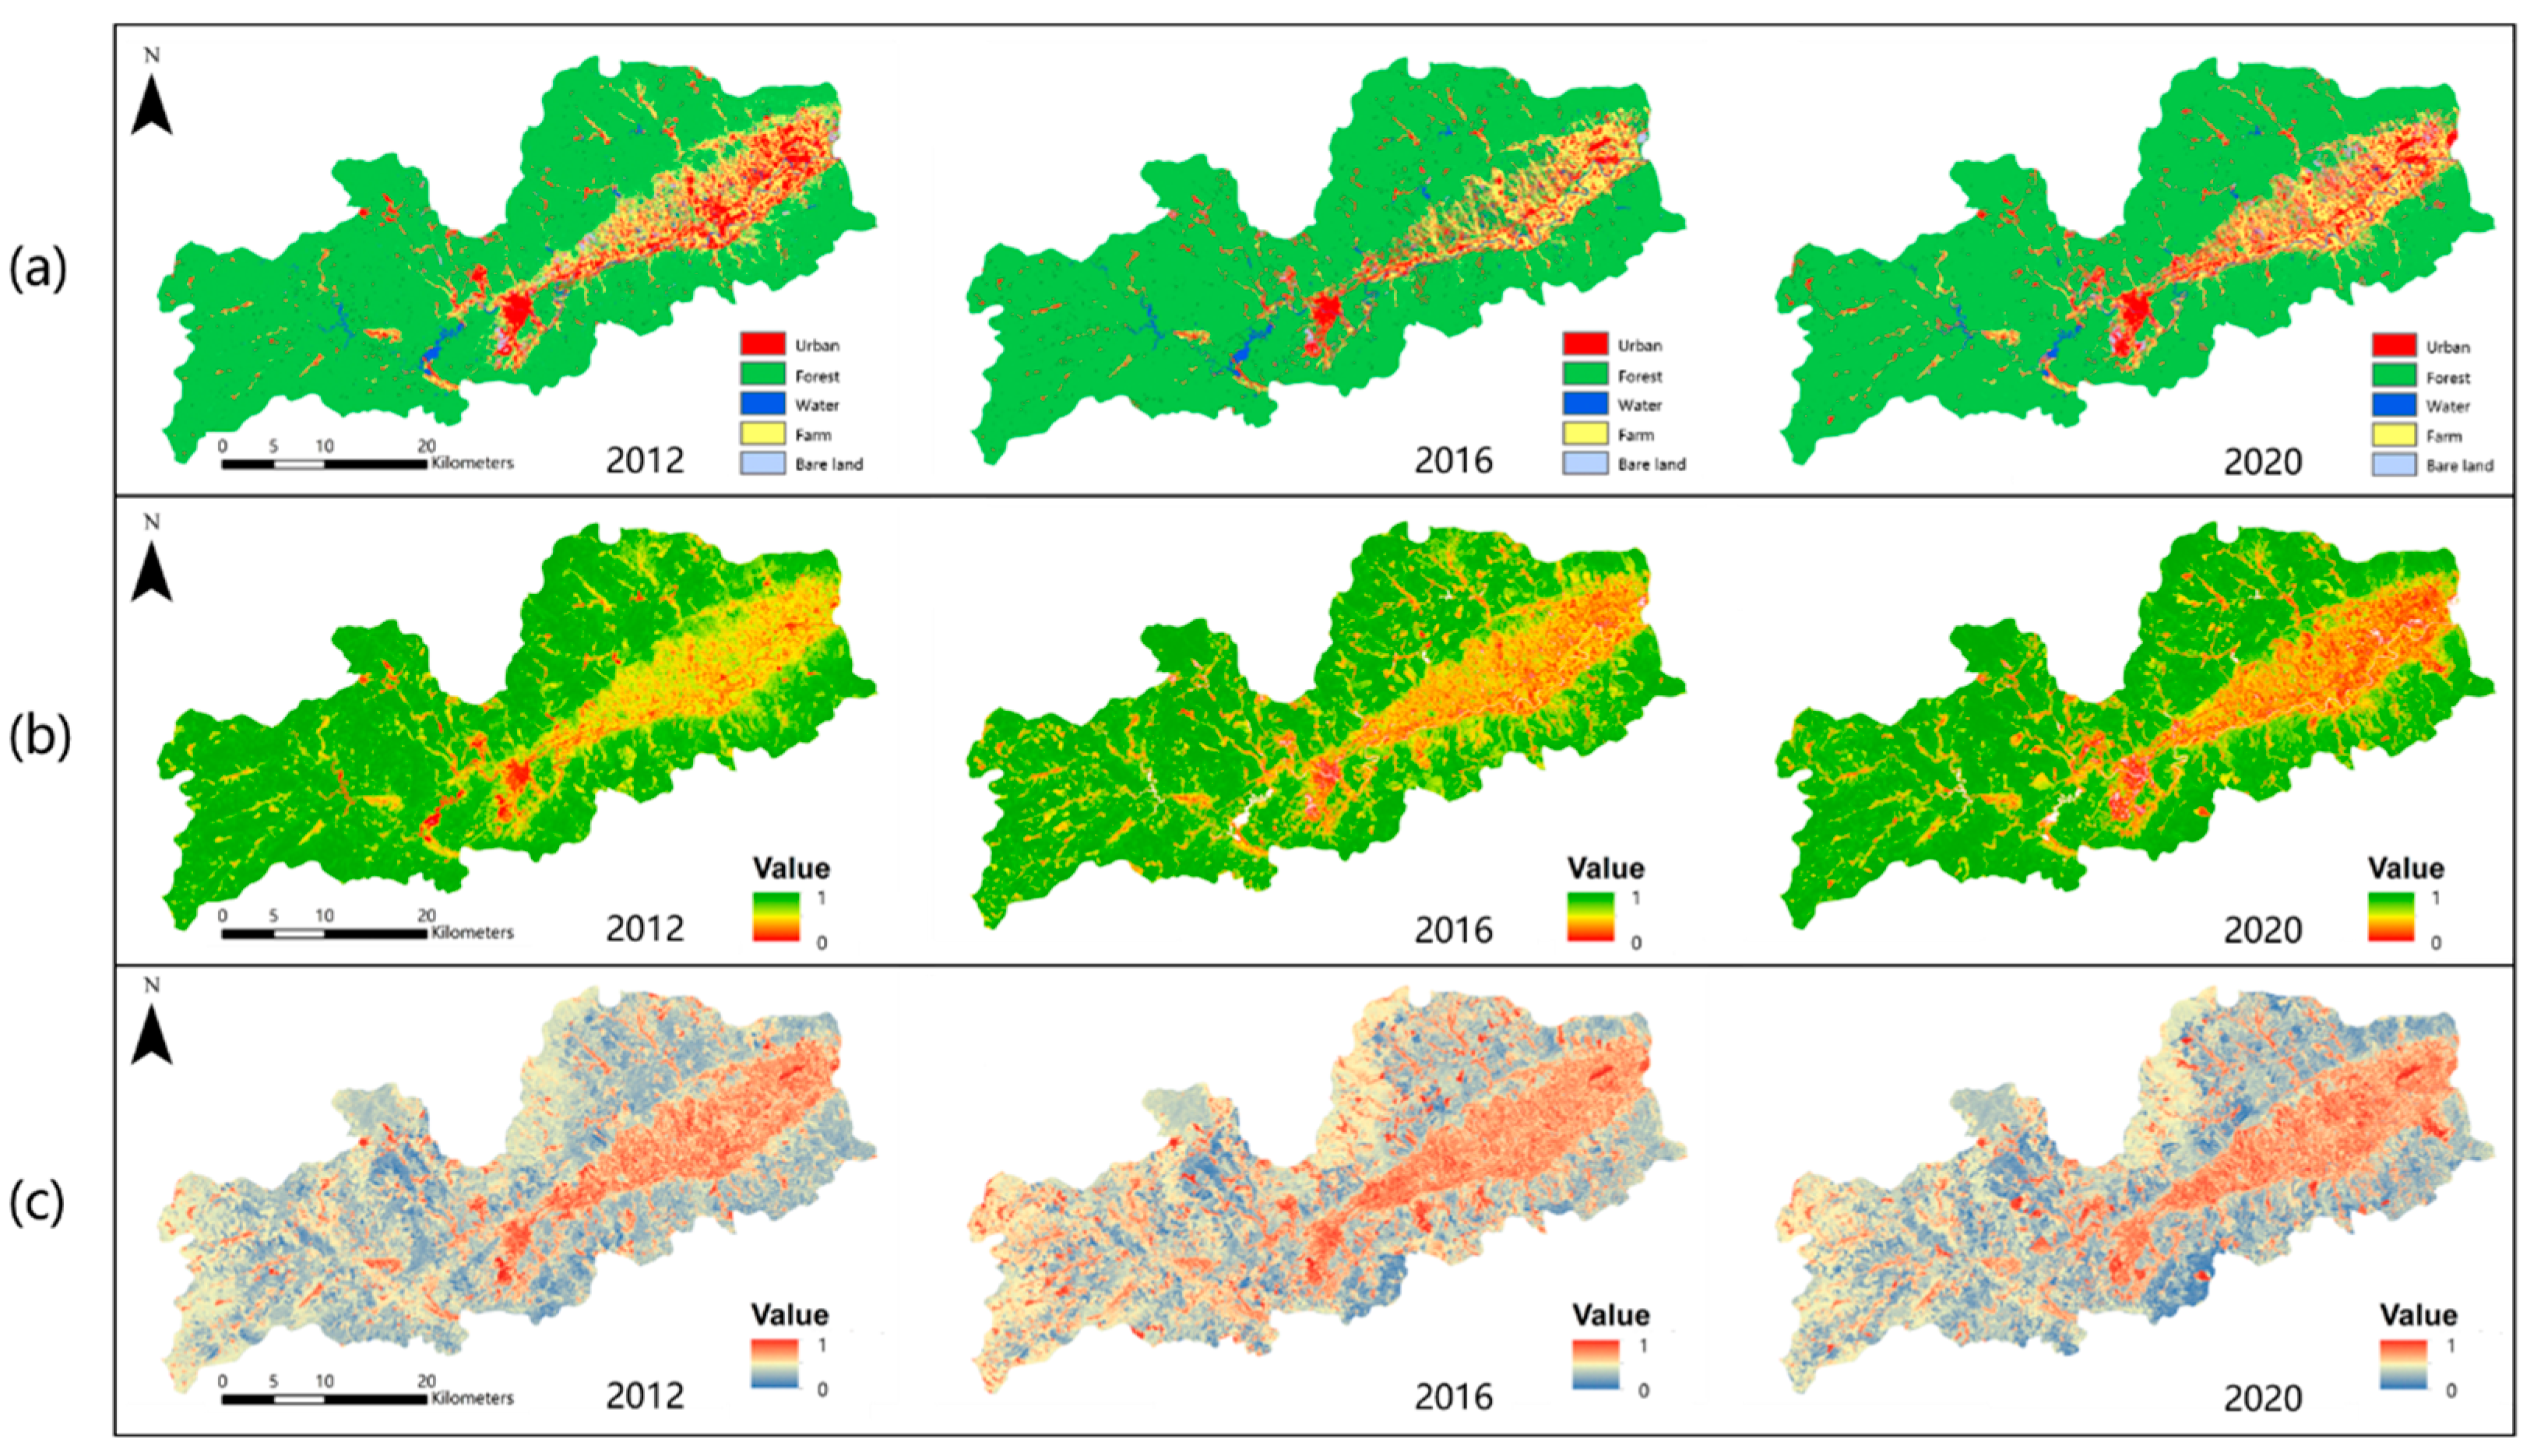
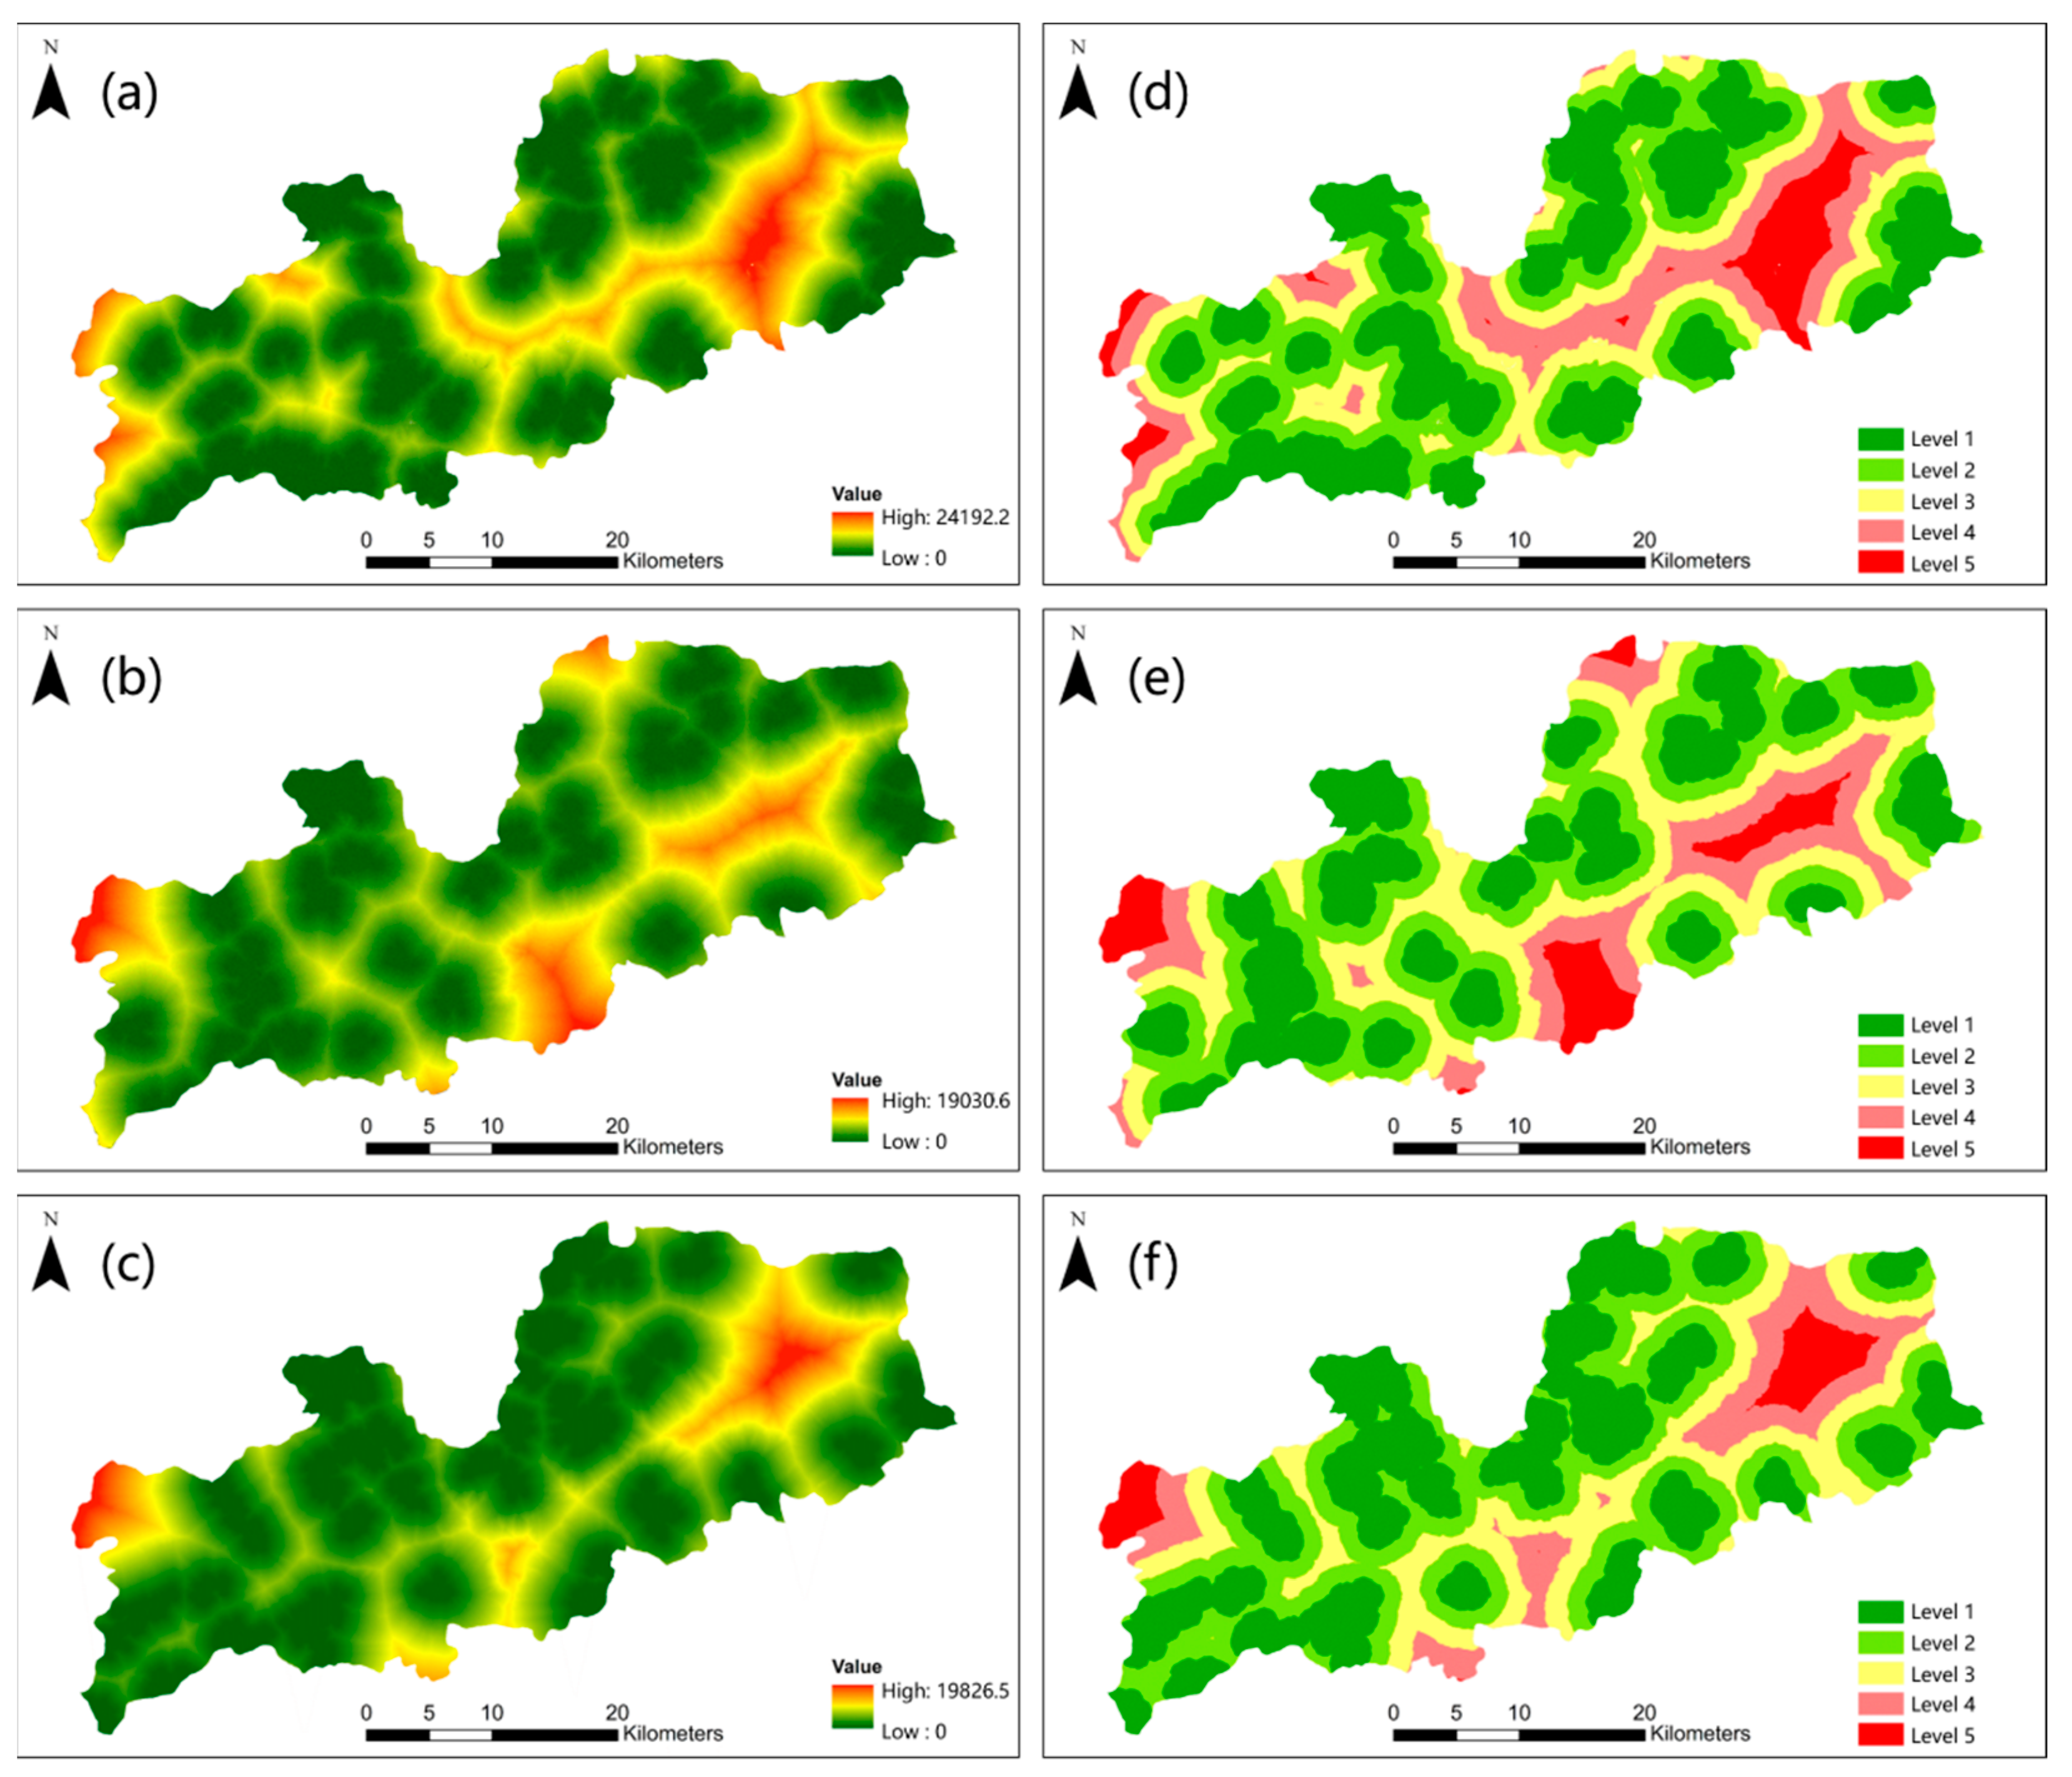
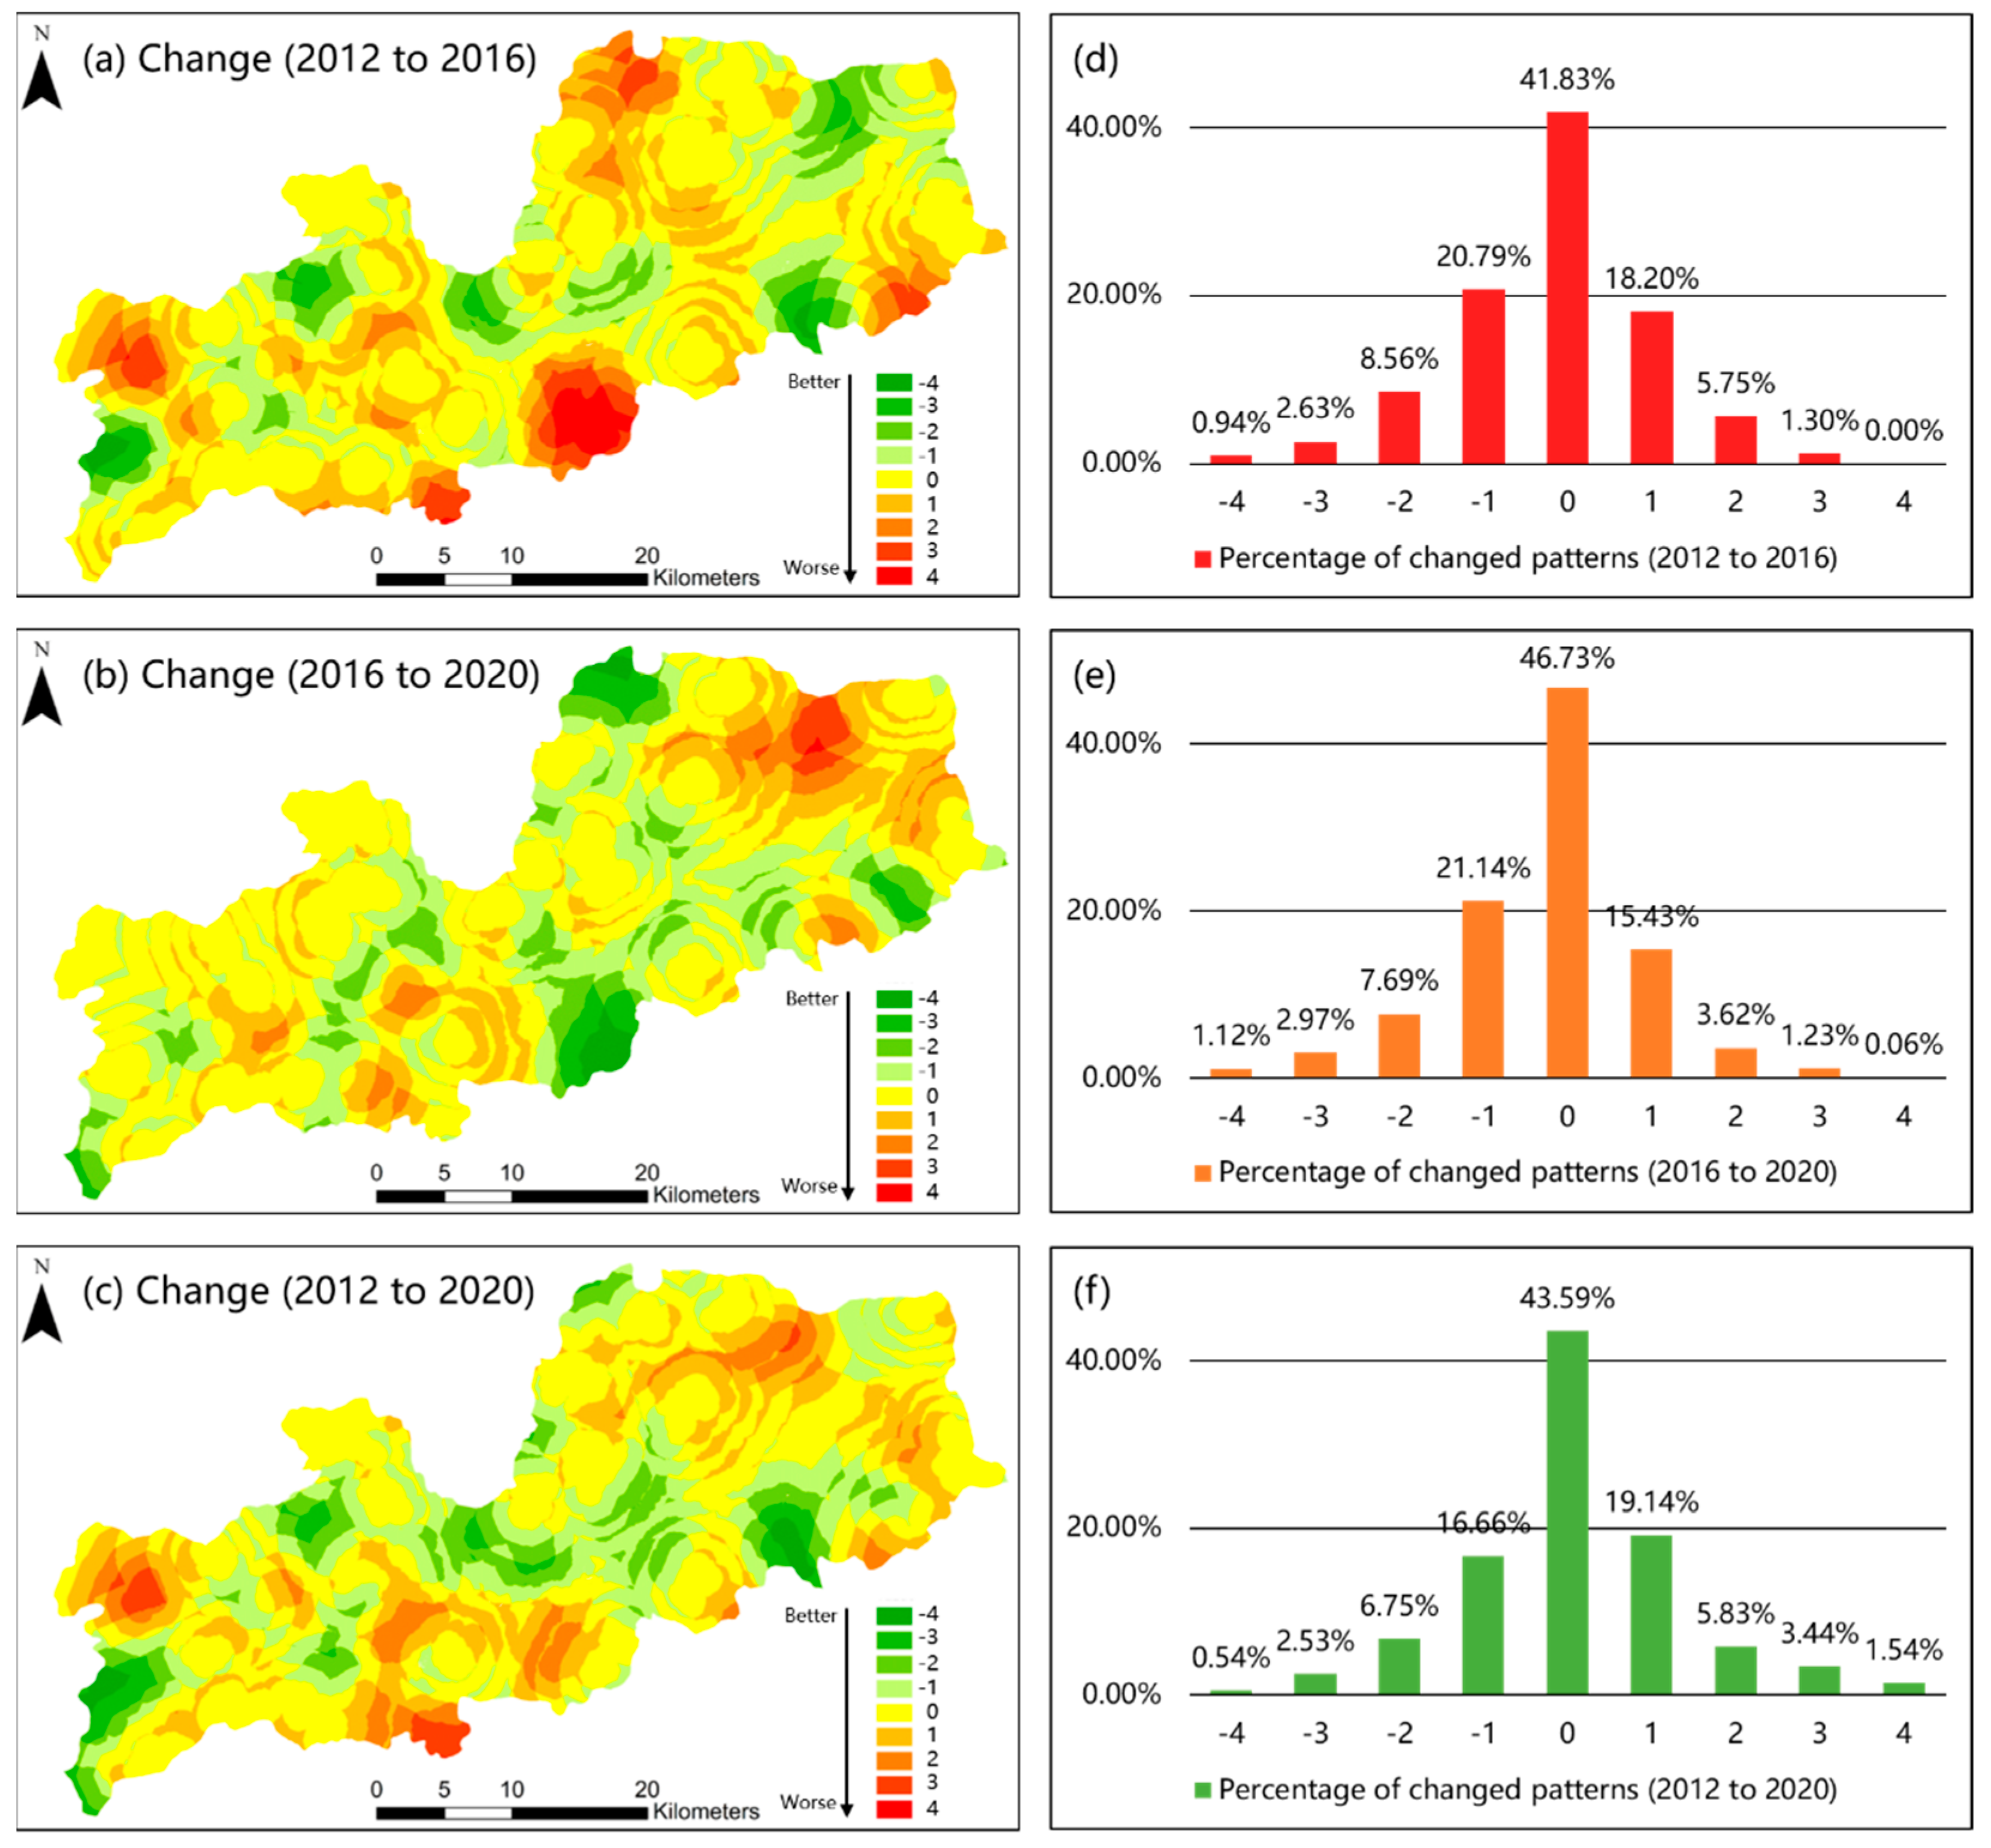
3.2. The Ecological Security Patterns

Based on the identified ESOs, the ecological cumulative resistances were calculated and the spatial change was significant between 2012 and 2020 (Figure 5a–c). For the ecological security patterns, level-1 represents the best ecological security, and level-5 represents the lowest ecological security (Figure 5d–f). After mapping the ecological security patterns, the area and proportion were calculated for each ecological security level in Dayu (Table 3). From 2012 to 2020, the first-level security maintained the largest area, the second-level security gained a gradual increase, the fourth-level received a gradual decrease, and the fifth-level was always the smallest, indicating the relatively good situation of Dayu in the past eight years. In 2016, the first-level areas accounted for the lowest proportion compared to those in other years, and the fifth-level area accounted for the highest proportion compared to those in other years, indicating a relatively less optimistic situation from 2012 to 2016. Compared with 2016, the proportion of level-1 in 2020 increased significantly, and level-3, level-4, and level-5 all declined in areas and sizes, indicating a significant improvement in the ecological security situation in Dayu.
Figure 6 shows the ecological security patterns and the change in percentages from 2012 to 2020. In 2012, the worst (i.e., fifth-level) ecological security zone was mainly in Chijiang Town, east of Dayu. However, in 2016, the fifth-level security zone in Chijiang decreased significantly in area, and the ecological security level of Nan’an declined significantly (Figure 6a). From 2012 to 2020, the lower security levels tended to move closer to the eastern border of Dayu (Figure 6b). For the central areas of Dayu, most belonged to the fourth-level security zone in 2012, and most were downgraded to the fifth-level in 2016, but some recovered to the third-level in 2020 (Figure 6c). From 2012 to 2016, at least 40% of Dayu’s ecological security level remained unchanged, with slightly more areas with improved ecological quality than areas with decreased ecological quality (Figure 6d). However, by analyzing the number of ESOs and the changes in land area of various types, we found that the ecological security status of Dayu was worse in 2016 than in 2012. From 2016 to 2020, the ecological security level of larger areas was upgraded (Figure 6e). However, the areas of land with better ecological security in 2020 were smaller than those in 2012 (Figure 6f).

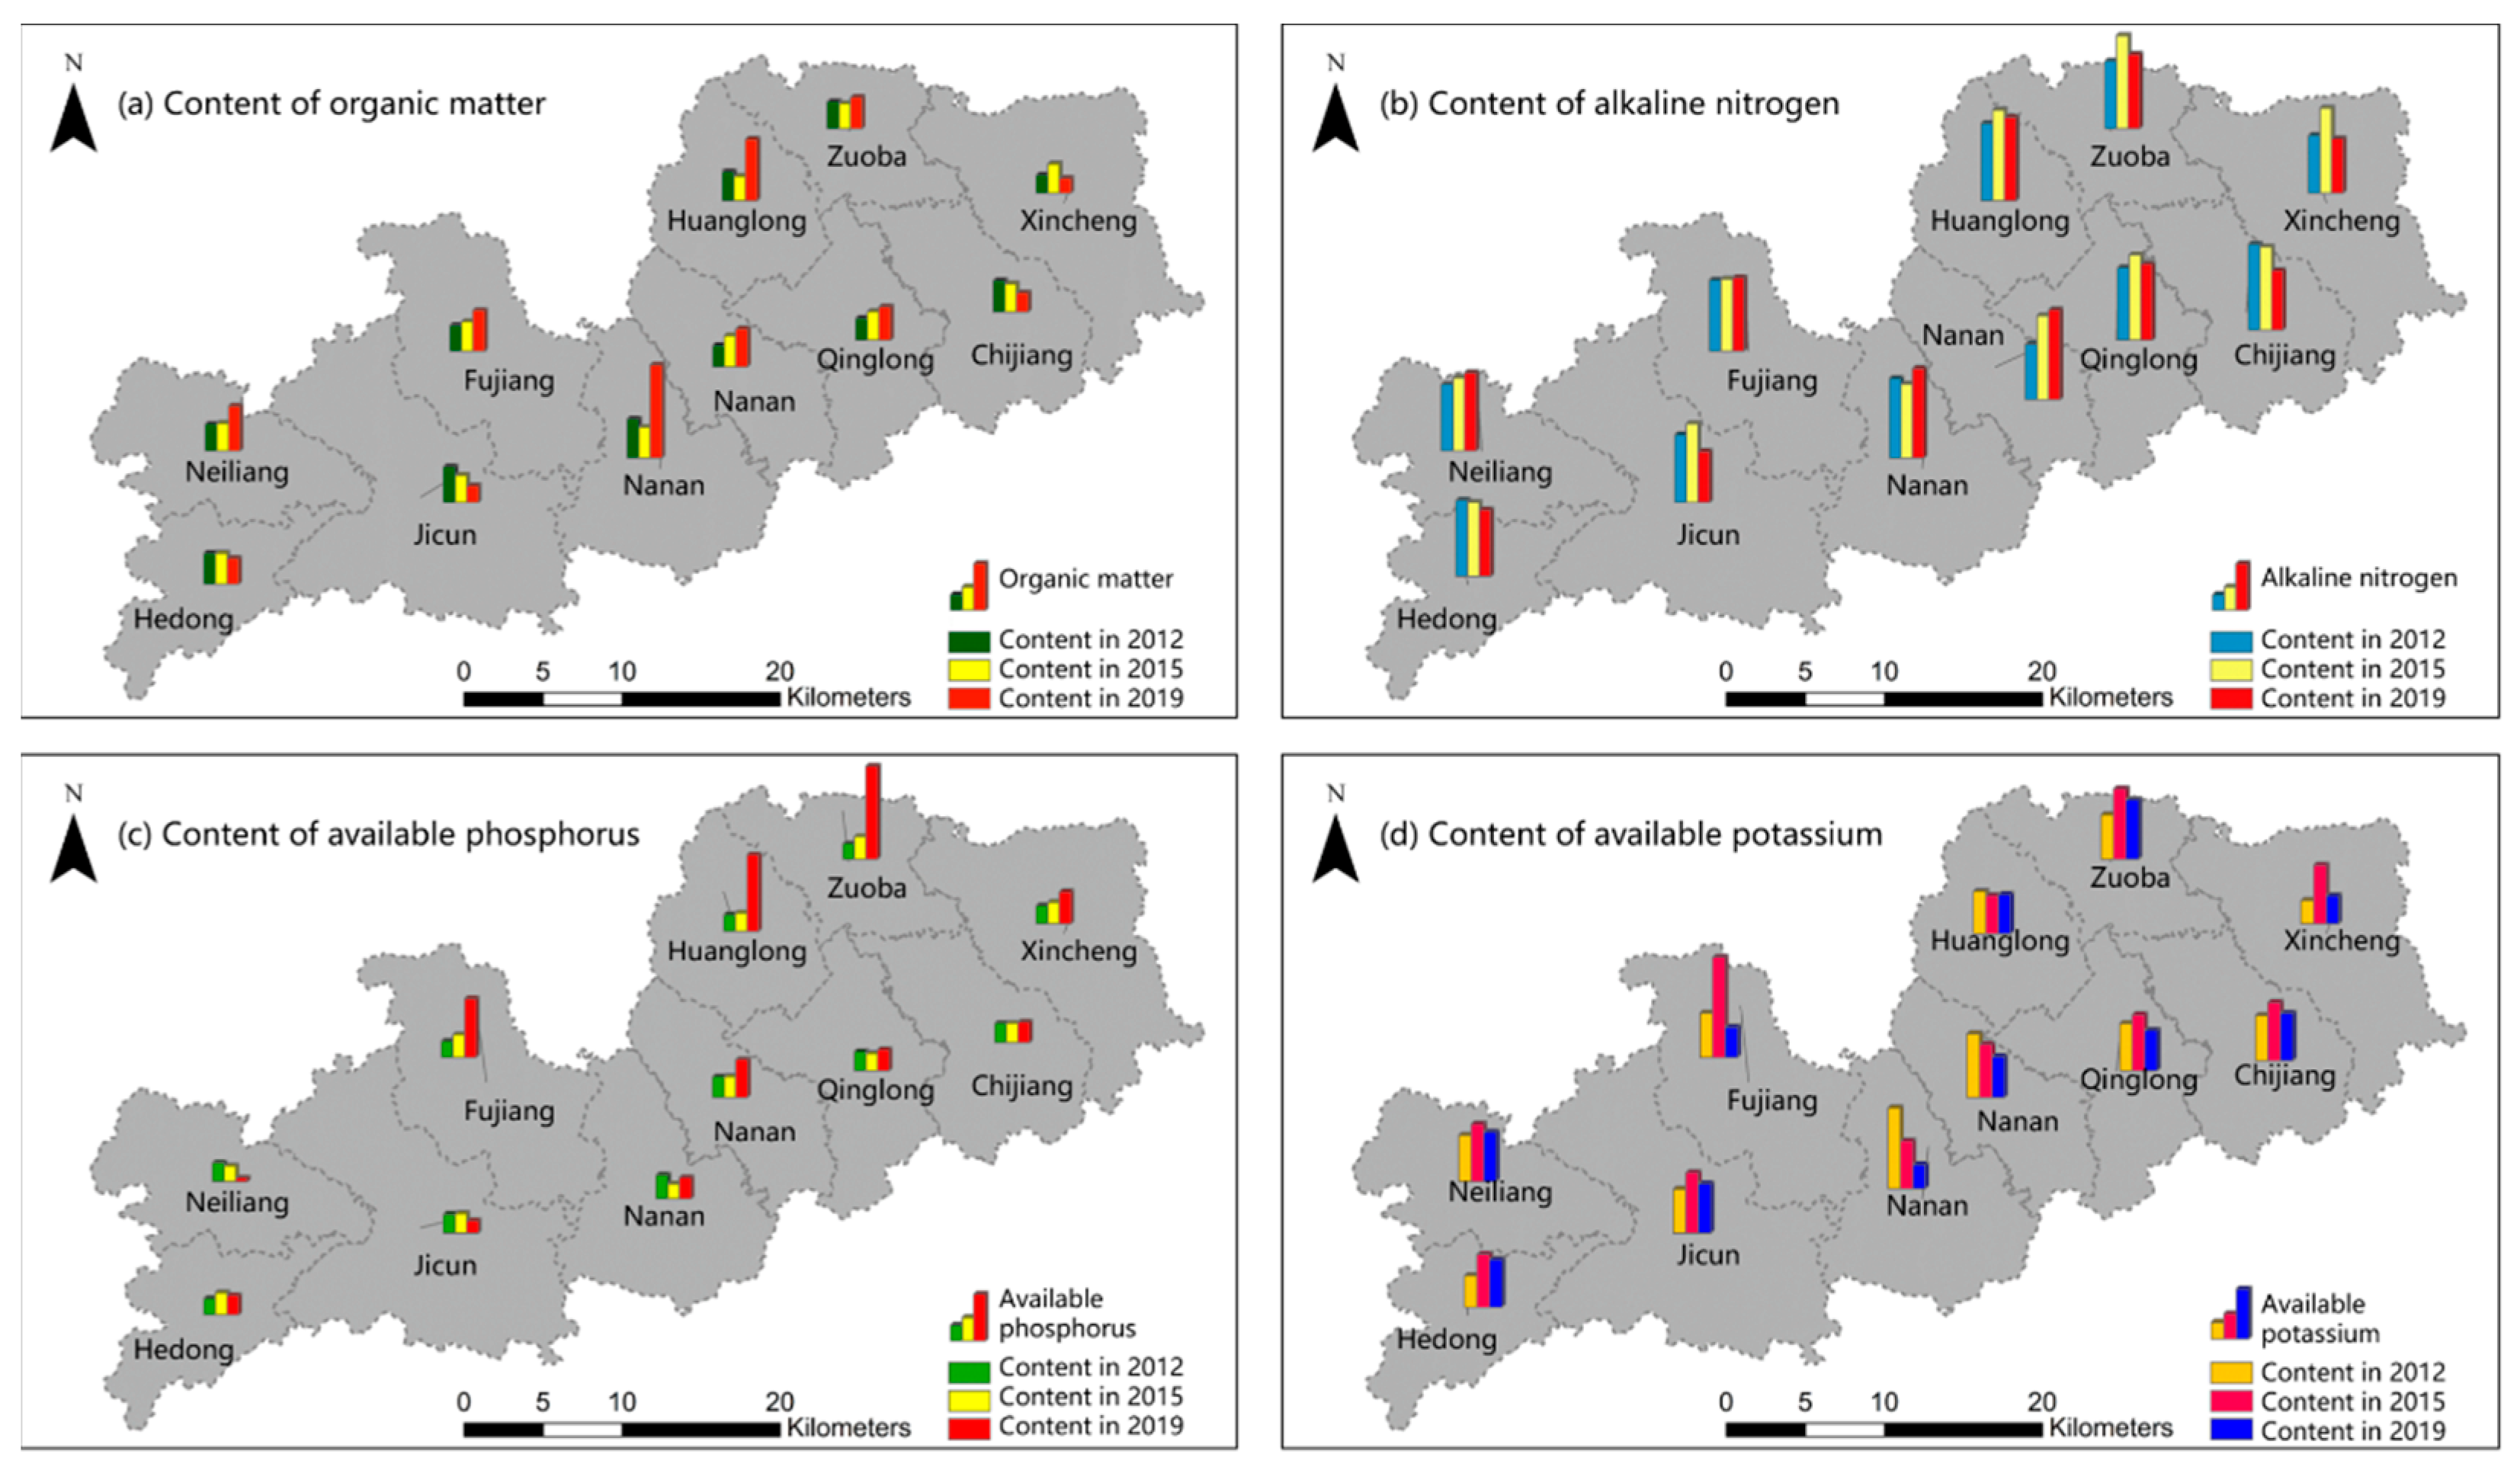
3.3. The Impacts on Soil Quality

As the soil quality of Dayu directly affected the ecological environments, we analyzed the ecological security pattern to explore the changes in soil nutrients. Due to the lack of soil data in 2016 and 2020, we instead used the closest soil data in 2012, 2015, and 2019 for the analysis. In the above three years, the annual average PHs of the soil were 5.46, 5.15, and 5.40, respectively, and the soil was slightly acidic. Soil nutrient statistics showed that the parent materials for soil formation were mainly loess and alluvial, which were rich in organic matter, alkali-hydrolyzable nitrogen, available phosphorus, and available potassium (Table 4). From 2012 to 2019, in 11 townships of Dayu, these substances promoted the growth of crops and effectively maintained the balance of the ecological environment.
In 2015, the four nutrients in the soil of Nanan were all in a low state, consistent with the poor ecological security pattern, as revealed in Figure 7a. In Neiliang and Hedong where the human activities were less dense, the soil consisted of the hemp sand mud fields and the nutrient contents were relatively stable with high ecological security levels. The nutrient contents in the soil of Fujiang and Huanglong increased over time, which was consistent with the improvement of ecological security (Figure 7b). However, the content of available potassium decreased to a large extent in 2019. The soil nutrient content in Zhangdou and Zuoba was relatively stable, and the soil security level was good as well (Figure 7c). The various nutrient contents in the soil of Chijiang showed a downward trend, which was consistent with the poor regional ecological security pattern. The soil nutrient content of Xincheng in 2019 was low, and the ecological security level was also slightly reduced, indicating the threats caused by urbanization to the soil security (Figure 7d).

4. Discussion

4.1. The Analysis of the ESO Identification

In the ESO identification, the optimal threshold was usually assigned based on the ecological situation of the study area [10,29]. In this study, five sets of ecological security thresholds were selected in the range of 0.5 to 0.9 with an interval of 0.1 to conduct the sensitivity analysis (Table 5). The thresholds of 0.5 or 0.9 resulted in an extreme high of extracted ESOs. A threshold of 0.8 resulted in the average ESOs being smaller than 200 km2, the related area and quantity of the ESOs decreased significantly than the results of the threshold of 0.7. A threshold of 0.6 significantly increased the number of ESOs, but the area did not change significantly compared to a threshold of 0.7, indicating that the excesses were all small ESOs smaller than 200 km2. The area and number of ESOs extracted using a threshold of 0.7 were at a medium level, which was in line with the actual situation of Dayu.
The number of ESOs was closely related to the quality of the ecological environment and the intensity of human activities in the area. In 2012, the ESOs were mostly located in the west and north areas because these areas were covered by large areas of forests that indicated the best ecological capability. In these areas, the mountains with high altitudes and large slopes also made the ecosystems less affected by human activities. In 2016, the central areas with high-density human activities caused significant damages to the ecological environments, resulting in the lack of ecological resources in this area. In 2020, in the eastern areas, there were relatively few ecological resources because of the human villages and modern facilities such as sand quarries and airports.

4.2. The Analysis of the Spatiotemporal Ecological Security Pattern

Even though Dayu’s mineral resources were considered to be exhausted around 2012, mining activities did not stop, resulting in even more serious damage to the ecological environment in the central region in 2016. Subsequently, the local government of Dayu issued a few policies to promote the transformation of this resource-depleted city, and implemented the recovery projects to actively control mine pollution, including the “Inspection of Nature Reserves”, “National Voluntary Tree Planting”, and “Reconstruction of Low-Quality and Low-Efficiency Forests” [52,53,54]. The subsequent strict implementation of environmental protection policies significantly improved the ecological security level of central Dayu in 2020. In this research, the recovery of ecosystems referred to the resumption of area. Although the impact of mine pollution on the environment has been greatly reduced, frequent human activities still pose a great threat to the ecological security in the urban area [43,55,56,57,58]. According to the statistical yearbooks and related plans, the eastern part has attracted many modern facilities such as factories, sand quarries, and airports. The eastern area is the main transportation route for transporting minerals, and new industrial parks are mainly concentrated in this area, which may be the main reason for its poor ecological security. This shows that the mining and transportation of mine resources had great impacts on the surrounding ecological environments, and the urbanization and factory construction also had great impacts on the decline of ecological security. Although the relevant policies and plans for mine pollution control have achieved good implementation results, local governments also need to pay attention to the negative impact of high-intensity human activities on ecological security.

4.3. The Analysis of the Spatial Impacts on Soil Quality

Ecological security is an important indicator of the health of the natural environment; in the case study area of Dayu, the long-term mining of mineral resources has seriously damaged the ecological environment. The content of heavy metals such as cadmium in the soil of the eastern mining area has been detected to exceed the standard requirements seriously [43,56]. Different from the traditional method of soil quality assessment using chemical analysis, this study focuses on the impacts of ecological security on soil quality. The spatiotemporal ecological security pattern constructed by RSEI and ecological sources was consistent with the changes in soil nutrients. The consistence was because the deterioration of the ecological environment destroyed the nutrients in the soil then affected the vegetation growth. In areas with many mines and high levels of human activity, soil security was poor, indicating roughly equal soil damage from human activity and mining. The variables used to calculate RSEI linked the ecological security pattern and the soil quality. The identification of this relationship will support initial investigations of soil quality using ecological security modeling in the early stages of soil quality assessment. When modeling ecological security, the mode of RSEI showed a rising trend from 2012 to 2020. As Dayu has a high proportion (e.g., 70%) of forests, the mode of RSEI was considered to represent the RSEIs of forests. The increases reflected the continuous improvement of the ecological security level of the forests, as proven by the increases in vegetation growth level, soil moisture content, and soil temperature.
In response to the ecological security situation of Dayu, workers have carried out a lot of research, and the local government has formulated relevant policies [55]. Under the strict implementation of the promulgated environmental protection policies, the ecological environment of Dayu has been improved to a certain extent. In the future, the local government needs to strengthen the supervision of mining, and promote policies such as green mine construction and net mine transfer. Considering the local resources, the local government needs to control the scale and intensity of mining, promote the mine restoration policy, and minimize the damage to the environment caused by resource mining. The local government needs to appropriately plan the location of factories and residential areas according to the type of land use and the characteristics of production and life. In addition, the local government can properly handle the pollutants generated by residents’ production and life, reducing damage to the environment. Furthermore, it is necessary to establish sound ecological protection and restoration policy for mountains, rivers, forests, fields, lakes, grasses, and sands.

5. Conclusions

Based on the synthesizing multi-source spatial and remote sensing data, we propose an identification method for ESOs based on RSEI, and use the least cumulative resistance model to analyze the ecological security pattern of Dayu. By analyzing the spatiotemporal evolution of ecological security and soil nutrition survey data, we reveale the impact of ecological security on soil quality.
In Dayu, at least 40% of the area is ecologically secure and stable—there were 39 ESOs in 2012, 31 ESOs in 2016, and 43 ESOs in 2020. We found that ecological security was negatively correlated with the intensity of human activities, but this relationship was different in different cities and towns. Mine pollution and high-intensity human activities have had a significant impact on the safety of the ecological environment in Dayu. In 2016, Dayu launched an environmental protection policy, and the improvement of its ecological security status was closely related to the implementation of active environmental protection policies. In addition, we found that soil security and ecological security are consistent in the spatial and temporal patterns. In areas with many mines and frequent human activities, soil safety is poor, indicating that urbanization and human activities damage soil as much as mining. Therefore, we suggest that the local government should pay attention to changes in soil quality in Dayu city center and the surrounding areas, and formulate relevant policies or carry out relevant scientific research to improve soil quality. The local government should continue to implementing environmental protection policies to promote the optimization of the ecological environment.

Author Contributions

Conceptualization, X.S. and J.W.; methodology, X.S.; software, R.L.; validation, X.S., P.L. and R.L.; formal analysis, P.L. and P.C.; investigation, X.S., J.W. and R.L.; resources, J.W.; data curation, X.S.; writing—original draft preparation, X.S.; writing—review and editing, P.L.; visualization, P.L. and P.C.; supervision, X.S.; project administration, J.W. All authors have read and agreed to the published version of the manuscript.

Funding

This research received no external funding.

Institutional Review Board Statement

Not applicable.

Informed Consent Statement

Not applicable.

Data Availability Statement

The data that support the findings of this study are openly available in figshare at https://doi.org/10.6084/m9.figshare.19121780.v2 (accessed on 4 February 2022).

Conflicts of Interest

The authors declare no conflict of interest.

References

  1. Feng, Y.; Yang, Q.; Tong, X.; Chen, L. Evaluating land ecological security and examining its relationships with driving factors using GIS and generalized additive model. Sci. Total Environ. 2018, 633, 1469–1479. [Google Scholar] [CrossRef] [PubMed]
  2. Deng, J.S.; Wang, K.; Hong, Y.; Qi, J.G. Spatio-temporal dynamics and evolution of land use change and landscape pattern in response to rapid urbanization. Landsc. Urban Plan. 2009, 92, 187–198. [Google Scholar] [CrossRef]
  3. Lee, L.S.; Zhang, H.; Jim, C.Y. Serviceable tree volume: An alternative tool to assess ecosystem services provided by ornamental trees in urban forests. Urban For. Urban Green. 2021, 59, 127003. [Google Scholar] [CrossRef]
  4. Lee, L.S.; Jim, C.Y.; Zhang, H. Tree density and diversity in Hong Kong’s public housing estates: From provision injustice to socio-ecological inclusiveness. Urban For. Urban Green. 2019, 46, 126468. [Google Scholar] [CrossRef]
  5. Pirages, D.C.; DeGeest, T.M. Ecological Security: An Evolutionary Perspective on Globalization; Rowman & Littlefield Publishers: Lanham, MA, USA, 2003. [Google Scholar]
  6. Rogers, K.S. Ecological security and multinational corporations. Environ. Change Secur. Proj. Rep. 1997, 3, 29–36. [Google Scholar]
  7. Hodson, M.; Marvin, S. ‘Urban ecological security’: A new urban paradigm? Int. J. Urban Reg. Res. 2009, 33, 193–215. [Google Scholar] [CrossRef]
  8. Bashagaluke, J.B.; Logah, V.; Opoku, A.; Sarkodie-Addo, J.; Quansah, C. Soil nutrient loss through erosion: Impact of different cropping systems and soil amendments in Ghana. PLoS ONE 2018, 13, e0208250. [Google Scholar] [CrossRef] [Green Version]
  9. Mensah, C.A. Destruction of urban green spaces: A problem beyond urbanization in Kumasi city (Ghana). Am. J. Environ. Prot. 2014, 3, 1–9. [Google Scholar] [CrossRef] [Green Version]
  10. Su, Y.; Chen, X.; Liao, J.; Zhang, H.; Wang, C.; Ye, Y.; Wang, Y. Modeling the optimal ecological security pattern for guiding the urban constructed land expansions. Urban For. Urban Green. 2016, 19, 35–46. [Google Scholar] [CrossRef]
  11. Dong, R.; Zhang, X.; Li, H. Constructing the ecological security pattern for sponge city: A case study in zhengzhou, china. Water 2019, 11, 284. [Google Scholar] [CrossRef] [Green Version]
  12. Su, Y.; Zhang, H.; Chen, X.; Huang, G.; Ye, Y.; Wu, Q.; Huang, N.; Kuang, Y. The ecological security patterns and construction land expansion simulation in Gaoming. Acta Ecol. Sin. 2013, 33, 1524–1534. [Google Scholar]
  13. Haeuber, R.; Ringold, P. Ecology, the social sciences, and environmental policy 1. Ecol. Appl. 1998, 8, 330–331. [Google Scholar] [CrossRef]
  14. Chen, L.; Fu, B.; Zhao, W. Source-sink landscape theory and its ecological significance. Front. Biol. China 2008, 3, 131–136. [Google Scholar] [CrossRef]
  15. Brawn, J.D.; Robinson, S.K. Source-sink population dynamics may complicate the interpretation of long-term census data. Ecology 1996, 77, 3–12. [Google Scholar] [CrossRef]
  16. Zhang, Y.; Jiang, Z.; Li, Y.; Yang, Z.; Wang, X.; Li, X. Construction and optimization of an urban ecological security pattern based on habitat quality assessment and the minimum cumulative resistance model in Shenzhen city, China. Forests 2021, 12, 847. [Google Scholar] [CrossRef]
  17. Li, F.; Ye, Y.; Song, B.; Wang, R. Evaluation of urban suitable ecological land based on the minimum cumulative resistance model: A case study from Changzhou, China. Ecol. Model. 2015, 318, 194–203. [Google Scholar] [CrossRef]
  18. Peng, J.; Yang, Y.; Liu, Y.; Du, Y.; Meersmans, J.; Qiu, S. Linking ecosystem services and circuit theory to identify ecological security patterns. Sci. Total Environ. 2018, 644, 781–790. [Google Scholar] [CrossRef] [Green Version]
  19. Doko, T.; Fukui, H.; Kooiman, A.; Toxopeus, A.; Ichinose, T.; Chen, W.; Skidmore, A. Identifying habitat patches and potential ecological corridors for remnant Asiatic black bear (Ursus thibetanus japonicus) populations in Japan. Ecol. Model. 2011, 222, 748–761. [Google Scholar] [CrossRef]
  20. Aminzadeh, B.; Khansefid, M. A case study of urban ecological networks and a sustainable city: Tehran’s metropolitan area. Urban Ecosyst. 2010, 13, 23–36. [Google Scholar] [CrossRef]
  21. Vergnes, A.; Kerbiriou, C.; Clergeau, P. Ecological corridors also operate in an urban matrix: A test case with garden shrews. Urban Ecosyst. 2013, 16, 511–525. [Google Scholar] [CrossRef]
  22. Li, Z.; Li, M.; Xia, B. Spatio-temporal dynamics of ecological security pattern of the Pearl River Delta urban agglomeration based on LUCC simulation. Ecol. Indic. 2020, 114, 106319. [Google Scholar] [CrossRef]
  23. Mandle, L.; Douglass, J.; Lozano, J.S.; Sharp, R.P.; Vogl, A.L.; Denu, D.; Walschburger, T.; Tallis, H. OPAL: An open-source software tool for integrating biodiversity and ecosystem services into impact assessment and mitigation decisions. Environ. Model. Softw. 2016, 84, 121–133. [Google Scholar] [CrossRef]
  24. Wang, C.; Yu, C.; Chen, T.; Feng, Z.; Hu, Y.; Wu, K. Can the establishment of ecological security patterns improve ecological protection? An example of Nanchang, China. Sci. Total Environ. 2020, 740, 140051. [Google Scholar] [CrossRef]
  25. Lin, Y.-P.; Lin, W.-C.; Wang, Y.-C.; Lien, W.-Y.; Huang, T.; Hsu, C.-C.; Schmeller, D.S.; Crossman, N.D. Systematically designating conservation areas for protecting habitat quality and multiple ecosystem services. Environ. Model. Softw. 2017, 90, 126–146. [Google Scholar] [CrossRef]
  26. Jin, X.; Wei, L.; Wang, Y.; Lu, Y. Construction of ecological security pattern based on the importance of ecosystem service functions and ecological sensitivity assessment: A case study in Fengxian County of Jiangsu Province, China. Environ. Dev. Sustain. 2021, 23, 563–590. [Google Scholar] [CrossRef] [Green Version]
  27. Li, J.; Song, C.; Cao, L.; Zhu, F.; Meng, X.; Wu, J. Impacts of landscape structure on surface urban heat islands: A case study of Shanghai, China. Remote Sens. Environ. 2011, 115, 3249–3263. [Google Scholar] [CrossRef]
  28. Kareiva, P.; Watts, S.; McDonald, R.; Boucher, T. Domesticated nature: Shaping landscapes and ecosystems for human welfare. Science 2007, 316, 1866–1869. [Google Scholar] [CrossRef] [Green Version]
  29. Fu, Y.; Shi, X.; He, J.; Yuan, Y.; Qu, L. Identification and optimization strategy of county ecological security pattern: A case study in the Loess Plateau, China. Ecol. Indic. 2020, 112, 106030. [Google Scholar] [CrossRef]
  30. Wang, Y.; Pan, J. Building ecological security patterns based on ecosystem services value reconstruction in an arid inland basin: A case study in Ganzhou District, NW China. J. Clean. Prod. 2019, 241, 118337. [Google Scholar] [CrossRef]
  31. Gao, J.; Du, F.; Zuo, L.; Jiang, Y. Integrating ecosystem services and rocky desertification into identification of karst ecological security pattern. Landsc. Ecol. 2021, 36, 2113–2133. [Google Scholar] [CrossRef]
  32. Karlen, D.L.; Mausbach, M.; Doran, J.W.; Cline, R.; Harris, R.; Schuman, G. Soil quality: A concept, definition, and framework for evaluation (a guest editorial). Soil Sci. Soc. Am. J. 1997, 61, 4–10. [Google Scholar] [CrossRef] [Green Version]
  33. Bünemann, E.K.; Bongiorno, G.; Bai, Z.; Creamer, R.E.; De Deyn, G.; de Goede, R.; Fleskens, L.; Geissen, V.; Kuyper, T.W.; Mäder, P. Soil quality–A critical review. Soil Biol. Biochem. 2018, 120, 105–125. [Google Scholar] [CrossRef]
  34. Doran, J.W.; Parkin, T.B. Defining and assessing soil quality. Defin. Soil Qual. Sustain. Environ. 1994, 35, 1–21. [Google Scholar]
  35. Moarrab, Y.; Salehi, E.; Amiri, M.; Hovidi, H. Spatial–temporal assessment and modeling of ecological security based on land-use/cover changes (case study: Lavasanat watershed). Int. J. Environ. Sci. Technol. 2021, 1–16. [Google Scholar] [CrossRef]
  36. Zhao, Y.; Zou, X.; Cheng, H.; Jia, H.; Wu, Y.; Wang, G.; Zhang, C.; Gao, S. Assessing the ecological security of the Tibetan plateau: Methodology and a case study for Lhaze County. J. Environ. Manag. 2006, 80, 120–131. [Google Scholar] [CrossRef]
  37. Sun, C.; Li, X.; Zhang, W.; Li, X. Evolution of ecological security in the tableland region of the chinese loess plateau using a Remote-Sensing-Based index. Sustainability 2020, 12, 3489. [Google Scholar] [CrossRef] [Green Version]
  38. Hu, X.; Xu, H. A new remote sensing index based on the pressure-state-response framework to assess regional ecological change. Environ. Sci. Pollut. Res. 2019, 26, 5381–5393. [Google Scholar] [CrossRef]
  39. Yue, H.; Liu, Y.; Li, Y.; Lu, Y. Eco-environmental quality assessment in China’s 35 major cities based on remote sensing ecological index. IEEE Access 2019, 7, 51295–51311. [Google Scholar] [CrossRef]
  40. Karbalaei Saleh, S.; Amoushahi, S.; Gholipour, M. Spatiotemporal ecological quality assessment of metropolitan cities: A case study of central Iran. Environ. Monit. Assess. 2021, 193, 305. [Google Scholar] [CrossRef]
  41. Qureshi, S.; Alavipanah, S.K.; Konyushkova, M.; Mijani, N.; Fathololomi, S.; Firozjaei, M.K.; Homaee, M.; Hamzeh, S.; Kakroodi, A.A. A remotely sensed assessment of surface ecological change over the Gomishan Wetland, Iran. Remote Sens. 2020, 12, 2989. [Google Scholar] [CrossRef]
  42. Boori, M.S.; Choudhary, K.; Paringer, R.; Kupriyanov, A. Eco-environmental quality assessment based on pressure-state-response framework by remote sensing and GIS. Remote Sens. Appl. Soc. Environ. 2021, 23, 100530. [Google Scholar] [CrossRef]
  43. Ming, C.; Tao, Y.; Quan, Y.; Hui, X.; Jinxia, N. Characterization of heavy metal pollution in vegetable field soils and health risk assessment in Dayu County, China. INMATEH-Agric. Eng. 2016, 48, 95–102. [Google Scholar]
  44. Feng, Y.; Liu, Y. Scenario prediction of emerging coastal city using CA modeling under different environmental conditions: A case study of Lingang New City, China. Environ. Monit. Assess. 2016, 188, 540. [Google Scholar] [CrossRef] [PubMed]
  45. Feng, Y.; Yang, Q.; Tong, X.; Wang, J.; Chen, S.; Lei, Z.; Gao, C. Long-term regional environmental risk assessment and future scenario projection at Ningbo, China coupling the impact of sea level rise. Sustainability 2019, 11, 1560. [Google Scholar] [CrossRef] [Green Version]
  46. Feng, Y.; Li, H.; Tong, X.; Chen, L.; Liu, Y. Projection of land surface temperature considering the effects of future land change in the Taihu Lake Basin of China. Glob. Planet. Change 2018, 167, 24–34. [Google Scholar] [CrossRef]
  47. Rasul, A.; Balzter, H.; Ibrahim, G.R.F.; Hameed, H.M.; Wheeler, J.; Adamu, B.; Ibrahim, S.A.; Najmaddin, P.M. Applying built-up and bare-soil indices from Landsat 8 to cities in dry climates. Land 2018, 7, 81. [Google Scholar] [CrossRef] [Green Version]
  48. Roh, S.; Tae, S.; Kim, R. Developing a Green Building Index (GBI) certification system to effectively reduce carbon emissions in South Korea’s building industry. Sustainability 2018, 10, 1872. [Google Scholar] [CrossRef] [Green Version]
  49. Peterman, W.E.; Connette, G.M.; Semlitsch, R.D.; Eggert, L.S. Ecological resistance surfaces predict fine-scale genetic differentiation in a terrestrial woodland salamander. Mol. Ecol. 2014, 23, 2402–2413. [Google Scholar] [CrossRef]
  50. Ye, Y.; Su, Y.; Zhang, H.-o.; Liu, K.; Wu, Q. Construction of an ecological resistance surface model and its application in urban expansion simulations. J. Geogr. Sci. 2015, 25, 211–224. [Google Scholar] [CrossRef]
  51. Gao, C.; Feng, Y.; Tong, X.; Jin, Y.; Liu, S.; Wu, P.; Ye, Z.; Gu, C. Modeling urban encroachment on ecological land using cellular automata and cross-entropy optimization rules. Sci. Total Environ. 2020, 744, 140996. [Google Scholar] [CrossRef]
  52. Dayu County Government. Inspection of Nature Reserves. Available online: http://lyj.ganzhou.gov.cn/gnlyw/c102371/201807/97bb9302a5784d4c9aa7e9adf7588f73.shtml (accessed on 6 February 2022).
  53. Dayu County Government. National Voluntary Tree Planting. Available online: http://lyj.ganzhou.gov.cn/gnlyw/c102332/201803/2146eecce3854f408fe991b0b0fd1f8c.shtml (accessed on 6 February 2022).
  54. Dayu County Government. Reconstruction of Low-Quality and Low-Efficiency Forests. Available online: http://lyj.ganzhou.gov.cn/gnlyw/c102332/201703/fd4675700c2d40249f76e4a63f29317f.shtml (accessed on 6 February 2022).
  55. Zhang, X.; Hu, Z.; Wei, X.; Huang, Y. Study on Identification of Key Areas for Ecological Protection and Restoration in Resource-exhausted Region: Take Dayu County, Jiangxi as an Example. J. Ecol. Rural Environ. 2021, 37, 1031–1040. [Google Scholar]
  56. Zhang, W.-L.; Du, Y.; Zhai, M.-M.; Shang, Q. Cadmium exposure and its health effects: A 19-year follow-up study of a polluted area in China. Sci. Total Environ. 2014, 470, 224–228. [Google Scholar] [CrossRef] [PubMed]
  57. Shiwen, C.; Lin, Y.; Zhineng, H.; Xianzu, Z.; Zhaolu, Y.; Huidong, X.; Yuanrong, L.; Rongdi, J.; Wenhua, Z.; Fangyuan, Z. Cadmium exposure and health effects among residents in an irrigation area with ore dressing wastewater. Sci. Total Environ. 1990, 90, 67–73. [Google Scholar] [CrossRef]
  58. Cheng, H.; Duan, X.; Liu, S.; Lin, C.; Shao, X. Thallium, arsenic, and mercury contamination of soil near the world’s largest and longest-operating tungsten mine. Pol. J. Environ. Stud. 2013, 22, 301–305. [Google Scholar]
Figure 1. (a) The location of our study Dayu county in Ganzhou, China, and (b) the urban expansion of Dayu from 2012 to 2020. The background map (b) is an RGB false-color image using the Landsat-8’s Band-4, Band-3, and Band-2, successively.
Sustainability 14 04428 g001
Figure 2. The representative ecological resisting factors including land-use (a), NDVI (b), and NDBI (c).
Sustainability 14 04428 g002
Figure 3. The spatial patterns of the RSEIs of Dayu in 2012 (a), 2016 (b), and 2020 (c); the frequency statistics of the RSEIs in 2012 (d), 2016 (e), and 2020 (f); and the mean RSEIs, the standard deviation of RSEIs, and the percentage of forest in Dayu (g).
Sustainability 14 04428 g003
Figure 4. The ecological sources of Dayu in 2012 (a), 2016 (b), and 2020 (c). The statistics of the ESOs in Dayu: the areas of ESOs in 2012 (d), 2016 (e), and 2020 (f), and the count of different kinds of ESs (g).
Sustainability 14 04428 g004
Figure 5. The ecological cumulative resistances of Dayu in 2012 (a), 2016 (b), and 2020 (c), and the ecological security patterns in 2012 (d), 2016 (e), and 2020 (f).
Sustainability 14 04428 g005
Figure 6. The change in the ecological security patterns from 2012 to 2020 (a), 2016 to 2020 (b), and 2012 to 2020 (c), and the change in percentages from of the three related periods (df).
Sustainability 14 04428 g006
Figure 7. The nutrient content in the soil of different towns in Dayu: the organic matter (a), the alkaline nitrogen (b), the available phosphorus (c), and the available potassium (d).
Sustainability 14 04428 g007
Table 1. The Landsat images and the statistical datasets used in this study.
DataSourceTimePurpose
Remote sensing imagesLandsat-7 ETM from Geospatial Data CloudDecember 2012Produce the ecological resistance factors for quantifying the ecological security pattern
Remote sensing imagesLandsat-8 OLI and TIRS from Geospatial Data CloudFebruary 2016Produce the ecological resistance factors for quantifying the ecological security pattern
Remote sensing imagesLandsat-8 OLI and TIRS from Geospatial Data CloudFebruary 2020Produce the ecological resistance factors for quantifying the ecological security pattern
DEMThe United States Geological Survey2017Calculate the ecological resisting surface in 2012, 2016 and 2020
Statistical yearbooksThe Dayu local government2012, 2016, 2020Evaluate the ecological security and model the urban expansion
The soil nutrient contentThe soil nutrient content tests2012, 2015, 2019Analyze the soil quality and ecological security
Table 2. The type, weight, and scores of the resisting factors of the ecosystems in Dayu.
TypeResisting FactorWeightLevelResisting Score
Living environmentsLand-use0.46Water1
Forest2
Farm3
Bare land4
Urban5
NDBI0.150–0.21
0.2–0.42
0.4–0.63
0.6–0.84
0.8–15
Natural environmentsNDVI0.270.8–11
0.6–0.82
0.4–0.63
0.2–0.44
0–0.25
landform characteristicsDEM0.040–240 m1
240–480 m2
480–720 m3
720–960 m4
960–1367 m5
Slope0.080–5°1
5–15°2
15–24°3
24–54°4
54–87°5
Table 3. The area and percentage of each ecological security level from 2012 to 2020.
Security Level201220162020
Area (km2)Percentage (%)Area (km2)Percentage (%)Area (km2)Percentage (%)
Level 1478..0734.96406.8729.75510.8037.35
Level 2349.4725.55390.7328.57401.8129.38
Level 3261.5119.12304.0222.23256.4318.75
Level 4198.6114.52173.0112.65138.1310.10
Level 579.975.8493.006.8060.454.42
Table 4. The soil nutrient content in Dayu.
Soil CompositionOrganic Matter
(mg/kg)
Alkaline Hydrolyzed Nitrogen (mg/kg)Available Phosphorus
(mg/kg)
Available Potassium (mg/kg)
201220152019201220152019201220152019201220152019
Average21.9022.2029.90122.70140.80125.8026.4027.8351.3887.576111.4578.08
Nan’an30.6523.9972.90137.80127.96155.3534.2721.4430.40151.5089.2045.00
Xincheng14.1522.8211.63100.32147.5894.6725.7030.4845.4043.81110.0352.50
Chijiang24.6922.1015.15148.84143.98103.3127.6127.5629.5384.53109.1289.25
Qinglong17.2422.4526.30126.11148.36132.4427.3124.6930.3088.67105.5276.40
Huanglong16.8524.4529.8596.38145.50156.0329.6629.8454.00119.9099.7477.25
Jicun28.2921.4413.30117.78137.0589.0027.5327.9618.0083.02113.893.00
Hedong24.4724.4520.35132.24128.35116.1523.2231.6627.8059.0399.0489.50
Neiliang21.0321.7235.15115.56126.78135.7926.8422.155.0586.60107.7093.00
Fujiang20.0222.9531.90123.24124.83127.5622.9932.1083.3083.23187.9057.00
Zuoba22.8119.1648.20134.41157.60144.8423.9326.09109.0079.6472.0074.00
Zhangdou21.1519.5524.50117.13161.55129.0022.0432.19132.4083.41132.00112.00
Table 5. The threshold sensitivity for identifying ESOs.
The ThresholdCount of ESOsTotal Area of ESOs (km2)Average Area of ESOs (km2)Max Area of ESOs (km2)Min Area of ESOs(km2)
0.518232,452.42178.31737.49101.32
0.67915,696.01198.69737.49102.64
0.74311,154.00259.40737.49104.33
0.8254674.25186.97484.35102.04
0.92545.24272.62371.25171.99
Publisher’s Note: MDPI stays neutral with regard to jurisdictional claims in published maps and institutional affiliations.

