
Estimation of the Urban Heat Island Effect in a Reformed Urban District: A Scenario-Based Study in Hong Kong


Abstract
:1. Introduction
2. Literature Review
2.1. Local Climate Zones
2.2. Land Surface Temperatures
2.3. Regression Models
3. Estimation of the UHI and UHS
3.1. Definitions of the Urban Heat Magnitude
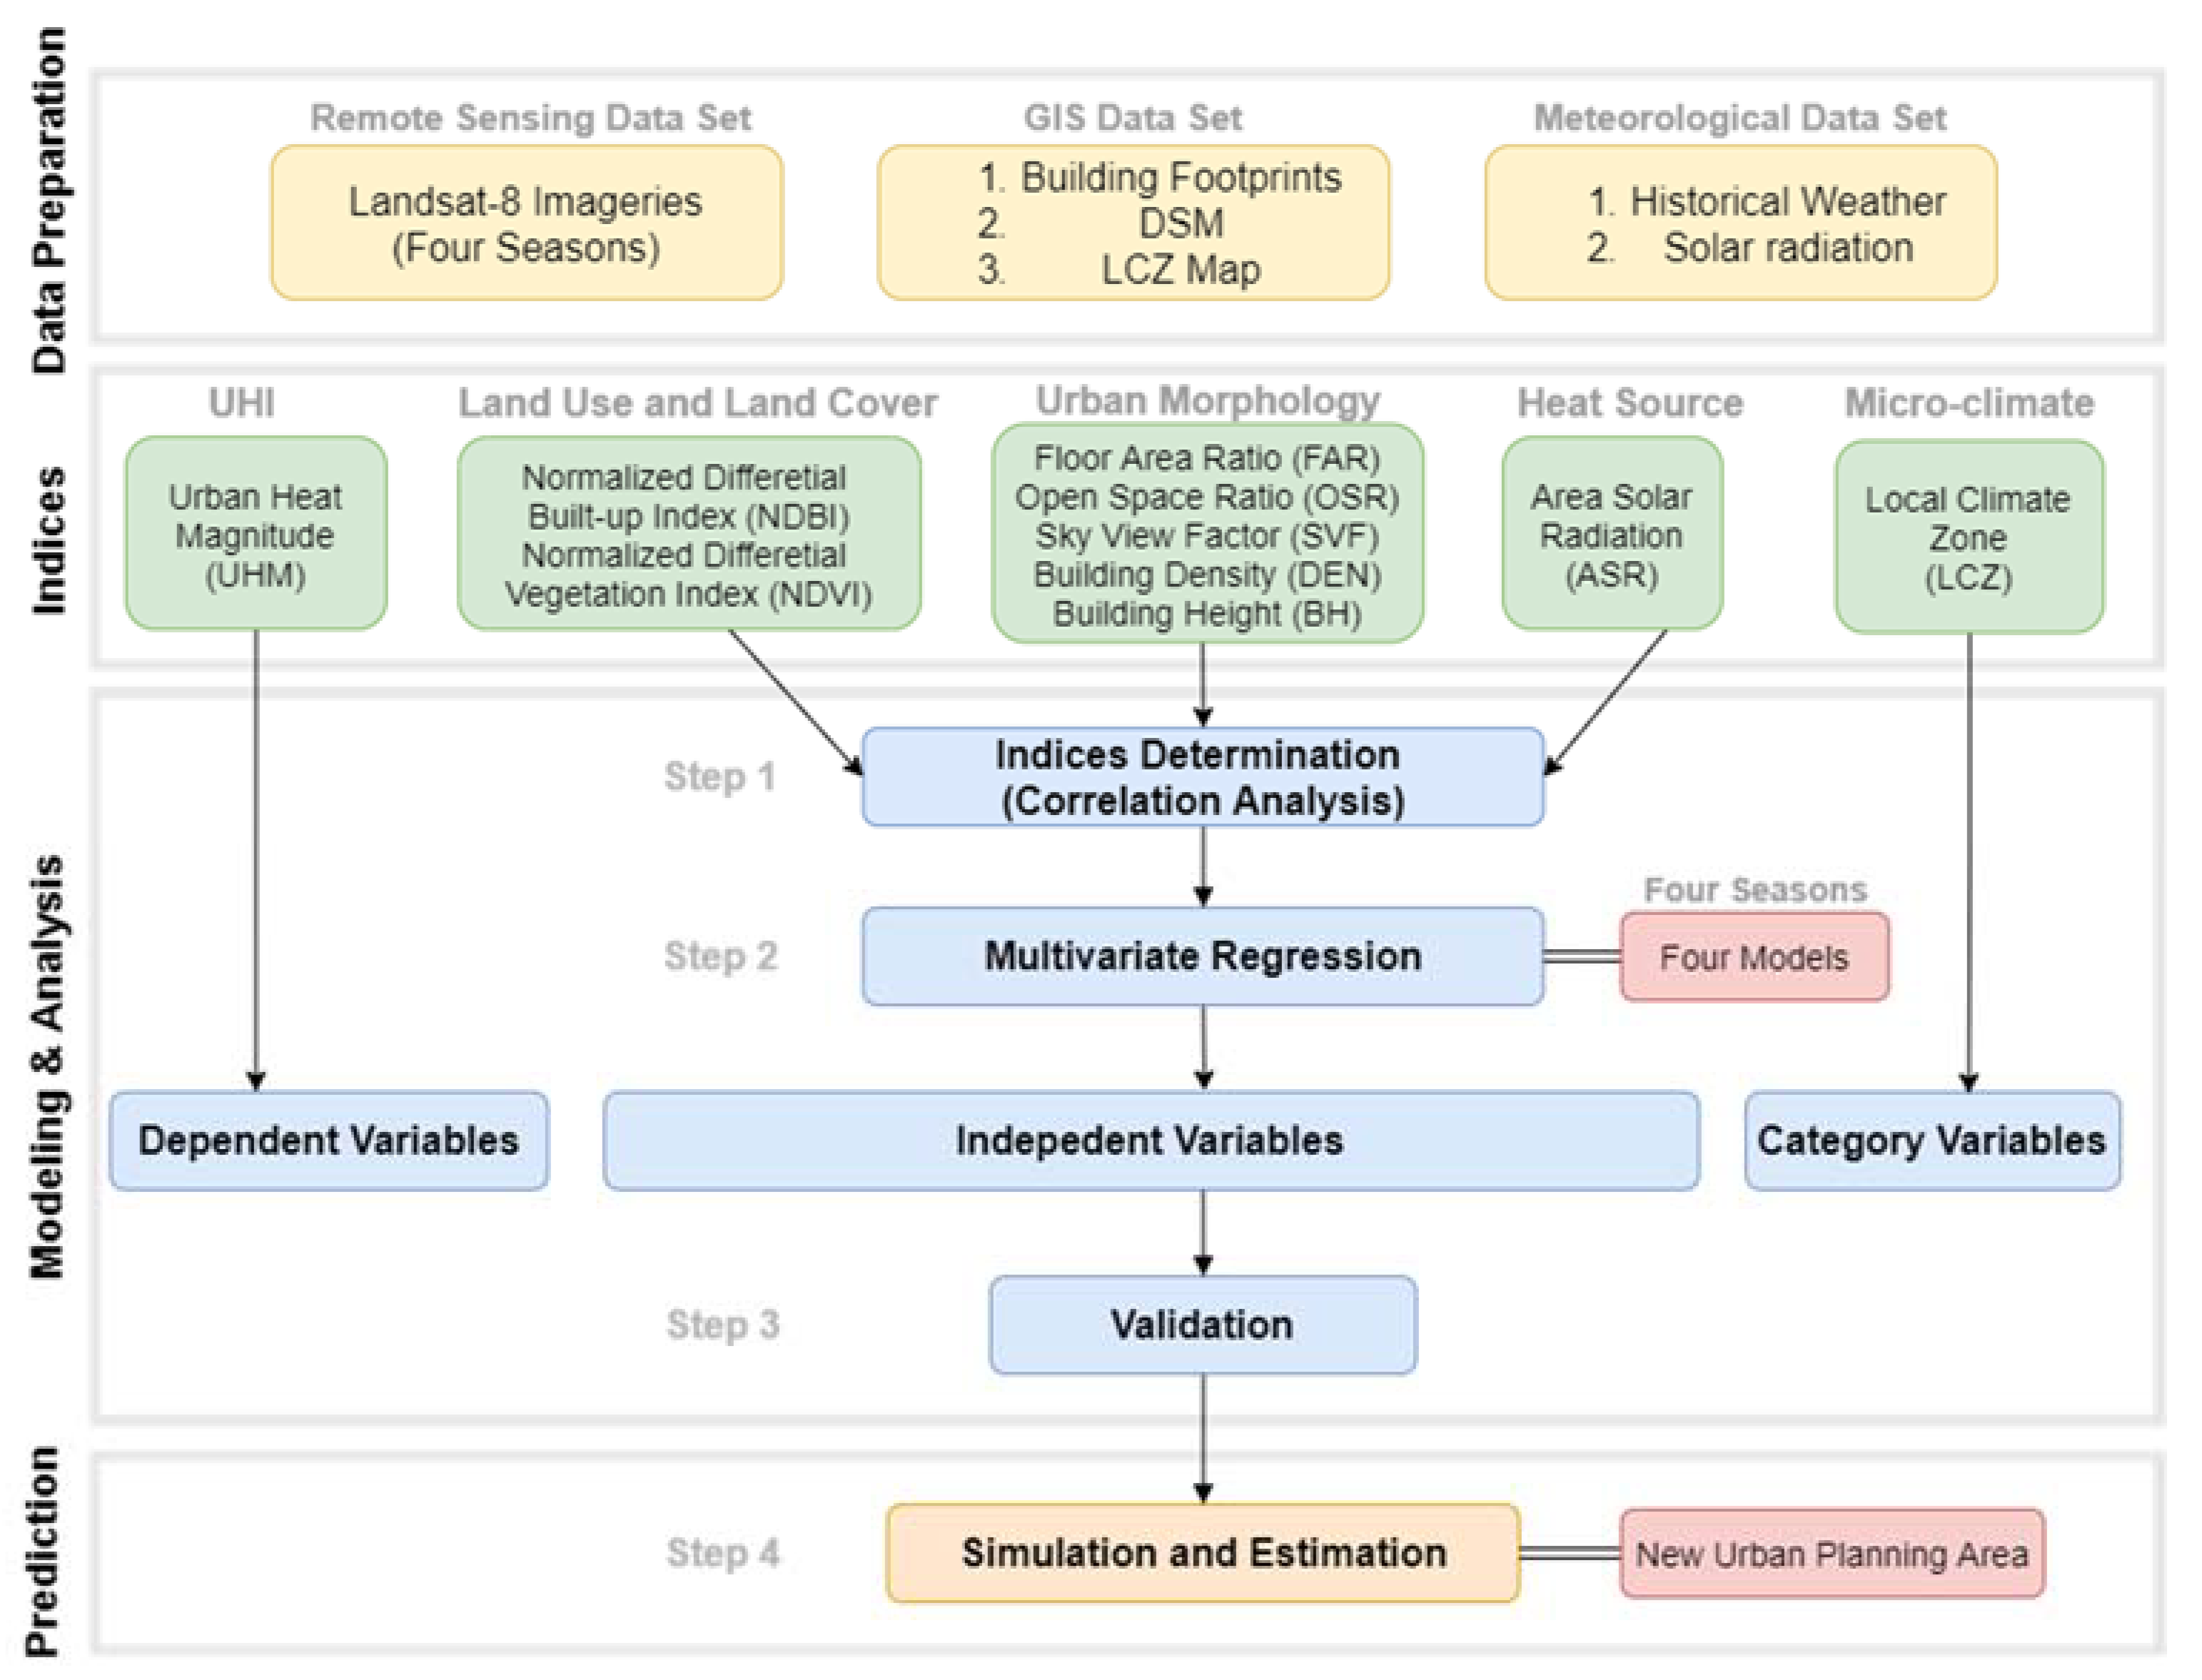
3.2. Research Framework for Building the UHM Estimation Model
3.3. Multivaritate Regression
3.4. Retrieval of Land Surface Temperature
3.5. Modelling of the UHM Indicators
3.5.1. Normalized Differential Built-Up Index (NDBI)
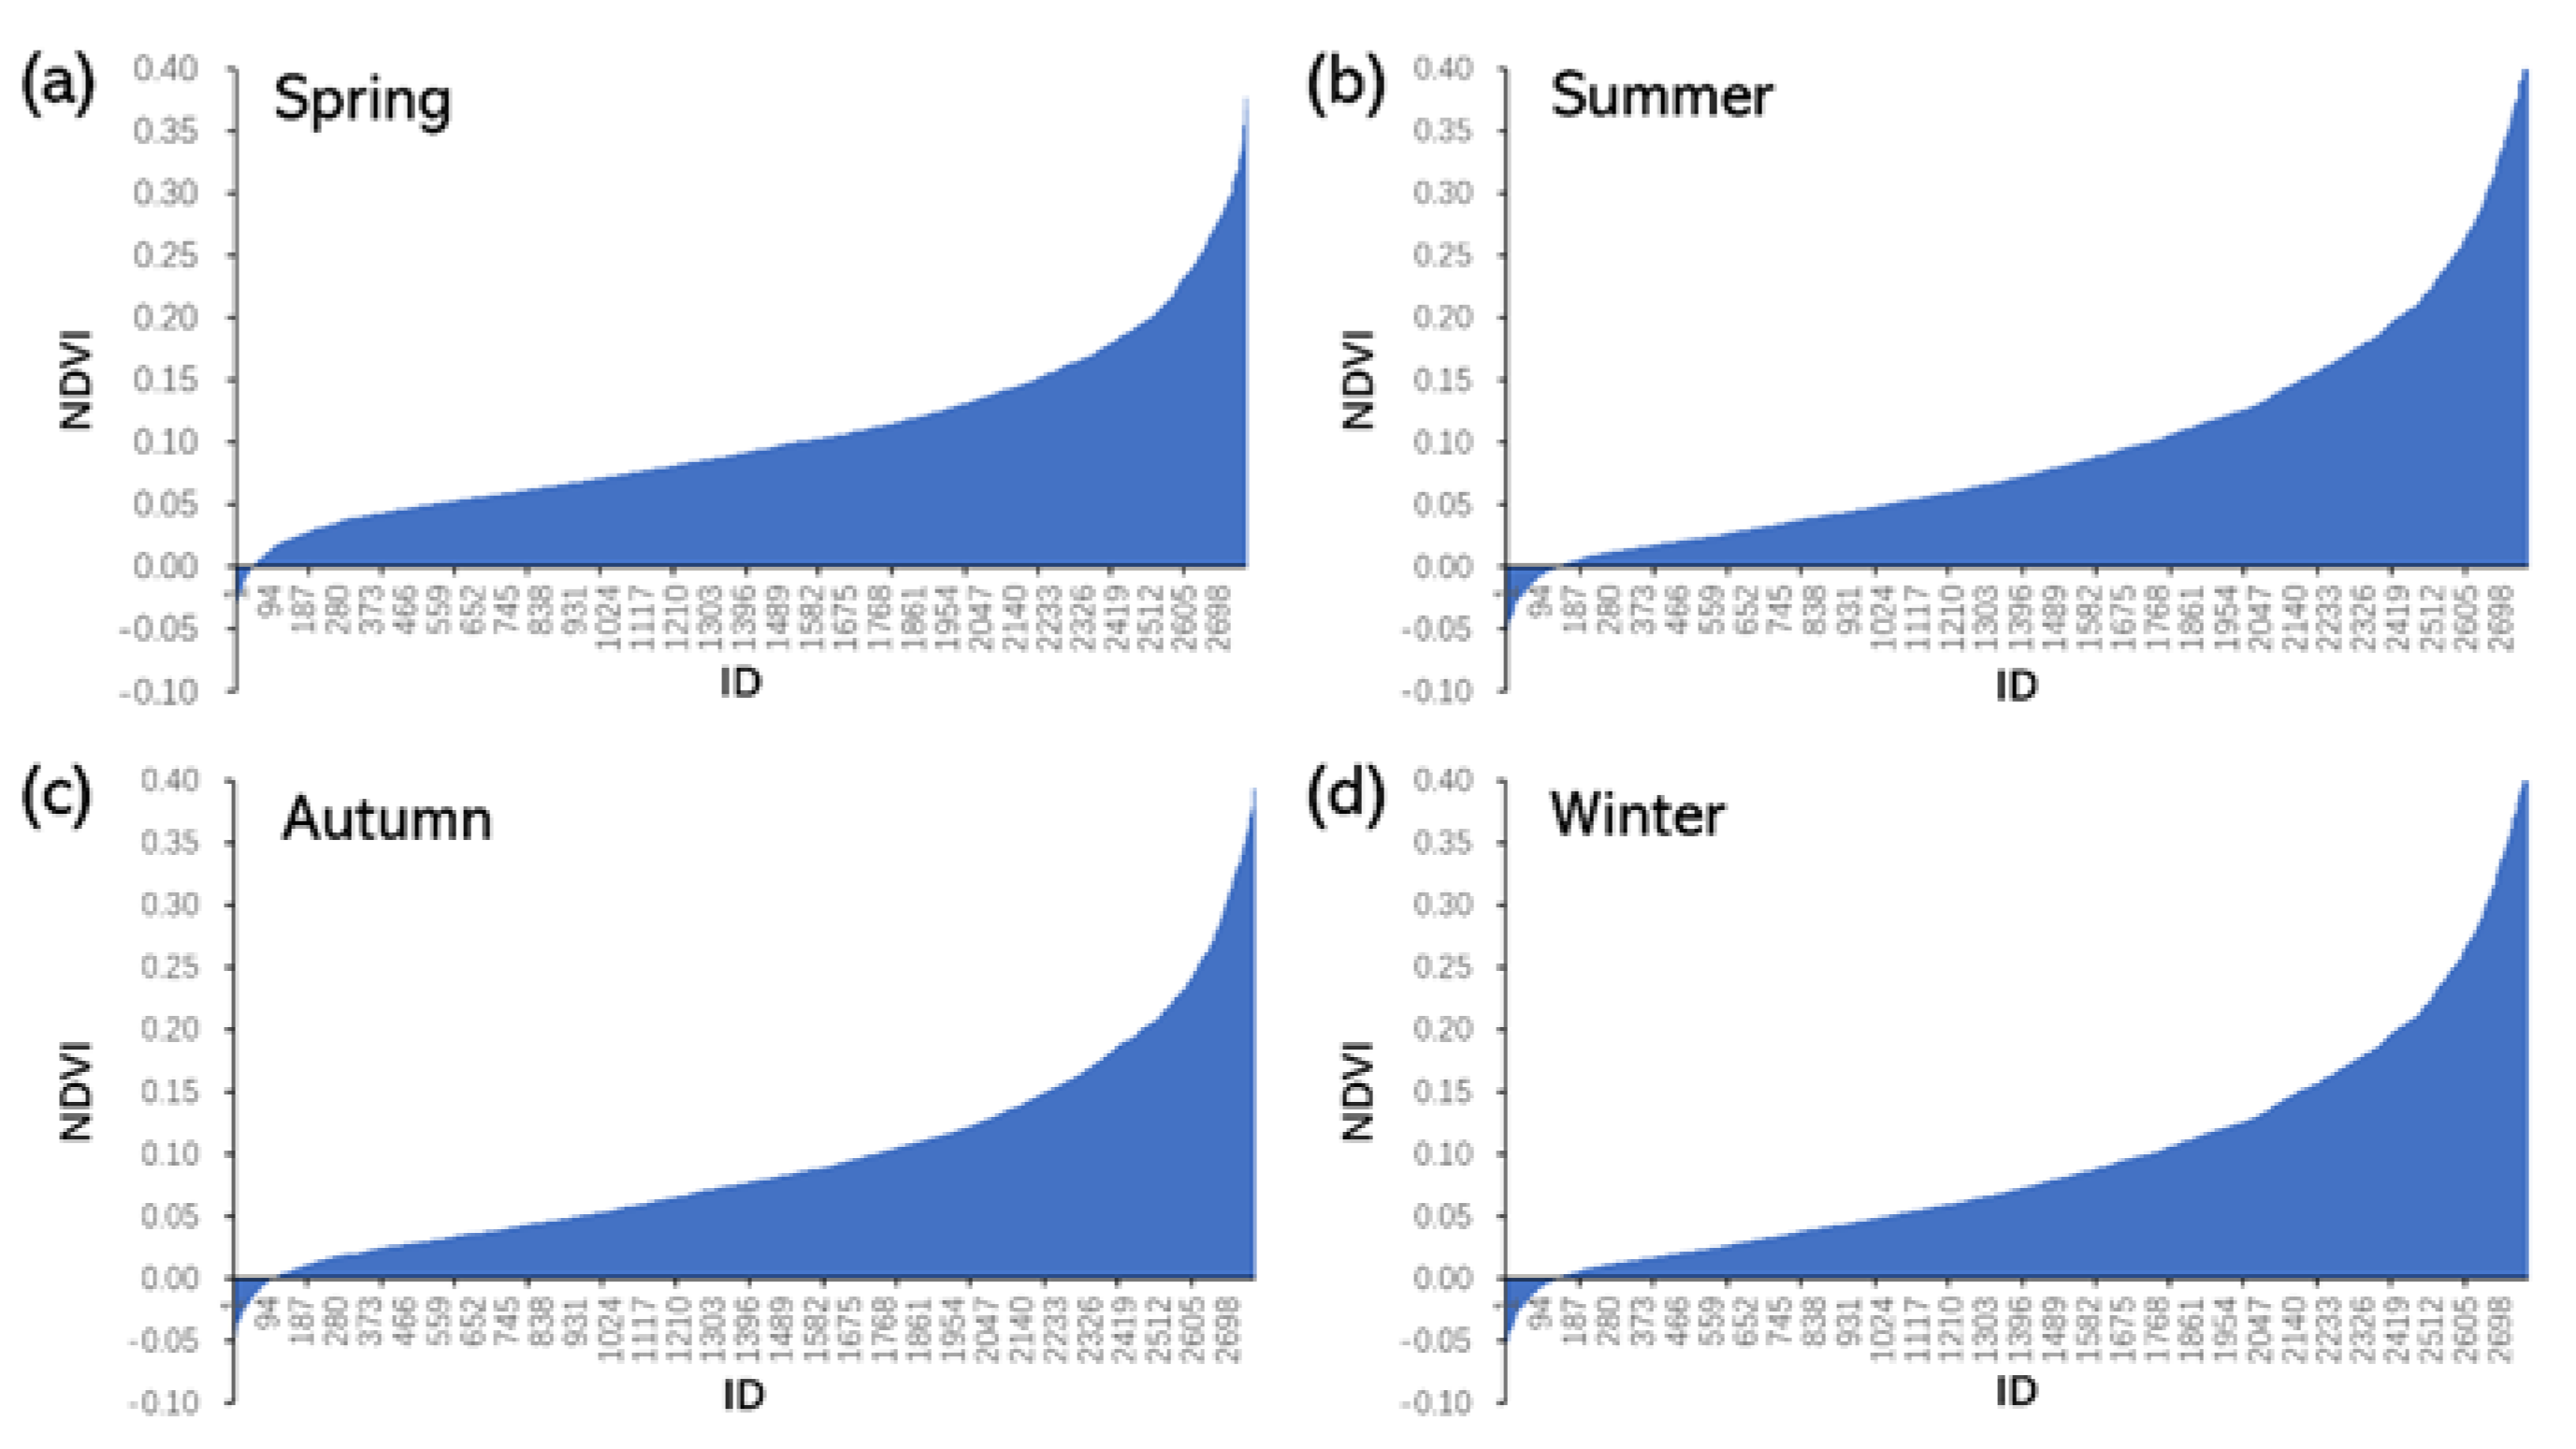
3.5.2. Normalized Difference Vegetation Index (NDVI)
3.5.3. Sky View Factor (SVF)
3.5.4. Area Solar Radiation (ASR)
3.5.5. Building Indicators
4. Empirical Investigation
4.1. Study Area
4.2. Data Collection
4.3. Data Pre-Processing
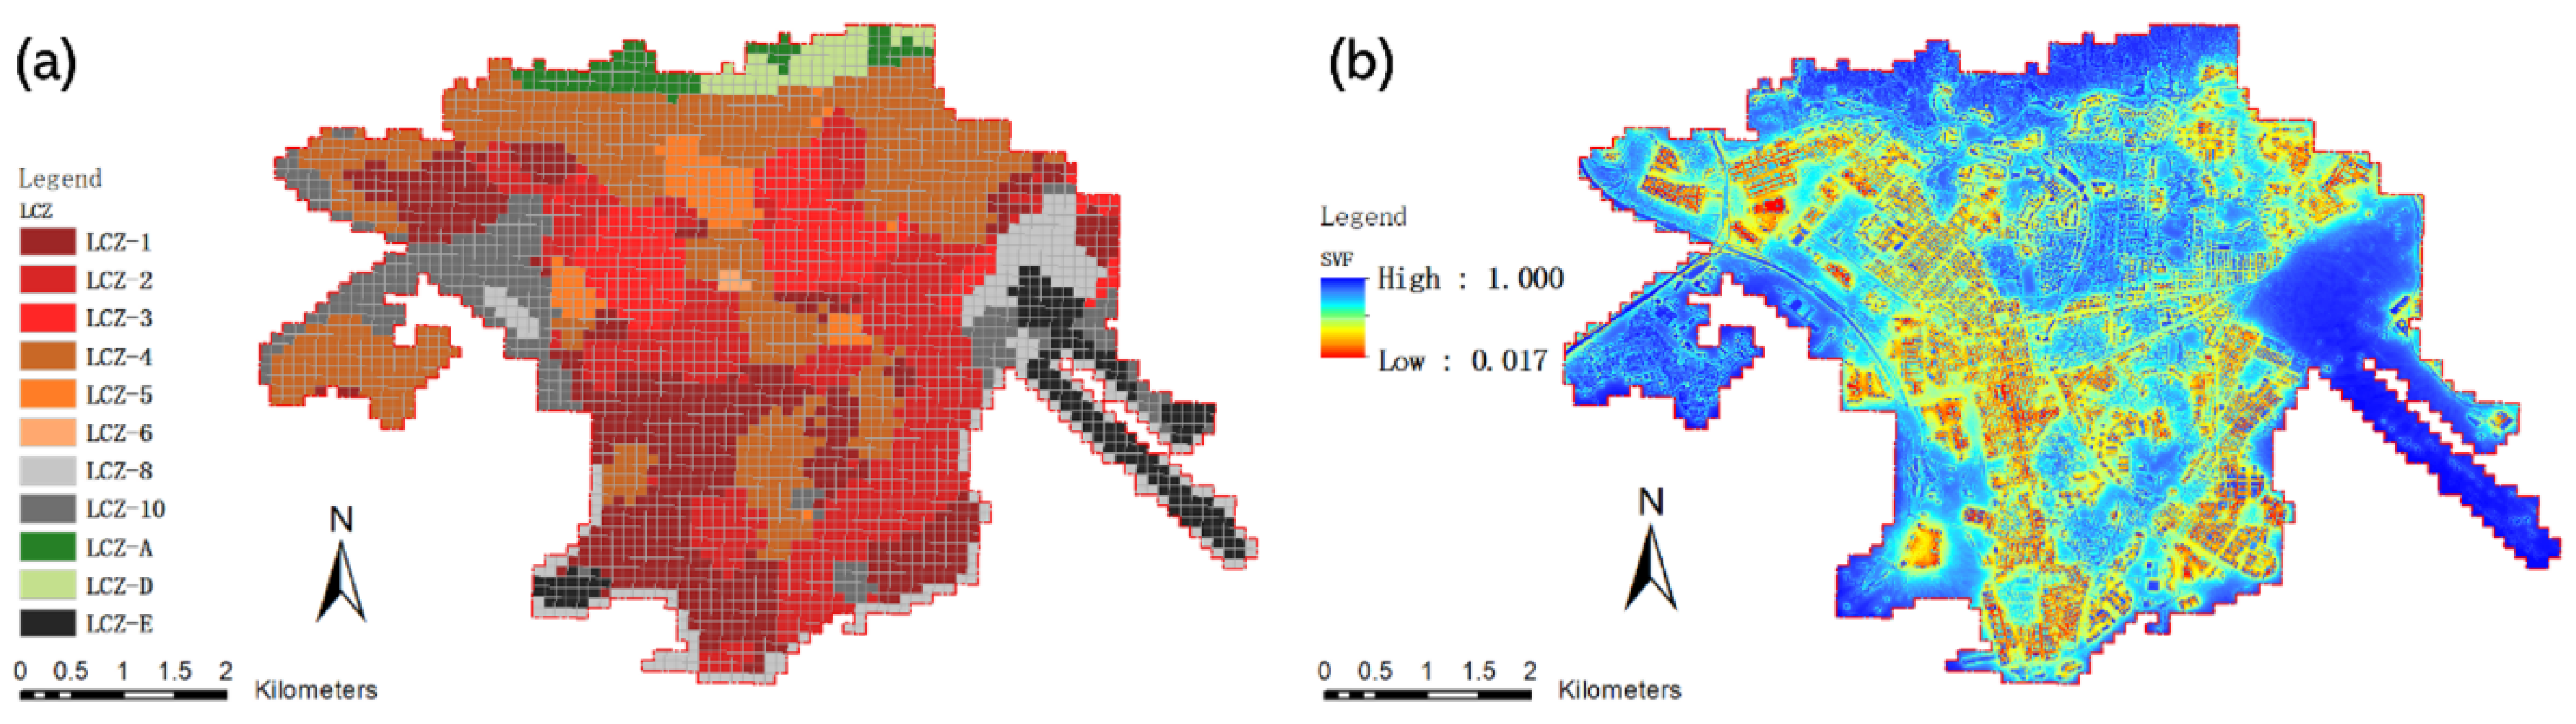
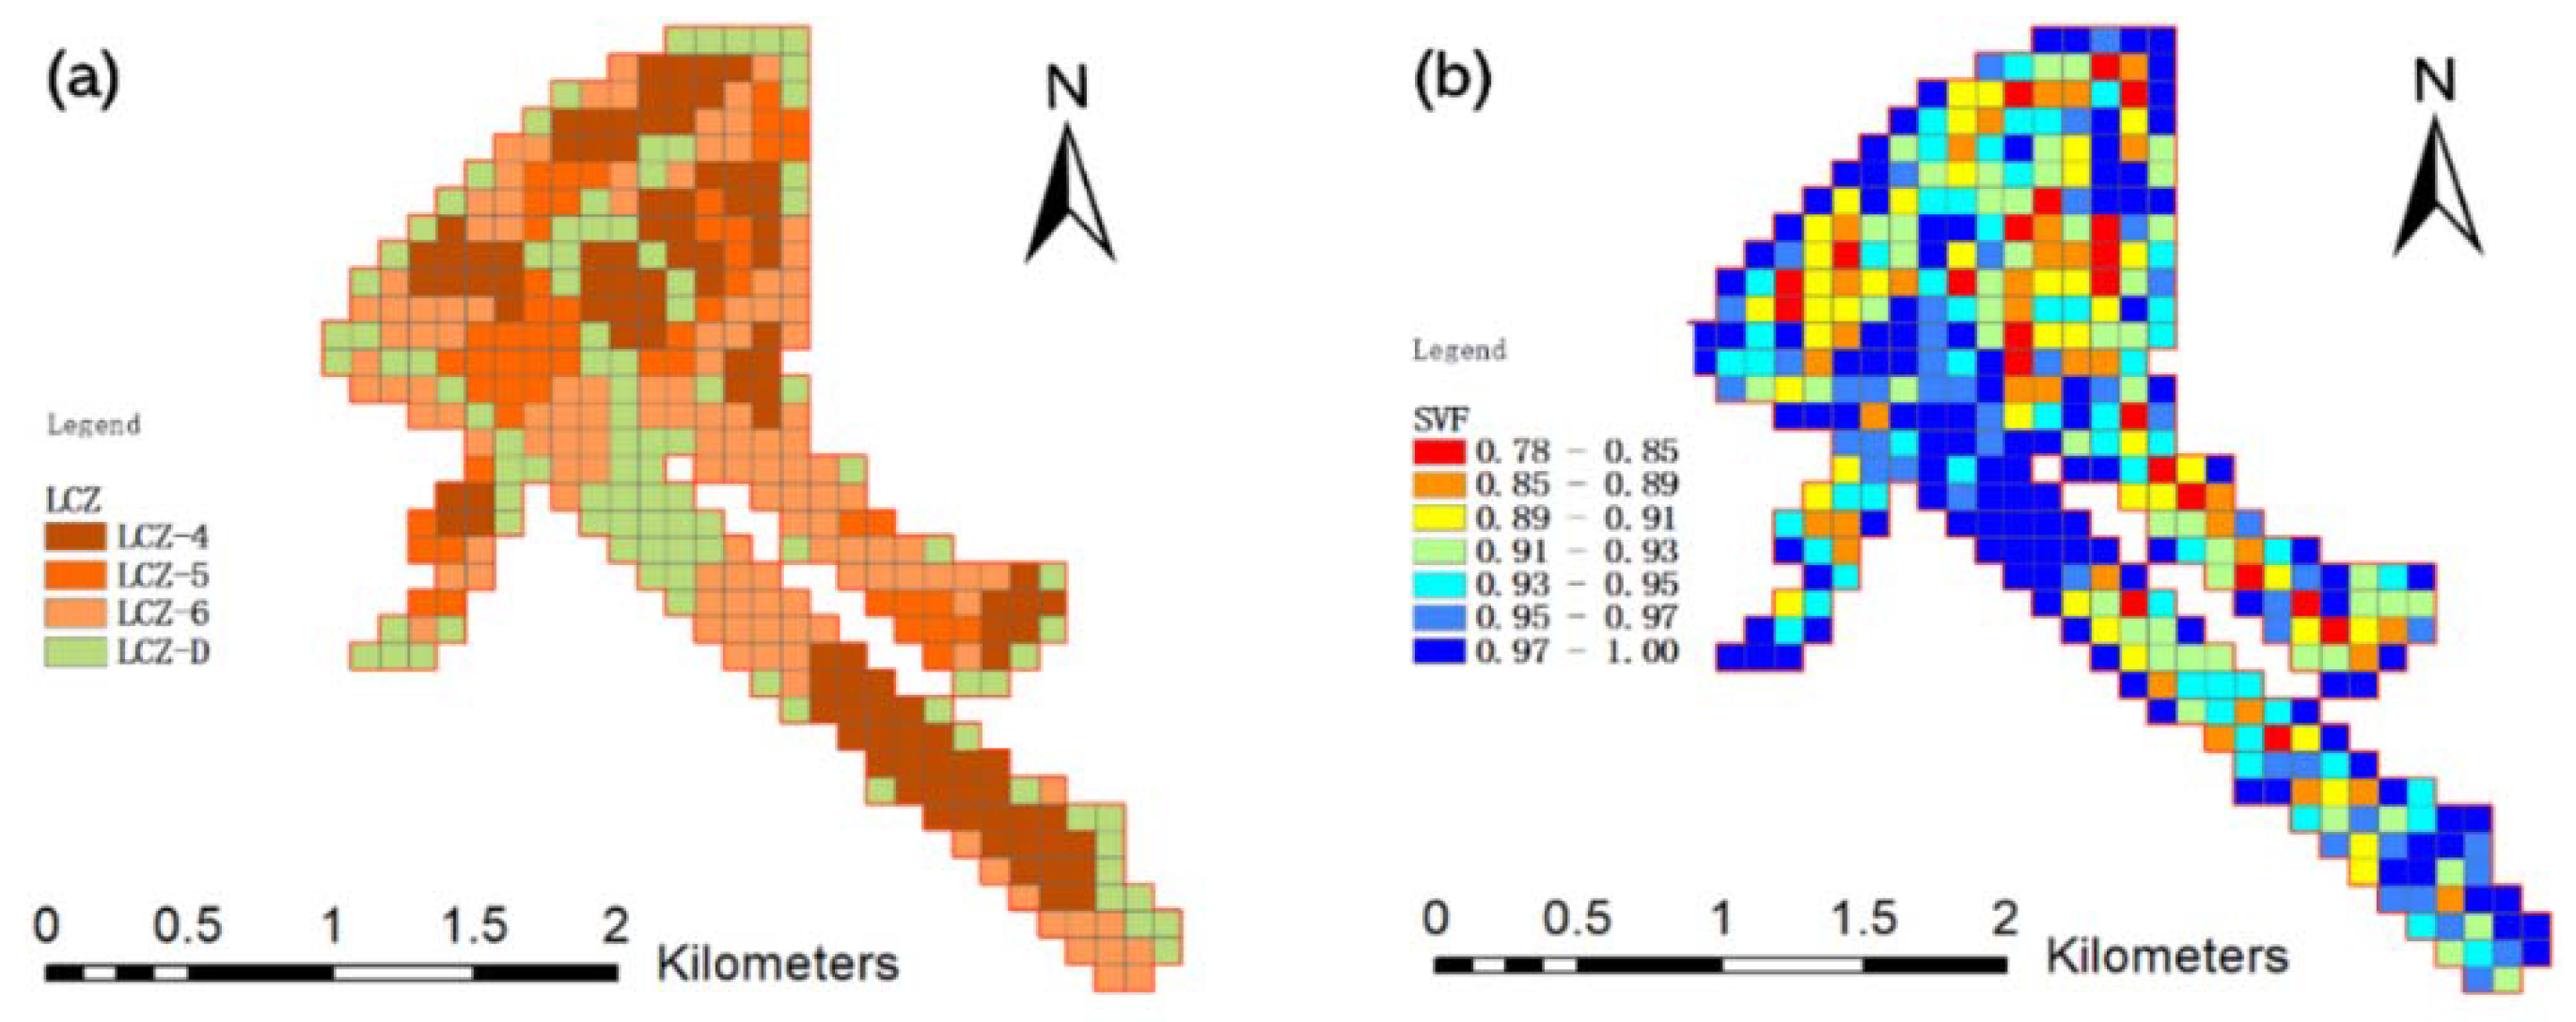
4.3.1. Mapping of the LCZs and SVFs
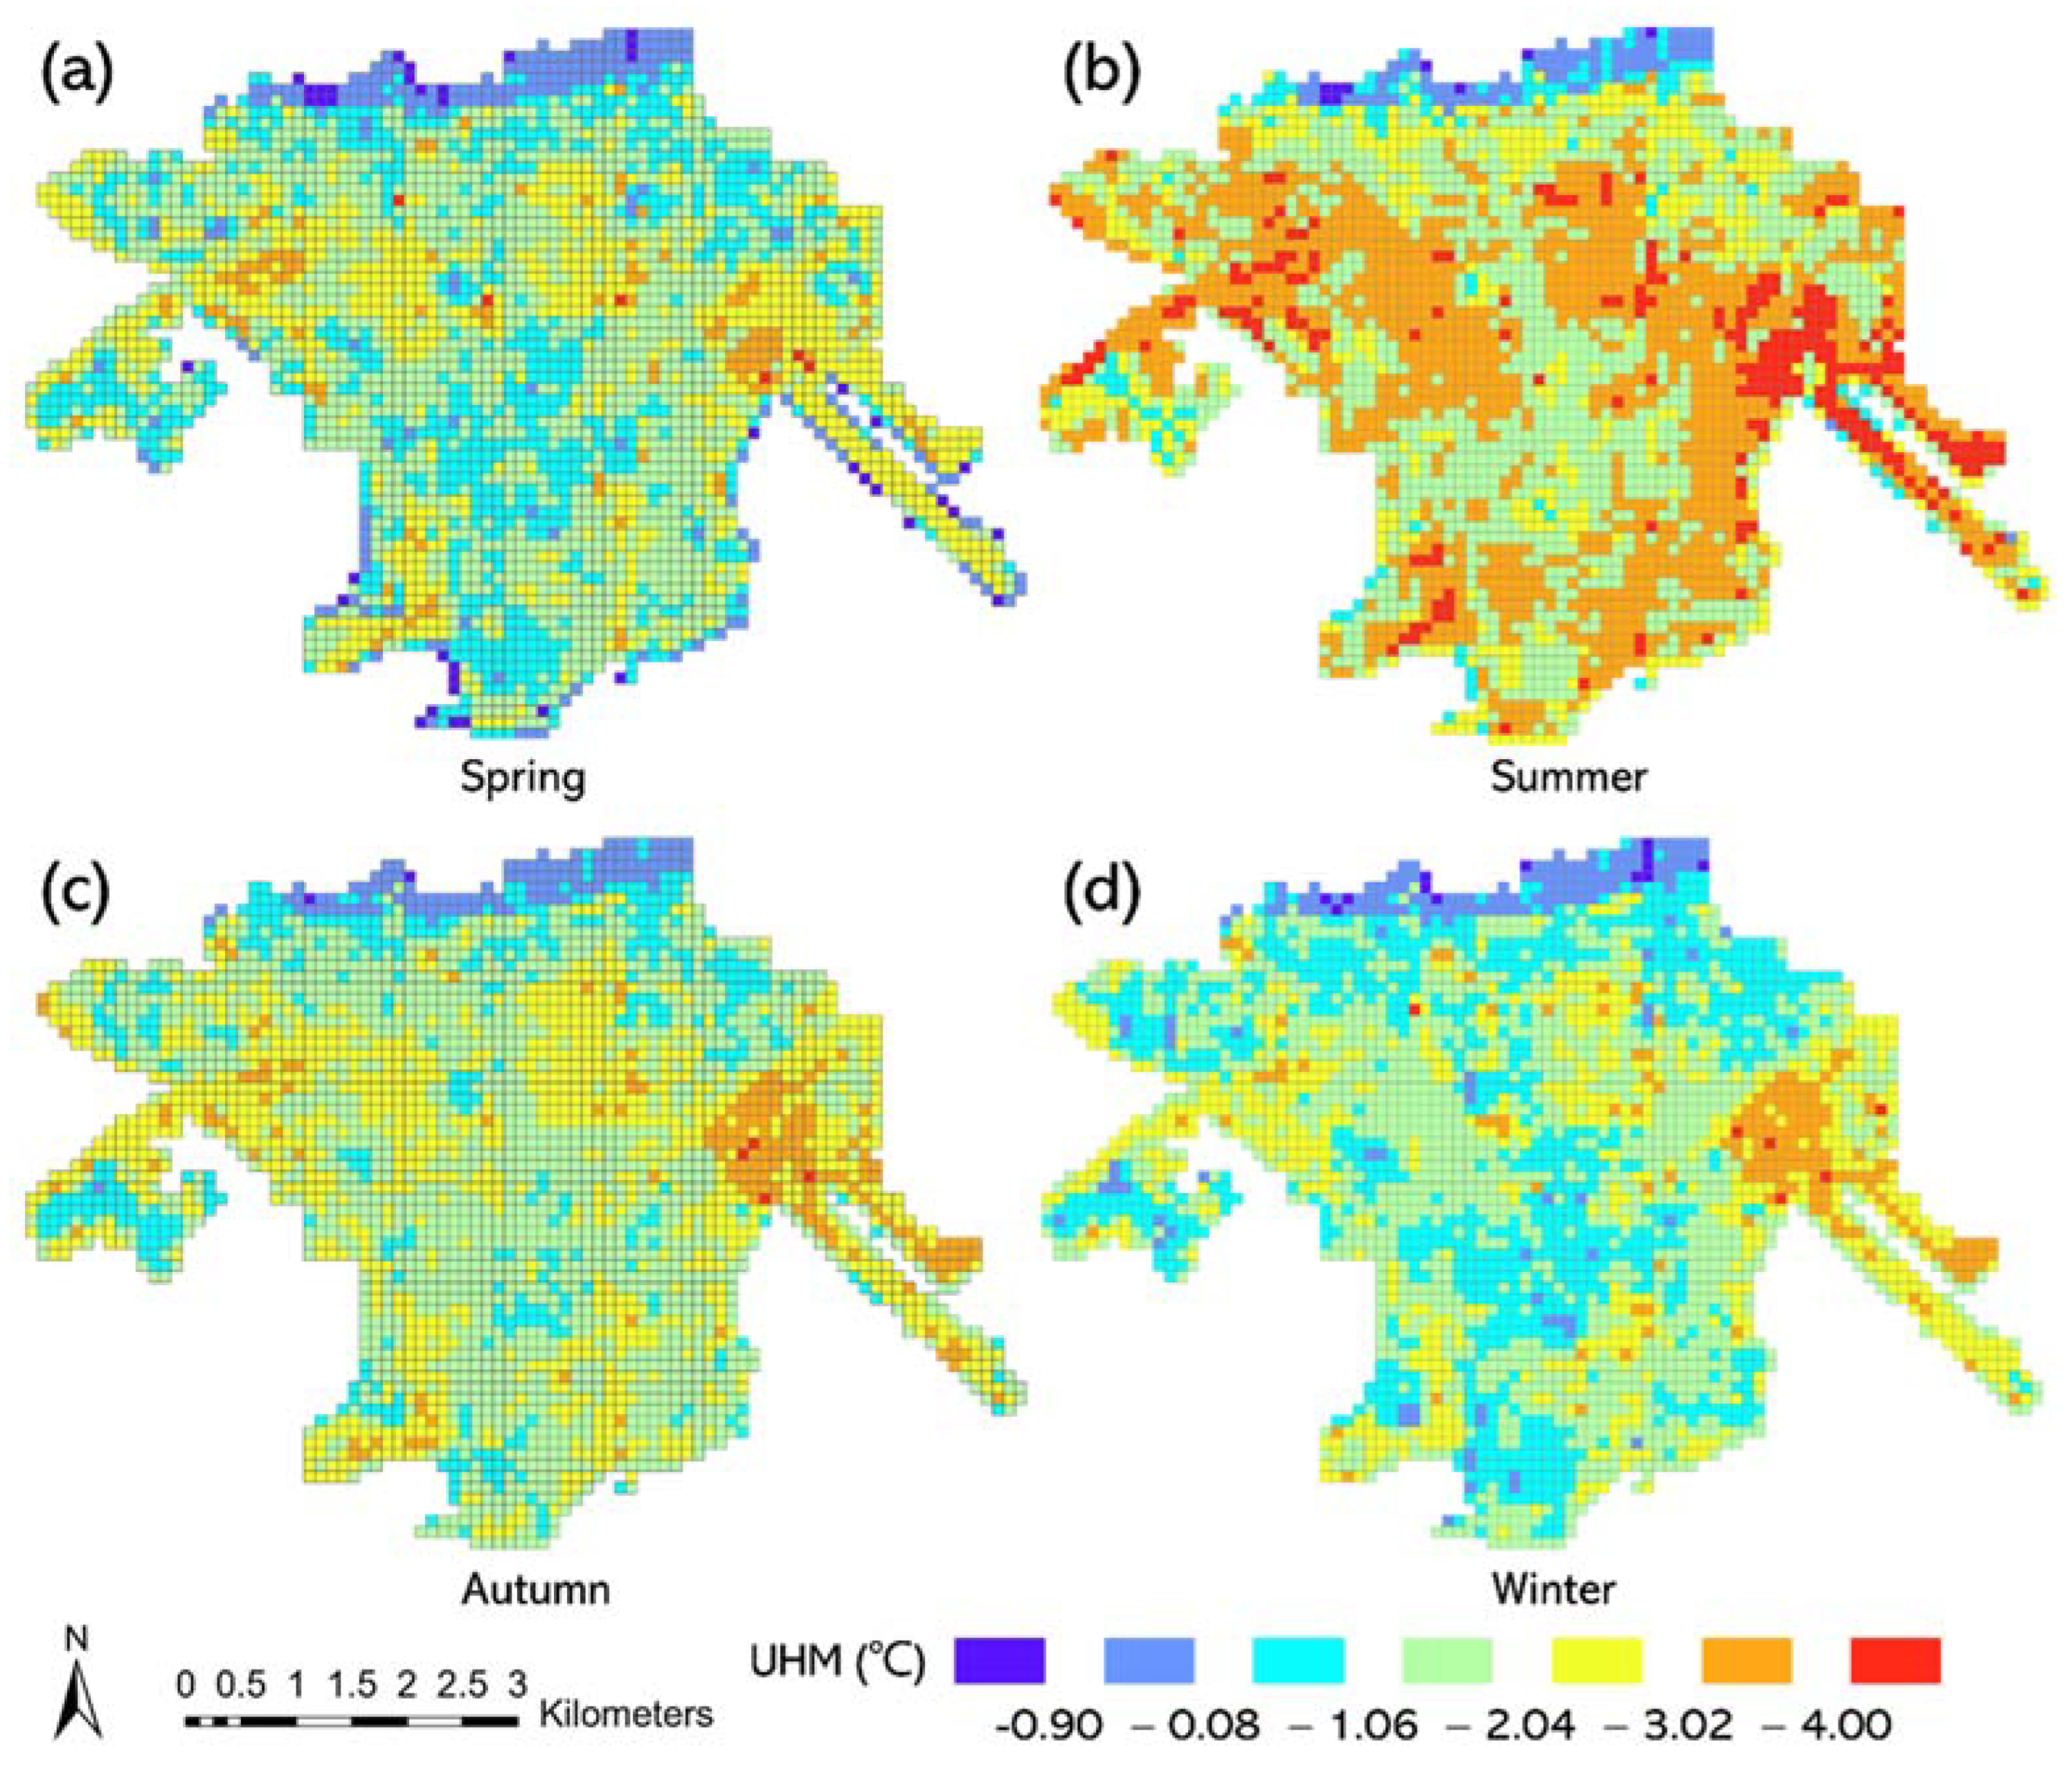
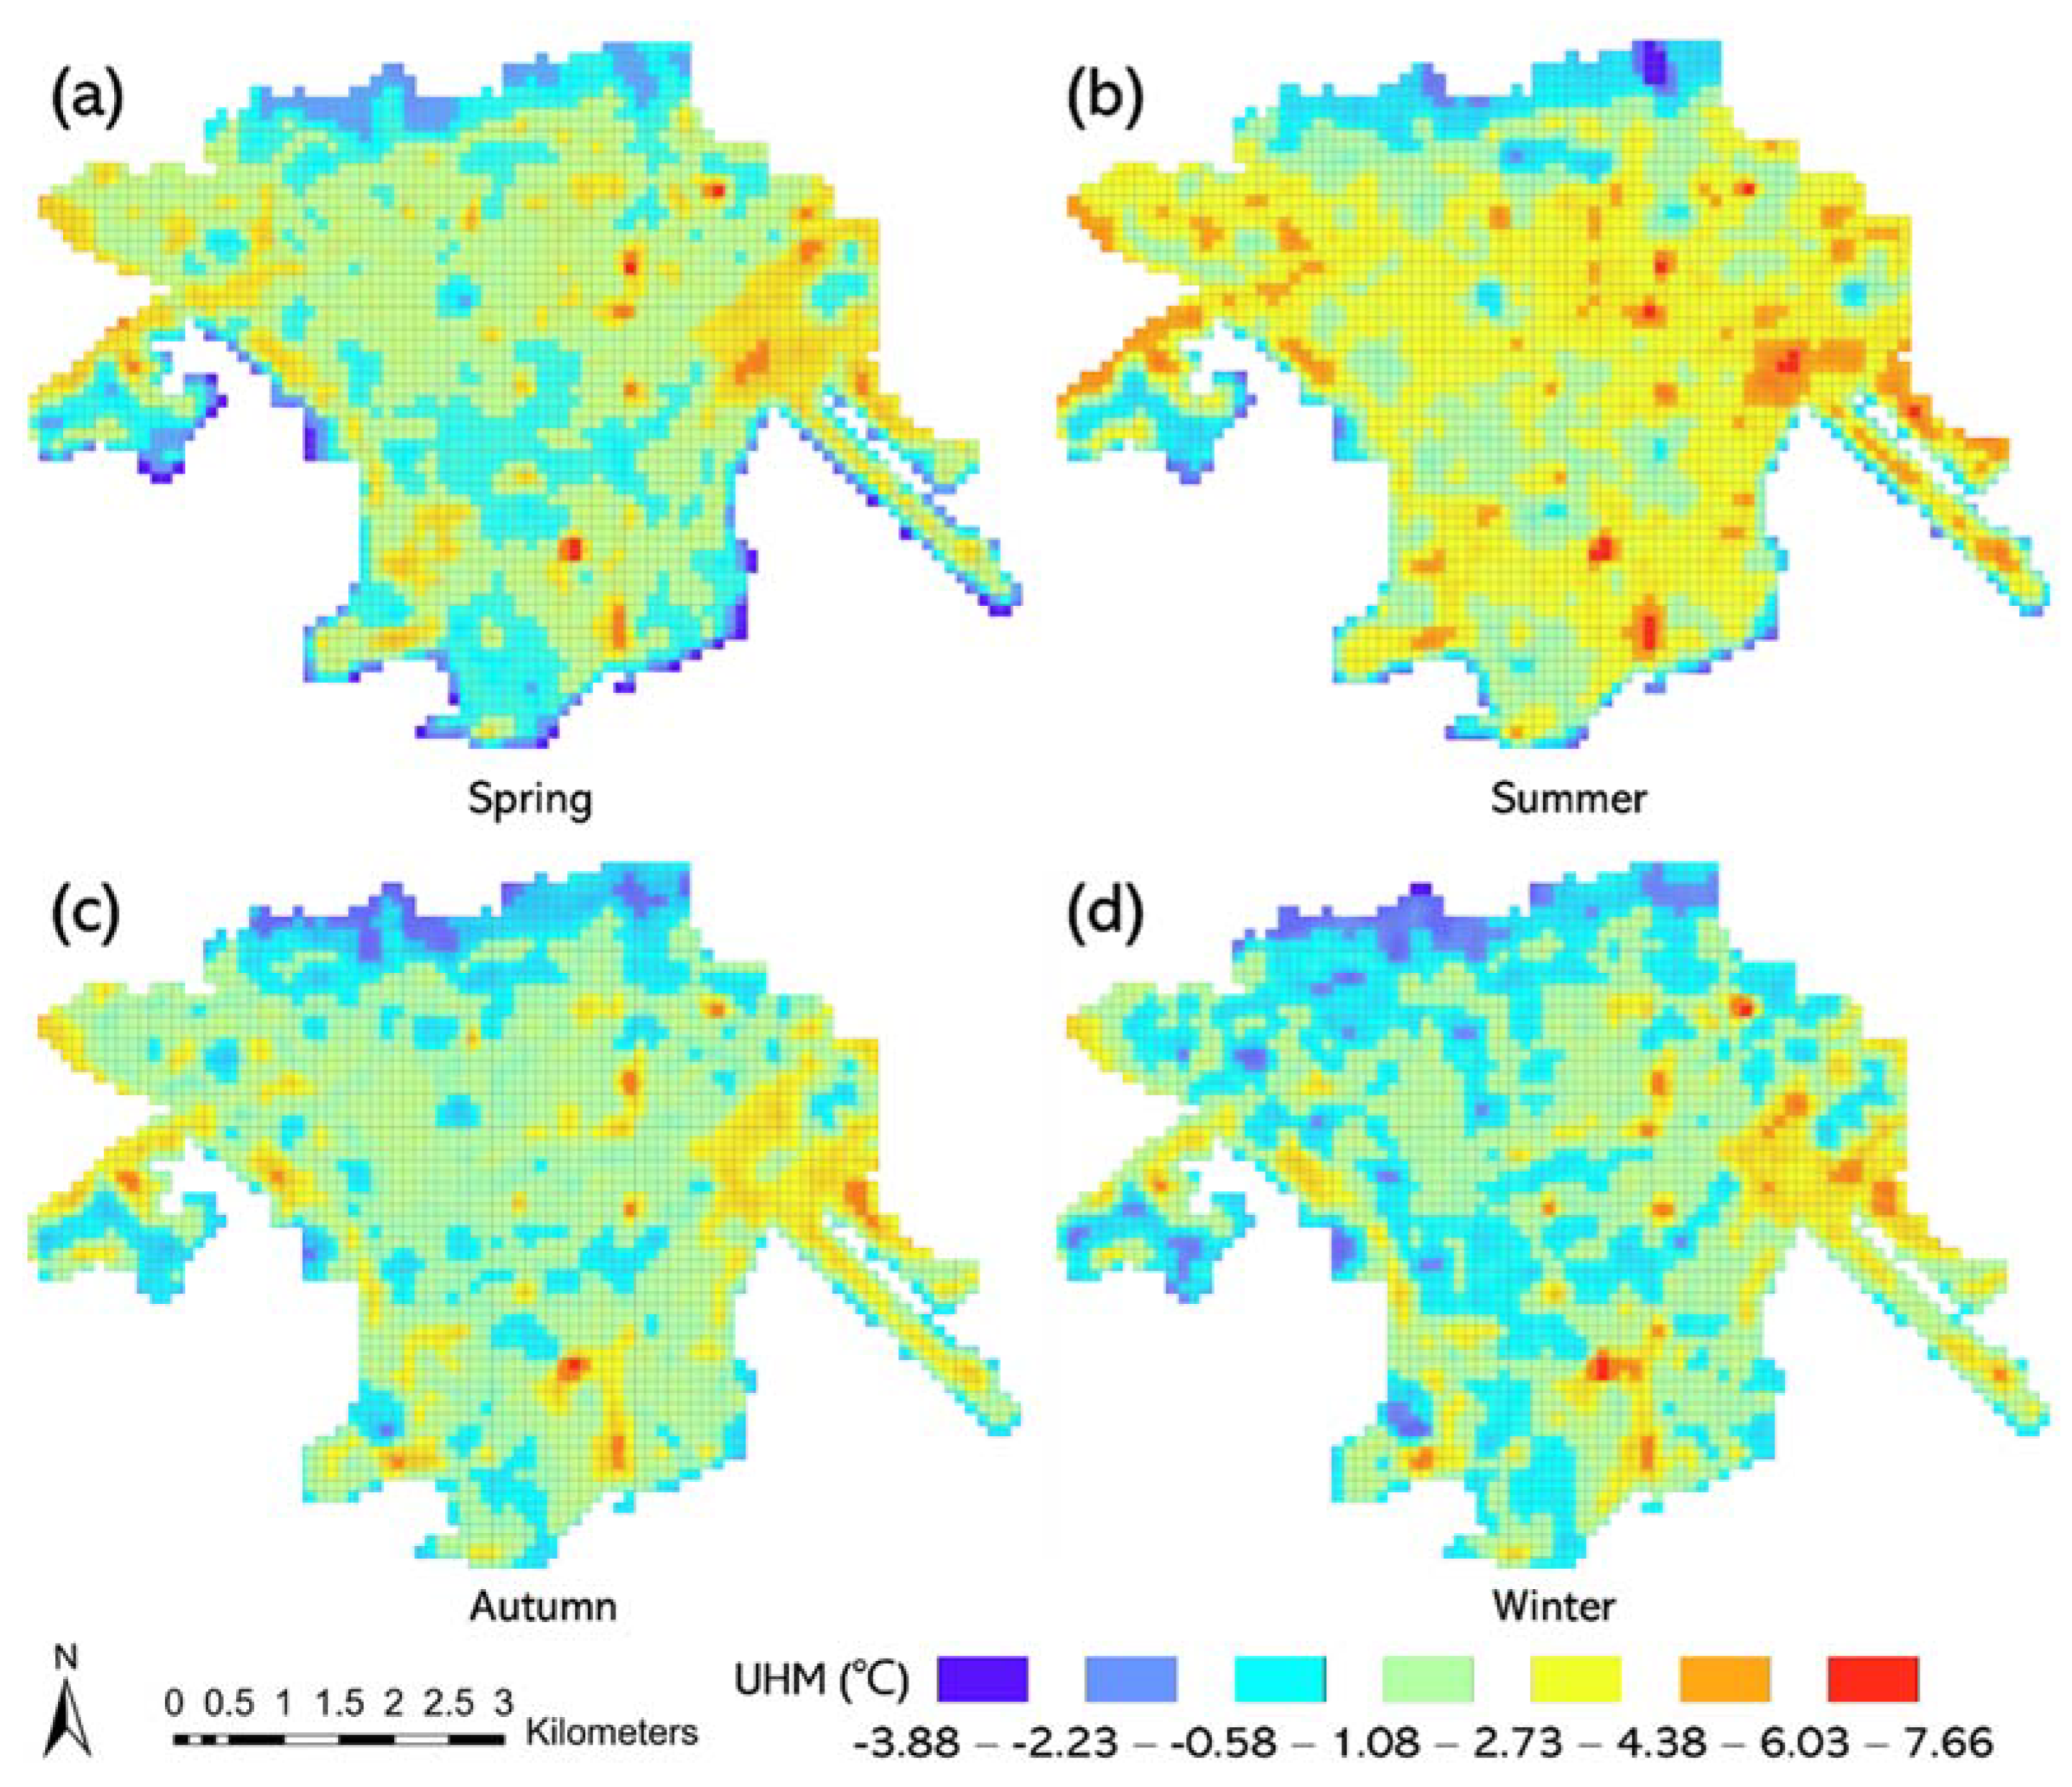
4.3.2. Mapping of UHMs in Kowloon
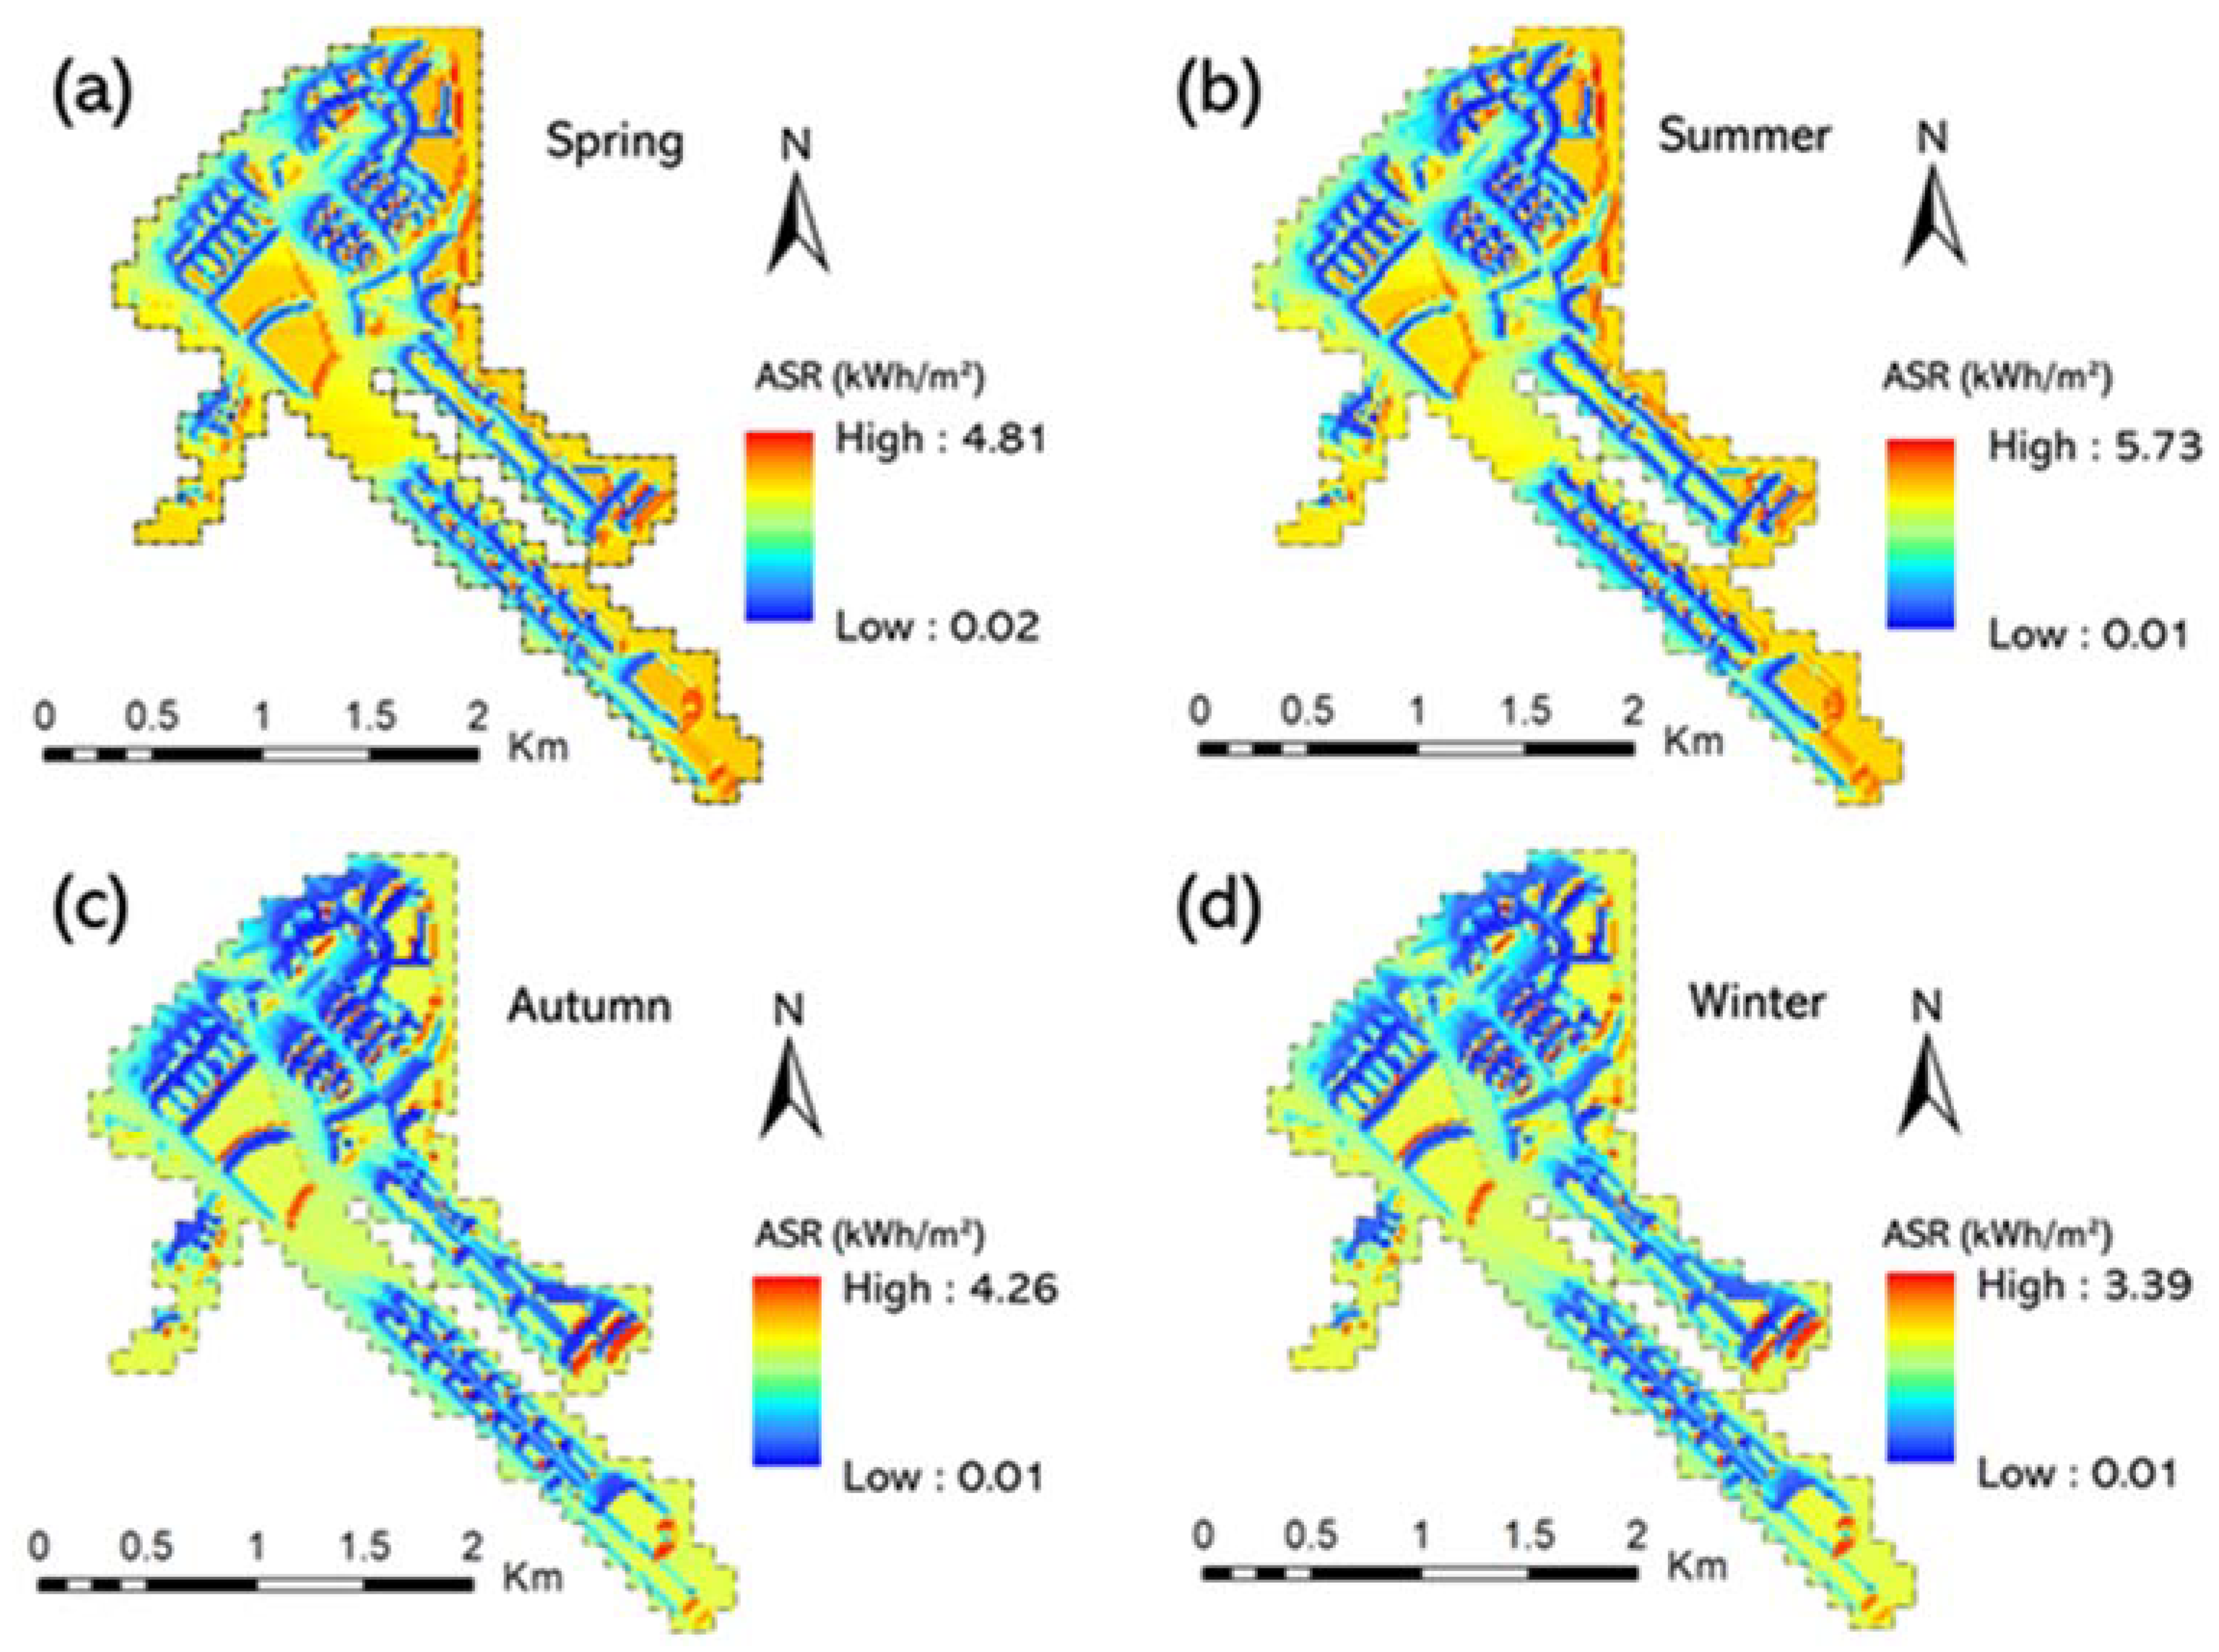
4.3.3. Mapping of Area Solar Irradiation
5. Results
5.1. Identification of the Influential Indicators
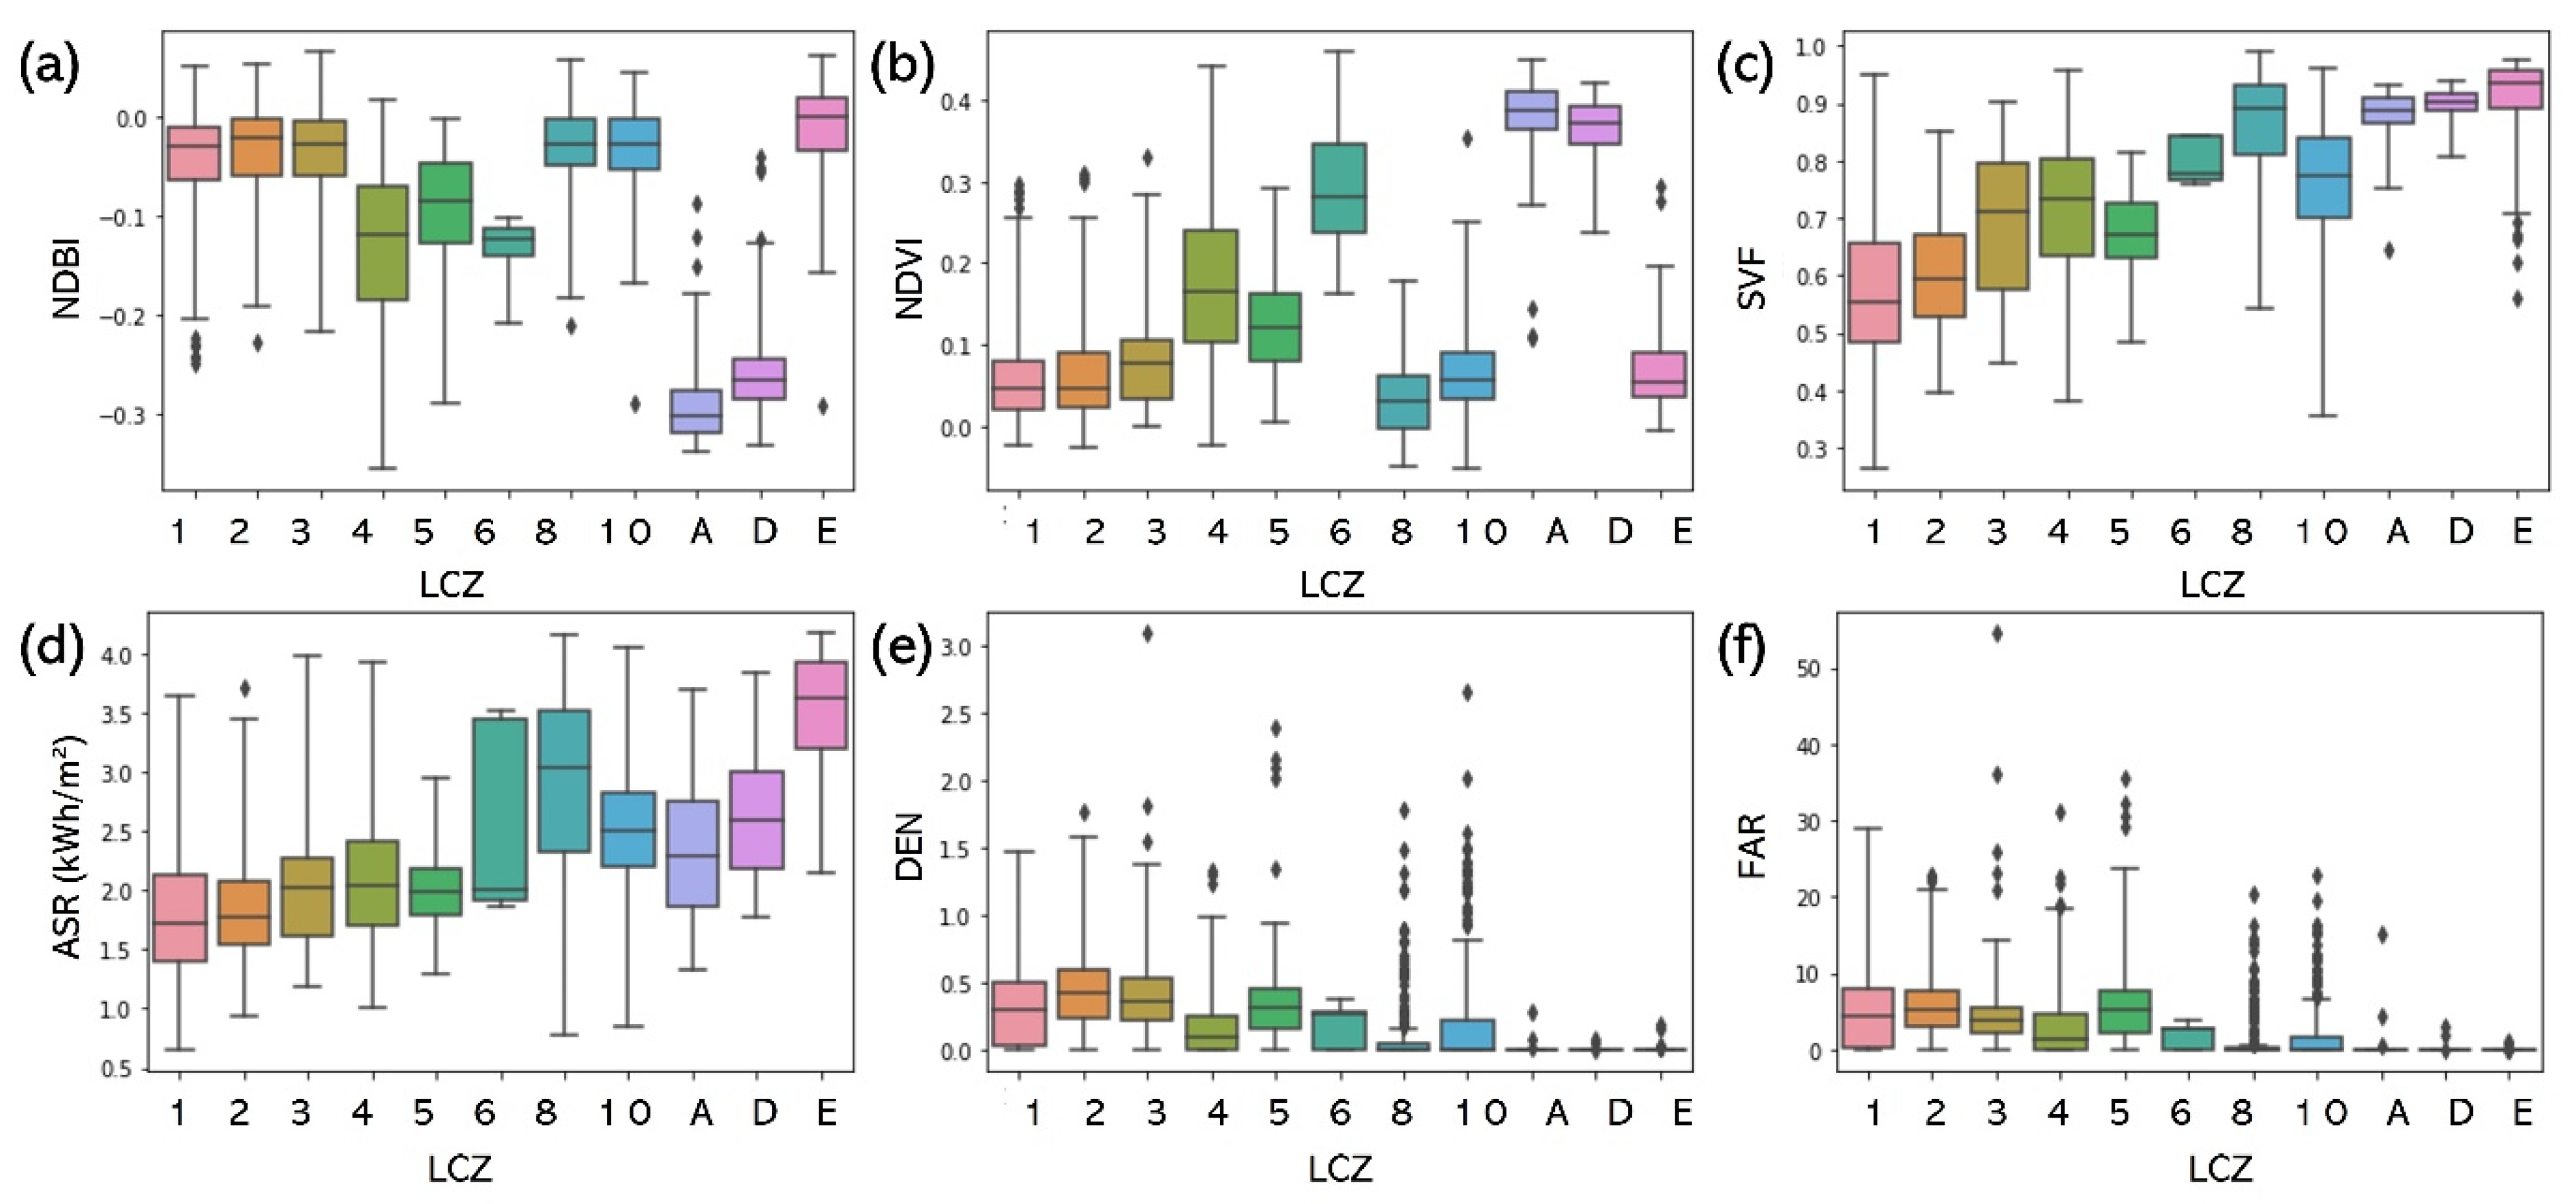
5.2. Distribution of the Indicators across LCZs
5.3. Correlation Analysis between the Indices and UHMs
6. Building Spatial Regression Model
7. Discussion and Conclusions
Author Contributions
Funding
Institutional Review Board Statement
Informed Consent Statement
Data Availability Statement
Conflicts of Interest
References
- Landsberg, H.E. The Urban Climate; Academic Press: New York, NY, USA, 1981. [Google Scholar]
- Oke, T.R. City size and the urban heat island. Atmos. Environ. 1973, 7, 769–779. [Google Scholar] [CrossRef]
- Arnfield, A.J. Two decades of urban climate research: A review of turbulence, exchanges of energy and water, and the urban heat island. Int. J. Climatol. 2003, 23, 1–26. [Google Scholar] [CrossRef]
- Zhao, S.; Liu, S.; Zhou, D. Prevalent vegetation growth enhancement in urban environment. Proc. Natl. Acad. Sci. USA 2016, 113, 6313–6318. [Google Scholar] [CrossRef] [Green Version]
- Zhou, D.; Zhao, S.; Zhang, L.; Liu, S. Remotely sensed assessment of urbanization effects on vegetation phenology in China’s 32 major cities. Remote Sens. Environ. 2016, 176, 272–281. [Google Scholar] [CrossRef] [Green Version]
- Grimm, N.B.; Faeth, S.H.; Golubiewski, N.E.; Redman, C.L.; Wu, J.; Bai, X.; Briggs, J.M. Global Change and the Ecology of Cities. Science 2008, 319, 756–760. [Google Scholar] [CrossRef] [Green Version]
- Wang, Y.; Li, Y.; Di Sabatino, S.; Martilli, A.; Chan, P.W. Effects of anthropogenic heat due to air-conditioning systems on an extreme high temperature event in Hong Kong. Environ. Res. Lett. 2018, 13, 034015. [Google Scholar] [CrossRef]
- Rydin, Y.; Bleahu, A.; Davies, M.; Dávila, J.D.; Friel, S.; De Grandis, G.; Groce, N.; Hallal, P.C.; Hamilton, I.; Howden-Chapman, P.; et al. Shaping cities for health: Complexity and the planning of urban environments in the 21st century. Lancet 2012, 379, 2079–2108. [Google Scholar] [CrossRef] [Green Version]
- Mirzaei, P.A.; Haghighat, F. Approaches to study Urban Heat Island—Abilities and limitations. Build. Environ. 2010, 45, 2192–2201. [Google Scholar] [CrossRef]
- Oke, T.R.; Johnson, G.T.; Steyn, D.G.; Watson, I.D. Simulation of surface urban heat islands under ‘ideal’ conditions at night part 2: Diagnosis of causation. Bound. Layer Meteorol. 1991, 56, 339–358. [Google Scholar] [CrossRef]
- Zhou, D.; Xiao, J.; Bonafoni, S.; Berger, C.; Deilami, K.; Zhou, Y.; Frolking, S.; Yao, R.; Qiao, Z.; Sobrino, J.A. Satellite Remote Sensing of Surface Urban Heat Islands: Progress, Challenges, and Perspectives. Remote Sens. 2019, 11, 48. [Google Scholar] [CrossRef] [Green Version]
- Bokaie, M.; Zarkesh, M.K.; Arasteh, P.D.; Hosseini, A. Assessment of Urban Heat Island based on the relationship between land surface temperature and Land Use/Land Cover in Tehran. Sustain. Cities Soc. 2016, 23, 94–104. [Google Scholar] [CrossRef]
- Liang, X.; Ji, X.; Guo, N.; Meng, L. Assessment of urban heat islands for land use based on urban planning: A case study in the main urban area of Xuzhou City, China. Environ. Earth Sci. 2021, 80, 308. [Google Scholar] [CrossRef]
- Guo, G.; Wu, Z.; Xiao, R.; Chen, Y.; Liu, X.; Zhang, X. Impacts of urban biophysical composition on land surface temperature in urban heat island clusters. Landsc. Urban Plan. 2015, 135, 1–10. [Google Scholar] [CrossRef]
- Lin, P.; Lau, S.S.Y.; WIn, H.; Gou, Z. Effects of urban planning indicators on urban heat island: A case study of pocket parks in high-rise high-density environment. Landsc. Urban Plan. 2017, 168, 48–60. [Google Scholar] [CrossRef]
- Coseo, P.; Larsen, L. How factors of land use/land cover, building configuration, and adjacent heat sources and sinks explain Urban Heat Islands in Chicago. Landsc. Urban Plan. 2014, 125, 117–129. [Google Scholar] [CrossRef]
- Kotharkar, R.; Bagade, A.; Ramesh, A. Assessing urban drivers of canopy layer urban heat island: A numerical modeling approach. Landsc. Urban Plan. 2019, 190, 103586. [Google Scholar] [CrossRef]
- Chun, B.; Guldmann, J.M. Spatial statistical analysis and simulation of the urban heat island in high-density central cities. Landsc. Urban Plan. 2014, 125, 76–88. [Google Scholar] [CrossRef]
- Peng, F.; Wong, M.S.; Ho, H.C.; Nichol, J.; Chan, P.W. Reconstruction of historical datasets for analyzing spatiotemporal influence of built environment on urban microclimates across a compact city. Build. Environ. 2017, 123, 649–660. [Google Scholar] [CrossRef]
- Giridharan, R.; Lau, S.S.Y.; Ganesan, S.; Givoni, B. Urban design factors influencing heat island intensity in high-rise high-density environments of Hong Kong. Build. Environ. 2007, 42, 3669–3684. [Google Scholar] [CrossRef]
- Clinton, N.; Gong, P. MODIS detected surface urban heat islands and sinks: Global locations and controls. Remote Sens. Environ. 2013, 134, 294–304. [Google Scholar] [CrossRef]
- Shi, Y.; Xiang, Y.; Zhang, Y. Urban Design Factors Influencing Surface Urban Heat Island in the High-Density City of Guangzhou Based on the Local Climate Zone. Sensors 2019, 19, 3459. [Google Scholar] [CrossRef] [Green Version]
- Zha, Y.; Gao, J.; Ni, S. Use of normalized difference built-up index in automatically mapping urban areas from TM imagery. Int. J. Remote Sens. 2003, 24, 583–594. [Google Scholar] [CrossRef]
- Pal, S.; Ziaul, S. Detection of land use and land cover change and land surface temperature in English Bazar urban centre. Egypt. J. Remote Sens. Space Sci. 2017, 20, 125–145. [Google Scholar] [CrossRef] [Green Version]
- Wardlow, B.D.; Egbert, S.L.; Kastens, J.H. Analysis of time-series MODIS 250 m vegetation index data for crop classification in the U.S. Central Great Plains. Remote Sens. Environ. 2007, 108, 290–310. [Google Scholar] [CrossRef] [Green Version]
- Smoliak, B.V.; Snyder, P.K.; Twine, T.E.; Mykleby, P.M.; Hertel, W.F. Dense Network Observations of the Twin Cities Canopy-Layer Urban Heat Island. J. Appl. Meteorol. Climatol. 2015, 54, 1899–1917. [Google Scholar] [CrossRef]
- Yu, Z.; Yao, Y.; Yang, G.; Wang, X.; Vejre, H. Strong contribution of rapid urbanization and urban agglomeration development to regional thermal environment dynamics and evolution. For. Ecol. Manag. 2019, 446, 214–225. [Google Scholar] [CrossRef]
- Manoli, G.; Fatichi, S.; Schläpfer, M.; Yu, K.; Crowther, T.W.; Meili, N.; Burlando, P.; Katul, G.G.; Bou-Zeid, E. Magnitude of urban heat islands largely explained by climate and population. Nature 2019, 573, 55–60. [Google Scholar] [CrossRef]
- Liu, H.; Huang, B.; Zhan, Q.; Gao, S.; Li, R.; Fan, Z. The influence of urban form on surface urban heat island and its planning implications: Evidence from 1288 urban clusters in China. Sustain. Cities Soc. 2021, 71, 102987. [Google Scholar] [CrossRef]
- Icaza, L.E.; van den Dobbelsteen, A.V.; Hoeven, F.V. Integrating Urban Heat Assessment in Urban Plans. Sustainability 2016, 8, 320. [Google Scholar] [CrossRef] [Green Version]
- Zhu, R.; Guilbert, E.; Wong, M.S. Object-oriented tracking of the dynamic behavior of urban heat islands. Int. J. Geogr. Inf. Sci. 2017, 31, 405–424. [Google Scholar] [CrossRef] [Green Version]
- Zhu, R.; Guilbert, E.; Wong, M.S. Object-oriented tracking of spatial and thematic dynamic behaviors of urban heat islands. Trans. GIS 2020, 24, 85–103. [Google Scholar] [CrossRef]
- Zhang, Y.; Murray, A.T.; Turner, B.L., II. Optimizing green space locations to reduce daytime and nighttime urban heat island effects in Phoenix, Arizona. Landsc. Urban Plan. 2017, 165, 162–171. [Google Scholar] [CrossRef]
- Stewart, I.D.; Oke, T.R. Local Climate Zones for Urban Temperature Studies. Bull. Am. Meteorol. Soc. 2012, 93, 1879–1900. [Google Scholar] [CrossRef]
- Wang, K.; Jiang, S.; Wang, J.; Zhou, C.; Wang, X.; Lee, X. Comparing the diurnal and seasonal variabilities of atmospheric and surface urban heat islands based on the Beijing urban meteorological network. J. Geophys. Res. Atmos. 2017, 122, 2131–2154. [Google Scholar] [CrossRef]
- Deilami, K.; Kamruzzaman, M.; Liu, Y. Urban heat island effect: A systematic review of spatio-temporal factors, data, methods, and mitigation measures. Int. J. Appl. Earth Obs. Geoinf. 2018, 67, 30–42. [Google Scholar] [CrossRef]
- Weng, Q. Thermal infrared remote sensing for urban climate and environmental studies: Methods, applications, and trends. ISPRS J. Photogramm. Remote Sens. 2009, 64, 335–344. [Google Scholar] [CrossRef]
- Zhou, B.; Rybski, D.; Kropp, J.P. The role of city size and urban form in the surface urban heat island. Sci. Rep. 2017, 7, 4791. [Google Scholar] [CrossRef]
- Kwak, Y.; Park, C.; Deal, B. Discerning the success of sustainable planning: A comparative analysis of urban heat island dynamics in Korean new towns. Sustain. Cities Soc. 2020, 61, 102341. [Google Scholar] [CrossRef]
- Yin, C.; Yuan, M.; Lu, Y.; Huang, Y.; Liu, Y. Effects of urban form on the urban heat island effect based on spatial regression model. Sci. Total Environ. 2018, 634, 696–704. [Google Scholar] [CrossRef]
- Nassar, A.K.; Blackburn, G.A.; Whyatt, J.D. Dynamics and controls of urban heat sink and island phenomena in a desert city: Development of a local climate zone scheme using remotely-sensed inputs. Int. J. Appl. Earth Obs. Geoinf. 2016, 51, 76–90. [Google Scholar] [CrossRef] [Green Version]
- Zhu, R.; Wong, M.S.; Guilbert, E.; Chan, P.W. Understanding heat patterns produced by vehicular flows in urban areas. Sci. Rep. 2017, 7, 16309. [Google Scholar] [CrossRef] [Green Version]
- Leconte, F.; Bouyer, J.; Claverie, R.; Pétrissans, M.J.B. Using Local Climate Zone scheme for UHI assessment: Evaluation of the method using mobile measurements. Build. Environ. 2015, 83, 39–49. [Google Scholar] [CrossRef]
- Lelovics, E.; Unger, J.; Gál, T.; Gál, C.V. Design of an urban monitoring network based on Local Climate Zone mapping and temperature pattern modelling. Clim. Res. 2014, 60, 51–62. [Google Scholar] [CrossRef] [Green Version]
- Stewart, I.D.; Oke, T.R.; Krayenhoff, E.S. Evaluation of the ‘local climate zone’ scheme using temperature observations and model simulations. Int. J. Climatol. 2014, 34, 1062–1080. [Google Scholar] [CrossRef]
- Oguz, H. LST calculator: A program for retrieving land surface temperature from Landsat TM/ETM+ imagery. Environ. Eng. Manag. J. 2013, 12, 549–555. [Google Scholar] [CrossRef]
- Zareie, S.; Khosravi, H.; Nasiri, A. Derivation of land surface temperature from Landsat Thematic Mapper (TM) sensor data and analyzing relation between land use changes and surface temperature. Solid Earth Discuss 2016, 1–15. [Google Scholar] [CrossRef]
- Ihlen, V. Landsat 8 Data Users Handbook; US Geological Survey: Sioux Falls, SD, USA, 2019; p. 55.
- Chen, X.L.; Zhao, H.M.; Li, P.X.; Yin, Z.Y. Remote sensing image-based analysis of the relationship between urban heat island and land use/cover changes. Remote Sens. Environ. 2006, 104, 133–146. [Google Scholar] [CrossRef]
- Javadnia, E.; Mobasheri, M.R.; Kamali, G.H.A. MODIS NDVI quality enhancement using ASTER images. J. Agric. Sci. Technol. 2009, 11, 549–558. [Google Scholar]
- Townshend, J.R.G.; Justice, C.O. Analysis of the dynamics of African vegetation using the normalized difference vegetation index. Int. J. Remote Sens. 1986, 7, 1435–1445. [Google Scholar] [CrossRef]
- Watson, I.D.; Johnson, G.T. Graphical estimation of sky view-factors in urban environments. J. Climatol. 1987, 7, 193–197. [Google Scholar] [CrossRef]
- Chen, Q.; Cheng, Q.; Chen, Y.; Li, K.; Wang, D.; Cao, S. The Influence of Sky View Factor on Daytime and Nighttime Urban Land Surface Temperature in Different Spatial-Temporal Scales: A Case Study of Beijing. Remote Sens. 2021, 13, 4117. [Google Scholar] [CrossRef]
- Bernard, J.; Bocher, E.; Petit, G.; Palominos, S. Sky view factor calculation in urban context: Computational performance and accuracy analysis of two open and free GIS Tools. Climate 2018, 6, 60. [Google Scholar] [CrossRef] [Green Version]
- Fu, P.; Rich, P.M. A geometric solar radiation model with applications in agriculture and forestry. Comput. Electron. Agric. 2002, 37, 25–35. [Google Scholar] [CrossRef]
- ESRI. Available online: https://desktop.arcgis.com/en/arcmap/10.3/tools/spatial-analyst-toolbox/area-solar-radiation.htm (accessed on 8 August 2021).
- Huang, S.; Rich, P.M.; Crabtree, R.L.; Potter, C.S.; Fu, P. Modeling Monthly Near-Surface Air Temperature from Solar Radiation and Lapse Rate: Application over Complex Terrain in Yellowstone National Park. Phys. Geogr. 2008, 29, 158–178. [Google Scholar] [CrossRef]
- Census and Statistics Department. Available online: https://www.bycensus2016.gov.hk/tc/index.html (accessed on 8 August 2021).
- Lands Department. Available online: https://www.landsd.gov.hk/tc/resources/mapping-information/hk-geographic-data.html (accessed on 8 August 2021).
- Energizing Kowloon East Office. Available online: https://www.ekeo.gov.hk/en/home/index.html (accessed on 8 August 2021).
- Nichol, J.E.; Fung, W.Y.; Lam, K.; Wong, M.S. Urban heat island diagnosis using ASTER satellite images and ‘in situ’ air temperature. Atmos. Res. 2009, 94, 276–284. [Google Scholar] [CrossRef]
- Wong, M.S.; Peng, F.; Zou, B.; Shi, W.Z.; Wilson, G.J. Spatially analyzing the inequity of the Hong Kong urban heat island by socio-demographic characteristics. Int. J. Environ. Res. Public Health 2016, 13, 317. [Google Scholar] [CrossRef] [Green Version]
- Hong Kong Observatory. Available online: https://www.weather.gov.hk/en/wxinfo/pastwx/mws/mws.htm (accessed on 8 August 2021).
- World Weather Online. Available online: https://www.worldweatheronline.com/hung-hom-weather-history/hk.aspx (accessed on 8 August 2021).
- United States Geological Survey. Available online: https://earthexplorer.usgs.gov/ (accessed on 8 August 2021).
- Town Planning Board. Available online: https://www2.ozp.tpb.gov.hk/gos/default.aspx (accessed on 8 August 2021).
- World Urban Database Portal Tools. Available online: https://wudapt.cs.purdue.edu/wudaptTools/default/cities (accessed on 8 August 2021).
- Development Bureau. Available online: https://www.ekeo.gov.hk/filemanager/ekeo/common/Smart-Green-Resilient-CBD/1106_Brenda_Au_ppt_WorldGBC_Congress_2015_Final.pdf (accessed on 8 August 2021).
- Mason, R.L.; Gunst, R.F.; Hess, J.L. Statistical Design and Analysis of Experiments: Applications to Engineering and Science; Wiley: New York, NY, USA, 1989. [Google Scholar]
- Menard, S. Applied Logistic Regression Analysis, 2nd ed.; SAGE Publications Inc.: Thousand Oaks, CA, USA, 1995. [Google Scholar]
- Huang, G.; Cadenasso, M. People, landscape, and urban heat island: Dynamics among neighborhood social conditions, land cover and surface temperatures. Landsc. Ecol. 2016, 31, 2507–2515. [Google Scholar] [CrossRef]
- Zhou, J.; Chen, Y.; Zhang, X.; Zhan, W. Modelling the diurnal variations of urban heat islands with multi-source satellite data. Int. J. Remote Sens. 2013, 34, 7568–7588. [Google Scholar] [CrossRef]
- Guo, J.; Han, G.; Xie, Y.; Cai, Z.; Zhao, Y. Exploring the relationships between urban spatial form factors and land surface temperature in mountainous area: A case study in Chongqing city, China. Sustain. Cities Soc. 2020, 61, 102286. [Google Scholar] [CrossRef]


| Types | Zones | Description | Counts | Proportion |
|---|---|---|---|---|
| Built-up types | LCZ-1 | Compact highrise | 590 | 19.36% |
| LCZ-2 | Compact midrise | 569 | 18.67% | |
| LCZ-3 | Compact lowrise | 237 | 7.78% | |
| LCZ-4 | Open highrise | 797 | 26.15% | |
| LCZ-5 | Open midrise | 85 | 2.79% | |
| LCZ-6 | Open lowrise | 5 | 0.16% | |
| LCZ-8 | Large lowrise | 225 | 7.38% | |
| LCZ-10 | Heavy industry | 264 | 8.66% | |
| Land-cover types | LCZ-A | Dense trees | 70 | 2.30% |
| LCZ-D | Low plants | 59 | 1.94% | |
| LCZ-E | Bare rock or paved | 147 | 4.82% |
| Type | Zone | Description | Count | Proportion |
|---|---|---|---|---|
| Built-up type | LCZ-4 | Open highrise | 102 | 27.27% |
| LCZ-5 | Open midrise | 51 | 13.64% | |
| LCZ-6 | Open lowrise | 124 | 33.15% | |
| Land-cover type | LCZ-D | Low plants | 97 | 25.94% |
| Seasons | Dates | Radiation Parameters | |
|---|---|---|---|
| Transmittivity | Diffuse Proportion | ||
| Spring | 1 April 2018 | 0.62 | 0.30 |
| Summer | 20 August 2017 | 0.70 | 0.20 |
| Autumn | 14 November 2019 | 0.70 | 0.20 |
| Winter | 2 December 2020 | 0.62 | 0.30 |
| Season | Coef. | NDBI | NDVI | SVF | ASR | DEN | FAR | OSR | BH |
|---|---|---|---|---|---|---|---|---|---|
| Spring | R | 0.5500 | −0.1930 | 0.0240 | 0.2570 | 0.0540 | 0.0060 | 0.0100 | −0.1000 |
| PR | 0.561 | 0.386 | −0.119 | 0.084 | 0.078 | −0.020 | 0.010 | −0.065 | |
| p | 0.0000 | 0.0000 | 0.0000 | 0.0000 | 0.0000 | 0.0000 | 0.5870 | 0.2800 | |
| O | 0.288 | 0.293 | 0.275 | 0.275 | 0.142 | 0.619 | 0.993 | 0.131 | |
| VIF | 3.467 | 3.409 | 3.632 | 3.631 | 7.024 | 1.615 | 1.007 | 7.616 | |
| Summer | R | 0.6200 | −0.4780 | −0.1510 | 0.1520 | 0.2250 | 0.1260 | 0.0140 | −0.0550 |
| PR | 0.397 | 0.138 | −0.167 | 0.243 | 0.168 | 0.040 | 0.048 | −0.146 | |
| p | 0.0000 | 0.0000 | 0.0000 | 0.0000 | 0.0000 | 0.0000 | 0.0080 | 0.0270 | |
| O | 0.194 | 0.199 | 0.289 | 0.364 | 0.178 | 0.520 | 0.995 | 0.148 | |
| VIF | 5.154 | 5.026 | 3.464 | 2.751 | 5.611 | 1.922 | 1.005 | 6.742 | |
| Autumn | P | 0.6930 | −0.4030 | 0.0960 | 0.2170 | 0.0750 | 0.0000 | 0.0110 | −0.1970 |
| PR | 0.618 | 0.236 | 0.054 | 0.058 | 0.146 | −0.062 | 0.032 | −0.122 | |
| p | 0.0000 | 0.0000 | 0.0030 | 0.0010 | 0.0000 | 0.0000 | 0.0780 | 0.0010 | |
| O | 0.284 | 0.251 | 0.262 | 0.267 | 0.142 | 0.619 | 0.992 | 0.131 | |
| VIF | 3.517 | 3.987 | 3.811 | 3.74 | 7.036 | 1.614 | 1.008 | 7.637 | |
| Winter | R | 0.5000 | −0.2670 | 0.2130 | 0.3300 | −0.0130 | −0.0980 | 0.0320 | −0.2020 |
| PR | 0.540 | 0.313 | 0.053 | 0.182 | 0.149 | 0.025 | 0.049 | −0.133 | |
| p | 0.0000 | 0.0000 | 0.0030 | 0.0000 | 0.0000 | 0.0000 | 0.0060 | 0.1670 | |
| O | 0.183 | 0.169 | 0.234 | 0.255 | 0.179 | 0.512 | 0.995 | 0.146 | |
| VIF | 5.457 | 5.933 | 4.271 | 3.929 | 5.601 | 1.955 | 1.005 | 6.846 |
| Season | Coef. | NDBI | NDVI | SVF | ASR | BH | FAR | LCZ-2 | LCZ-3 | LCZ-4 | LCZ-8 | LCZ-10 |
|---|---|---|---|---|---|---|---|---|---|---|---|---|
| Spring | R | 0.457 | 0.001 | 0.071 | 0.286 | −0.138 | −0.038 | 0.075 | 0.194 | −0.162 | −0.201 | 0.232 |
| PR | 0.499 | 0.324 | −0.060 | 0.139 | −0.032 | 0.000 | 0.081 | 0.144 | −0.027 | −0.212 | 0.145 | |
| p | 0.000 | 0.000 | 0.000 | 0.000 | 0.000 | 0.023 | 0.000 | 0.000 | 0.000 | 0.000 | 0.000 | |
| O | 0.373 | 0.299 | 0.258 | 0.285 | 0.648 | 0.743 | 0.679 | 0.748 | 0.441 | 0.520 | 0.658 | |
| VIF | 2.682 | 3.346 | 3.874 | 3.506 | 1.543 | 1.346 | 1.473 | 1.337 | 2.266 | 1.924 | 1.519 | |
| Summer | R | 0.522 | −0.304 | −0.102 | 0.154 | −0.127 | 0.073 | 0.204 | 0.196 | −0.357 | −0.219 | 0.254 |
| PR | 0.430 | 0.201 | −0.063 | 0.250 | −0.057 | 0.034 | 0.114 | 0.136 | −0.074 | −0.326 | 0.120 | |
| p | 0.000 | 0.000 | 0.000 | 0.000 | 0.000 | 0.000 | 0.000 | 0.000 | 0.000 | 0.000 | 0.000 | |
| O | 0.210 | 0.199 | 0.278 | 0.377 | 0.660 | 0.741 | 0.674 | 0.747 | 0.463 | 0.526 | 0.660 | |
| VIF | 4.752 | 5.017 | 3.592 | 2.650 | 1.516 | 1.350 | 1.484 | 1.339 | 2.158 | 1.901 | 1.516 | |
| Autumn | R | 0.584 | −0.207 | 0.182 | 0.333 | −0.276 | −0.065 | 0.110 | 0.169 | −0.342 | 0.032 | 0.299 |
| PR | 0.560 | 0.263 | 0.058 | 0.109 | −0.107 | 0.013 | 0.130 | 0.114 | −0.084 | −0.102 | 0.198 | |
| p | 0.000 | 0.000 | 0.000 | 0.000 | 0.000 | 0.000 | 0.000 | 0.000 | 0.000 | 0.048 | 0.000 | |
| O | 0.351 | 0.256 | 0.247 | 0.269 | 0.657 | 0.742 | 0.679 | 0.752 | 0.450 | 0.503 | 0.652 | |
| VIF | 2.851 | 3.910 | 4.053 | 3.722 | 1.522 | 1.347 | 1.472 | 1.331 | 2.222 | 1.988 | 1.533 | |
| Winter | R | 0.382 | −0.096 | 0.286 | 0.433 | −0.249 | −0.098 | 0.097 | 0.159 | −0.272 | 0.115 | 0.237 |
| PR | 0.481 | 0.338 | 0.033 | 0.212 | −0.039 | 0.013 | 0.175 | 0.155 | −0.086 | −0.017 | 0.159 | |
| p | 0.000 | 0.000 | 0.000 | 0.000 | 0.000 | 0.000 | 0.000 | 0.000 | 0.000 | 0.000 | 0.000 | |
| O | 0.227 | 0.183 | 0.235 | 0.259 | 0.661 | 0.740 | 0.678 | 0.755 | 0.464 | 0.512 | 0.654 | |
| VIF | 4.406 | 5.476 | 4.260 | 3.868 | 1.513 | 1.351 | 1.474 | 1.325 | 2.155 | 1.952 | 1.529 |
| Date | Indicator | R | PR | p | O | VIF |
|---|---|---|---|---|---|---|
| Spring | NDVI | −0.852 | −0.776 | 0.000 | 0.688 | 1.453 |
| ASR | 0.644 | 0.388 | 0.000 | 0.688 | 1.453 | |
| Summer | NDVI | −0.889 | −0.803 | 0.000 | 0.591 | 1.692 |
| ASR | 0.696 | 0.363 | 0.000 | 0.591 | 1.692 | |
| Autumn | NDVI | −0.907 | −0.910 | 0.000 | 0.959 | 1.043 |
| ASR | 0.339 | 0.376 | 0.000 | 0.959 | 1.043 | |
| Winter | NDVI | −0.834 | −0.832 | 0.000 | 0.958 | 1.044 |
| ASR | 0.353 | 0.338 | 0.000 | 0.958 | 1.044 |
Publisher’s Note: MDPI stays neutral with regard to jurisdictional claims in published maps and institutional affiliations. |
© 2022 by the authors. Licensee MDPI, Basel, Switzerland. This article is an open access article distributed under the terms and conditions of the Creative Commons Attribution (CC BY) license (https://creativecommons.org/licenses/by/4.0/).
Share and Cite
Zhu, R.; Dong, X.; Wong, M.S. Estimation of the Urban Heat Island Effect in a Reformed Urban District: A Scenario-Based Study in Hong Kong. Sustainability 2022, 14, 4409. https://doi.org/10.3390/su14084409
Zhu R, Dong X, Wong MS. Estimation of the Urban Heat Island Effect in a Reformed Urban District: A Scenario-Based Study in Hong Kong. Sustainability. 2022; 14(8):4409. https://doi.org/10.3390/su14084409
Chicago/Turabian StyleZhu, Rui, Xijia Dong, and Man Sing Wong. 2022. "Estimation of the Urban Heat Island Effect in a Reformed Urban District: A Scenario-Based Study in Hong Kong" Sustainability 14, no. 8: 4409. https://doi.org/10.3390/su14084409
APA StyleZhu, R., Dong, X., & Wong, M. S. (2022). Estimation of the Urban Heat Island Effect in a Reformed Urban District: A Scenario-Based Study in Hong Kong. Sustainability, 14(8), 4409. https://doi.org/10.3390/su14084409