
A Method for Identifying Urban Functional Zones Based on Landscape Types and Human Activities


Abstract
:1. Introduction
2. Materials
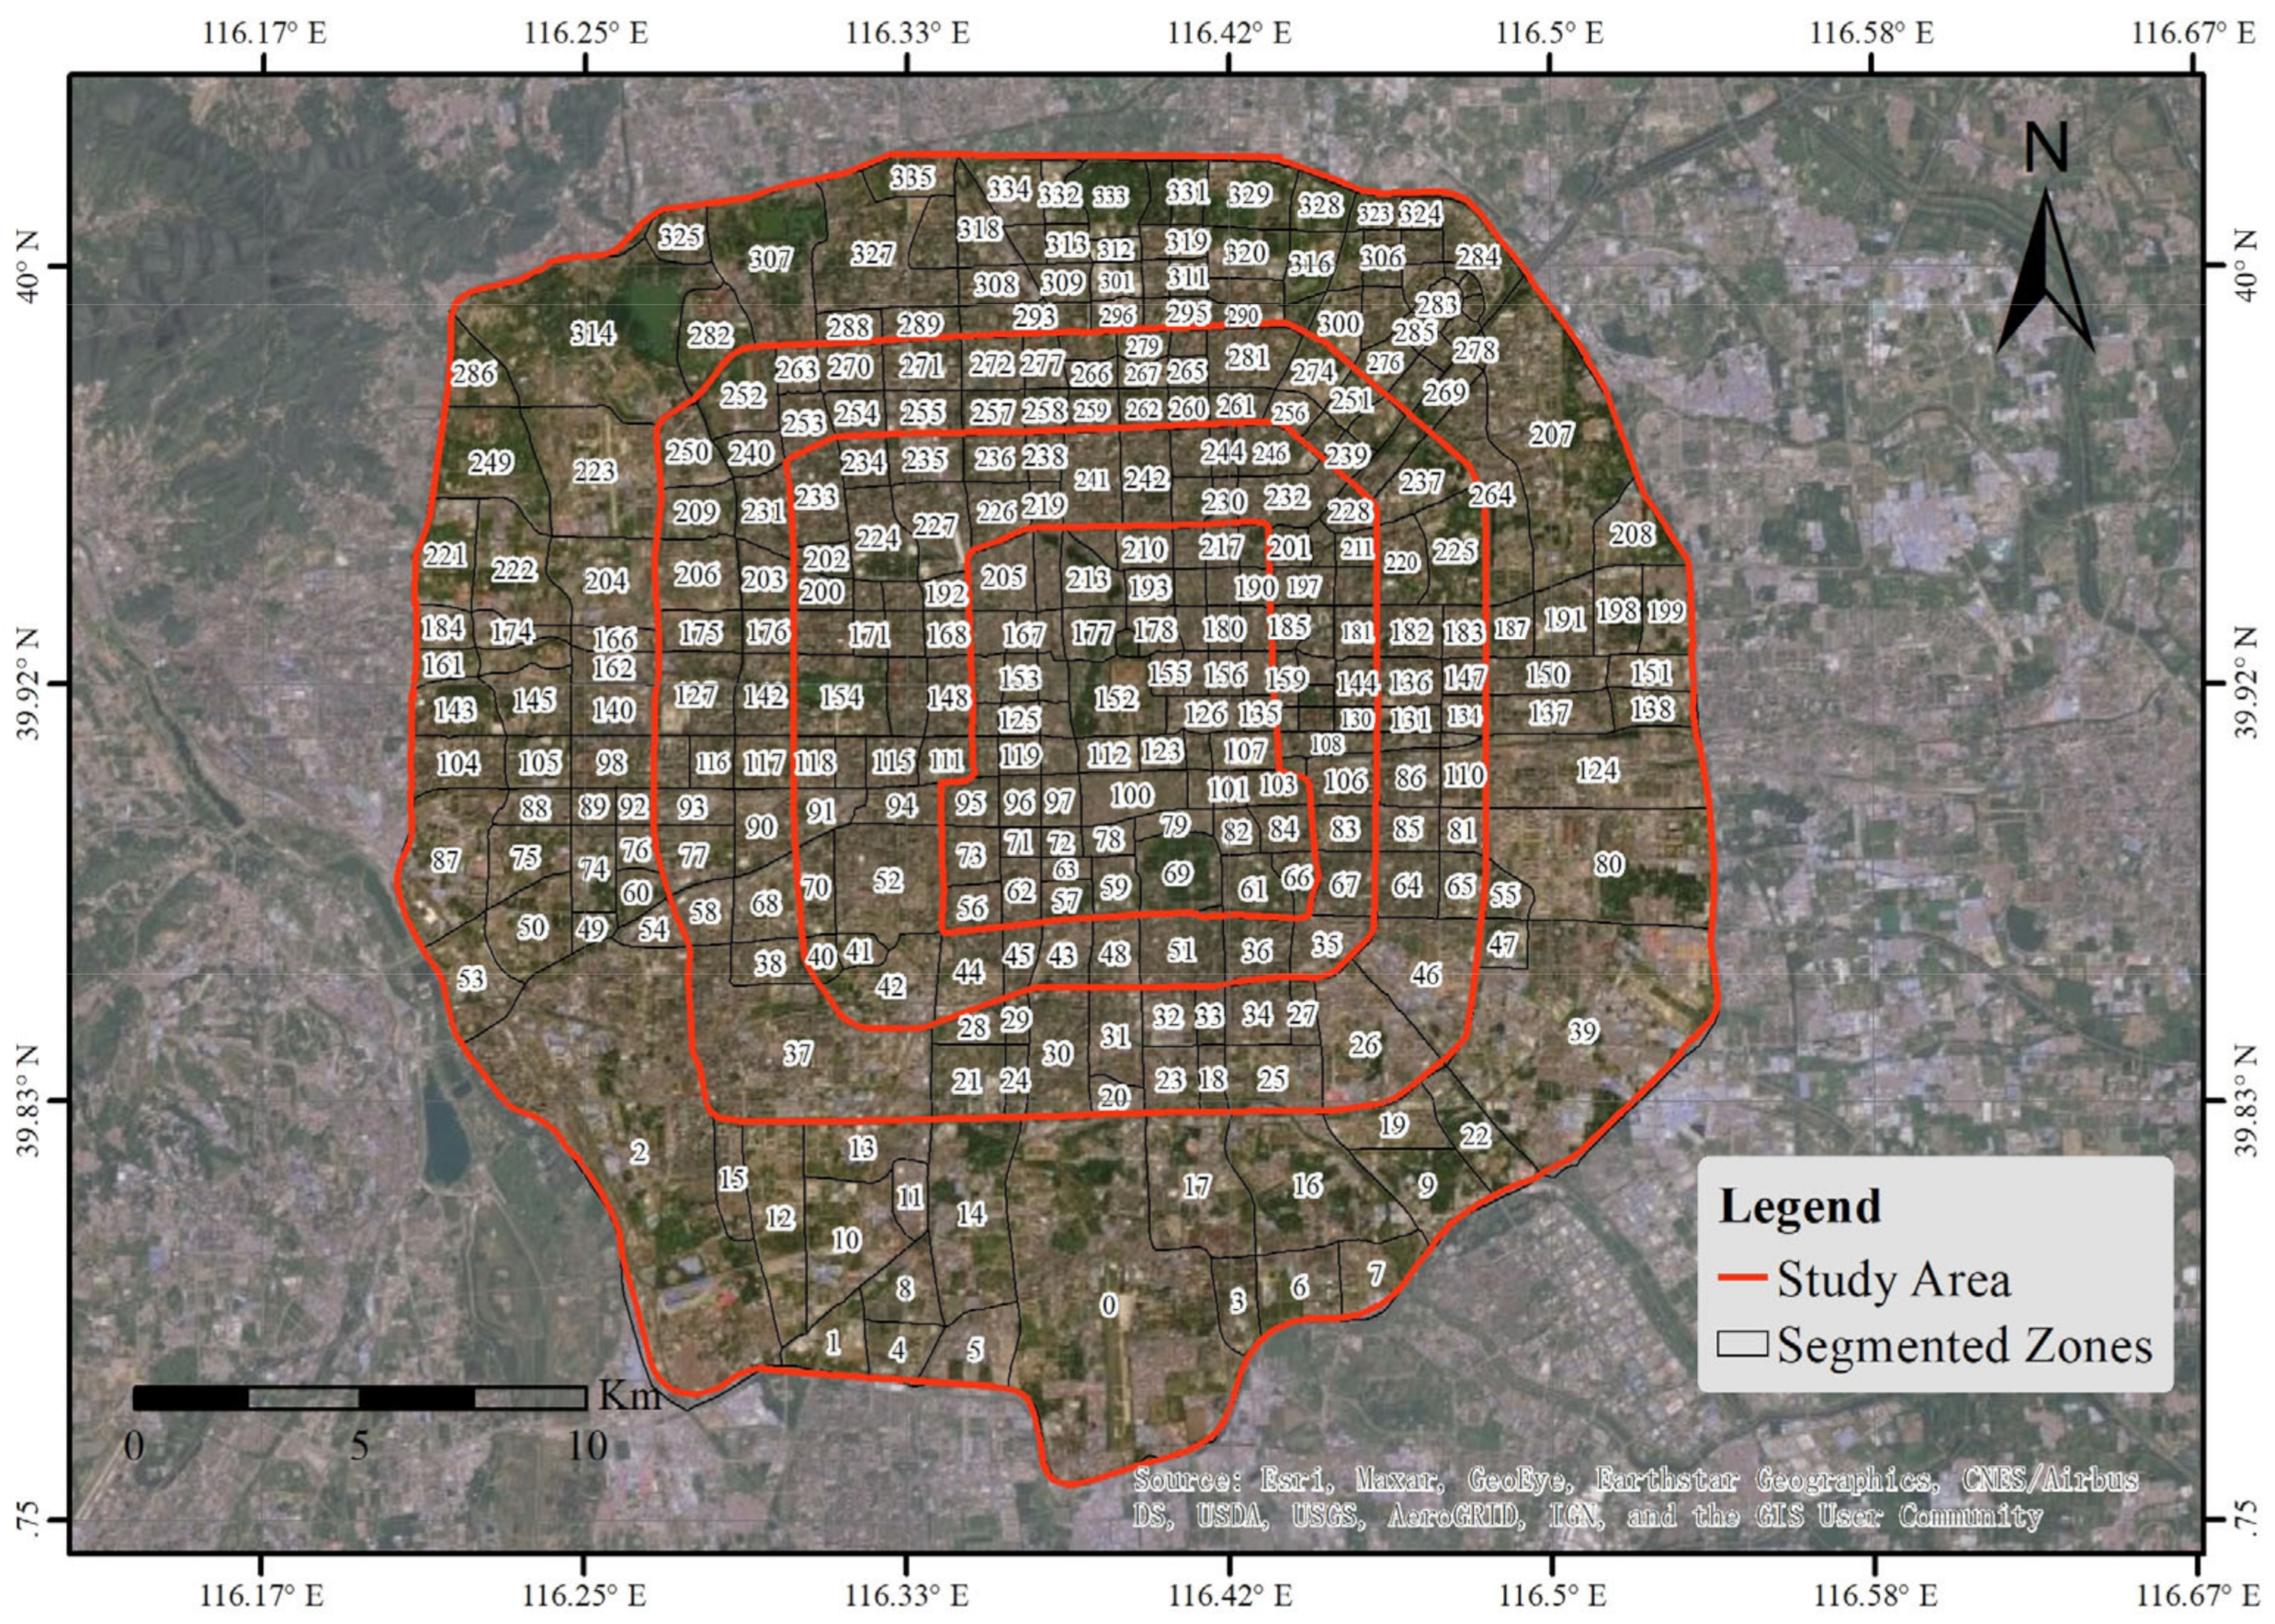
2.1. Study Area
2.2. Data Sources
3. Methodology
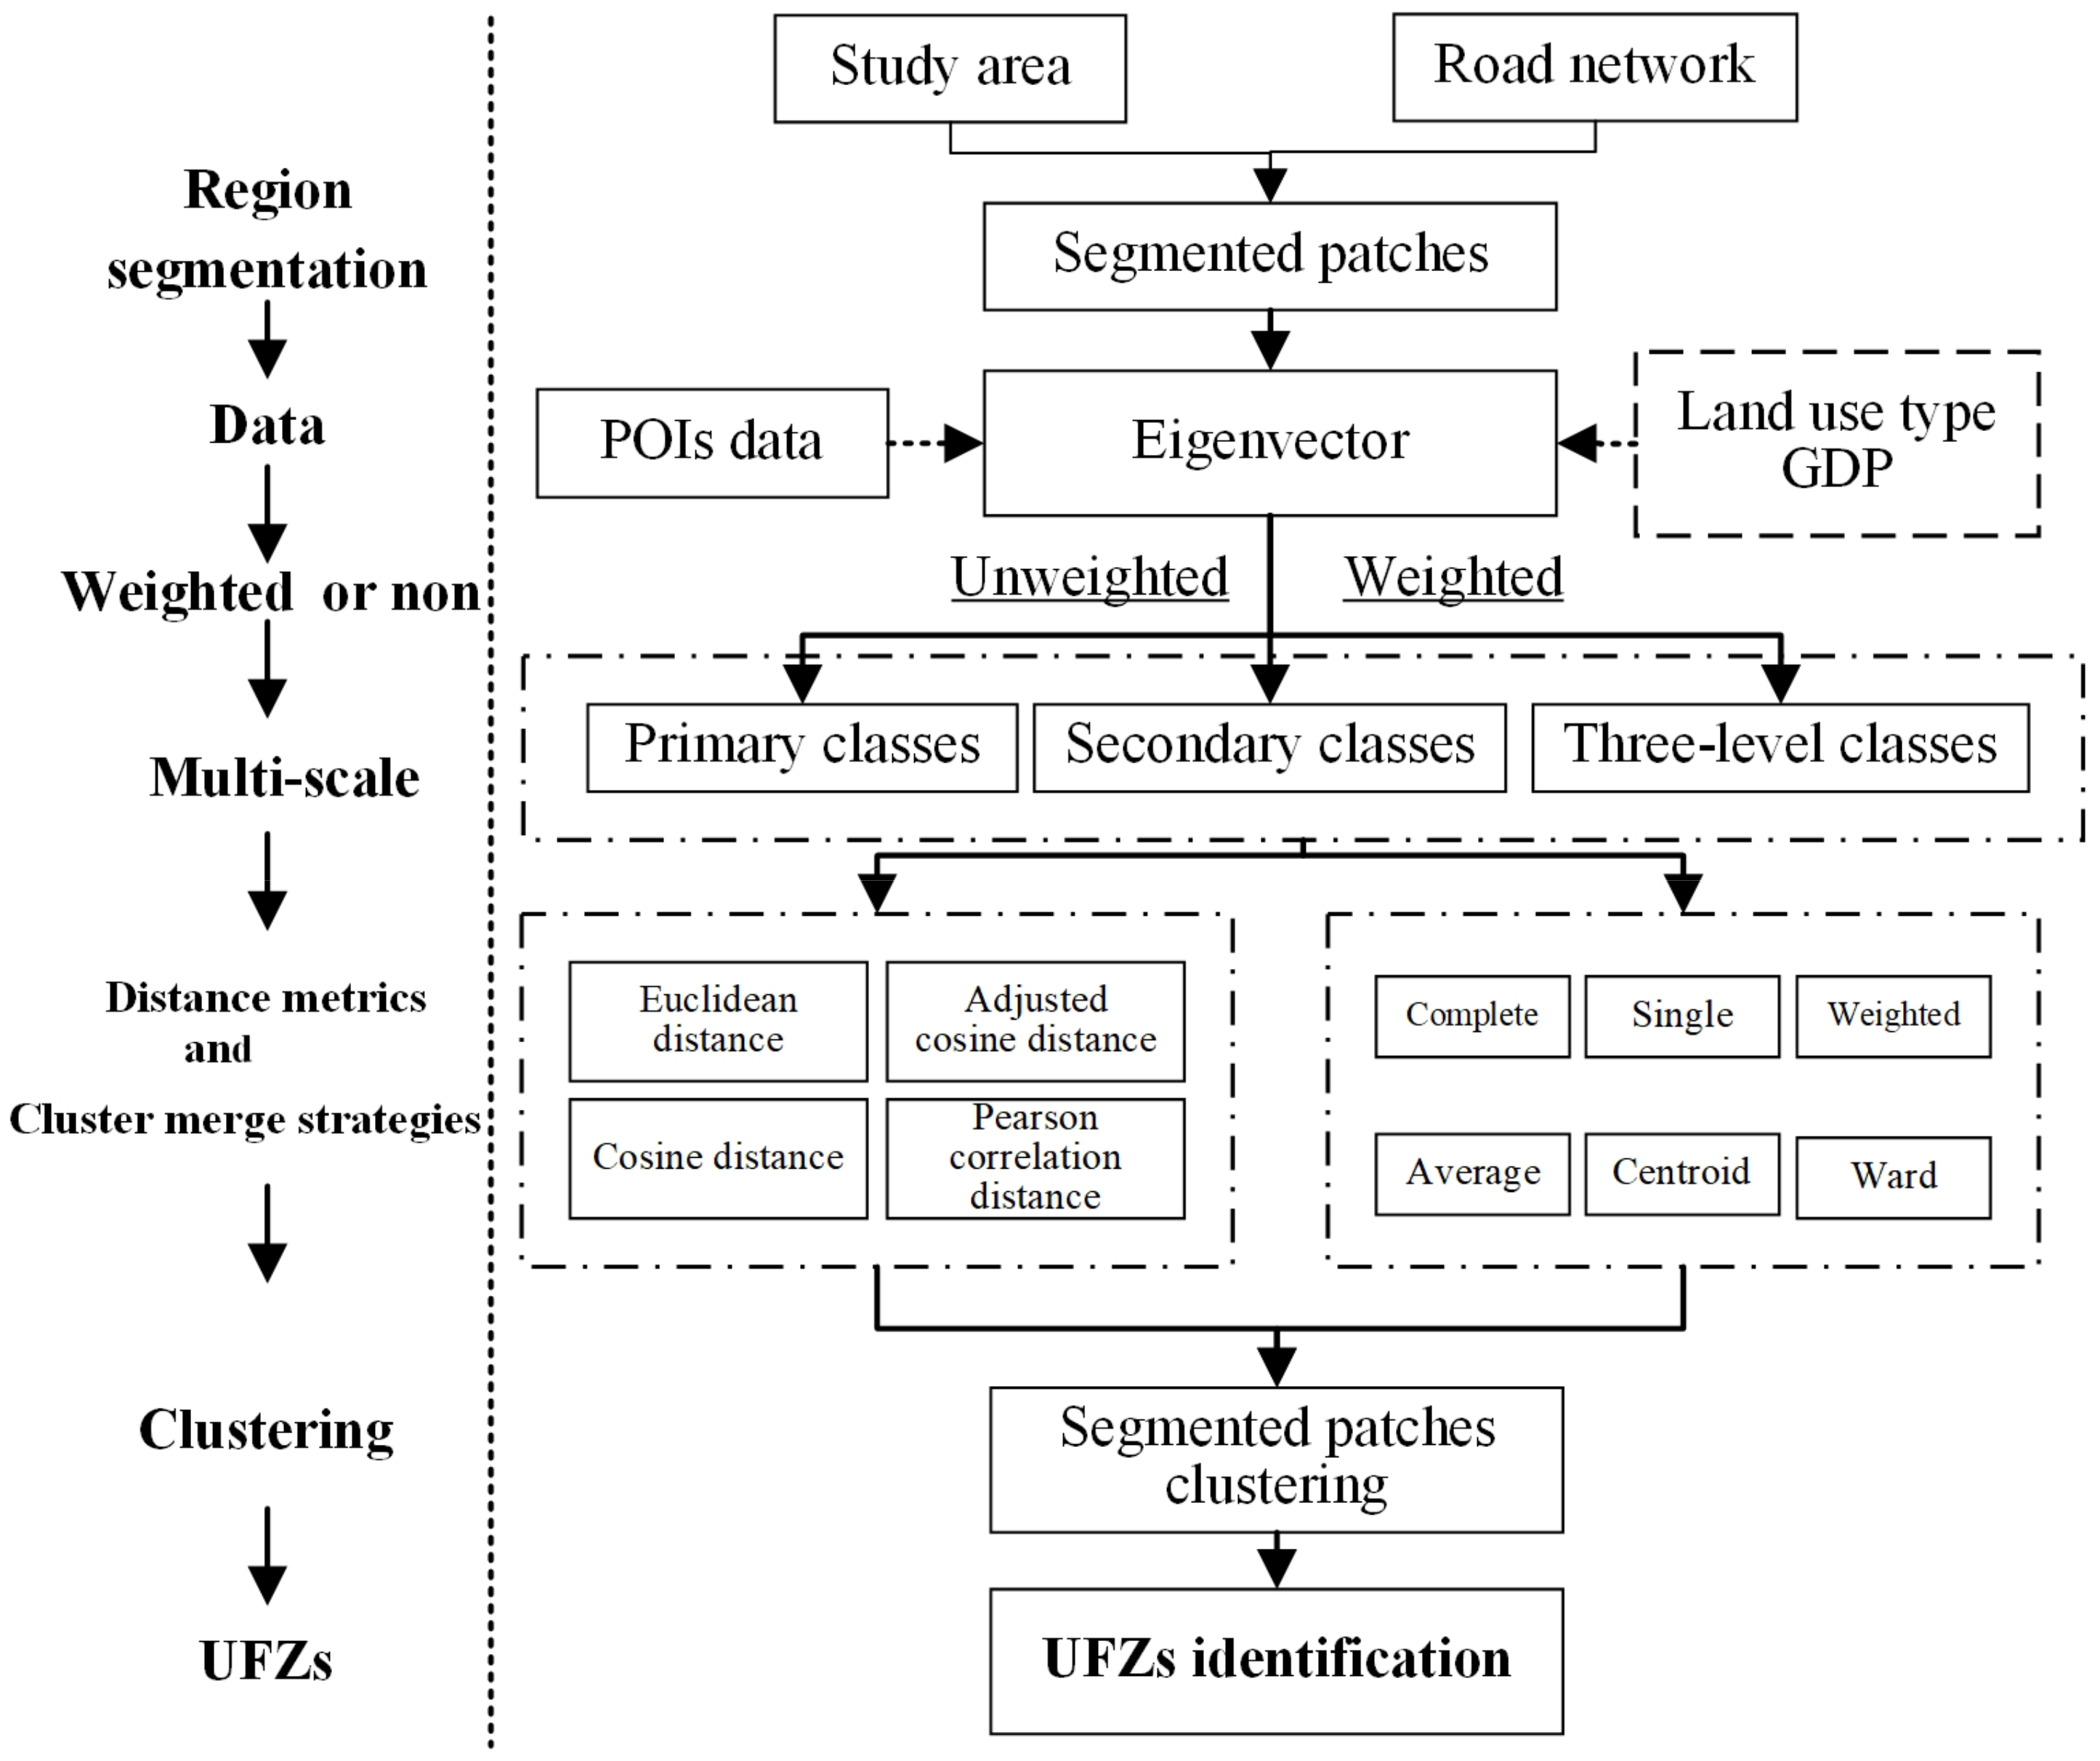
3.1. The Framework for Identifying UFZs
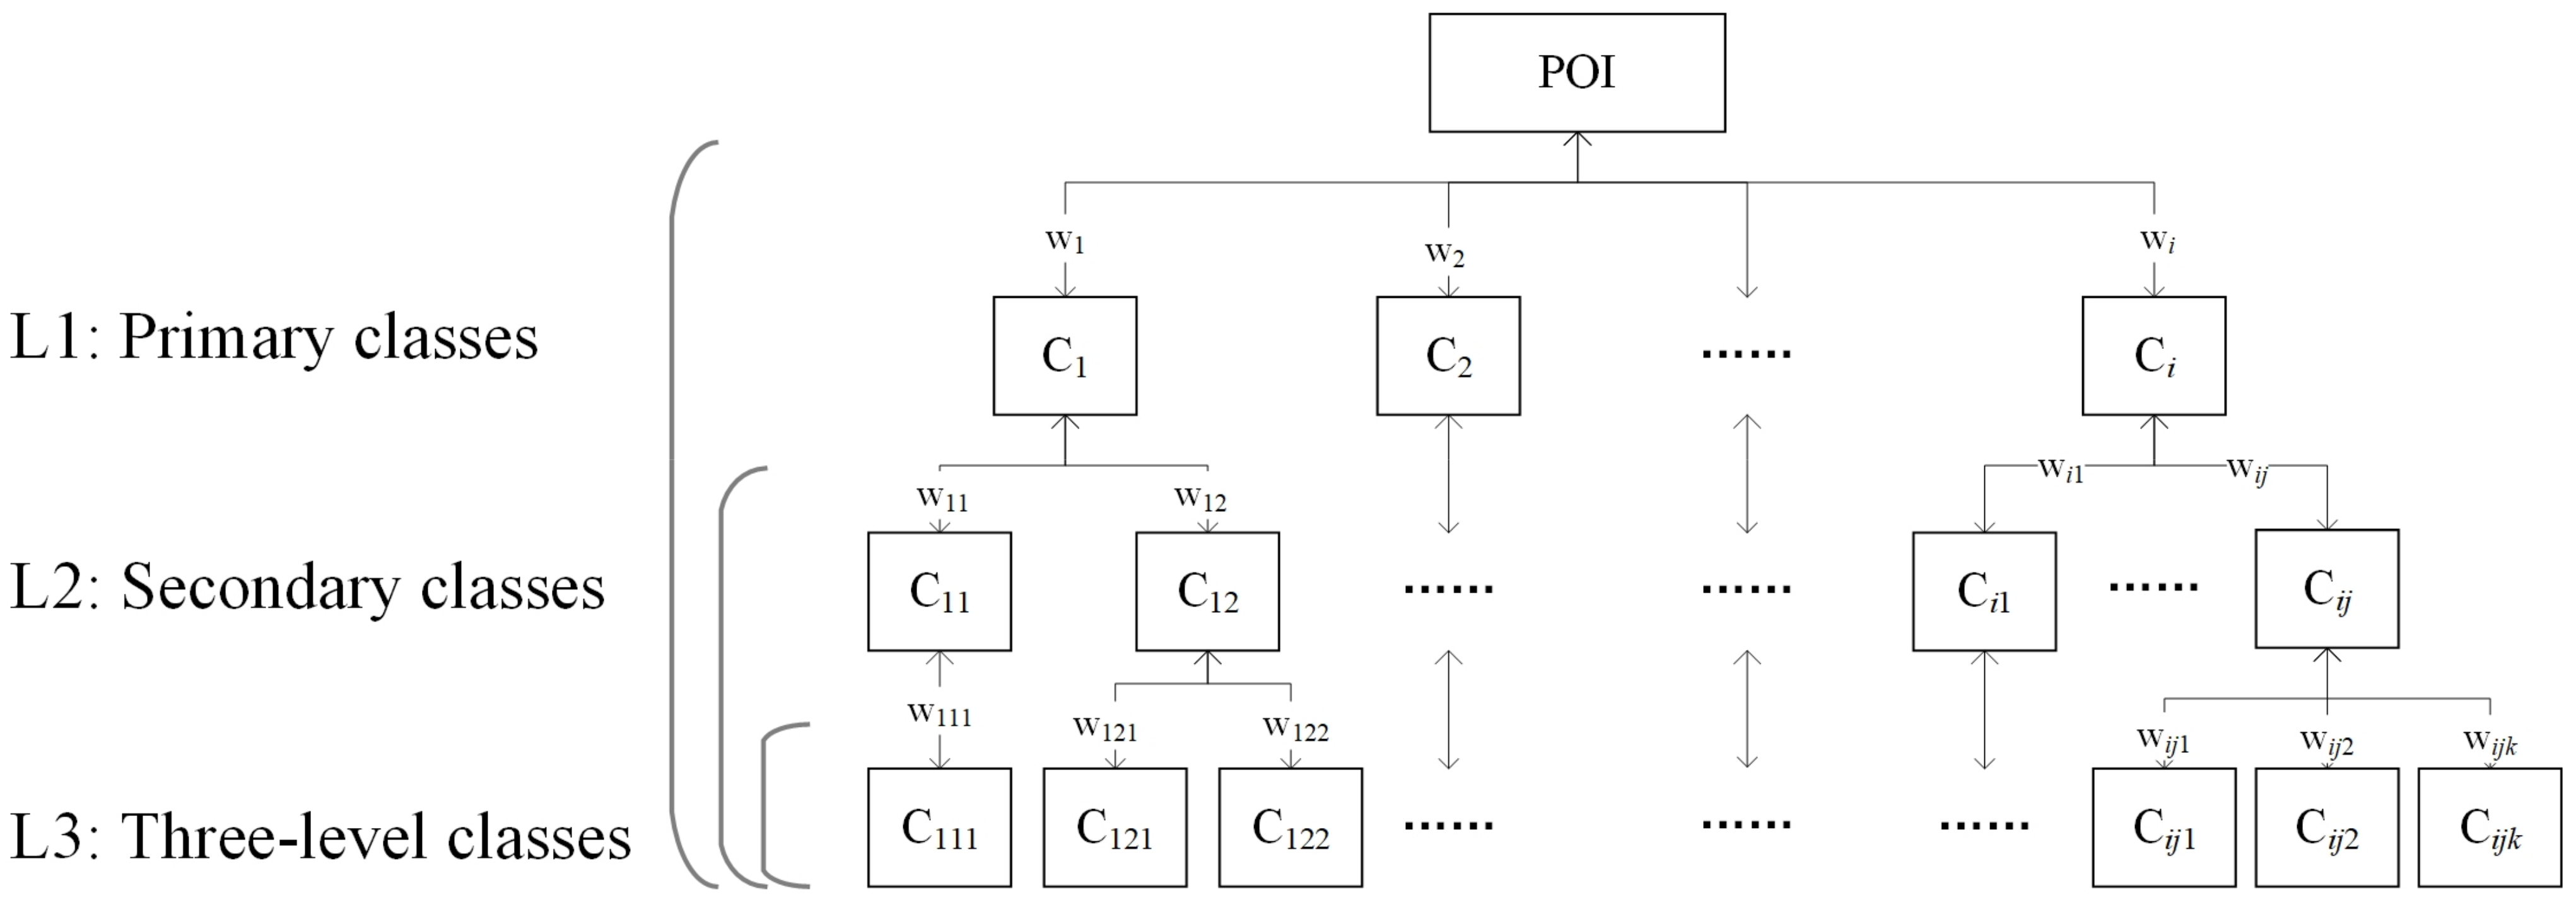
3.2. Hierarchical Weighted Clustering Model
3.3. Weighting Coefficients and Construct Eigenmatrix
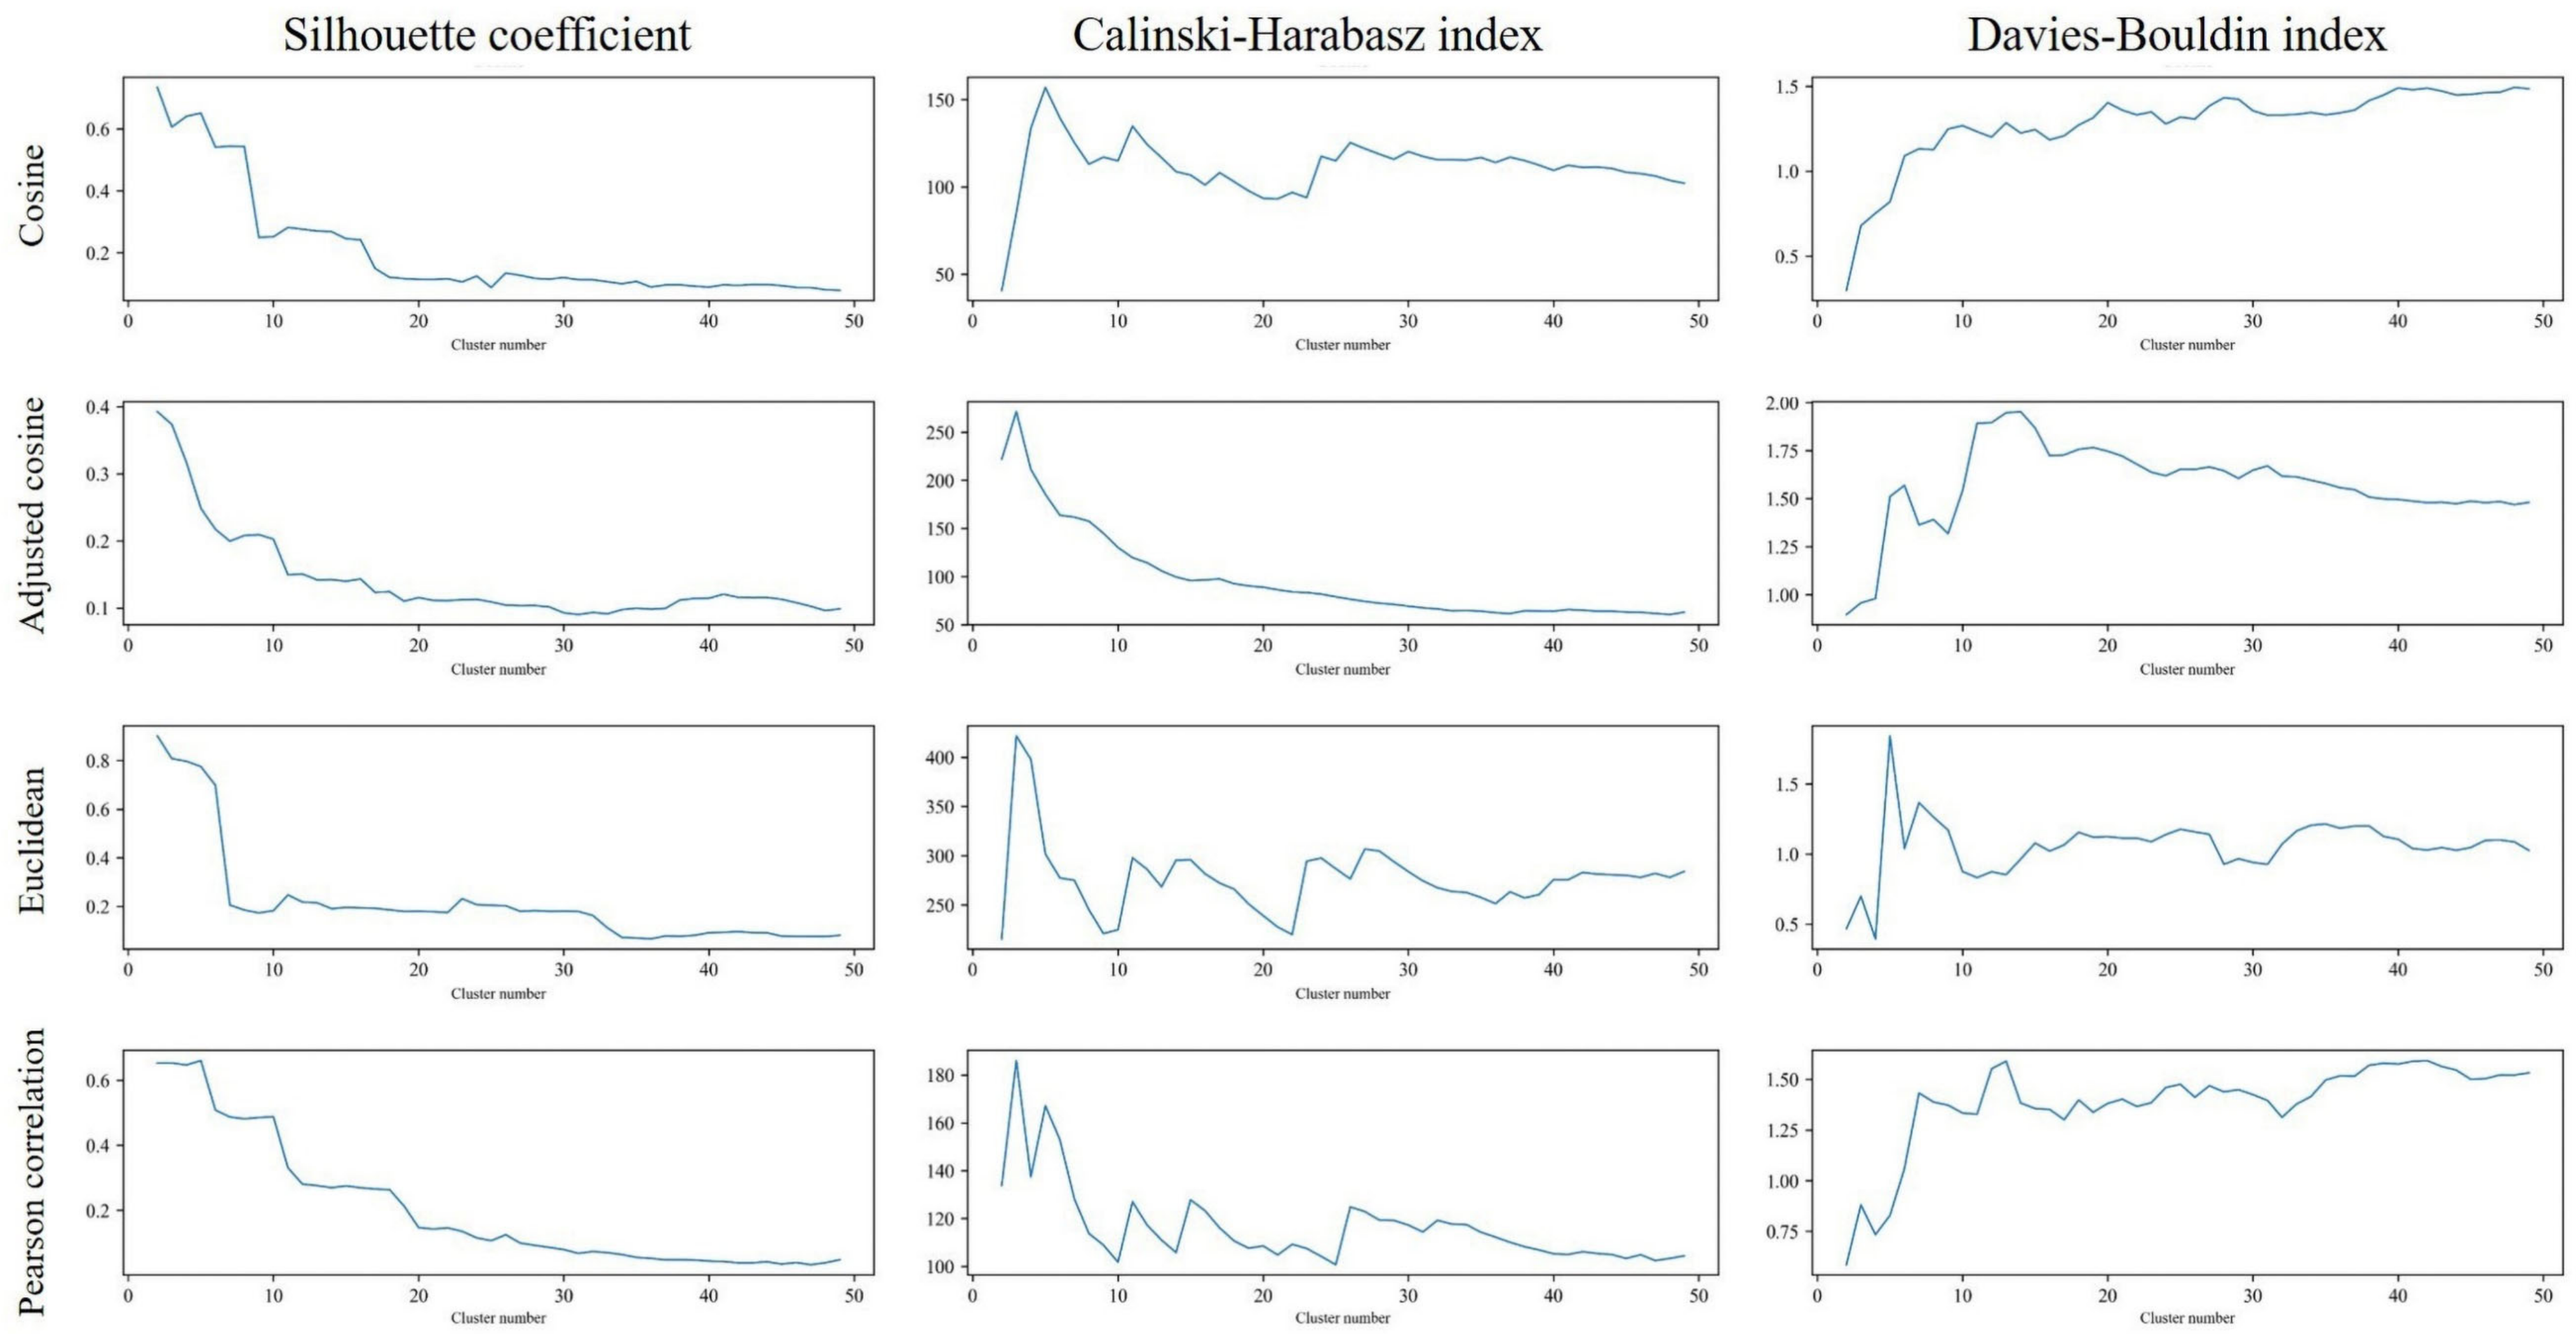
3.4. Evaluation of Clustering Performance
4. Results
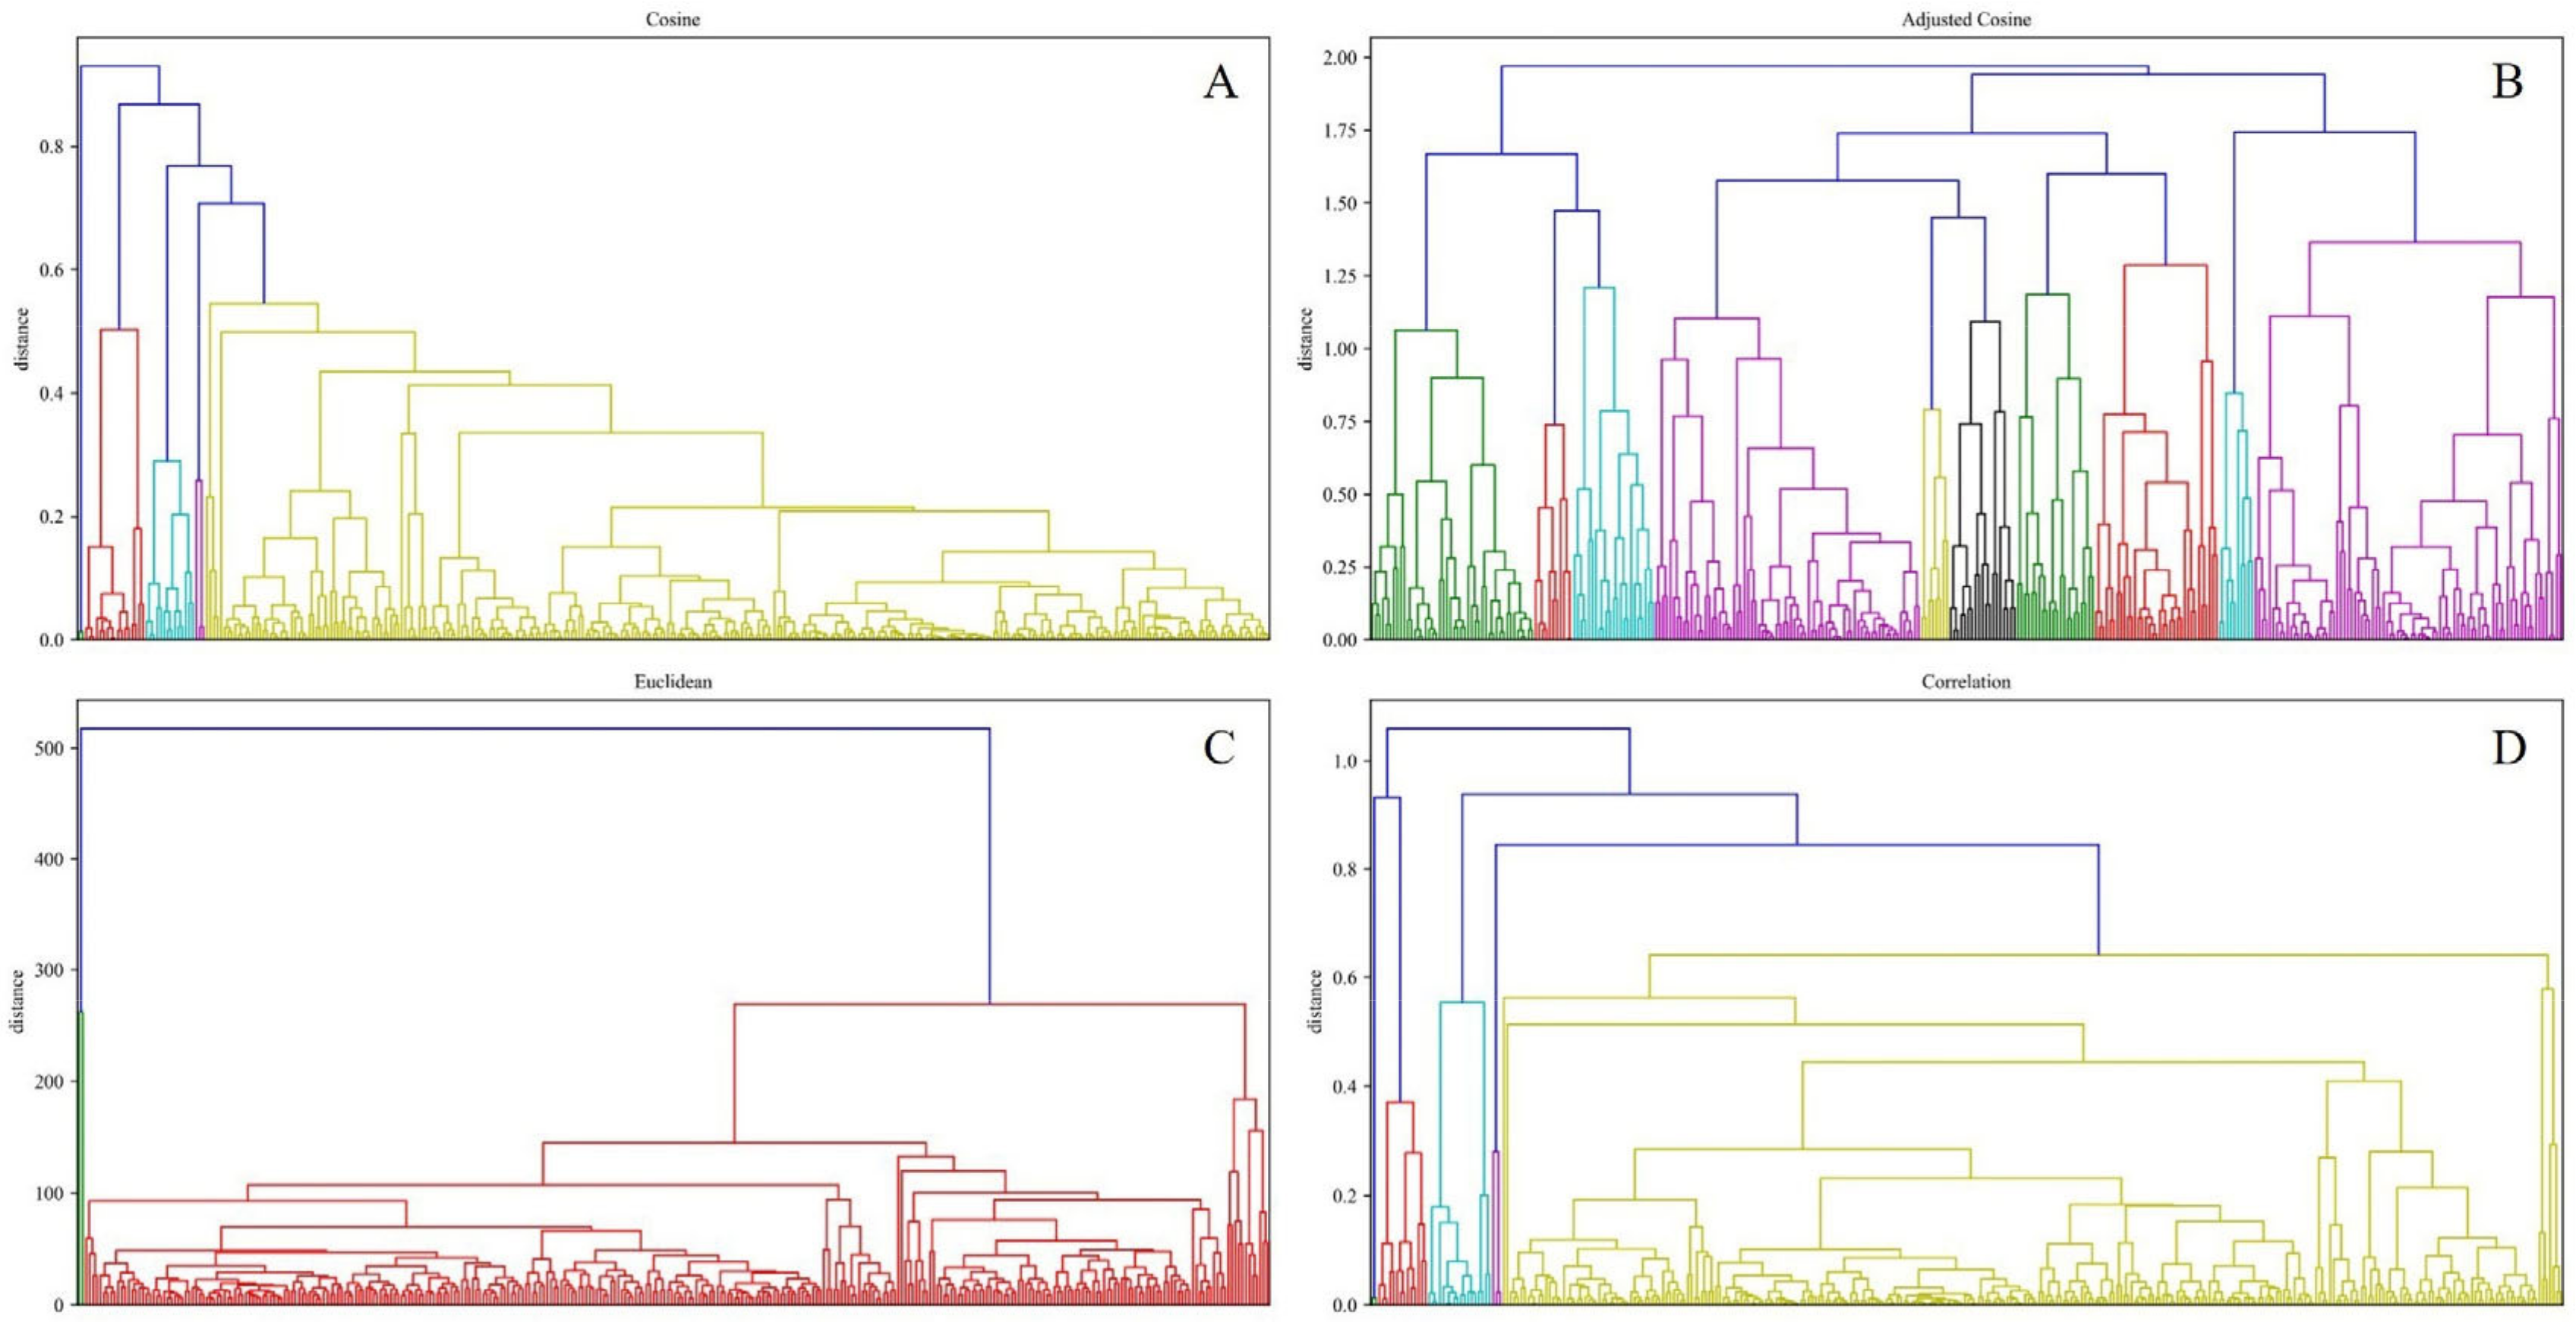
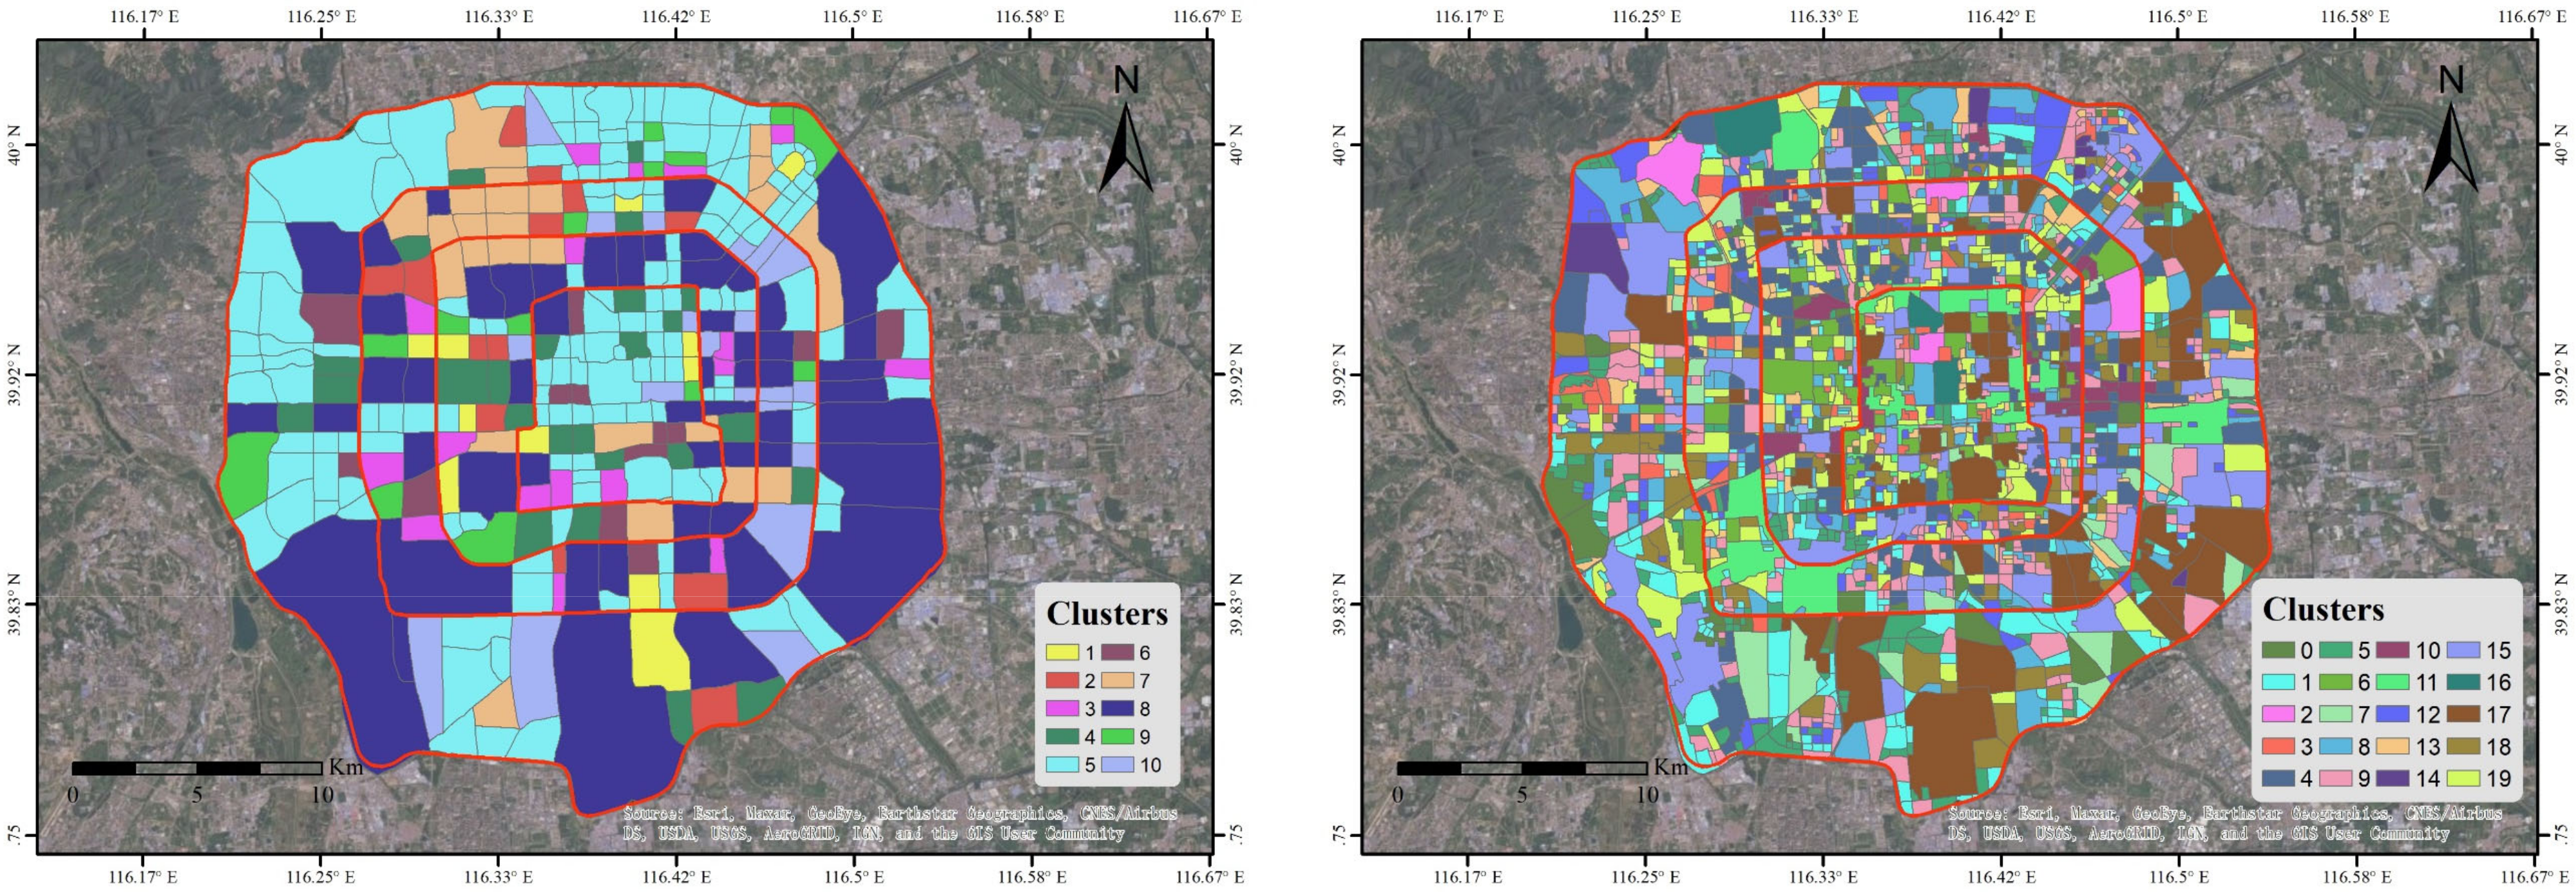
4.1. The Best Cluster Model Parameters and Strategies
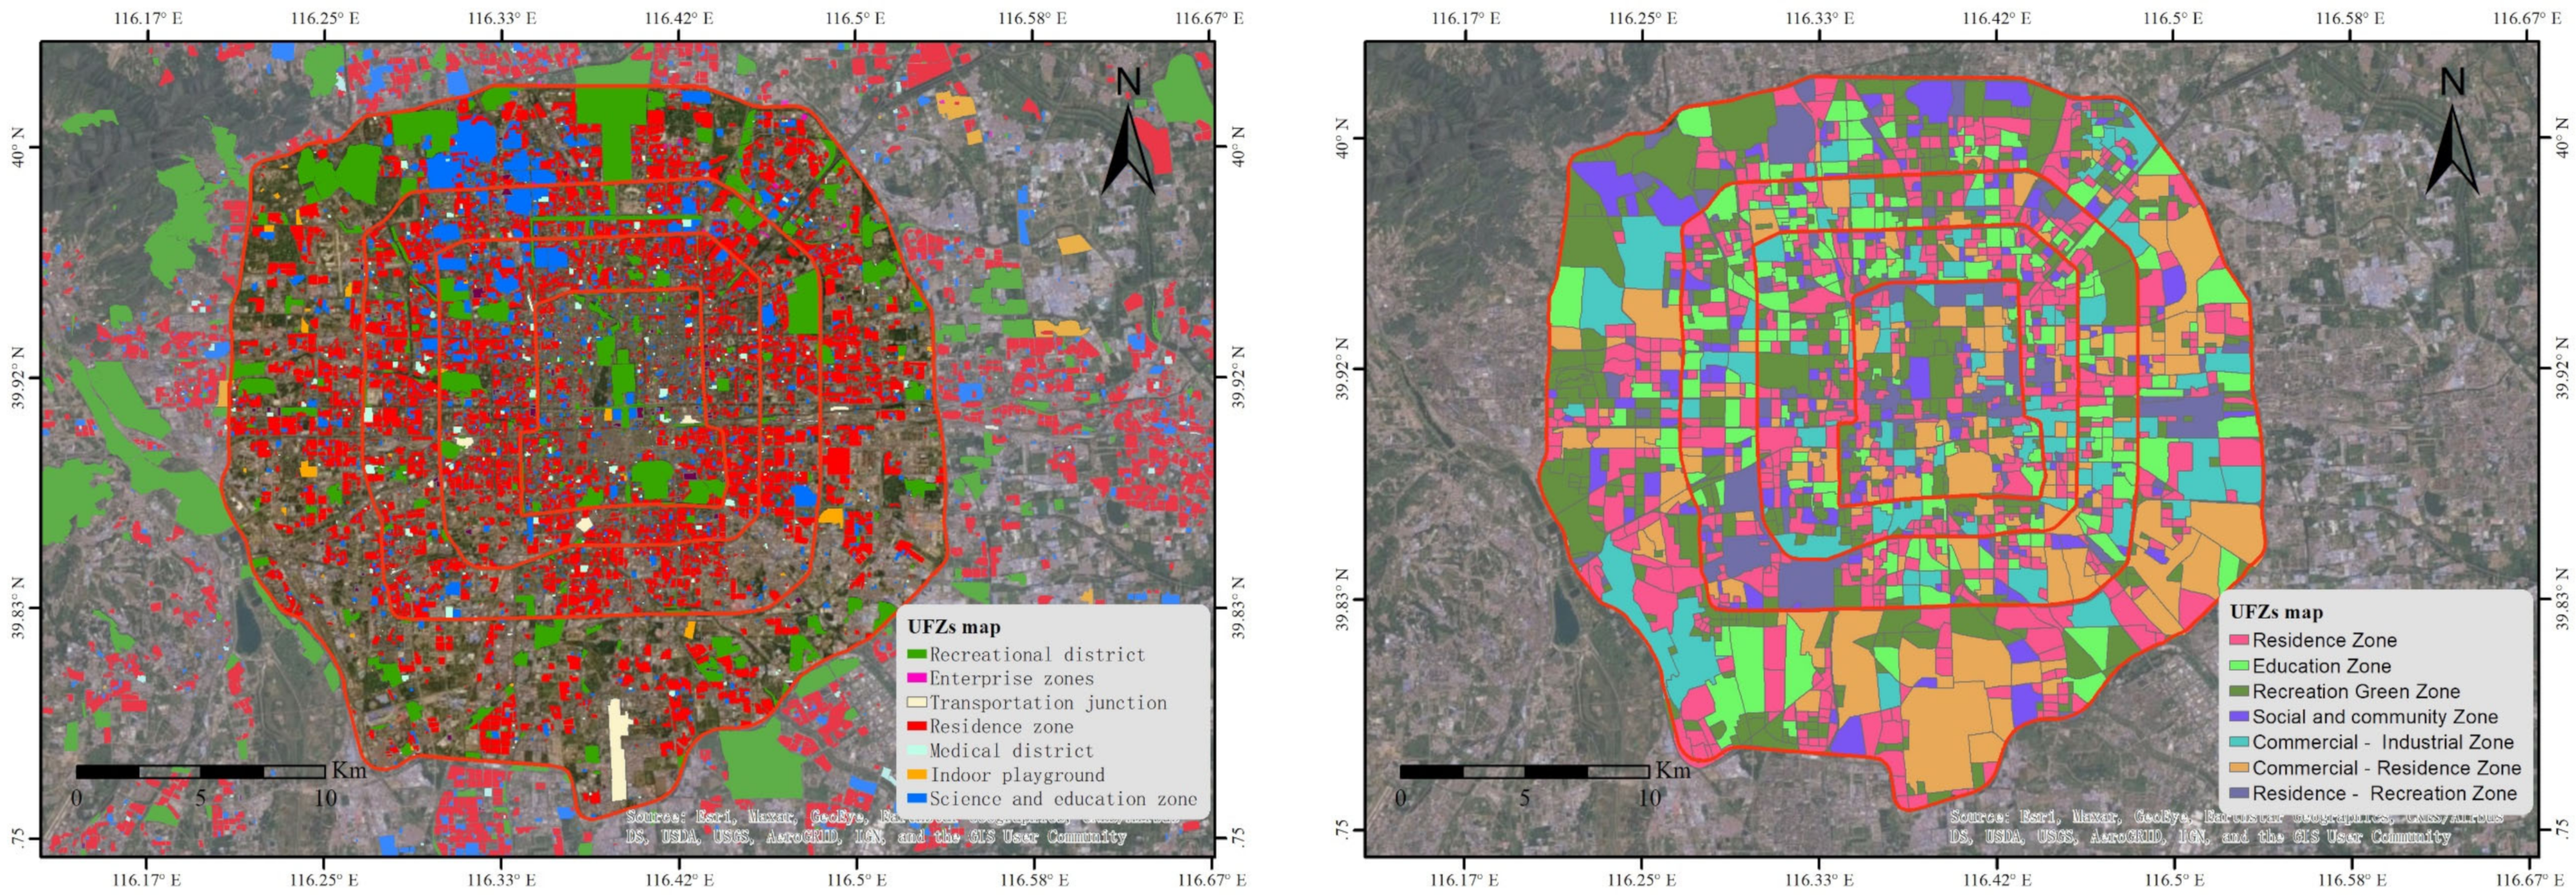
4.2. Spatial Patterns of UFZs
5. Discussion
5.1. Methodological Advantages and Limitations
5.2. Application for Sustainable Urban Planning
6. Conclusions
Author Contributions
Funding
Institutional Review Board Statement
Informed Consent Statement
Data Availability Statement
Acknowledgments
Conflicts of Interest
References
- Lu, Y.; Nakicenovic, N.; Visbeck, M.; Stevance, A.-S. Policy: Five priorities for the UN Sustainable Development Goals. Nature 2015, 520, 432–433. [Google Scholar] [CrossRef] [PubMed] [Green Version]
- Zhang, N.; Zhang, J.; Chen, W.; Su, J. Block-based variations in the impact of characteristics of urban functional zones on the urban heat island effect: A case study of Beijing. Sustain. Cities Soc. 2021, 76, 103529. [Google Scholar] [CrossRef]
- Zhang, X.; Du, S.; Wang, Q. Hierarchical semantic cognition for urban functional zones with VHR satellite images and POI data. ISPRS J. Photogramm. Remote Sens. 2017, 132, 170–184. [Google Scholar] [CrossRef]
- Hu, T.; Yang, J.; Li, X.; Gong, P. Mapping Urban Land Use by Using Landsat Images and Open Social Data. Remote Sens. 2016, 8, 151. [Google Scholar] [CrossRef]
- Yuan, N.J.; Zheng, Y.; Xie, X. Discovering Functional Zones in a City Using Human Movements and Points of Interest; Springer Science and Business Media LLC: Berlin/Heidelberg, Germany, 2017; pp. 33–62. [Google Scholar] [CrossRef]
- Zhang, X.; Du, S. A Linear Dirichlet Mixture Model for decomposing scenes: Application to analyzing urban functional zonings. Remote Sens. Environ. 2015, 169, 37–49. [Google Scholar] [CrossRef]
- Pouyat, R.V.; Trammell, T.L.E. Chapter 10—Climate change and urban forest soils. In Developments in Soil Science; Elsevier: Amsterdam, The Netherlands, 2019; pp. 189–211. [Google Scholar] [CrossRef]
- United Nations Department of Economic and Social Affairs. World Population Prospects: The 2017 Revision, Key Findings and Advance Tables; United Nations Department of Economic and Social Affairs: New York, NY, USA, 2017. [Google Scholar]
- Li, C.; Liu, M.; Hu, Y.; Shi, T.; Qu, X.; Walter, M.T. Effects of urbanization on direct runoff characteristics in urban functional zones. Sci. Total Environ. 2018, 643, 301–311. [Google Scholar] [CrossRef]
- Güneralp, B.; Reba, M.; Hales, B.U.; Wentz, E.A.; Seto, K.C. Trends in urban land expansion, density, and land transitions from 1970 to 2010: A global synthesis. Environ. Res. Lett. 2020, 15, 044015. [Google Scholar] [CrossRef]
- Antrop, M. Landscape change and the urbanization process in Europe. Landsc. Urban Plan. 2004, 67, 9–26. [Google Scholar] [CrossRef]
- Gomes, S.L.; Hermans, L.M. Institutional function and urbanization in Bangladesh: How peri-urban communities respond to changing environments. Land Use Policy 2018, 79, 932–941. [Google Scholar] [CrossRef]
- Peng, J.; Tian, L.; Liu, Y.; Zhao, M.; Hu, Y.; Wu, J. Ecosystem services response to urbanization in metropolitan areas: Thresholds identification. Sci. Total Environ. 2017, 607–608, 706–714. [Google Scholar] [CrossRef]
- Du, S.; Du, S.; Liu, B.; Zhang, X. Context-Enabled Extraction of Large-Scale Urban Functional Zones from Very-High-Resolution Images: A Multiscale Segmentation Approach. Remote Sens. 2019, 11, 1902. [Google Scholar] [CrossRef] [Green Version]
- Yu, Z.; Jing, Y.; Yang, G.; Sun, R. A New Urban Functional Zone-Based Climate Zoning System for Urban Temperature Study. Remote Sens. 2021, 13, 251. [Google Scholar] [CrossRef]
- Huang, X.; Wang, Y. Investigating the effects of 3D urban morphology on the surface urban heat island effect in urban functional zones by using high-resolution remote sensing data: A case study of Wuhan, Central China. ISPRS J. Photogramm. Remote Sens. 2019, 152, 119–131. [Google Scholar] [CrossRef]
- Sun, R.; Lü, Y.; Chen, L.; Yang, L.; Chen, A. Assessing the stability of annual temperatures for different urban functional zones. Build. Environ. 2013, 65, 90–98. [Google Scholar] [CrossRef]
- Peng, J.; Xie, P.; Liu, Y.; Ma, J. Urban thermal environment dynamics and associated landscape pattern factors: A case study in the Beijing metropolitan region. Remote Sens. Environ. 2016, 173, 145–155. [Google Scholar] [CrossRef]
- Yao, L.; Wei, W.; Yu, Y.; Xiao, J.; Chen, L. Rainfall-runoff risk characteristics of urban function zones in Beijing using the SCS-CN model. J. Geogr. Sci. 2018, 28, 656–668. [Google Scholar] [CrossRef]
- Ge, M.; Fang, S.; Gong, Y.; Tao, P.; Yang, G.; Gong, W. Understanding the Correlation between Landscape Pattern and Vertical Urban Volume by Time-Series Remote Sensing Data: A Case Study of Melbourne. ISPRS Int. J. Geo Inf. 2021, 10, 14. [Google Scholar] [CrossRef]
- Su, M.; Zheng, Y.; Hao, Y.; Chen, Q.; Chen, S.; Chen, Z.; Xie, H. The influence of landscape pattern on the risk of urban water-logging and flood disaster. Ecol. Indic. 2018, 92, 133–140. [Google Scholar] [CrossRef]
- Hou, L.; Wu, F.; Xie, X. The spatial characteristics and relationships between landscape pattern and ecosystem service value along an urban-rural gradient in Xi’an city, China. Ecol. Indic. 2020, 108, 105720. [Google Scholar] [CrossRef]
- Gao, J.; Yu, Z.; Wang, L.; Vejre, H. Suitability of regional development based on ecosystem service benefits and losses: A case study of the Yangtze River Delta urban agglomeration, China. Ecol. Indic. 2019, 107, 105579. [Google Scholar] [CrossRef]
- Zhang, H.; Jing, X.-M.; Chen, J.-Y.; Li, J.-J.; Schwegler, B. Characterizing Urban Fabric Properties and Their Thermal Effect Using QuickBird Image and Landsat 8 Thermal Infrared (TIR) Data: The Case of Downtown Shanghai, China. Remote Sens. 2016, 8, 541. [Google Scholar] [CrossRef] [Green Version]
- Guyot, M.; Araldi, A.; Fusco, G.; Thomas, I. The urban form of Brussels from the street perspective: The role of vegetation in the definition of the urban fabric. Landsc. Urban Plan. 2021, 205, 103947. [Google Scholar] [CrossRef]
- Pickett, S.T.A.; Cadenasso, M.L. Linking ecological and built components of urban mosaics: An open cycle of ecological design. J. Ecol. 2007, 96, 8–12. [Google Scholar] [CrossRef]
- Qian, Y.; Zhou, W.; Pickett, S.T.A.; Yu, W.; Xiong, D.; Wang, W.; Jing, C. Integrating structure and function: Mapping the hierarchical spatial heterogeneity of urban landscapes. Ecol. Process. 2020, 9, 59. [Google Scholar] [CrossRef]
- Herrick, J.E.; Schuman, G.E.; Rango, A. Monitoring ecological processes for restoration projects. J. Nat. Conserv. 2006, 14, 161–171. [Google Scholar] [CrossRef]
- Shackelford, A.; Davis, C. A combined fuzzy pixel-based and object-based approach for classification of high-resolution multispectral data over urban areas. IEEE Trans. Geosci. Remote Sens. 2003, 41, 2354–2364. [Google Scholar] [CrossRef] [Green Version]
- Cleve, C.; Kelly, M.; Kearns, F.R.; Moritz, M. Classification of the wildland–urban interface: A comparison of pixel- and object-based classifications using high-resolution aerial photography. Comput. Environ. Urban Syst. 2008, 32, 317–326. [Google Scholar] [CrossRef]
- Ye, S.; Pontius, R.G., Jr.; Rakshit, R. A review of accuracy assessment for object-based image analysis: From per-pixel to per-polygon approaches. ISPRS J. Photogramm. Remote Sens. 2018, 141, 137–147. [Google Scholar] [CrossRef]
- Li, T.; Cao, J.; Xu, M.; Wu, Q.; Yao, L. The influence of urban spatial pattern on land surface temperature for different functional zones. Landsc. Ecol. Eng. 2020, 16, 249–262. [Google Scholar] [CrossRef]
- Lan, T.; Shao, G.; Xu, Z.; Tang, L.; Sun, L. Measuring urban compactness based on functional characterization and human activity intensity by integrating multiple geospatial data sources. Ecol. Indic. 2021, 121, 107177. [Google Scholar] [CrossRef]
- Xu, N.; Luo, J.; Wu, T.; Dong, W.; Liu, W.; Zhou, N. Identification and Portrait of Urban Functional Zones Based on Multisource Heterogeneous Data and Ensemble Learning. Remote Sens. 2021, 13, 373. [Google Scholar] [CrossRef]
- Yuan, N.J.; Zheng, Y.; Xie, X.; Wang, Y.; Zheng, K.; Xiong, H. Discovering Urban Functional Zones Using Latent Activity Trajectories. IEEE Trans. Knowl. Data Eng. 2015, 27, 712–725. [Google Scholar] [CrossRef]
- Song, J.; Tong, X.; Wang, L.; Zhao, C.; Prishchepov, A. Monitoring finer-scale population density in urban functional zones: A remote sensing data fusion approach. Landsc. Urban Plan. 2019, 190, 103580. [Google Scholar] [CrossRef]
- Tu, W.; Hu, Z.; Li, L.; Cao, J.; Jiang, J.; Li, Q.; Li, Q. Portraying Urban Functional Zones by Coupling Remote Sensing Imagery and Human Sensing Data. Remote Sens. 2018, 10, 141. [Google Scholar] [CrossRef] [Green Version]
- Feng, Y.; Du, S.; Myint, S.W.; Shu, M. Do Urban Functional Zones Affect Land Surface Temperature Differently? A Case Study of Beijing, China. Remote Sens. 2019, 11, 1802. [Google Scholar] [CrossRef] [Green Version]
- Zimmerbauer, K.; Paasi, A. Hard work with soft spaces (and vice versa): Problematizing the transforming planning spaces. Eur. Plan. Stud. 2020, 28, 771–789. [Google Scholar] [CrossRef]
- Yuan, J.; Zheng, Y.; Xie, X. Discovering Regions of Different Functions in a City Using Human Mobility and POIs. In Proceedings of the 18th ACM SIGKDD International Conference on Knowledge Discovery and Data Mining, Beijing, China, 12–16 August 2012; pp. 186–194. [Google Scholar]
- Yao, Y.; Li, X.; Liu, X.; Liu, P.; Liang, Z.; Zhang, J.; Mai, K. Sensing spatial distribution of urban land use by integrating points-of-interest and Google Word2Vec model. Int. J. Geogr. Inf. Sci. 2017, 31, 825–848. [Google Scholar] [CrossRef]
- Qian, Z.; Liu, X.; Tao, F.; Zhou, T. Identification of Urban Functional Areas by Coupling Satellite Images and Taxi GPS Trajectories. Remote Sens. 2020, 12, 2449. [Google Scholar] [CrossRef]
- Song, J.; Lin, T.; Li, X.; Prishchepov, A.V. Mapping Urban Functional Zones by Integrating Very High Spatial Resolution Remote Sensing Imagery and Points of Interest: A Case Study of Xiamen, China. Remote Sens. 2018, 10, 1737. [Google Scholar] [CrossRef] [Green Version]
- Iranmanesh, A.; Atun, R.A. Reading the urban socio-spatial network through space syntax and geo-tagged Twitter data. J. Urban Des. 2020, 25, 738–757. [Google Scholar] [CrossRef]
- Alhawarat, M.; Hegazi, M. Revisiting K-Means and Topic Modeling, a Comparison Study to Cluster Arabic Documents. IEEE Access 2018, 6, 42740–42749. [Google Scholar] [CrossRef]
- Hofmann, T. Probabilistic Latent Semantic Indexing. ACM SIGIR Forum 2017, 51, 211–218. [Google Scholar] [CrossRef]
- Kisilevich, S.; Mansmann, F.; Nanni, M.; Rinzivillo, S. Data Mining and Knowledge Discovery Handbook; Springer: Boston, MA, USA, 2010. [Google Scholar]
- Lu, Y.; Wan, Y. PHA: A fast potential-based hierarchical agglomerative clustering method. Pattern Recognit. 2013, 46, 1227–1239. [Google Scholar] [CrossRef]
- Gong, P.; Chen, B.; Li, X.; Liu, H.; Wang, J.; Bai, Y.; Chen, J.; Chen, X.; Fang, L.; Feng, S.; et al. Mapping essential urban land use categories in China (EULUC-China): Preliminary results for 2018. Sci. Bull. 2019, 65, 182–187. [Google Scholar] [CrossRef] [Green Version]
- Delgado, A.; Romero, I. Environmental conflict analysis using an integrated grey clustering and entropy-weight method: A case study of a mining project in Peru. Environ. Model. Softw. 2016, 77, 108–121. [Google Scholar] [CrossRef]
- Wang, Y.; Gu, Y.; Dou, M.; Qiao, M. Using Spatial Semantics and Interactions to Identify Urban Functional Regions. ISPRS Int. J. Geo Inf. 2018, 7, 130. [Google Scholar] [CrossRef] [Green Version]
- Lessig, V.P. Comparing cluster analyses with cophenetic correlation. J. Mark. Res. 1972, 9, 82–84. [Google Scholar] [CrossRef]
- Saraçli, S.; Doğan, N.; Doğan, I. Comparison of hierarchical cluster analysis methods by cophenetic correlation. J. Inequalities Appl. 2013, 2013, 203. [Google Scholar] [CrossRef]
- Pedregosa, F.; Varoquaux, G.; Gramfort, A.; Michel, V.; Thirion, B.; Grisel, O.; Blondel, M.; Prettenhofer, P.; Weiss, R.; Dubourg, V.; et al. Scikit-learn: Machine learning in Python. J. Mach. Learn. Res. 2011, 12, 2825–2830. [Google Scholar]
- Contreras-Vidal, J.L.; Kerick, S.E. Independent component analysis of dynamic brain responses during visuomotor adaptation. NeuroImage 2004, 21, 936–945. [Google Scholar] [CrossRef]
- Liu, X.; Long, Y. Automated identification and characterization of parcels with OpenStreetMap and points of interest. Environ. Plan. B Plan. Des. 2015, 43, 341–360. [Google Scholar] [CrossRef]
- Klamerus-Iwan, A.; Błońska, E.; Lasota, J.; Waligórski, P.; Kalandyk, A. Seasonal variability of leaf water capacity and wettability under the influence of pollution in different city zones. Atmos. Pollut. Res. 2018, 9, 455–463. [Google Scholar] [CrossRef]
- Wu, C.; Hu, T.J.; Wang, X.F.; Zheng, C. Study on the Functional Zones Layout of Fresh Food Distribution Center Based on the SLP Method. Adv. Mater. Res. 2013, 694, 3614–3617. [Google Scholar] [CrossRef]
- Gao, S.; Janowicz, K.; Couclelis, H. Extracting urban functional regions from points of interest and human activities on location-based social networks. Trans. GIS 2017, 21, 446–467. [Google Scholar] [CrossRef]


| ID | Primary Classification | Counts | Proportion |
|---|---|---|---|
| 1 | Accommodation Service | 10,731 | 1.9% |
| 2 | Auto Dealers | 780 | 0.1% |
| 3 | Auto Repair | 2040 | 0.4% |
| 4 | Auto Service | 7293 | 1.3% |
| 5 | Commercial House | 21,483 | 3.7% |
| 6 | Daily Life Service | 70,141 | 12.2% |
| 7 | Enterprises | 66,689 | 11.6% |
| 8 | Finance and Insurance Service | 13,965 | 2.4% |
| 9 | Food and Beverages | 52,961 | 9.2% |
| 10 | Governmental Organization and Social Group | 24,429 | 4.2% |
| 11 | Medical Service | 12,574 | 2.2% |
| 12 | Motorcycle Service | 321 | 0.1% |
| 13 | Place Name and Address | 86,802 | 15.1% |
| 14 | Public Facility | 11,331 | 2.0% |
| 15 | Road Furniture | 1894 | 0.3% |
| 16 | Science/Culture and Education Service | 34,578 | 6.0% |
| 17 | Shopping | 95,629 | 16.6% |
| 18 | Sports and Recreation | 12,518 | 2.2% |
| 19 | Tourist Attraction | 3475 | 0.6% |
| 20 | Transportation Service | 46,135 | 8.0% |
| Total | 575,769 | 100.0% |
| Distance metric | Clustering Merge Strategies | The Cophenetic Correlation Coefficient | |||||||||||||||||
|---|---|---|---|---|---|---|---|---|---|---|---|---|---|---|---|---|---|---|---|
| Weighted POI Data | Raw POI Data | ||||||||||||||||||
| n = 5 | n = 20 | n = 30 | n = 5 | n = 20 | n =30 | ||||||||||||||
| Level 1 | Level 2 | Level 3 | Level 1 | Level 2 | Level 3 | Level 1 | Level 2 | Level 3 | Level 1 | Level 2 | Level 3 | Level 1 | Level 2 | Level 3 | Level 1 | Level 2 | Level 3 | ||
| Cosine | Single | 0.747 | 0.924 * | −0.52 | 0.301 | 0.919 | 0.357 | 0.535 | 0.764 * | 0.367 | 0.9307 * | 0.556 | −0.52 | 0.8218 * | 0.708 * | 0.357 | 0.367 | 0.61 | 0.367 |
| Complete | −0.73 | 0.86 * | 0.831* | −0.11 | 0.641 | 0.368 | 0.57 | 0.595 | 0.445 | -0.0946 | 0.806 | 0.831 | 0.33202 | 0.616 | 0.368 | 0.445 | 0.656 | 0.445 | |
| Average | 0.699 * | 0.913 * | −0.36 | 0.364 | 0.773 * | 0.549 * | 0.679 * | 0.705 * | 0.536 | 0.33557 | −0.2 | −0.36 | 0.57631 | 0.55 | 0.549 | 0.536 | 0.658 | 0.536 | |
| Centroid | 0.757 * | 0.913 * | 0.831 * | 0.364 | 0.944 * | 0.883 * | 0.676 * | 0.837 * | 0.818 * | 0.8371 * | 0.87 * | 0.831 * | 0.80752 | 0.7 | 0.883 | 0.818 | 0.723 | 0.818 | |
| Weighted | 0.53 | 0.913 * | 0.831 * | 0.426 | 0.96 | 0.712 | 0.421 | 0.718 | 0.637 | 0.35358 | 0.074 | 0.831 | 0.53215 | 0.37 | 0.712 | 0.637 | 0.253 | 0.637 | |
| Ward | 0.304 | 0.913 * | −0.54 | 0.642 | 0.67 | 0.308 | 0.549 | 0.451 | 0.322 | 0.27489 | 0.855 * | −0.54 | 0.542 | 0.716 | 0.308 | 0.322 | 0.634 | 0.322 | |
| The adjusted cosine | Single | 0.99 * | 0.372 | −0.11 | 0.408 | 0.251 | −0.19 | 0.567 | 0.619 | 0.25 | 0.45064 | 0.468 | −0.11 | −0.047 | −0.23 | −0.19 | 0.25 | 0.354 | 0.25 |
| Complete | 0.167 | 0.931 * | 0.891 * | 0.655 | 0.636 | 0.579 | 0.7 * | 0.858 * | 0.799 * | 0.8870 * | 0.923 * | 0.891 * | 0.39934 | 0.514 | 0.579 | 0.799 * | 0.597 | 0.799 * | |
| Average | 0.464 | 0.941 * | 0.858 * | 0.888 * | 0.852 * | 0.418 | 0.878 * | 0.929 * | 0.758 * | 0.9219 * | 0.689 | 0.858 * | 0.61531 | 0.326 | 0.418 | 0.758 * | 0.714 * | 0.758 * | |
| Centroid | 0.988 * | 0.912 * | 0.86 * | 0.536 | 0.801 * | 0.492 | 0.647 | 0.923 * | 0.763 * | 0.8988 * | 0.656 | 0.86 | 0.62657 | 0.408 | 0.492 | 0.763 * | 0.733 * | 0.763 * | |
| Weighted | 0.686 | 0.942 * | 0.56 | 0.194 | 0.529 | 0.121 | 0.527 | 0.788 * | 0.677 | 0.8746 * | 0.893 * | 0.56 | 0.7766 * | 0.414 | 0.121 | 0.677 | 0.69 | 0.677 | |
| Ward | 0.167 | 0.816 * | 0.891 * | 0.909 * | 0.747 * | 0.673 * | 0.912 * | 0.894 * | 0.775 * | 0.9213 * | 0.672 | 0.891 * | 0.8195 * | 0.055 | 0.673 | 0.775 * | 0.479 | 0.775 * | |
| Euclidean | Single | 0.35 | 0.788 * | −0.37 | 0.933 | 0.626 | 0.013 | 0.93 * | 0.77 * | 0.341 | 0.03316 | −0.08 | −0.37 | 0.28802 | 0.127 | 0.013 | 0.341 | 0.433 | 0.341 |
| Complete | −0.73 | 0.694 * | 0.767 * | 0.893 | 0.641 * | 0.459 | 0.87 * | 0.737 * | 0.641 | 0.07976 | 0.13 | 0.767 | 0.54407 | 0.576 | 0.459 | 0.641 | 0.594 | 0.641 | |
| Average | 0.44 | 0.721 * | 0.747 * | 0.945 * | 0.646 * | 0.402 | 0.926 * | 0.758 * | 0.663 | 0.26314 | 0.557 | 0.747 | 0.39126 | 0.381 | 0.402 | 0.663 | 0.492 | 0.663 | |
| Centroid | −0.03 | 0.933 * | 0.767 * | 0.952 * | 0.608 * | 0.363 | 0.901 * | 0.767 * | 0.661 | 0.4001 | 0.557 | 0.767 | 0.26312 | 0.371 | 0.363 | 0.661 | 0.478 | 0.661 | |
| Weighted | 0.395 | −0.06 | 0.767 * | 0.395 | 0.478 | 0.346 | 0.459 | 0.206 | 0.537 | 0.30413 | −0.44 | 0.767 | 0.30992 | 0.127 | 0.346 | 0.537 | 0.358 | 0.537 | |
| Ward | 0.503 | 0.906 * | 0.767 * | 0.929 * | 0.493 | 0.45 | 0.882 * | 0.688 | 0.63 | 0.53289 | 0.738 | 0.767 | 0.4283 | 0.38 | 0.45 | 0.63 | 0.571 | 0.63 | |
| Pearson correlation | Single | 0.803 * | 0.921 * | −0.51 | −0.01 | 0.918 * | 0.351 | 0.164 | 0.763 | 0.358 | 0.9455 * | 0.482 | −0.51 | 0.8374 * | 0.68 | 0.351 | 0.358 | 0.597 | 0.358 |
| Complete | −0.69 | 0.91 * | 0.839 * | 0.198 | 0.74 | 0.629 | 0.194 | 0.636 | 0.549 | 0.6664 | −0.2 | 0.839 | 0.16877 | 0.186 | 0.629 | 0.534 | 0.239 | 0.549 | |
| Average | 0.703 | 0.91 * | −0.36 | 0.117 | 0.932 | 0.546 | 0.363 | 0.811 * | 0.534 | 0.5964 * | −0.2 | −0.36 | 0.71877 | 0.556 | 0.546 | 0.534 | 0.677 | 0.534 | |
| Centroid | 0.177 | 0.91 * | 0.839 * | 0.064 | 0.928 * | 0.886 * | 0.435 | 0.82 * | 0.822 * | 0.8546 * | 0.878 * | 0.839 | 0.66499 | 0.737 | 0.886 * | 0.822 * | 0.709 | 0.822 | |
| Weighted | 0.023 | 0.91 * | 0.839 * | 0.03 | 0.936 * | 0.717 * | 0.179 | 0.789 * | 0.602 | 0.79478 | 0.749 | 0.839 | 0.47338 | 0.164 | 0.717 | 0.602 | 0.319 | 0.602 | |
| Ward | −0.18 | −0.39 | −0.55 | 0.37 | 0.673 | 0.289 | 0.502 | 0.488 | 0.329 | 0.3717 | 0.749 | −0.55 | 0.58837 | 0.317 | 0.289 | 0.329 | 0.217 | 0.329 | |
Publisher’s Note: MDPI stays neutral with regard to jurisdictional claims in published maps and institutional affiliations. |
© 2022 by the authors. Licensee MDPI, Basel, Switzerland. This article is an open access article distributed under the terms and conditions of the Creative Commons Attribution (CC BY) license (https://creativecommons.org/licenses/by/4.0/).
Share and Cite
Jing, Y.; Sun, R.; Chen, L. A Method for Identifying Urban Functional Zones Based on Landscape Types and Human Activities. Sustainability 2022, 14, 4130. https://doi.org/10.3390/su14074130
Jing Y, Sun R, Chen L. A Method for Identifying Urban Functional Zones Based on Landscape Types and Human Activities. Sustainability. 2022; 14(7):4130. https://doi.org/10.3390/su14074130
Chicago/Turabian StyleJing, Yongcai, Ranhao Sun, and Liding Chen. 2022. "A Method for Identifying Urban Functional Zones Based on Landscape Types and Human Activities" Sustainability 14, no. 7: 4130. https://doi.org/10.3390/su14074130
APA StyleJing, Y., Sun, R., & Chen, L. (2022). A Method for Identifying Urban Functional Zones Based on Landscape Types and Human Activities. Sustainability, 14(7), 4130. https://doi.org/10.3390/su14074130