1. Introduction
In the majority of sub-Saharan African countries, access to water, especially affordable, safe drinking water, is a major challenge. In semi-arid to arid rural areas, such as the Kaokoland in northwestern Namibia, groundwater is the main source of freshwater and is used for domestic and agricultural purposes. Unfortunately, the quality and sustainability of this resource are still uncertain and may be affected by seasonal effects, global climate change and population growth.
In this part of the country, most of the water is abstracted from shallow boreholes (<50 m) and wells. However, a surprisingly high number of springs are emerging at the surface. Some of these springs dry up during the dry season, but the majority remain perennial, sustaining wildlife, livestock and humans.
However, over the past few decades, drought, climate change and/or high groundwater abstraction in the spring catchments have disturbed the balance between recharge and spring discharge. Some perennial springs have become seasonal springs, and some seasonal springs have turned into dry springs [
1]. Groundwater is becoming increasingly exploited, and this resource is becoming vulnerable [
2,
3,
4]. The springs are essential for small local communities, and they represent a simple and affordable resource. However, this resource is replenished by shallow groundwater, making it more vulnerable to contamination, which may have an important impact on human health [
5]. Most of the springs are not captured and do not have any protective measures, e.g., a protection zone, against contamination. Few studies have reported on the contamination of shallow aquifers in these areas. Researchers have outlined that these contaminations could either be bacteriological [
6,
7] or inorganic [
7,
8,
9,
10,
11].
The aim of this study was thus to assess groundwater use and the quality of spring waters used by local communities in northwestern Namibia. To ensure the safety of drinking-water supplies, the World Health Organization (WHO) developed guidelines for drinking water [
12]. The WHO values and recommendations can be adapted in each country, depending on the health and economic conditions, to create national standards. In Namibia, for water to be considered “suitable” for human consumption, it must satisfy certain quality standards developed by the Department of Water Affairs [
13].
Based on these guidelines and standard values, the specific parameters of pH, electrical conductivity, total dissolved solids (TDS), and the major ions calcium, magnesium, potassium, chloride, sulfate, nitrate and fluoride are evaluated to determine if the water is fit for human consumption. These are standard parameters that have been used in several studies from other countries to evaluate groundwater quality [
14,
15,
16].
The Water Quality Index (
WQI) is also used in this work as an alternative way to determine the water quality and determine if it is fit for human consumption. This method, first developed by Horton (1965) [
17], has been commonly used [
15,
16,
18,
19].
Unfortunately, due to the travel restrictions caused by the COVID-19 pandemic, some of the initially scheduled field investigations were canceled. This study does not consider the potential effects of the seasonality on the hydrochemistry of the springs, which could have an impact on the value of the parameters [
7,
15] and the spring discharge flow.
Based on this case study, recommendations have been developed for the sustainable exploitation and protection of springs in Namibia and in other regions that are similar in terms of climate, hydrogeology and land use.
The first section of this manuscript briefly presents the geological and hydro-climatic regional context. It also describes the hydrogeological control of the springs’ occurrence in the study area: northwestern Namibia. The next section develops the materials and methods used for this work. One section is dedicated to a brief overview of the springs’ uses and protection based on field observations. The following section is dedicated to the presentation of the geochemical results, which are based on physico-chemical characteristics. The next section contains the interpretation and discussion of the evaluation of the water quality of the springs in Namibia, with a focus on Kaokoland, northwestern Namibia, to determine potential sources of pollution. The last section is dedicated to recommendations, based on the WHO guidelines for drinking water, to maintain and improve groundwater quality and quantity, and to use this resource sustainably.
2. Study Area
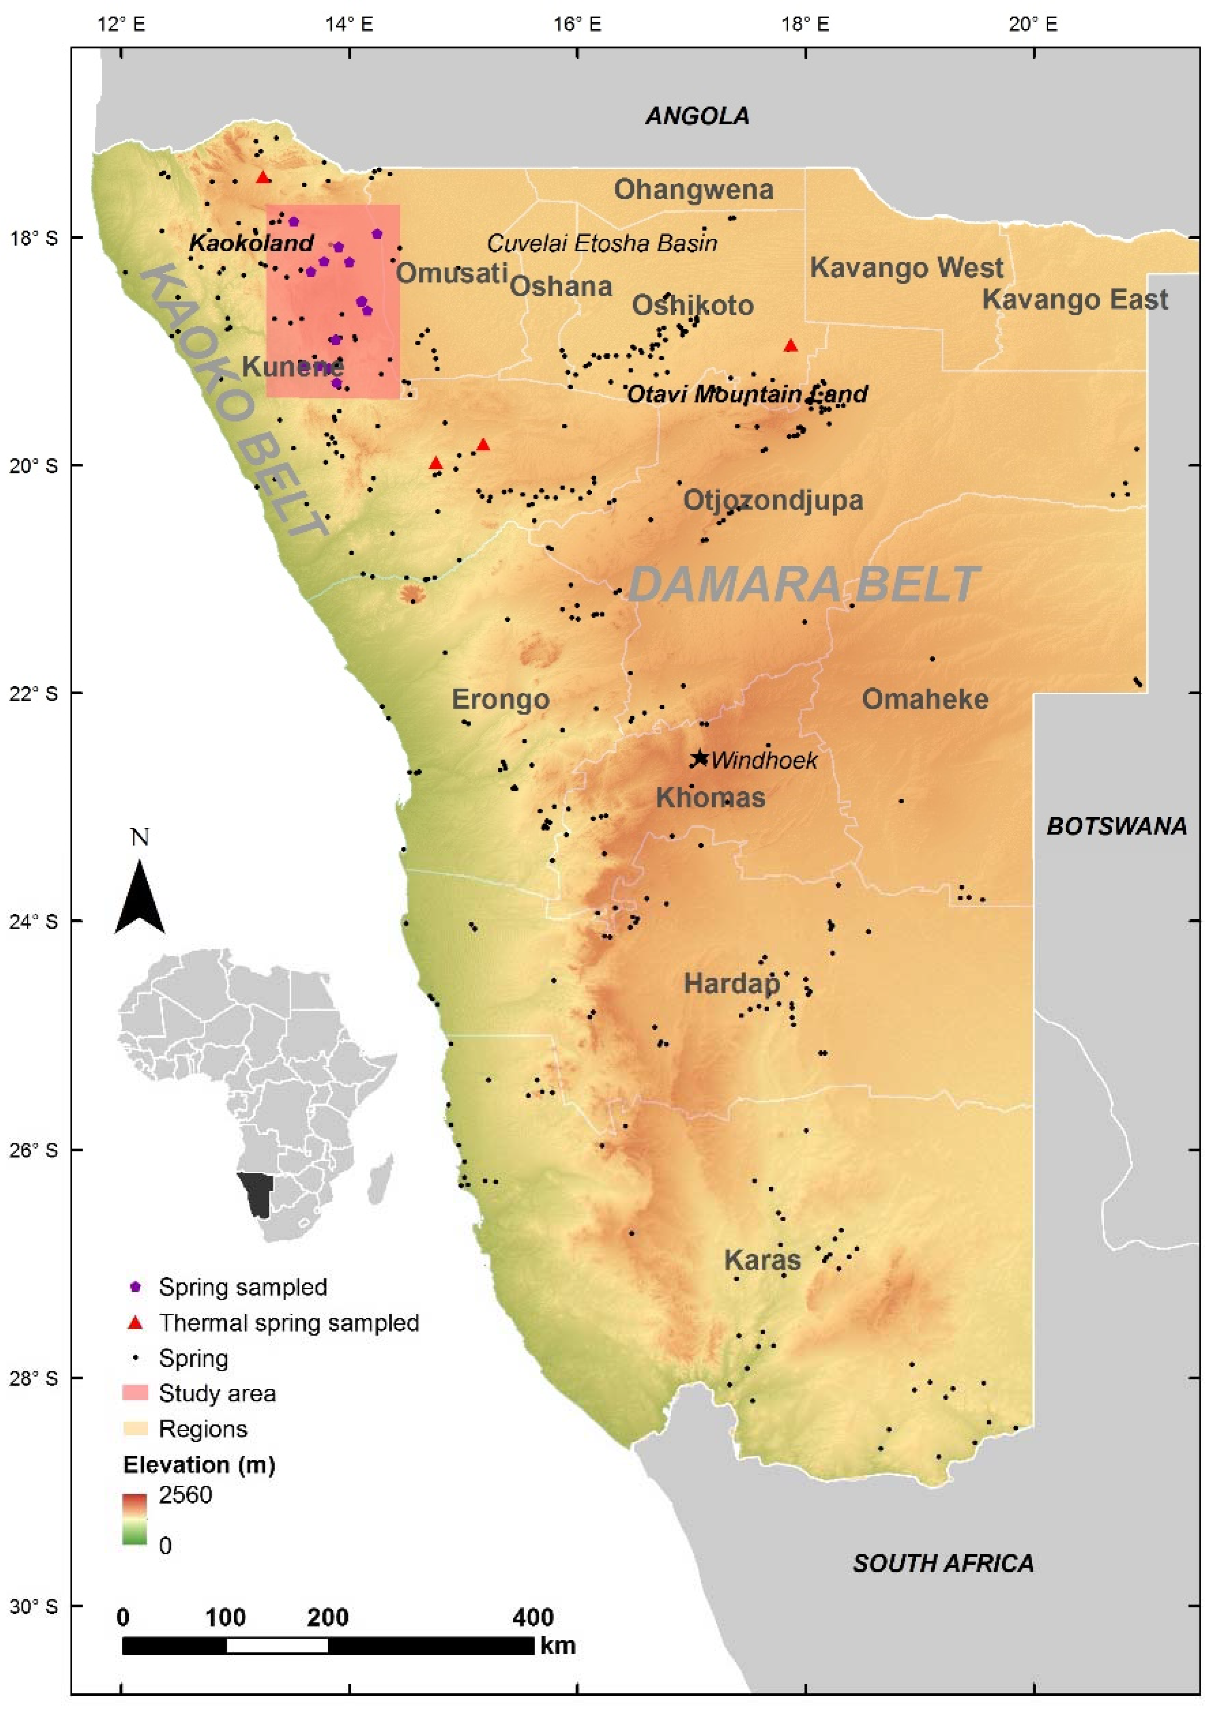
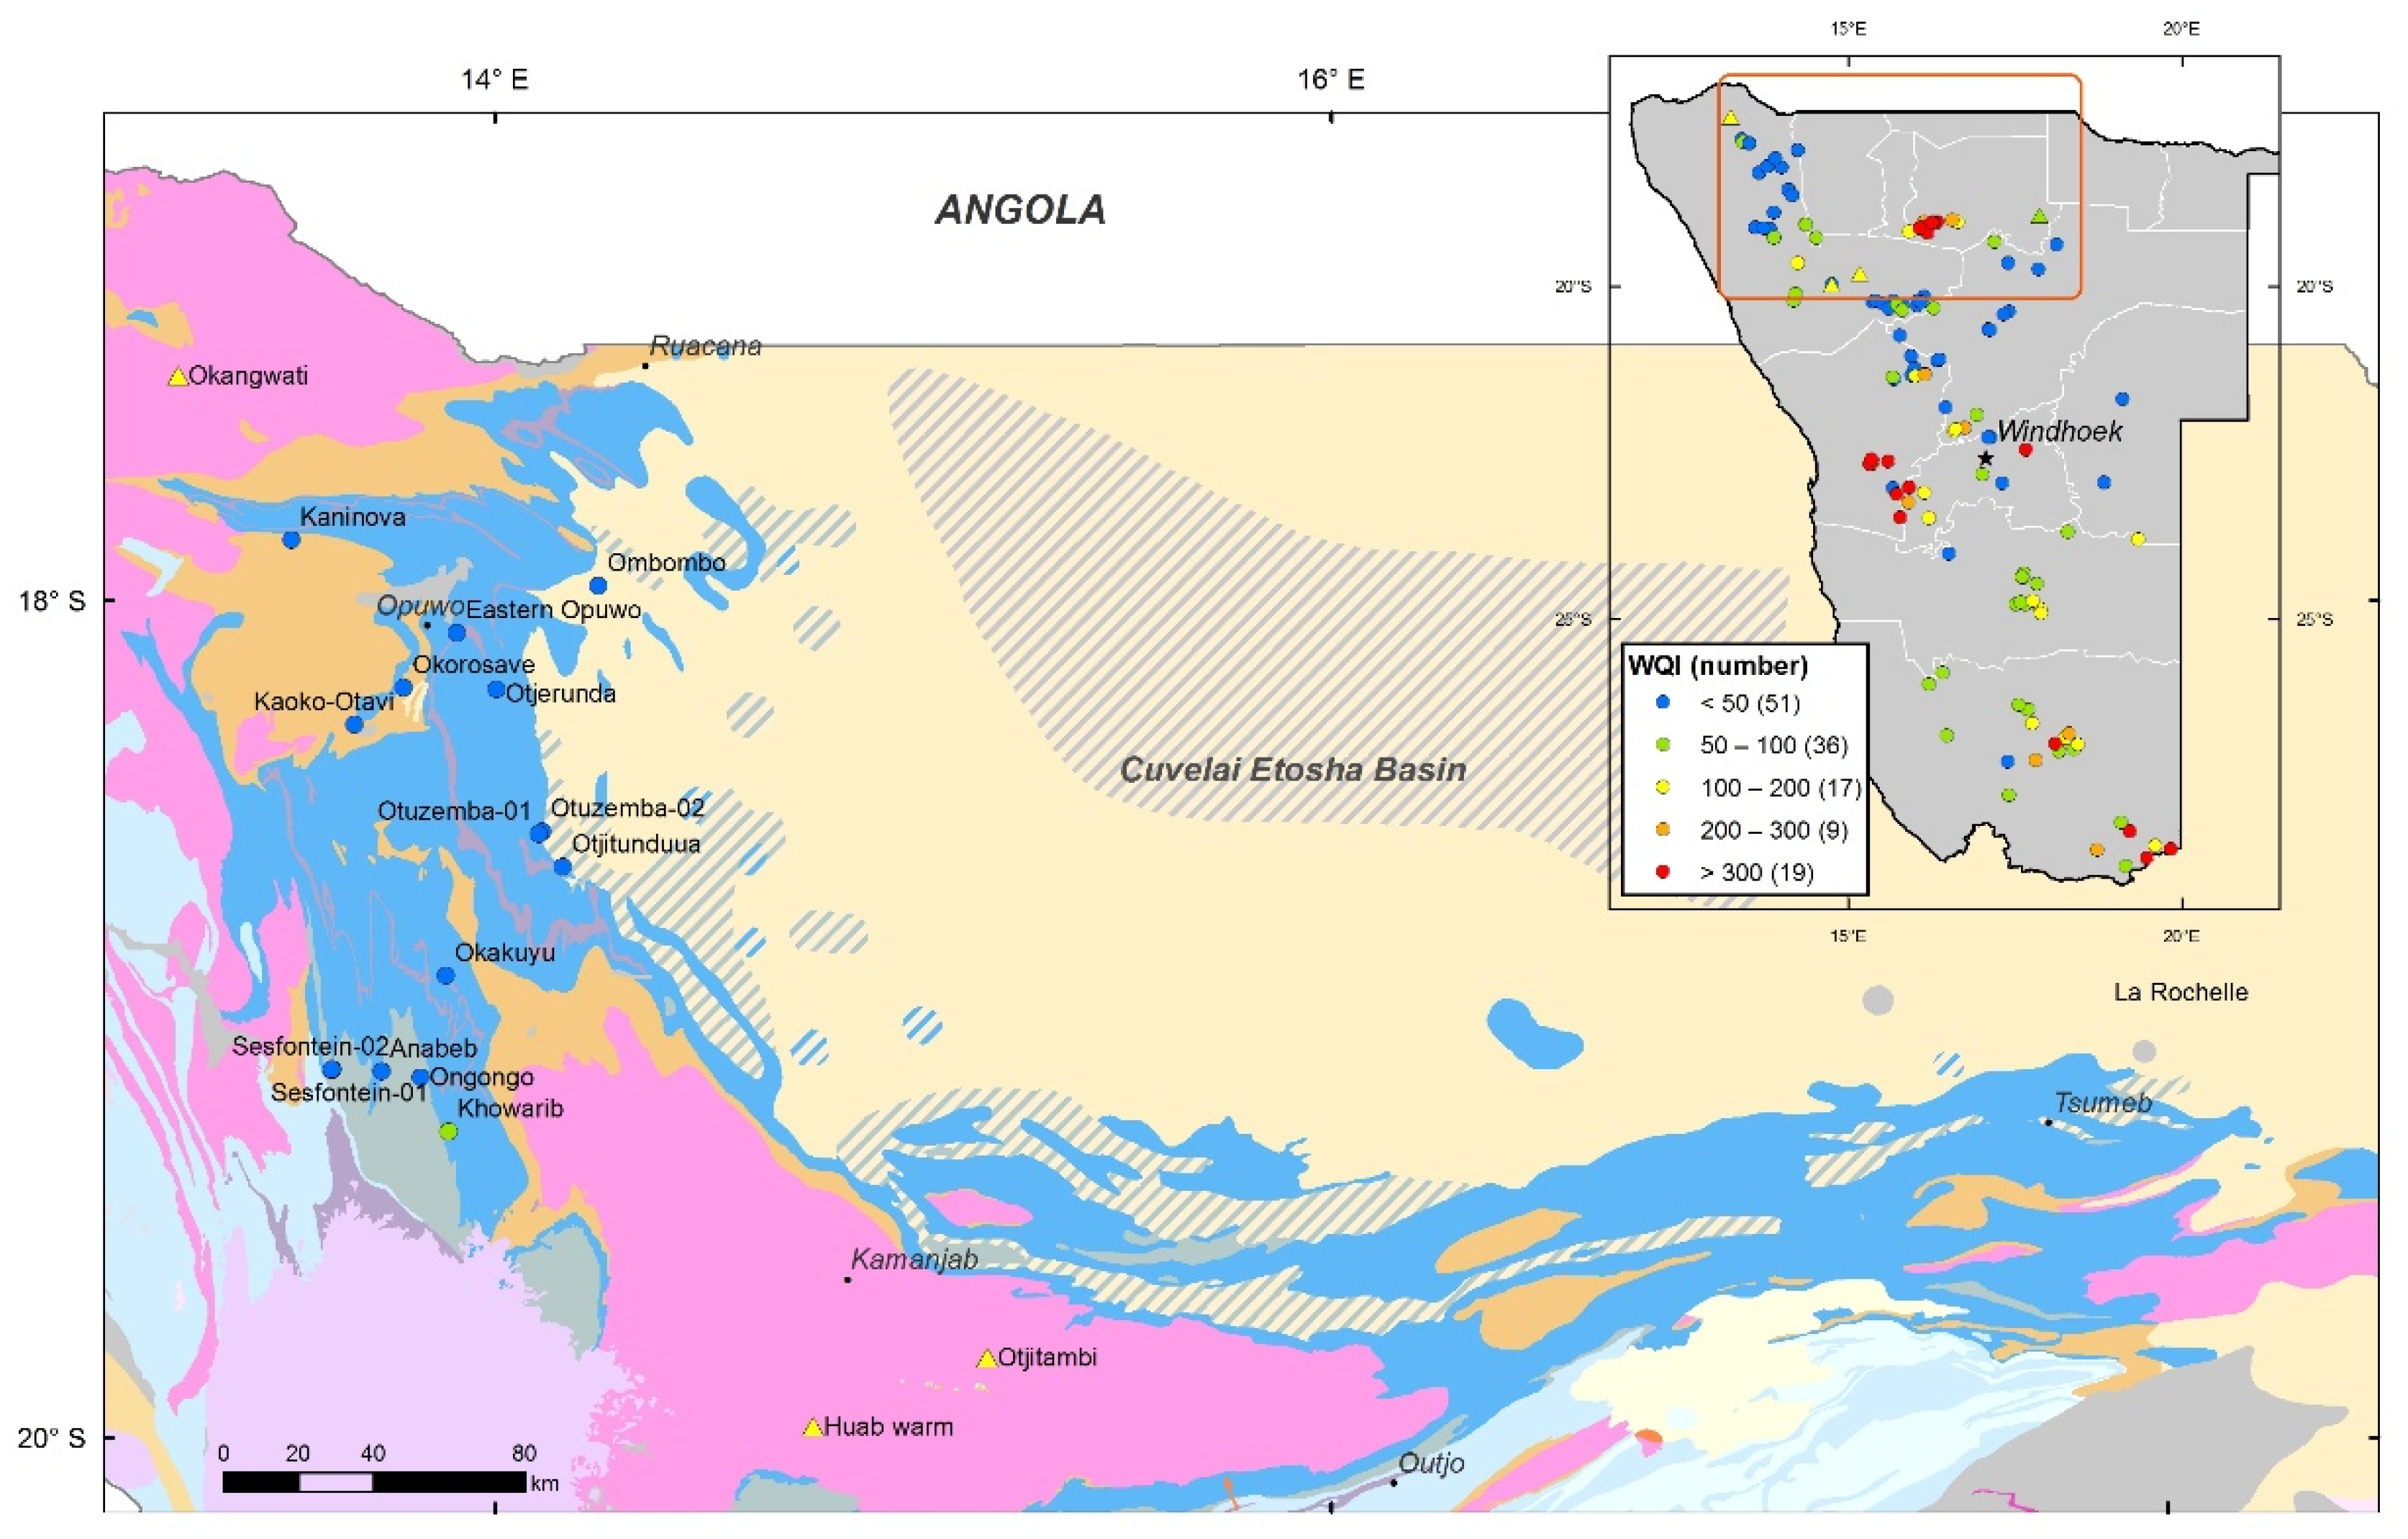
This study was carried out in northwestern Namibia, mostly in the western Kunene and Omusati regions, in the western part of Kaokoland, and also in the Otavi Mountain Land (
Figure 1). The majority of the springs in Namibia are located in the mountain zones of the Damara Belt and the Kaoko Belt (
Figure 1), emerging at altitudes between 600 and 1450 m.
2.1. Hydro-Climatic Context
In the arid and semi-arid country of Namibia, precipitation is scarce and highly variable, both temporally and locally. In the northwestern region, rainfall events mainly occur between October and April, and the mean annual precipitation ranges between 150 mm/year in the west to 400 mm/year in the east, while the potential evapotranspiration can exceed 3000 mm/year. The average annual temperature is 20 to 25 °C and can reach 35 °C between September and January [
20].
Except for the Namibian border rivers, no surface water is perennial in the country. The occurrence, distribution, and extension of surface runoff are seasonal and depend on precipitation [
1,
3,
21,
22].
Namibia has often experienced drought periods, especially over the past few decades [
23,
24,
25], but one of the worst drought episodes in the country occurred in 2019 [
26,
27,
28,
29,
30].
2.2. Regional Geology
The study area, situated on the western rim of the Cuvelai-Etosha Basin (CEB,
Figure 1), is bounded by two orogenic belts resulting from the collision between (i) the Congo Craton and the Kalahari Craton, and (ii) the Congo Craton and the Rio de la Plata Craton, during the Neoproterozoic Pan-African Orogeny [
31,
32], which formed the Kaoko Belt to the west and the Damara Belt to the south (
Figure 1).
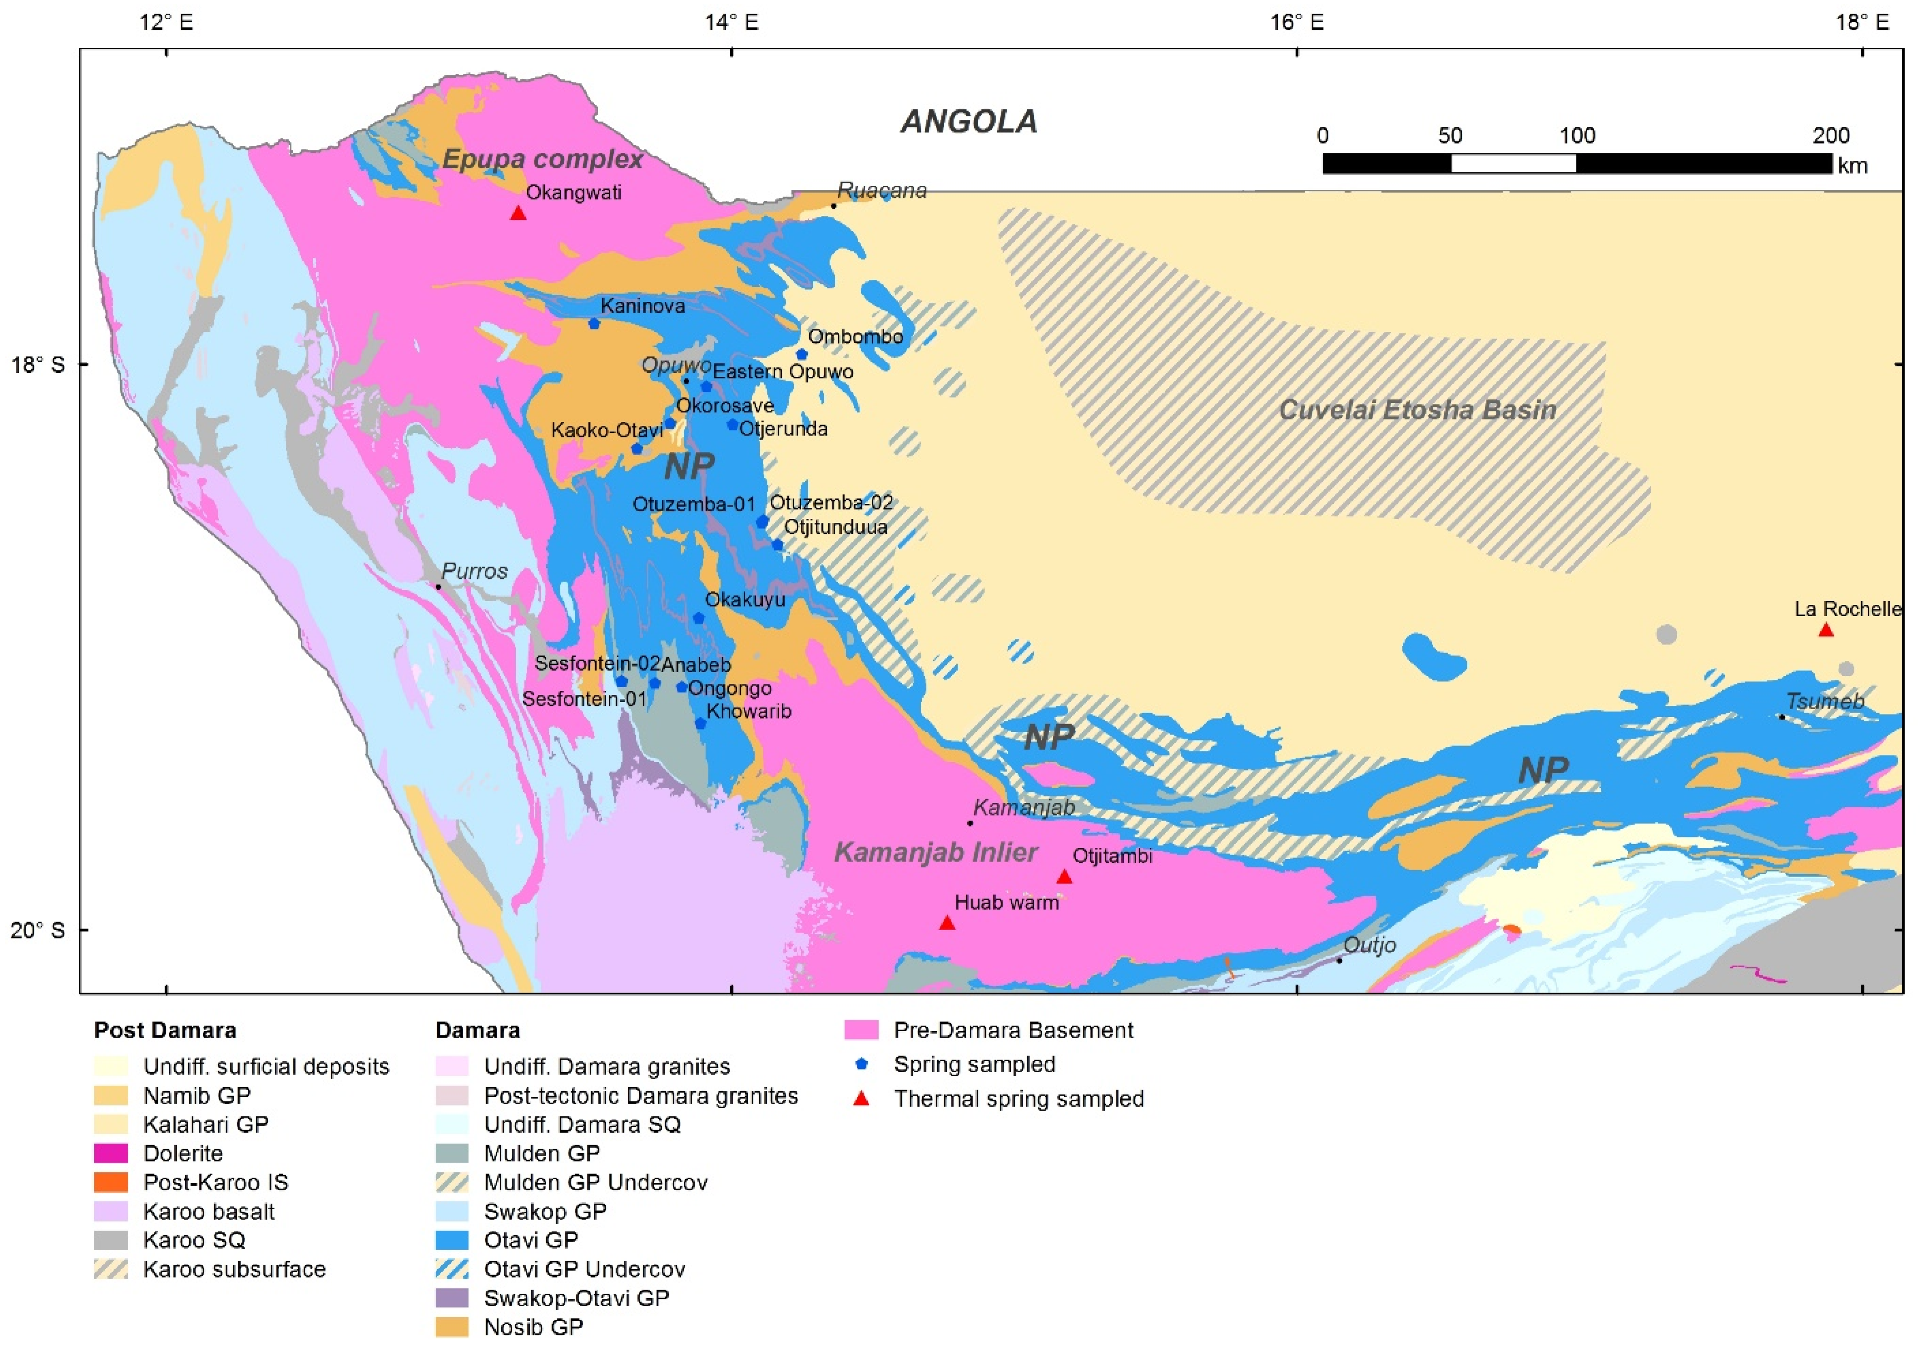
The oldest (Pre-Damaran) rocks present in the area are Paleoproterozoic metamorphic complexes of volcanic, granite and gneiss rocks (
Figure 2), which characterize the basement of the CEB. Largely outcropping on the western rim of the basin, eastern Kaokoland, the Neoproterozoic Damara Supergroup [
32] constitutes the main succession of the Northern Otavi Platform (
Figure 2). The oldest deposits of the Damara Supergroup are the synrift fluvio-clastic metasediments of the Nosib Group, followed by an important carbonate platform with deposits of the Otavi Group, and the syn-tectonic clastic deposits of the Mulden Group, which rest on the Otavi dolomites. The Karoo succession reflects climate change during the Paleozoic, with glacial tillite deposits of the Dwyka Formation along the valleys. Resting in a disconformable manner on the Karoo Formation, the Kalahari group consists of Tertiary to recent sands, gravel, calcrete, and clay formations, which can reach a thickness of 600 m toward the basin [
32]. The Etosha Calcrete Formation is a groundwater calcrete cover formed by springs emerging at the base of the karstic Otavi carbonate ridges that form the western and southern margins of the basin [
33,
34] (
Figure 2).
2.3. Spring Occurrence and Control in a Hydrogeological Context
A spring corresponds to an emergence point where groundwater flows out to the surface [
35]. In Namibia, most of the springs are located in or at the base of the carbonate and dolomitic rocks of the Otavi Group (
Figure 2) [
1,
33]. This group is characterized by fractured aquifers of moderate hydrogeological potential. However, the contact between the non-porous rocks of the Nosib or Mulden groups (aquitards) shows a much larger karstification phenomenon, and springs were mainly identified at these stratigraphic contacts, especially in the Sesfontein area [
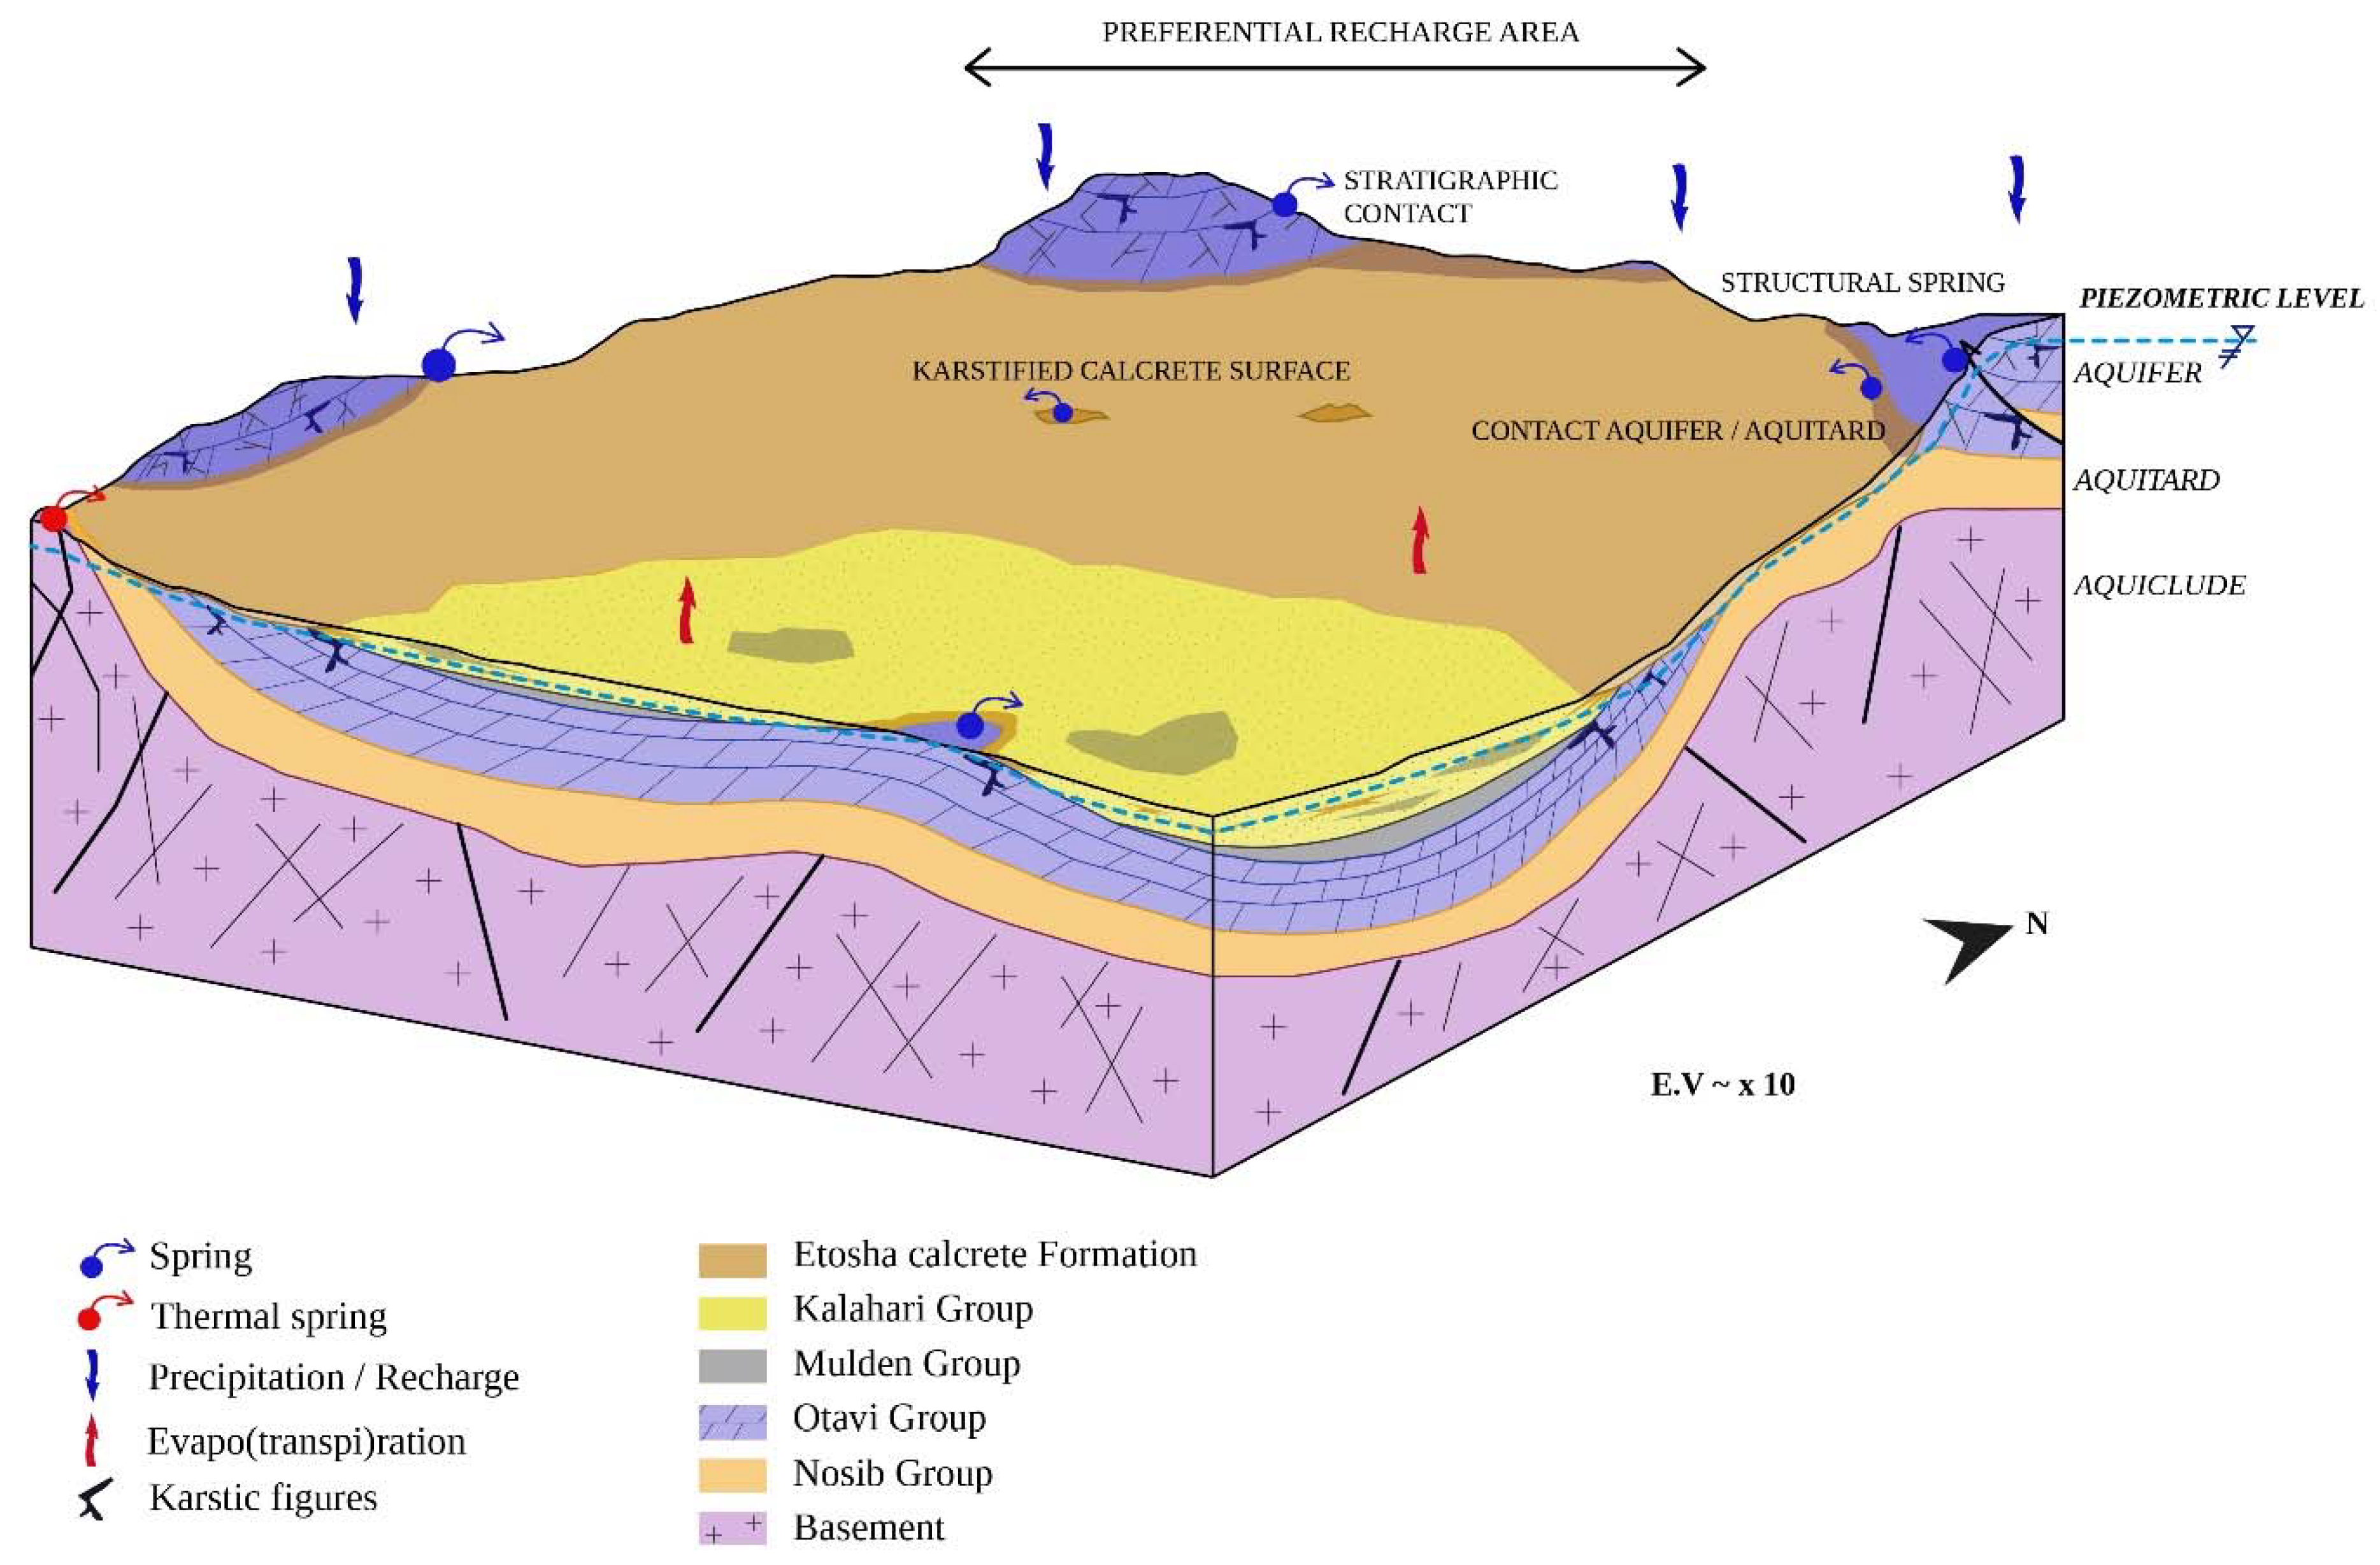
1]. The emergence of the springs can be structurally controlled at a fracture contact (
Figure 3).
At the foot of the karstic dolomitic Otavi Group reliefs of Kaokoland, mostly at the bottom of valleys [
36], some springs seep from the thick karstic calcrete deposits of the Etosha Calcrete Formation (
Figure 3). In the context of very high potential evaporation, these springs have built-up a calcrete deposit [
37] which locally can exceed 100 m in thickness [
33,
38].
Most of the geothermal springs visited emerge from deep fractures (
Figure 3) localized in one of the oldest rocks outcropping in Namibia [
39,
40], i.e., in the granite and/or para- to ortho-gneiss rocks from the Archaean that define the basement.
3. Material and Methods
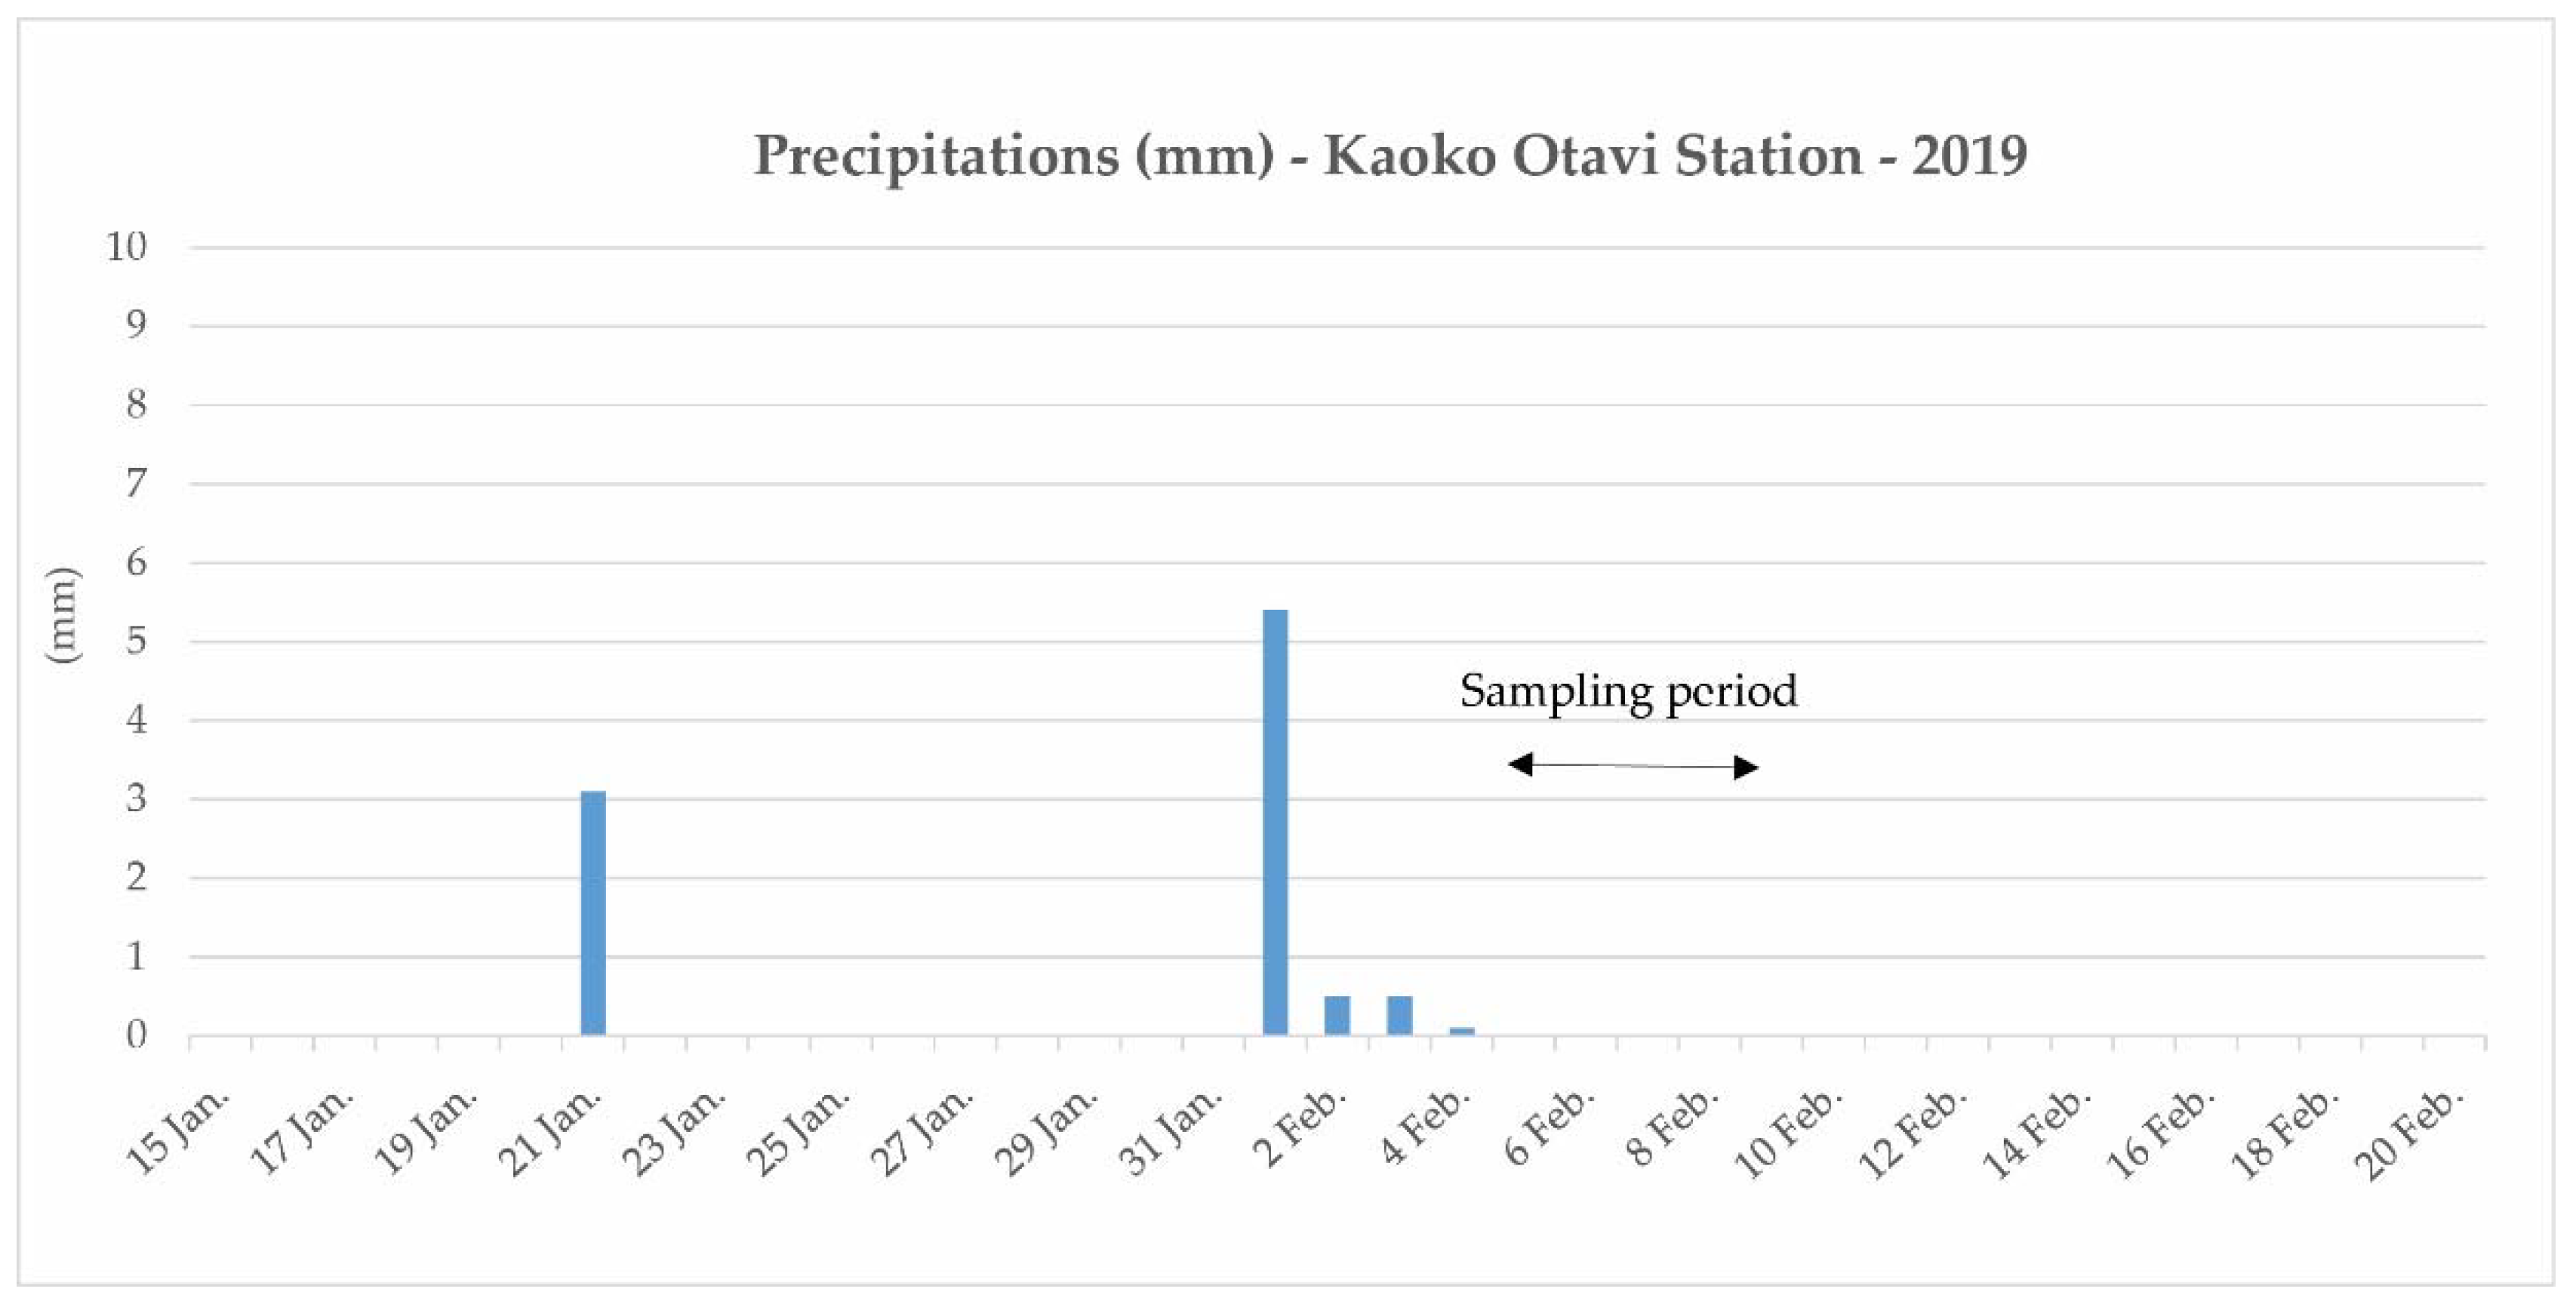
Groundwater from sixteen springs and four thermal springs (
Figure 2) was sampled as close to the point of emergence as possible. These springs were sampled from 5 February to 10 February 2019. Very low amounts of precipitation were measured 3 days before the sampling took place (6 mm,
Appendix A).
The following parameters were measured in situ using a portable Hach multimeter that was calibrated twice per day: temperature (T); pH; electrical conductivity (EC); and dissolved oxygen (O2). The alkalinity was measured and calculated in situ by titration. Then, 200 mL of water was sampled and filtered through a 0.1 µm filter on-site and kept in cold storage until chemical analyses were performed in the laboratory. The major ion concentrations (Cl−, SO42−, NO3−, NO2−, F−, K+, Na+, Ca2+, Mg2+), the alkalinity (as CaCO3), the concentrations in Fe and Mn, and turbidity were analyzed at Analytical Laboratory Services in Windhoek, Namibia. The concentrations of the cations K+, Na+, Ca2+, Mg2+, Fe and Mn were analyzed using an inductively coupled plasma optical emission spectrometer (ICP-OES). The alkalinity was analyzed using the acidimetric method. NO3− and NO2− were determined using the colorimetric method, and the turbidity, SO42−, F− and Cl− were measured using the nephelometric, turbidimetric, electrometric and argentometric methods, respectively.
One hundred and sixteen existing hydrogeochemical results for springs throughout Namibia were collected from the GROWAS II Database (DWA, Department of Water and Agriculture) of the Ministry of Agriculture, Water and Forestry (MAWF).
The Water Quality Index (
WQI) was used to assess water quality in this study. The
WQI is widely used and essential to evaluating the quality of surface water and groundwater to determine if it is safe for human consumption. The
WQI was calculated using the weighted arithmetic water quality index, which was originally proposed by Horton (1965) [
17] and developed by Brown et al. (1972) [
41].
The
WQI is calculated by assigning a weight (
wi) to each parameter (pH, TDS, Ca
2+, Mg
2+, Na
+, K
+, SO
42−, Cl
−, NO
3− and F
−) according to its relative importance to the quality of water for drinking purposes [
42]. A weight between 1 and 5 was assigned to each of the parameters according to their effects on water quality [
18]. Total dissolved solids, nitrate and fluoride were assigned the highest weight because of the impact they have on water quality. Chloride and potassium were given the minimum weight [
18]. The computed relative weight (
Wi) values for the geochemical parameters are presented in
Table 1; they were calculated according to the following equation:
where
Wi is the relative weight,
wi is the weight of each parameter and
n is the number of parameters.
The quality rating
qi was computed using the concentration of each parameter in groundwater (
Ci) and the Namibian Drinking Water Standard (
Si) for each parameter [
13]:
where
Ci is the concentration of each chemical parameter for each groundwater sample (in mg/L), and
Si is the Namibian Drinking Water Standard for each chemical parameter (in mg/L) according to the guidelines given by the DWA [
13].
The quality rating for pH is calculated using the following equation:
where
pHi is the observed pH value.
The
WQI is finally calculated using the following equation:
where
qi is the rating for each parameter and
Wi is the relative weight of each parameter.
The computed
WQI values are classified into five water quality categories (
Table 2).
Table 1.
Relative weights of chemical parameters, Namibian Standards for class A drinking water and World Health Organization (WHO) guidelines.
Table 1.
Relative weights of chemical parameters, Namibian Standards for class A drinking water and World Health Organization (WHO) guidelines.
| | Namibian Standards for Class A Drinking Water [13] | WHO (2011) Recommended Values | Weight (wi) | Relative Weight
|
|---|
| pH | 6.5–8.5 | 6.5–8.5 | 4 | 0.1290 |
| Electrical conductivity (EC; µS/cm) | 1500 | 1000 | 4 | |
| Total dissolved solids (TDS; mg/L) | | 1000 | 5 | 0.1613 |
| Calcium (mg/L) | 150 | 75 | 2 | 0.0645 |
| Magnesium (mg/L) | 70 | 50 | 2 | 0.0645 |
| Sodium (mg/L) | 100 | 200 | 3 | 0.0968 |
| Potassium (mg/L) | 200 | 12 | 1 | 0.0323 |
| Chloride (mg/L) | 250 | 250 | 1 | 0.0323 |
| Sulfate (mg/L) | 200 | 250 | 3 | 0.0968 |
| Nitrate (mg/L) | 10 | 50 | 5 | 0.1613 |
| Fluoride (mg/L) | 1.5 | 1.5 | 5 | 0.1613 |
| | | | ∑wi = 31 | ∑Wi = 1.0000 |
In addition, all single parameters from the GROWAS database were used to evaluate and characterize the groundwater quality with respect to permissible values for human consumption, based on the guidelines for drinking water quality of the World Health Organization [
12] and the Namibian Standards for the Evaluation of Drinking Water Quality for Human Consumption [
13]. The Namibian Standards classify the water quality into four groups: A—excellent; B—acceptable; C—low risk; D—high risk or unsuitable for human consumption.
Table 2 presents the permissible standards for class A water together with the WHO recommended values.
Table 2.
Water quality according to the
WQI [
42].
Table 2.
Water quality according to the
WQI [
42].
| WQI | | Water Quality |
|---|
| <50 | | Excellent |
| 50–100 | | Good |
| 100–200 | | Poor |
| 200–300 | | Very poor |
| >300 | | Unsuitable |
This study is only based on the inorganic composition of groundwater, and it does not take into account organic or bacteriological components, which have already been analyzed in the Cuvelai Etosha Basin, notably, in hand-dug wells [
43].
4. Field Observations
Despite a severe drought period in Namibia in 2019 and 2020 [
24,
28], some of the springs visited still showed flowing water, and only a few of them were dry. Of the thirty-five springs visited, only three were dry, and they were potentially seasonally dry. Sixteen of the springs were not captured or were captured in a very basic way using only a small trench dug around the emergence point (9). Twenty-five springs had some protective measures around the emergence point (
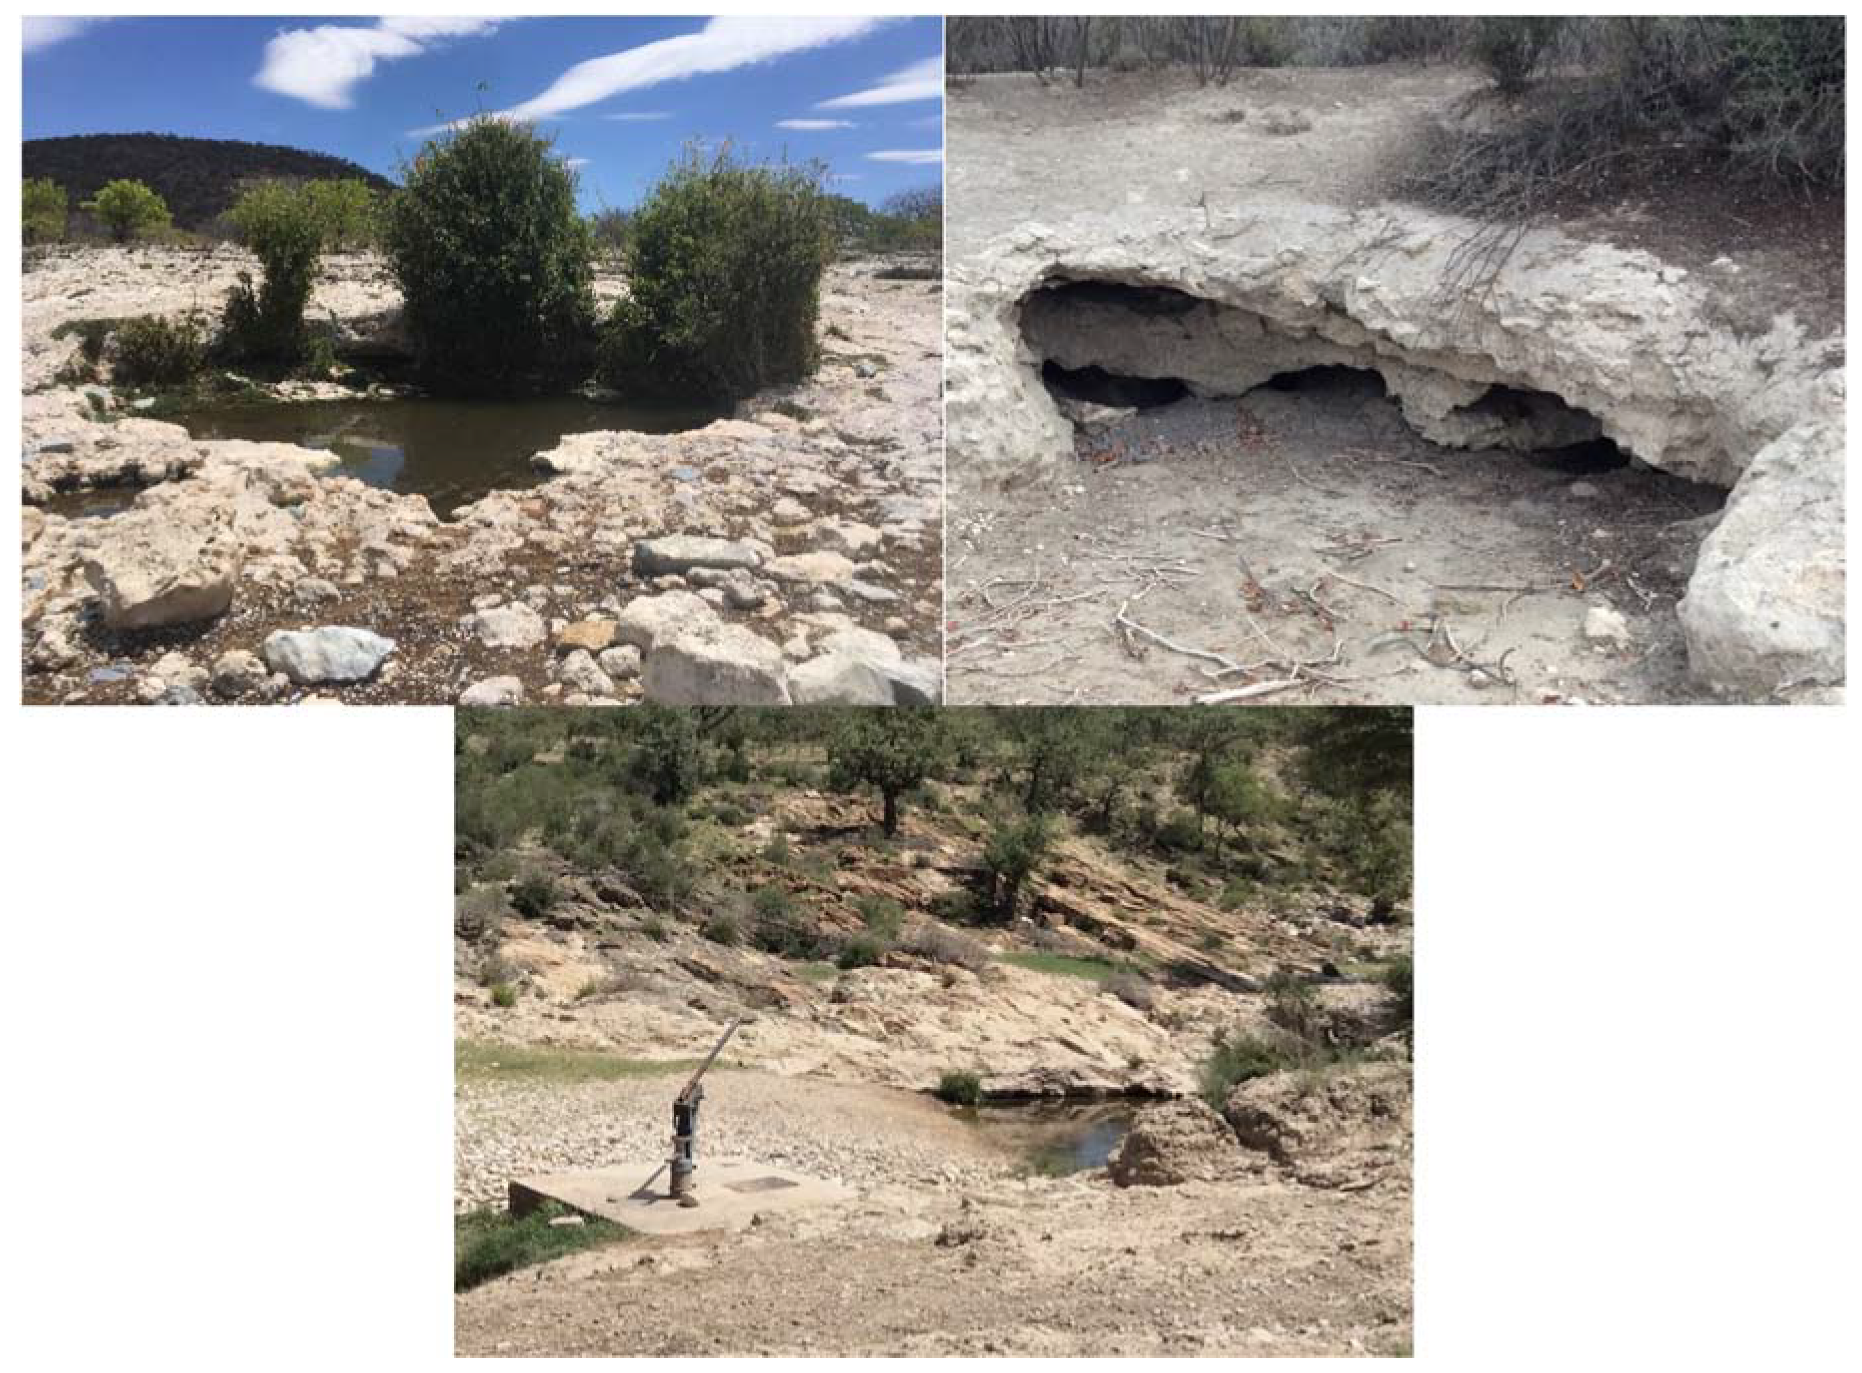
Table 3). All of these springs are mostly used for livestock watering, the irrigation of small community gardens and, when there is no borehole substitution, human consumption. Livestock usually drinks directly from the spring without any separation from the collection point for human consumption. Despite the fact that these groundwater resources are used by all the communities in the area, none of these emergence points are monitored, nor are they controlled to guarantee groundwater quality.
Table 3 contains the spring capture methods observed as well as the protective measures taken for springs in northwestern Namibia, and
Figure 4 provides some photos of field observations.
At locations with unprotected springs, where the emergence is open air and easily accessible, the water is turbid and presents suspended matter. Some springs distinctly show the flowing of clear water, but some of them present lower flow rates or low seep. Three of the thermal springs visited were used for human consumption, livestock watering and irrigation, and two of them were used as hot pools for tourism.
5. Results
5.1. Physico-Chemical Parameters
The temperature of the studied springs in northwestern Namibia varied from 20.1 to 32.0 °C, while the temperature of the thermal springs varied from 41 to 44.1 °C. The electrical conductivity of the samples was variable; the electrical conductivity must be between 701 and 1271 µS/cm for class A springs (water with excellent quality). Two of the springs were above the limit of 1000 µS/cm given by the guidelines of the World Health Organization. The EC varied from 1124 to 2740 µS/cm in geothermal springs, and many were not in class A but were still in class B (water with acceptable quality). The pH of all the springs sampled varied between 6.75 and 7.89. The limits, medians and averages of the physico-chemical field parameters are given in
Table 4.
5.2. Major Ions
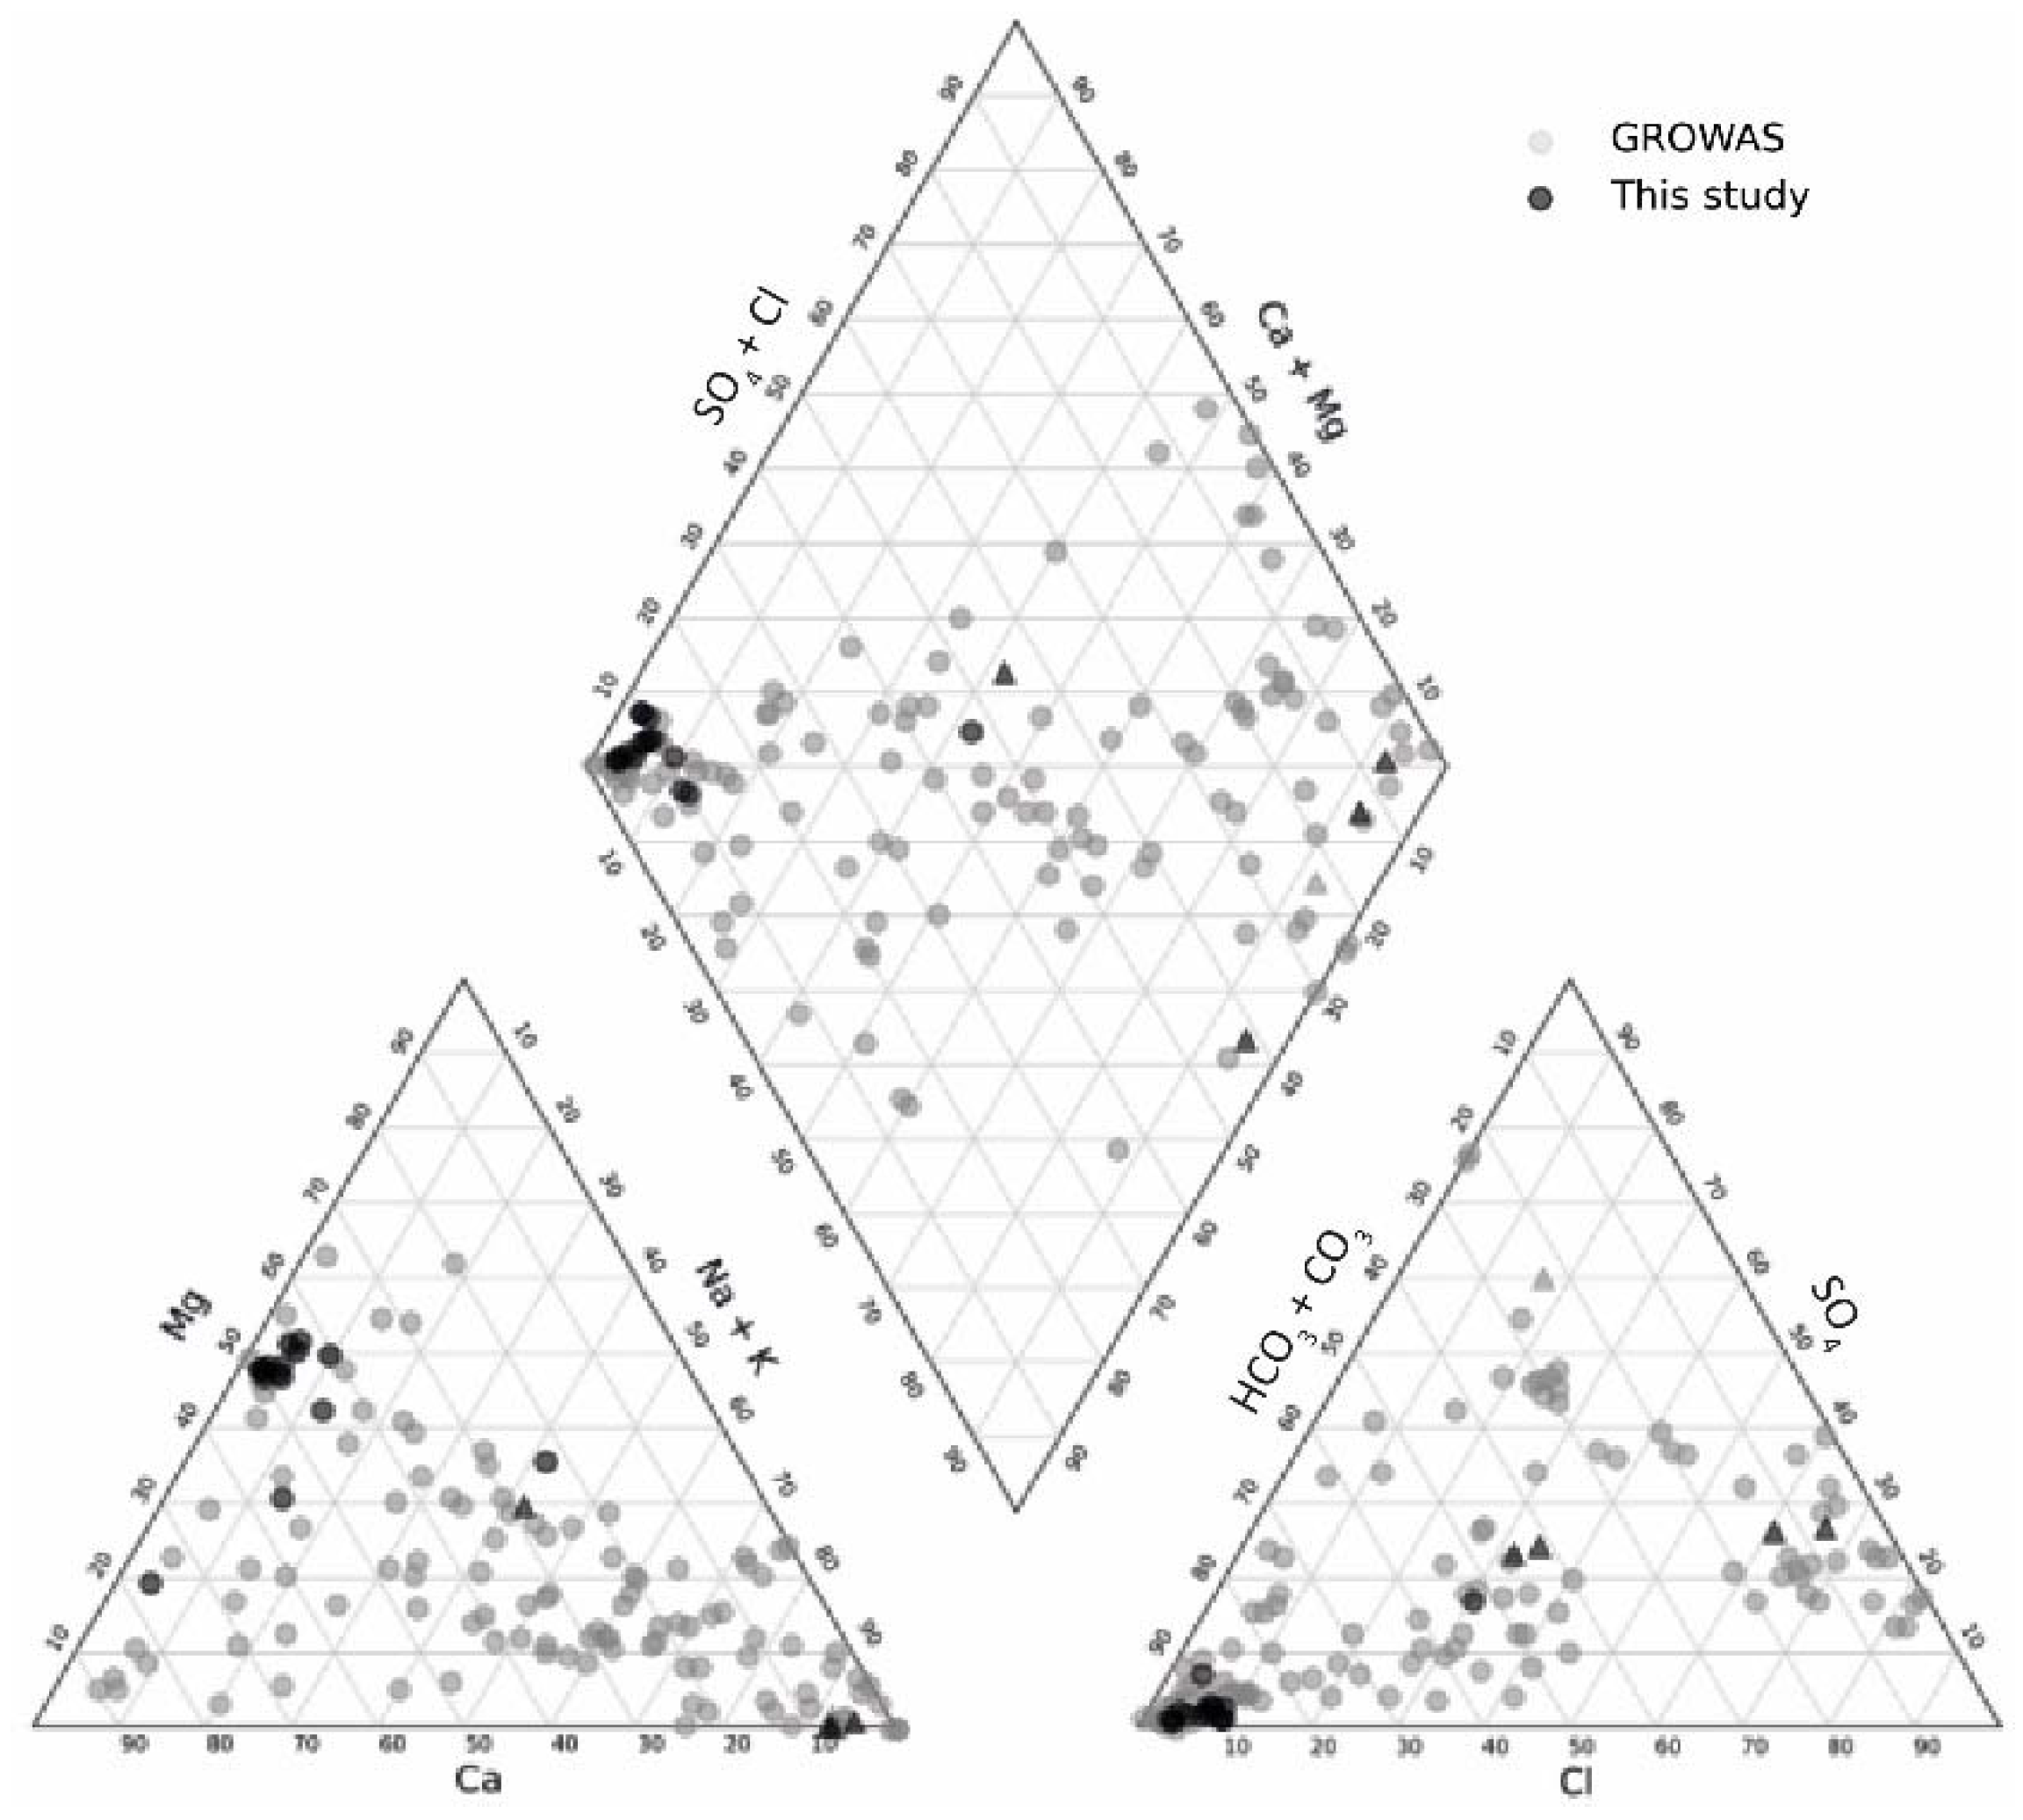
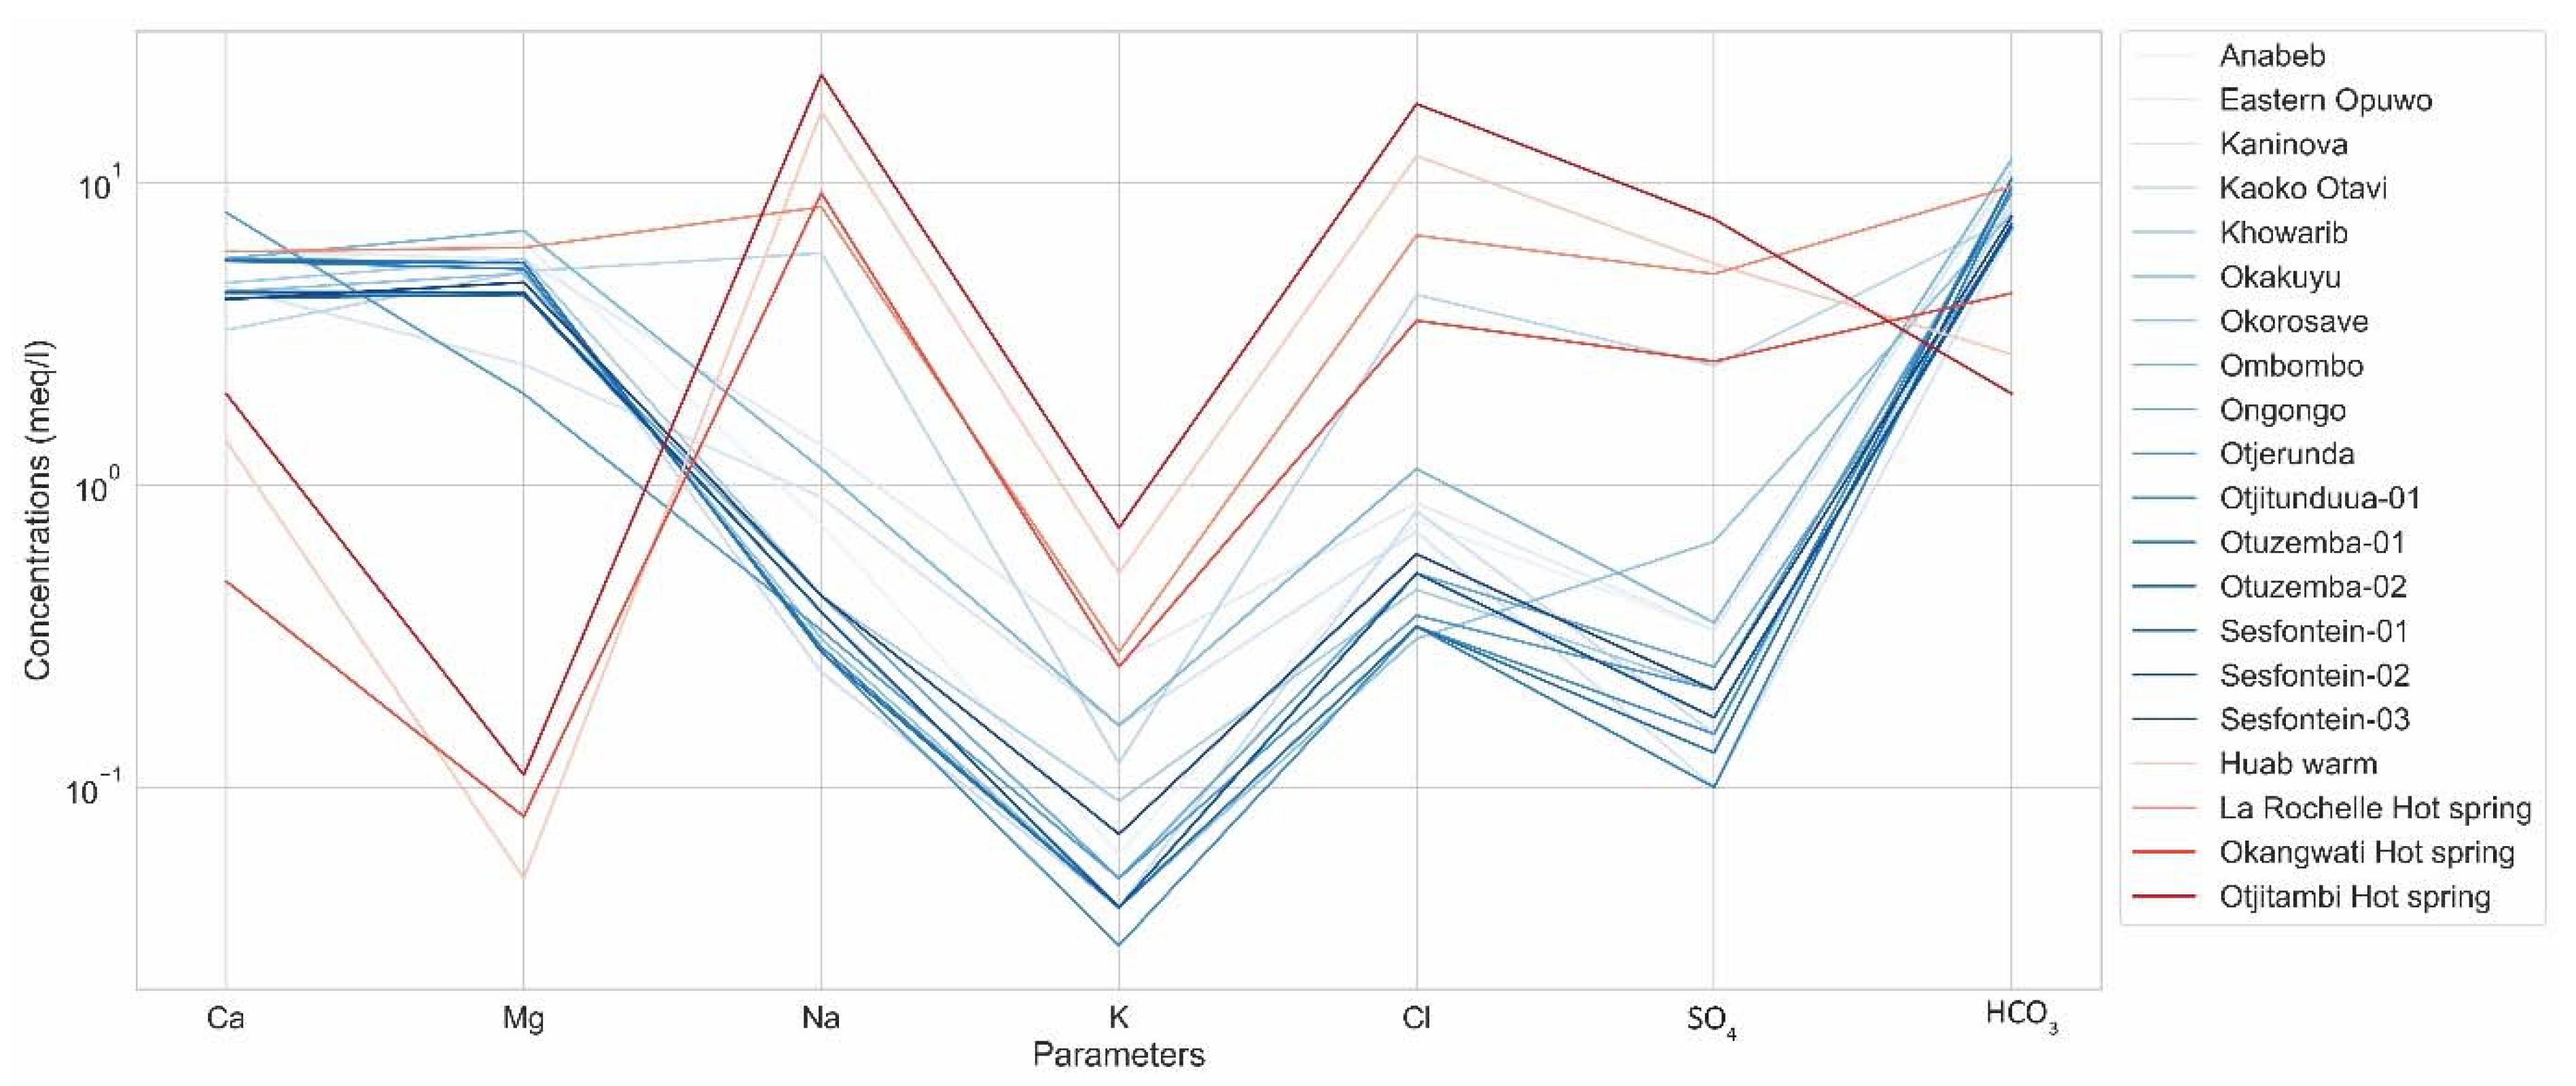
Figure 5 and
Figure 6 present the chemistry of the springs in the form of a Piper diagram and Schoeller diagram, which were used to identify the different water facies observed in the study area (in black,
Figure 5) and those from the GROWAS database (in grey,
Figure 5).
The twenty sources sampled for this study covered similar geochemical facies, as shown by the springs from the Namibia-wide GROWAS dataset. The dominant water facies of the springs in northwestern Namibia (black dots in
Figure 5 and blue lines in
Figure 6) and all Namibian springs (GROWAS) was principally Ca-Mg-HCO
3. Some springs did not show dominant ions and presented a mixed water type. Potassium and sulfate were the major ions that had the lowest concentrations in the springs (
Figure 6).
The majority of the thermal springs (black triangles in
Figure 5 and orange and red lines in
Figure 6) were located in the Na-Cl-HCO
3 area, except for the La Rochelle Hot Spring, which had no dominant ions. Magnesium, potassium and calcium were the major ions that had the lowest concentrations in hot springs.
The Schoeller diagram in
Figure 6 clearly distinguishes the Ca-Mg-HCO
3 water facies of the springs from the Na-Cl water facies of the thermal springs, except for the La Rochelle Hot Spring, which presented mixed facies. The thermal springs also generally had a much higher SO
4 content.
Table 5 presents the concentrations of major ions in the springs and thermal springs sampled in the area of interest (see
Figure 1 for locations) compared to the Namibian Standards for the Evaluation of Drinking Water for Human Consumption [
13]. Almost all the springs visited in northwestern Namibia showed ion concentrations that fell into class A (excellent quality). Three of these springs had sodium, magnesium or calcium concentrations slightly above the class A threshold (134 mg/L, 83 mg/L and 159 mg/L), but they did fall within class B, indicating water with an acceptable quality (in yellow,
Table 5).
All the thermal springs (TSs) had at least two ion concentrations higher than the class A limits. Sodium and fluoride concentrations ranged between 191 and 522 mg/L and between 1.6 to 8.7 mg/L, respectively; all of these values exceeded the class A limits. Some of these hot springs fell into class B, water with an acceptable quality (in yellow,
Table 5), and some of them into class C (water with a low health risk, in orange). The majority of the fluoride concentrations fell into class D, water with a high health risk (in red). The sulfate and chloride concentrations were also above the class A limits for three and two, respectively, of the thermal springs analyzed.
The turbidity measured in the springs was extremely variable; one spring was classified as class D (water with a high health risk) with regard to turbidity (in red,
Table 5), one was in class C (water with a low health risk, in orange) and four samples were in class B (acceptable quality, in yellow). Only seven springs showed turbidity values that fell in class A (excellent water quality). The turbidity values measured in the thermal springs were below the class A limit.
The TDS concentrations were below the WHO limit of 1000 mg/L in all the springs sampled, but they were above this limit in the majority of the thermal springs, with the exception of Okangwati Hot Spring.
Table 5.
Conductivity and concentrations of major ions of visited springs and thermal springs. Cells without color indicate ion concentrations in class A—excellent water quality according to the Namibian Standards. Yellow indicates ion concentrations in class B—acceptable quality. Orange indicates ion concentrations in class C—low health risk; red indicates ion concentrations in class D—high health risk. TS = thermal spring. See
Figure 2 for spring locations.
| Name | SO42− | NO3− | F− | Cl− | Na+ | K+ | Ca2+ | Mg2+ | HCO3− | TDS | Turbidity |
|---|
| | mg/L | NTU |
|---|
| Eastern Opuwo | 16 | 0.8 | 0.3 | 31 | 31.0 | 10.0 | 119 | 67 | 677.0 | 750.4 | 17.0 |
| Anabeb | 16 | 4.5 | 0.2 | 27 | 17 | 2.2 | 110 | 76 | 665 | 732.0 | 0.8 |
| Kaninova | 5 | 5.2 | 0.1 | 25 | 21.0 | 6.4 | 90 | 30 | 423.5 | 437.5 | |
| Kaoko Otavi | 7 | 1.8 | 0.1 | 29 | 5.5 | 1.4 | 111 | 64 | 525.0 | 628.5 | |
| Khowarib | 119 | 1.1 | 0.7 | 151 | 134.0 | 4.7 | 65 | 61 | 463.6 | 902.5 | 5.3 |
| Okakuyu | 10 | 3.1 | 0.2 | 16 | 10.0 | 3.6 | 93 | 67 | 573.0 | 625.8 | 0.2 |
| Okorosave | 31 | 4.5 | 0.2 | 11 | 7.2 | 1.7 | 87 | 60 | 482.0 | 560.8 | 0.4 |
| Ombombo | 17 | 1.0 | 0.7 | 40 | 26.0 | 6.4 | 112 | 83 | 726.0 | 796.0 | 1.5 |
| Ongongo | 12 | 7.4 | 0.2 | 18 | 10.0 | 1.8 | 86 | 51 | 427.0 | 535.3 | 0.3 |
| Otjerunda | 10 | 2.8 | 0.1 | 13 | 7.7 | 1.8 | 159 | 24 | 561.0 | 617.1 | 0.8 |
| Otjitunduua-01 | 7 | 3.9 | 0.2 | 12 | 6.5 | 1.3 | 112 | 65 | 628.0 | 653.3 | 1.6 |
| Otuzemba-01 | 5 | 3.6 | 0.2 | 12 | 6.6 | 1.4 | 110 | 62 | 592.0 | 635.2 | 0.6 |
| Otuzemba-02 | 6 | 2.8 | 0.2 | 12 | 6.4 | 1.4 | 110 | 65 | 628.0 | 653.3 | 1.5 |
| Sesfontein-01 | 8 | 7.9 | 0.1 | 18 | 8.8 | 1.4 | 83 | 51 | 433.1 | 530.0 | 0.4 |
| Sesfontein-02 | 8 | 7.7 | 0.1 | 18 | 8.8 | 1.4 | 87 | 52 | 445.3 | 529.3 | 1.6 |
| Sesfontein-03 | 10 | 3.6 | 0.1 | 21 | 9.8 | 2.6 | 82 | 56 | 469.7 | 542.7 | 0.85 |
| Huab Warm TS | 258 | 0.9 | 8.7 | 434 | 394.0 | 20.0 | 28 | 0.6 | 164.7 | 1399.0 | 0.2 |
| La Rochelle TS | 239 | <0.5 | 1.6 | 237 | 191.0 | 11.0 | 118 | 73 | 588.8 | 1204.7 | |
| Okangwati TS | 123 | 1.9 | 13.0 | 124 | 212.0 | 9.9 | 9.6 | 1.0 | 262.3 | 753.1 | 0.5 |
| Otjitambi TS | 363 | 0.5 | 7.6 | 645 | 522.0 | 28.0 | 40 | 1.3 | 119.6 | 1835.8 | 0.1 |
5.3. Water Quality Index
The
WQIs calculated for each of the springs and thermal springs in Namibia are shown in
Figure 7. The majority of the springs (66%) showed excellent to good water quality (in blue and green,
Figure 7), 17% had poor water quality (in yellow), 7% had very poor water quality (in orange) and 10% had water unsuitable for human consumption (in red).
Table 6 shows the
WQIs calculated for each of the “cold” springs (Sp) in the study area as well as those calculated for the thermal springs. In the area of interest, every cold spring (non-thermal) showed excellent or good water quality for drinking purposes. However, the majority of thermal springs (TS) had poor water quality, except for one (La Rochelle) that had good water quality.
6. Interpretation and Discussion
In northwestern Namibia, communities essentially rely on groundwater due to the lack of perennial surface water. However, a high percentage of perennial springs potentially reflect moderate-to-good groundwater potential in this arid area. The springs also present the cheapest water resource, as water from a spring can be captured at the direct emergence point without any cost.
6.1. Water Facies
Assuming that groundwater is in equilibrium with the minerals within the aquifer, as assumed in the calculation of the saturation index (SI) using the PHREEQC package [
13], water facies mainly originate from water–rock reactions but could be influenced by human activities. The water facie Ca-Mg-HCO
3 is the most representative of springs in the study area, and it is very typical of carbonate and dolomitic rocks [
1,
44,
45,
46,
47]. Most of the springs have water that is in equilibrium with calcite and disordered dolomite (
Appendix B); calcium and magnesium derive from the geological formations from which the majority of the springs emerge. Bicarbonate (HCO
3) is formed by the interaction of dissolved carbon dioxide and limestone and dolomite.
The Na-Cl water type is only recorded in the thermal springs and represents the main facies of this groundwater type in northwestern Namibia; it is strongly correlated to the high electrical conductivity values measured. Sodium and chloride are the common constituents of many minerals that are highly soluble [
48], and they may be related to evaporitic rocks or prolonged water–rock reactions occurring at high temperatures at depth, resulting in highly mineralized waters; this would explain the high concentrations of dissolved salts [
49].
The main source of fluoride in thermal springs is probably the magmatic granite and gneisses forming the bedrock complex [
10,
50]. As shown in
Appendix B, the majority of the thermal springs show an equilibrium with fluoride, which is a common element widely distributed throughout the Earth’s crust. High concentrations of SO
42− are also observed in this bedrock context, and could have originated from the deep circulation and oxidation of sulfide minerals from the Earth’s crust [
8,
10,
48].
6.2. Water Quality
Regarding the water quality, the high turbidity values of the majority of springs indicate a large amount of particulate matter, which can originate from microorganisms and/or fine inorganic material, and is unfit for human consumption. Every spring that has a turbidity higher than the class A limit does not have any protective measures at its emergence, with immediate access for communities, livestock and wild animals. Livestock breeding might be the main cause of these high turbidity values. Apart from these high turbidity values, all the inorganic constituents measured in spring waters are within the limits set by the Namibian drinking water standards, with the groundwater classified as having excellent and good water quality.
In all thermal waters that have poor and very poor water quality in terms of the
WQI range, fluoride and sodium concentrations are above the class A limits (1.5 mg/L and 100 mg/L, respectively), and chloride and sulfate concentrations also fall into classes B and C in some thermal springs. At these levels, these ions do not really present a threat for human consumption, but they could affect the taste, odor or appearance of the water [
12].
No elevated concentrations are found for parameters typically influenced by human activities (e.g., nitrate or potassium). Due to the very low population density in the study regions [
20,
22], the impact of anthropogenic activities is low; this is consistent with the observed low nitrate concentrations. In other parts of Namibia, over the past few decades, nitrate contamination due to the use of fertilizers and/or feces contamination from livestock has been documented [
7,
11,
51,
52,
53].
7. Recommendations for Yield and Quality Improvement, and Sustainability of the Resource
As they do not require the installation of any equipment, the springs certainly represent the cheapest groundwater resource, but their yield and durability remain uncertain. A water governance and management plan is then essential for the sustainable, equitable and affordable governance of this resource; recommendations to support these resources are given below.
Protection plan and capture improvement. The springs indicate the presence of near-surface groundwater that is more vulnerable to contamination from the surface. Pollution may be a threat to human consumption. Emergence points with some protective and extraction measures (for example, a hand pump) allow easier water extraction and have better physical and chemical quality according to our study. Covering the direct discharge area and, when possible, deepening the pond and/or lining it will improve both water extraction and water quality. When the springs are the only resource for local communities, especially close to urban zones, an upstream borehole is an alternative in case of a decrease in the groundwater level or the seasonal dry-up of the spring. This would require some investment and operational costs, but it is also a safer option for drinking water, avoiding most common sources of contamination.
Basic treatment and water valorization. For safe human consumption, water should generally be disinfected, using either chlorination or UV treatment. Appropriate filtration methods should be employed to reduce the turbidity. The filtration of particulate matter will reduce the turbidity, reduce the number of microorganisms and improve the effectiveness of disinfection [
12]. In this study, bacteriological components were not measured, but other studies [
43] have revealed contamination problems that could be solved using these methods.
The thermal springs do not meet the potability requirements for human consumption, as they are highly mineralized and unfit for human consumption according to the guidelines from the WHO. However, the geothermal springs are often valued for other benefits, e.g., the health aspects of certain minerals, and they are used in medicine or for recreational purposes due to their high mineralization. Further studies are recommended from the point of view of thermalism, as mineral or medicinal water could add value to these springs and could provide a source of income for local communities.
Monitoring and surveillance. Surveillance is an important element in the improvement of the quality and quantity of the drinking water supply [
12]. Water quality monitoring of both geochemistry and bacteriology (E. coli, Enterococcus, etc.) should be performed annually. The monitoring of the water level and discharge will also help to prevent a decrease in the groundwater level and the drying up of the spring.
Promoting public awareness. To inform local communities about the vulnerability of groundwater resources and the risks of human consumption, it is essential to inform them about the impact of their practices on water resources to allow them to control water abstractions and protect them from contamination, especially bacteriological contamination, to ensure safe consumption.
8. Conclusions
This study focused on the springs in northwestern Namibia. One of our first observations was the perennial nature of the springs, even during the dry season and during one of the most severe drought episodes recorded in Namibia in the last 90 years. This could indicate a potential permanent resource.
The major Ca-Mg-HCO3 facies defining the majority of the springs were characteristic of the main dolomitic aquifers of the Otavi Group and the groundwater calcrete. The thermal springs showed Na-Cl facies, which may be the result of water–rock reactions at high temperatures at depth.
The groundwater quality of these springs was evaluated using the
WQI method; the measured values were compared with the Namibian Standards for the Evaluation of Drinking Water for Human Consumption and the guidelines from the World Health Organization (WHO). The majority of the springs visited in Kaokoland had excellent and good groundwater quality for drinking purposes. Nevertheless, the majority of the thermal springs had a poor water quality with respect to the Namibian Standards, but they should be considered for alternative activities (thermalism, balneotherapy). The turbidity parameter represents the main element with values above the potability threshold, due to particulate matter and potentially the presence of microorganisms. In general, fluoride, sulphate, chloride and sodium concentrations in thermal springs are higher than the reference values from the Namibian Standards for drinking water. The saturation index table presented in
Appendix B reveals that geogenic processes are the main factor affecting the groundwater quality in the study area. The very low population density can explain the low concentrations of chemicals typically related to human activities, such as nitrate and potassium. Proper filtration and treatment methods should be developed to decrease these physico-chemical parameters and to limit the products of pollution to acceptable concentrations for human consumption.
Due to climate change, more meteorological extremes are predicted, including increases in the duration and frequency of drought events; this may lead to the scarcity of water resources, especially in semi-arid countries such as Namibia. Thus, the use of groundwater, which is more resilient to hydrological extremes over longer time periods than surface water resources, will become more important, and if properly managed, monitored and protected, the springs in northwestern Namibia could become a true lifeline for local communities.
Some other basic recommendations, such as deepening the springs, installing concrete enclosures and covers and installing hand pumps, would considerably help to improve spring capture and to limit the direct pollution of the emergence point at a low cost. Monitoring and public awareness are essential to preserving both the quality and sustainability of the resource.
Due to sanitary conditions, the data were only collected during one mission. This study did not take into consideration the temporal variations of the inorganic parameters of groundwater. Even for arid countries such as Namibia that only experience two seasons (a dry season and a rainy season), it has been proven in the literature that some parameters can vary seasonally [
7,
15]. Despite the fact that this mission was undertaken during severe drought episodes, the study does not show evidence of temporal changes in the discharge flow. It would be interesting to further investigate the temporal variations of the dewatering flow rate, as well as the chemical parameters, to highlight a potential seasonal effect.
Author Contributions
Conceptualization, F.S., H.W.; methodology, H.W., F.S.; validation, H.W., E.C.G.; investigation, F.S., V.L., V.B, J.-M.F., E.C.G., H.W.; data curation, F.S.; writing—original draft preparation, F.S., H.W.; writing—review and editing, H.W.; supervision, H.W, A.D., M.F., V.B., J.-M.F., E.C.G.; funding acquisition, V.B., J.-M.F. All authors have read and agreed to the published version of the manuscript.
Funding
This project was sponsored by TotalEnergies.
Institutional Review Board Statement
Not applicable.
Informed Consent Statement
Not applicable.
Data Availability Statement
Not applicable.
Acknowledgments
The authors would like to thank the Department of Water Affairs of the Ministry of Agriculture, Water and Forestry for sharing their data. The authors would like to thank the reviewers for all their constructive and helpful comments on this manuscript.
Conflicts of Interest
The authors declare no conflict of interest.
Appendix A
PHREEQC interactive V3.4 [
54] was used to determine the saturation indices (SIs) and the equilibrium with different minerals in the groundwater. The results are shown in the following table. A positive SI indicates over-saturation of the mineral and a negative SI indicates under-saturation. An SI of 0 ± 0.15 is considered to indicate equilibrium conditions (in green).
Figure A1.
Samples were taken from 5 February to 10 February 2019. Very low precipitation values were registered at Kaoko Otavi Station (see
Figure 2 for its location) three days before.
Figure A1.
Samples were taken from 5 February to 10 February 2019. Very low precipitation values were registered at Kaoko Otavi Station (see
Figure 2 for its location) three days before.
Appendix B
Table A1.
Saturation indices for minerals calculated with PHREEQC [
54].
Table A1.
Saturation indices for minerals calculated with PHREEQC [
54].
| Saturation Indices of Minerals |
|---|
| Name | Calcite | Gypsum | Dolomite | Dolomite (d) | Quartz | Chalcedony | Fluorite | Barite | Rhodochrosite |
|---|
| Anabeb | 0.35 | −2.45 | 1.00 | 0.49 | | | −2.52 | | −1.39 |
| Eastern Opuwo | 0.28 | −2.34 | 0.60 | 0.03 | | | −1.93 | | −0.14 |
| Kaninova | 0.29 | −2.84 | 0.46 | −0.09 | 0.35 | −0.08 | | | −2.30 |
| Kaoko Otavi | 0.55 | −1.74 | 1.45 | 0.91 | | | −1.57 | | 0.09 |
| Khowarib | 0.10 | −1.29 | 0.48 | 0.00 | 0.33 | −0.05 | −0.85 | | −1.65 |
| Okakuyu | −0.08 | −2.63 | 0.07 | −0.48 | | | −2.44 | | −2.70 |
| Okorosave | 0.06 | −2.15 | 0.33 | −0.21 | 0.08 | −0.34 | −2.48 | −0.20 | −2.54 |
| Ombombo | 0.86 | −2.39 | 1.97 | 1.43 | 0.51 | 0.09 | −1.35 | 0.14 | −0.70 |
| Ongongo | −0.06 | −2.55 | 0.07 | −0.45 | | | −2.50 | | −2.64 |
| Otjerunda | 0.47 | −2.39 | 0.55 | 0.03 | 0.10 | −0.31 | −2.84 | −0.67 | −2.42 |
| Otjitunduua-01 | 0.25 | −2.73 | 0.68 | 0.15 | 0.11 | −0.30 | −2.44 | −0.55 | −2.50 |
| Otuzemba-01 | 0.17 | −2.86 | 0.44 | −0.11 | | | −2.36 | | −2.55 |
| Otuzemba-02 | 0.29 | −2.79 | 0.70 | 0.15 | | | −2.37 | | −2.45 |
| Sesfontein-01 | 0.35 | −2.74 | 0.90 | 0.38 | | | −3.12 | | −2.27 |
| Sesfontein-02 | 0.14 | −2.72 | 0.48 | −0.05 | | | −3.11 | | −2.47 |
| Sesfontein-03 | 0.38 | −2.65 | 0.95 | 0.41 | | | −3.07 | | −2.24 |
| Huab Warm TS | 0.09 | −1.75 | −1.02 | −1.50 | 0.50 | 0.13 | 0.10 | 0.02 | −0.59 |
| La Rochelle TS | 0.09 | −2.71 | 0.28 | −0.27 | 0.12 | −0.31 | | | −2.61 |
| Okangwati TS | −0.03 | −2.40 | −0.57 | −1.05 | 0.36 | −0.02 | 0.09 | −0.34 | −0.84 |
| Otjitambi TS | −0.34 | −1.53 | −1.71 | −2.20 | 0.64 | 0.26 | 0.11 | 0.02 | −1.55 |
References
- Christelis, G.; Struckmeier, W. Groundwater in Namibia—An Explanation to the Hydrogeological Map; Ministry of Agriculture, Water and Rural Development: Windhoek, Namibia, 2011; 132p.
- Aslam, R.A.; Shretha, S.; Pandey, V.P. Groundwater Vulnerability to Climate Change: A Review of the Assessment Methodology. Sci. Total Environ. 2018, 612, 853–875. [Google Scholar] [CrossRef]
- Dirkx, E.; Hager, C.; Tadross, M.; Bethune, S.; Curtis, B. Climate Change Vulnerability and Adaptation Assessment Namibia; Final Report; UNDP: New York, NY, USA, 2008. [Google Scholar]
- Ouedraogo, I.; Defourny, P.; Vanclooster, M. Mapping the Groundwater Vulnerability for Pollution at the Pan African Scale. Sci. Total Environ. 2016, 544, 939–953. [Google Scholar] [CrossRef]
- Li, P.; Karunanidhi, D.; Subramani, T.; Srinivasamoorthy, K. Sources and Consequences of Groundwater Contamination. Arch. Environ. Contam Toxicol. 2021, 80, 1–10. [Google Scholar] [CrossRef]
- McBenedict, B.; Wanke, H.; Hang’ombe, B.M.; Chimwamurombe, P.M. Bacteriological Analysis of Household Water from Hand-Dug Wells in The Cuvelai-Etosha Basin of Namibia. Int. Sci. Technol. J. Namib. 2018, 10, 23–32. [Google Scholar]
- Wanke, H.; Nakwafila, A.; Hamutoko, J.T. Hand Dug Wells in Namibia: An Underestimated Water Source or a Threat to Human Health? Phys. Chem. Earth 2014, 76, 104–113. [Google Scholar] [CrossRef]
- Eckardt, F.D.; Spiro, B. The Origin of Sulphur in Gypsum and Dissolved Sulphate in the Central Namib Desert, Namibia. Sediment. Geol. 1999, 123, 255–273. [Google Scholar] [CrossRef]
- Li, Z.; Wang, G.; Wang, X.; Wan, L.; Shi, Z.; Wanke, H.; Uugulu, S.; Uahengo, C.-I. Groundwater Quality and Associated Hydrogeochemical Processes in Northwest Namibia. J. Geochem. Explor. 2018, 186, 202–214. [Google Scholar] [CrossRef]
- Sracek, O.; Wanke, H.; Ndakunda, N.N.; Mihaljevič, M.; Buzek, F. Geochemistry and Fluoride Levels of Geothermal Springs in Namibia. J. Geochem. Explor. 2015, 148, 96–104. [Google Scholar] [CrossRef]
- Tredoux, G.; Talma, A. Nitrate Pollution of Groundwater in Southern Africa. In Groundwater Pollution in Africa; Taylor & Francis: Oxfordshire, UK, 2006; pp. 13–35. ISBN 978-0-415-41167-7. [Google Scholar]
- WHO Guidelines for Drinking-Water Quality, 4th ed.; Incorporating the 1st Addendum; WHO: Geneva, Switzerland, 2011. Available online: https://www.who.int/publications-detail-redirect/9789241549950 (accessed on 3 September 2021).
- DWA Guidelines for the Evaluation of Drinking-Water for Human Consumption with Regard to Chemical, Physical and Bacteriological Quality; Department of Water Affairs: Windhoek, Namibia, 1988; 5p.
- Ober, J.; Karwot, J.; Rusakov, S. Tap Water Quality and Habits of Its Use: A Comparative Analysis in Poland and Ukraine. Energies 2022, 15, 981. [Google Scholar] [CrossRef]
- Rabeiy, R.E. Assessment and Modeling of Groundwater Quality Using WQI and GIS in Upper Egypt Area. Environ. Sci. Pollut Res. 2018, 25, 30808–30817. [Google Scholar] [CrossRef]
- Howladar, M.F.; Al Numanbakth, M.A.; Faruque, M.O. An Application of Water Quality Index (WQI) and Multivariate Statistics to Evaluate the Water Quality around Maddhapara Granite Mining Industrial Area, Dinajpur, Bangladesh. Environ. Syst. Res. 2017, 6, 13. [Google Scholar] [CrossRef] [Green Version]
- Horton, R.K. An Index Number System for Rating Water Quality. J. Water Pollut. Control. Fed. 1965, 37, 300–306. [Google Scholar]
- Kawo, N.S.; Karuppannan, S. Groundwater Quality Assessment Using Water Quality Index and GIS Technique in Modjo River Basin, Central Ethiopia. J. Afr. Earth Sci. 2018, 147, 300–311. [Google Scholar] [CrossRef]
- Lachhab, A. Water Quality Index of Natural Streams: A Case Study of Five Headwater Streams in Bald Eagle State Forest, Pennsylvania. Am. J. Water Res. 2019, 7, 128–135. [Google Scholar] [CrossRef]
- Ober, J.; Karwot, J. Tap Water Quality: Seasonal User Surveys in Poland. Energies 2021, 14, 3841. [Google Scholar] [CrossRef]
- Mendelsohn, J.; Jarvis, A.; Robertson, T. A Profile and Atlas of the Cuvelai-Etosha Basin; Raison and Gondwana Collection: Windhoek, Namibia, 2013; 172p. [Google Scholar]
- Mendelsohn, J. Chapter 4: Surface Waters. In A Profile and Atlas of the Cuvelai-Etosha Basin; Raison and Gondwana Collection: Windhoek, Namibia, 2009; p. 25. [Google Scholar]
- Mendelsohn, J.; Jarvis, A.; Roberts, C.; Robertson, T. Atlas of Namibia: A Portrait of the Land and Its People. Cape Town; David Philip Publishers: Cape Town, South Africa, 2002. [Google Scholar]
- Cheney, C.S. Feasibility Study for Drought Relief Drilling in SE Owambo, Namibia; British Geological Survey: Keyworth, UK, 1994; p. 53. [Google Scholar]
- Kapolo, I.N. Drought Conditions and Management Strategies in Namibia; Namibia Meteorical Services: Windhoek, Namibia, 2014; 9p. [Google Scholar]
- Matas, J. In Pictures: Namibia’s Worst Drought for 30 Years. Available online: https://www.bbc.com/news/in-pictures-23614244 (accessed on 21 September 2021).
- Essa, A. Namibia Battles Worst Drought in Decades; Al Jazeera: Doha, Qatar, 2019; Available online: https://www.aljazeera.com/features/2013/10/9/namibia-battles-worst-drought-in-decades (accessed on 21 September 2021).
- FEWS NET. Poor Rainfall since Late January Strengthens Dryness across Southern Africa. Available online: https://fews.net/fr/global/global-weather-hazards/march-1-2019 (accessed on 21 September 2021).
- Shikangalah, R.N. The 2019 Drought in Namibia: An Overview. J. Namibian Stud. 2020, 27, 37–58. [Google Scholar]
- Kahiurika, N. State of Drought Emergency Extended; The Namibian: Windhoek, Namibia, 2019. [Google Scholar]
- Xinhua Namibia Experiencing Worst Drought in 90 Years, Says Official—Xinhua|English.News.Cn. Available online: http://www.xinhuanet.com/english/2019-10/02/c_138444404.htm (accessed on 21 September 2021).
- Hoffmann, K.H.; Prave, A.R. A Preliminary Note on a Revised Subdivision and Regional Correlation of the Otavi Group Based on Glaciogenic Diamictites and Associated Cap Dolostones. Commun. Geol. Surv. Namib. 1996, 11, 77–82. [Google Scholar]
- Miller, R.M. The Owambo Basin of Northern Namibia. In Sedimentary Basins of the World; Selley, R.C., Ed.; African Basins; Elsevier: Amsterdam, The Netherlands, 1997; Volume 3, pp. 237–268. [Google Scholar]
- Miller, R.M. (Ed.) The Geology of Namibia; Geological Survey of Namibia: Windhoek, Namibia, 2008; ISBN 978-0-86976-734-4. [Google Scholar]
- Miller, R.M.; Pickford, M.; Senut, B. The Geology, Paleontology and Evolution of the Etosha Pan, Namibia: Implications for Terminal Kalahari Deposition. S. Afr. J. Geol. 2010, 113, 307–334. [Google Scholar] [CrossRef]
- Encyclopedia Britannica Spring|Water. Available online: https://www.britannica.com/science/spring-water (accessed on 4 October 2021).
- Martini, J.; Marais, J.C.E.; Irish, J. Contribution à l’étude du karst et des grottes du Kaokoland (Namibie). Karstologia 1999, 34, 1–8. [Google Scholar] [CrossRef]
- Jacobson, G.; Arakel, A.V.; Yijian, C. The Central Australian Groundwater Discharge Zone: Evolution of Associated Calcrete and Gypcrete Deposits. Aust. J. Earth Sci. 1988, 35, 549–565. [Google Scholar] [CrossRef]
- Miller, R.M. Calcrete. In Groundwater in Namibia; Ministry of Agriculture, Water and Rural Development: Windhoek, Namibia, 2011; pp. 20–21. [Google Scholar]
- Goudie, A.; Viles, H. Geology. In Landscapes and Landforms of Namibia; Goudie, A., Viles, H., Eds.; World Geomorphological Landscapes; Springer: Dordrecht, The Netherlands, 2015; pp. 27–35. ISBN 978-94-017-8020-9. [Google Scholar]
- Schneider, G. The Roadside Geology of Namibia. Nat. Rundsch. 2004, 57, 294. [Google Scholar]
- Brown, R.M.; McClelland, N.I.; Deininger, R.A.; O’Connor, M.F. A Water Quality Index—Crossing the Psychological Barrier. In Proceedings of the International Conference on Water Pollution Research, Jerusalem, Israel, 19–24 June 1972; pp. 787–797. [Google Scholar]
- Sahu, P.; Sikdar, P.K. Hydrochemical Framework of the Aquifer in and around East Kolkata Wetlands, West Bengal, India. Environ. Geol. 2008, 55, 823–835. [Google Scholar] [CrossRef]
- Parkhurst, D.; Appelo, T. User’s Guide to PHREEQC Version 3—A Computer Program for Speciation, Batch-Reaction, One-Dimensional Transport, and Inverse Geochemical Calculations; U.S. Department of the Interior: Washington, DC, USA, 1999; Volume 99.
- Bäumle, R. Groundwater Investigation Oshivelo Artesian Aquifer: Results of the 2002 Drilling and Pump Test Campaign; DWA/Geohydrology: Windhoek, Namibia, 2003. [Google Scholar]
- Klock, H. Hydrogeology of the Kalahari in North-Eastern Namibia with Special Emphasis on Groundwater Recharge, Flow Modelling and Hydrochemistry; Julius-Maximilians Universität: Würzburg, Germany, 2001. [Google Scholar]
- Marchant, J.W. Hydrogeochemical Exploration at Tsumeb; University of Cape Town: Cape Town, South Africa, 1980. [Google Scholar]
- Ploethner, D.; Schmidt, G.A.; Kehrberg, S.; Geyh, M.A. German-Namibian Groundwater Exploration Project: Reports on Hydrogeologiccal and Isotope Hydrological Investigations—Vol. D-III: Hydrogeology and Isotope Hydrology of the Otavi Mountain Land and Its Surroundings (Karst_01 and Karst_02); DWA & BGR: Windhoek, Namibia, 1997; p. 65. [Google Scholar]
- Waring, G.A.; Blankenship, R.R.; Bentall, R. Thermal Springs of the United States and Other Countries: A Summary; U.S. Government Printing Office: Washington, DC, USA, 1965.
- Lahlou Mimi, A.; Ben Dhia, H.; Bouri, S.; Lahrach, A.; Ben Abidate, L.; Bouchareb-Haouchim, F.-Z. Application of Chemical Geothermometers to Thermal Springs of the Maghreb, North Africa. Geothermics 1998, 27, 211–233. [Google Scholar] [CrossRef]
- Raju, N.J. Prevalence of Fluorosis in the Fluoride Enriched Groundwater in Semi-Arid Parts of Eastern India: Geochemistry and Health Implications. Quat. Int. 2017, 443, 265–278. [Google Scholar] [CrossRef]
- Kirchner, J.; Tredoux, G. The Stampriet Artesian Basin, with Special Reference to the Salt-Block: The Chemical Composition of the Groundwater with Respect to Geological Formations. In Proceedings of the Hardap, Stampriet Artesian Basin (SAB), Salt Block, May 1975; Hard Copy Report; Geological Survey: Reston, VA, USA; p. 16.
- Stadler, S.; Talma, A.S.; Tredoux, G.; Wrabel, J. Identification of Sources and Infiltration Regimes of Nitrate in the Semi-Arid Kalahari: Regional Differences and Implications for Groundwater Management. Water SA 2012, 38, 213–224. [Google Scholar] [CrossRef] [Green Version]
- Wrabel, J. Investigation of the Processes Leading to Nitrate Enrichment in the Kamtsas Quartzite Aquifer, Namibia. In Environmental Geology in Semi-arid Environments; DGS: Lobatse, Botswana, 2005; pp. 134–139. [Google Scholar]
| Publisher’s Note: MDPI stays neutral with regard to jurisdictional claims in published maps and institutional affiliations. |
© 2022 by the authors. Licensee MDPI, Basel, Switzerland. This article is an open access article distributed under the terms and conditions of the Creative Commons Attribution (CC BY) license (https://creativecommons.org/licenses/by/4.0/).


 ,
, 


