
Wildfire Risk Forecasting Using Weights of Evidence and Statistical Index Models


Abstract
:1. Introduction
2. Materials and Methods
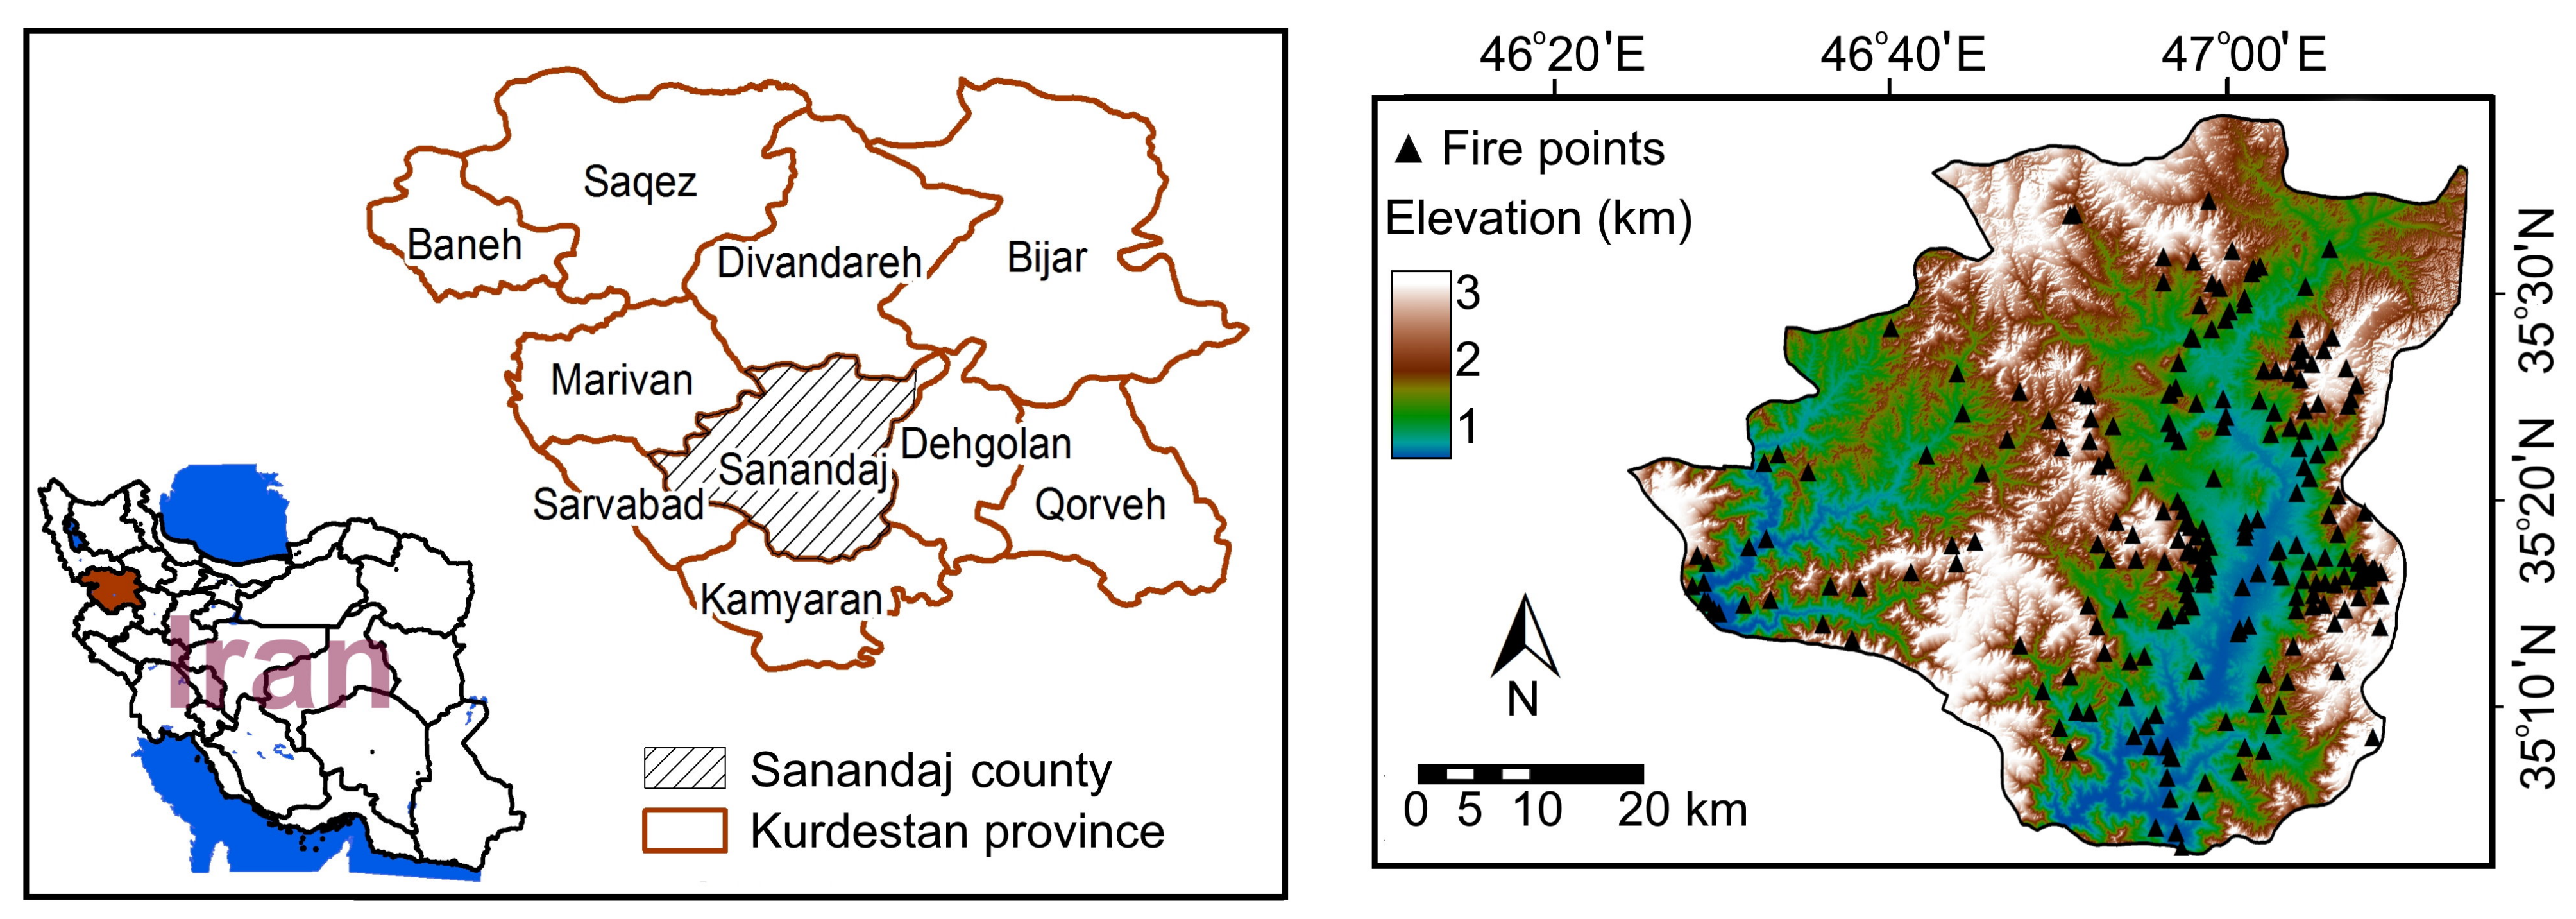
2.1. Study Region
2.2. Dataset and Preprocessing
2.3. Methods
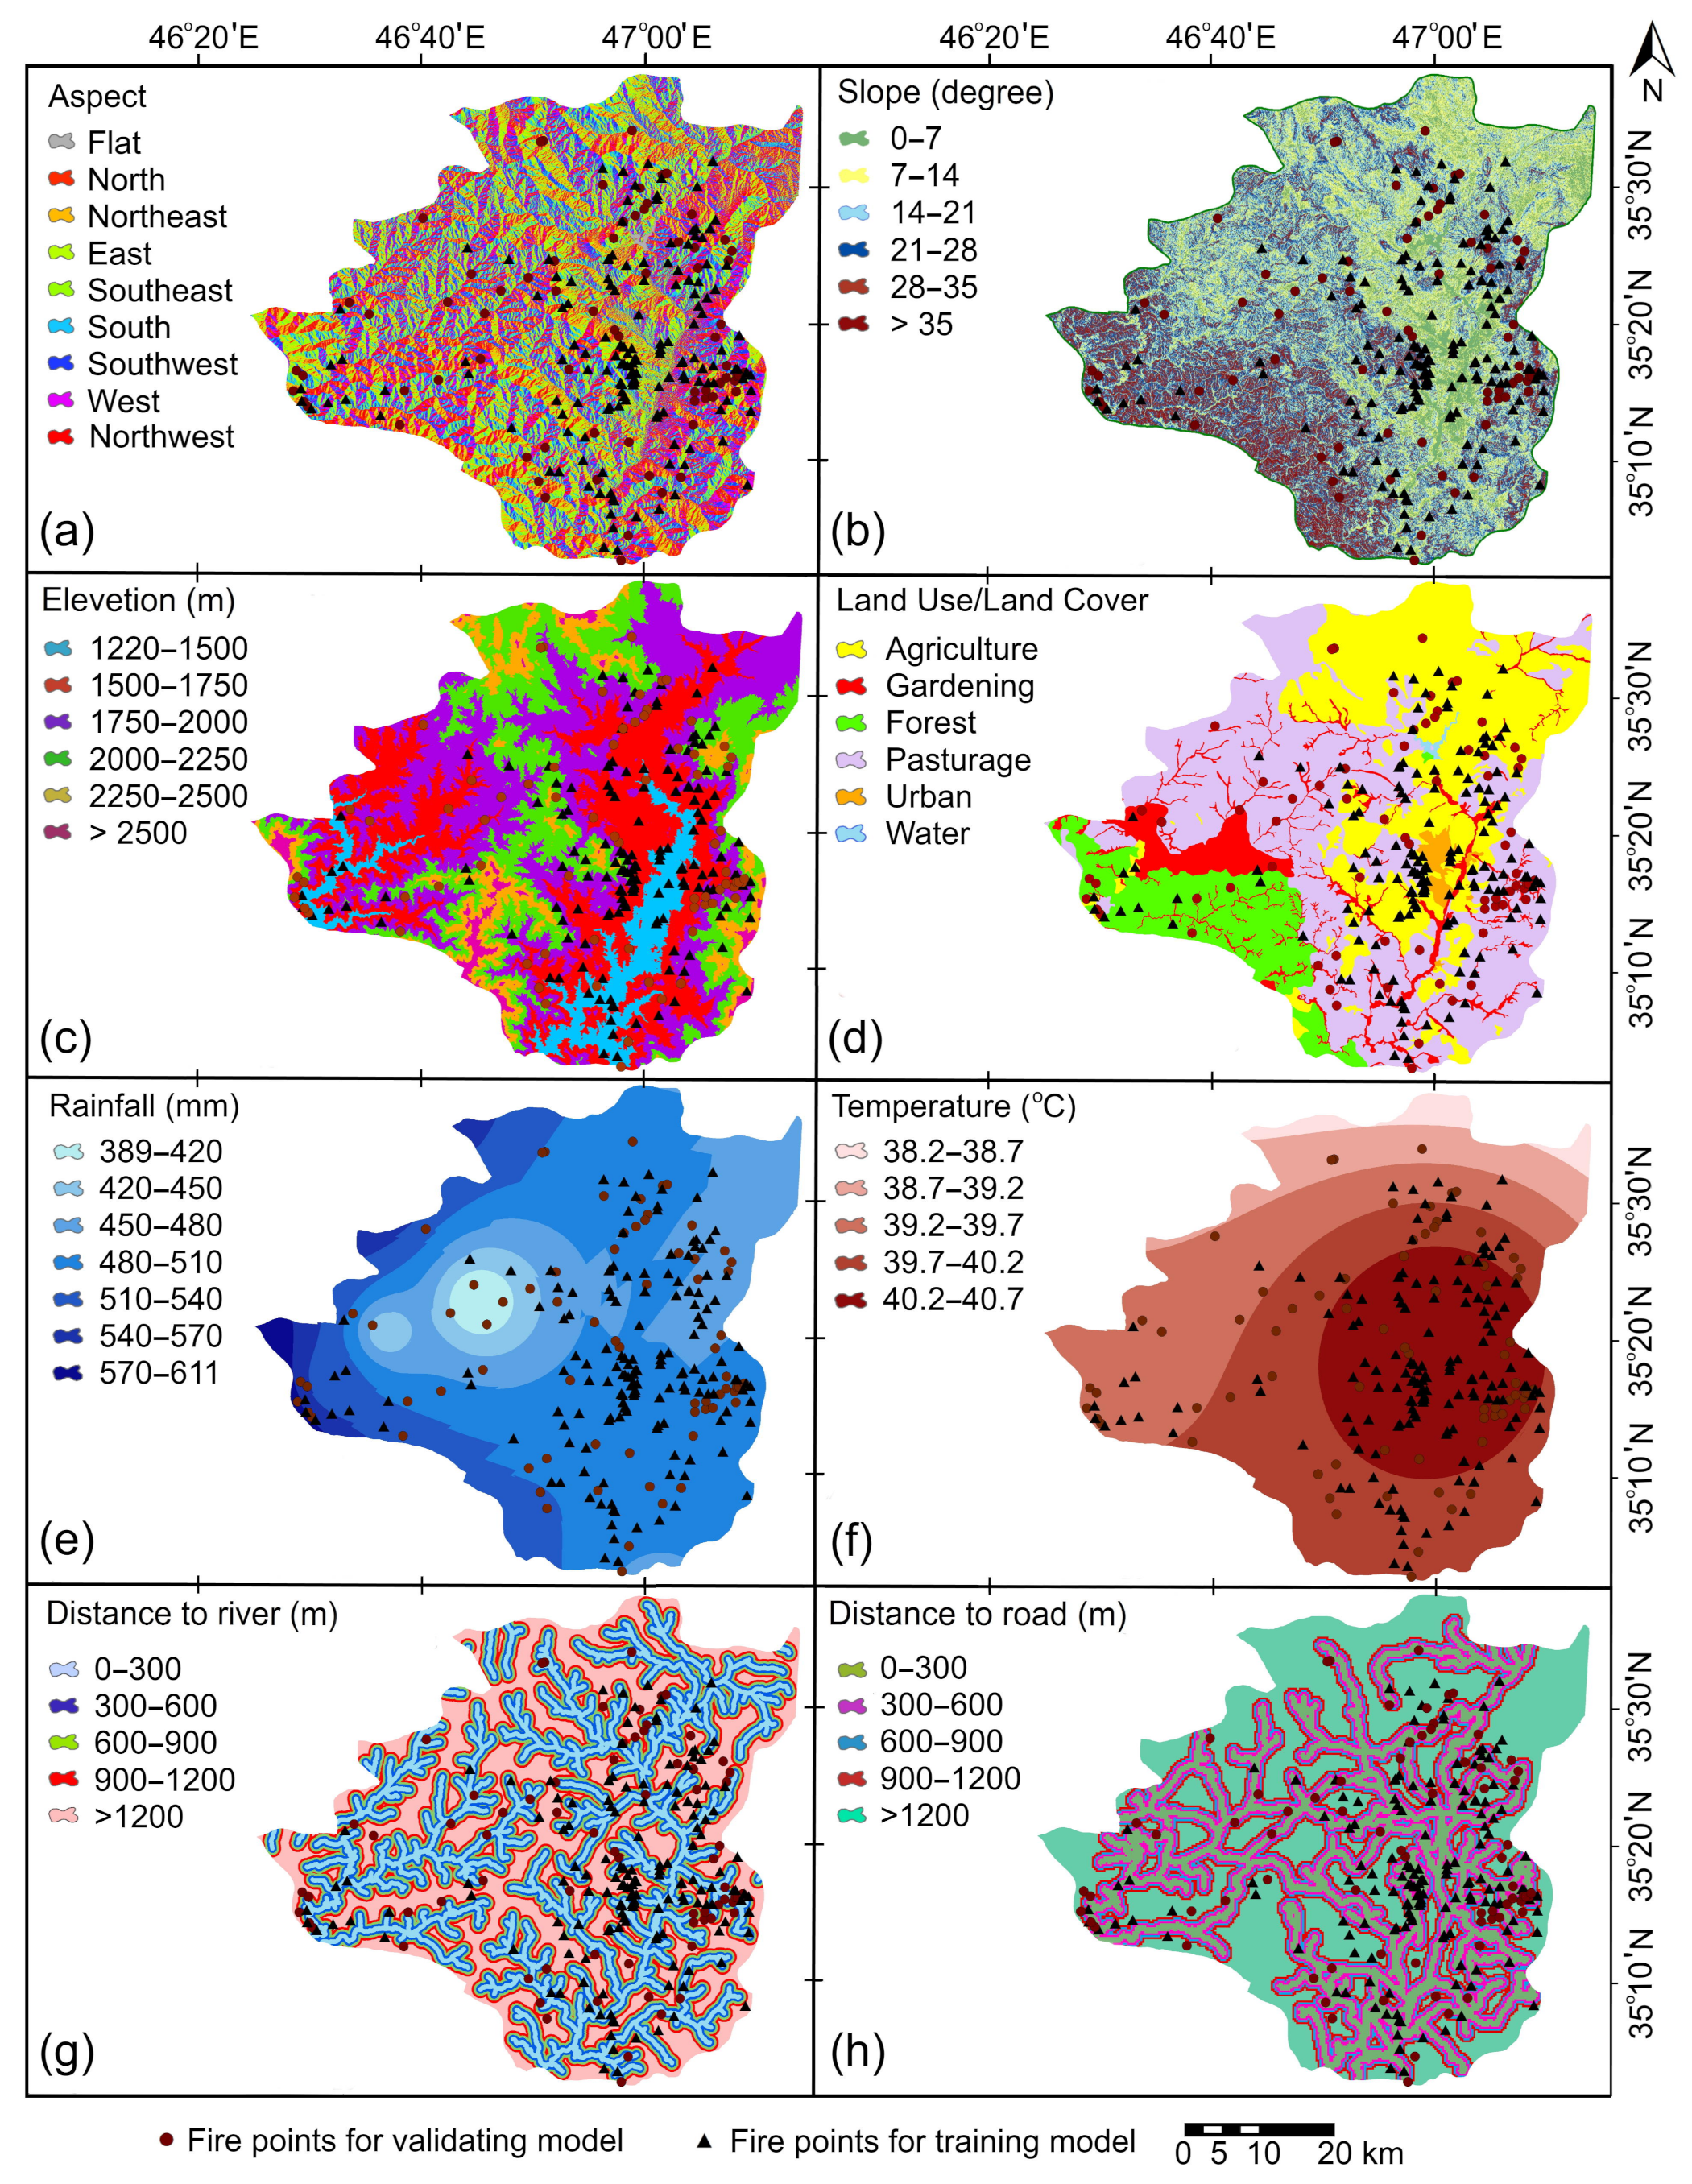
2.3.1. Maps and Layers
2.3.2. Weights of Evidence (WoE)
2.3.3. Statistical Index (SI)
2.4. Evaluation Criteria
3. Results
4. Discussion
5. Conclusions
Author Contributions
Funding
Data Availability Statement
Acknowledgments
Conflicts of Interest
Abbreviations
| ANN | Artificial Neural Network |
| AUC | Area Under the Curve |
| DEM | Digital Elevation Model |
| FDA | Functional Data Analysis |
| GIS | Geographic Information System |
| GLM | Generalized Linear Model |
| IDW | Inverse Distance Weighted |
| LULC | Land Use/Land Cover |
| ROC | Receiver Operating Characteristic |
| SI | Statistical Index |
| SVM | Support Vector Machine |
| WoE | Weights of Evidence |
References
- Wen, C.; He, B.; Quan, X.; Liu, X.; Liu, X. (Eds.) Wildfire Risk Assessment Using Multi-Source Remote Sense Derived Variables. In Proceedings of the IGARSS 2018–2018 IEEE International Geoscience and Remote Sensing Symposium, Valencia, Spain, 22–27 July 2018; IEEE: Piscataway, NJ, USA, 2018. [Google Scholar]
- Nami, M.; Jaafari, A.; Fallah, M.; Nabiuni, S. Spatial prediction of wildfire probability in the Hyrcanian ecoregion using evidential belief function model and GIS. Int. J. Environ. Sci. Technol. 2018, 15, 373–384. [Google Scholar] [CrossRef]
- Keane, R.E.; Drury, S.A.; Karau, E.C.; Hessburg, P.F.; Reynolds, K.M. A method for mapping fire hazard and risk across multiple scales and its application in fire management. Ecol. Model. 2010, 221, 2–18. [Google Scholar] [CrossRef]
- Çolak, E.; Sunar, F. Evaluation of forest fire risk in the Mediterranean Turkish forests: A case study of Menderes region, Izmir. Int. J. Disaster Risk Reduct. 2020, 45, 101479. [Google Scholar] [CrossRef]
- Ahmed, M.R.; Hassan, Q.K.; Abdollahi, M.; Gupta, A. Introducing a new remote sensing-based model for forecasting forest fire danger conditions at a four-day scale. Remote Sens. 2019, 11, 2101. [Google Scholar] [CrossRef] [Green Version]
- Sachdeva, S.; Bhatia, T.; Verma, A. GIS-based evolutionary optimized Gradient Boosted Decision Trees for forest fire susceptibility mapping. Nat. Hazards 2018, 92, 1399–1418. [Google Scholar] [CrossRef]
- Merino-de-Miguel, S.; González-Alonso, F.; Huesca, M.; Armenteras, D.; Franco, C. MODIS reflectance and active fire data for burn mapping in Colombia. Earth Interact. 2011, 15, 1–17. [Google Scholar] [CrossRef]
- Chaparro, D.; Vall-Llossera, M.; Piles, M.; Camps, A.; Rüdiger, C.; Riera-Tatché, R. Predicting the extent of wildfires using remotely sensed soil moisture and temperature trends. IEEE J. Sel. Top. Appl. Earth Obs. Remote Sens. 2016, 9, 2818–2829. [Google Scholar] [CrossRef] [Green Version]
- Ahn, Y.S.; Ryu, S.R.; Lim, J.; Lee, C.H.; Shin, J.H.; Choi, W.I.; Lee, B.; Jeong, J.-H.; An, K.W.; Seo, J.I. Effects of forest fires on forest ecosystems in eastern coastal areas of Korea and an overview of restoration projects. Landsc. Ecol. Eng. 2014, 10, 229–237. [Google Scholar] [CrossRef]
- Huebner, K.; Lindo, Z.; Lechowicz, M. Post-fire succession of collembolan communities in a northern hardwood forest. Eur. J. Soil Biol. 2012, 48, 59–65. [Google Scholar] [CrossRef]
- Fernández-García, V.; Fulé, P.Z.; Marcos, E.; Calvo, L. The role of fire frequency and severity on the regeneration of Mediterranean serotinous pines under different environmental conditions. For. Ecol. Manag. 2019, 444, 59–68. [Google Scholar] [CrossRef]
- Belcher, C.M. Fire Phenomena and the Earth System: An Interdisciplinary Guide to Fire Science; John Wiley & Sons: Hoboken, NJ, USA, 2013. [Google Scholar] [CrossRef]
- Chowdhury, E.H.; Hassan, Q.K. Operational perspective of remote sensing-based forest fire danger forecasting systems. ISPRS J. Photogramm. Remote Sens. 2015, 104, 224–236. [Google Scholar] [CrossRef]
- Ahmed, M.R.; Hassan, Q.K.; Abdollahi, M.; Gupta, A. Processing of near real time land surface temperature and its application in forecasting forest fire danger conditions. Sensors 2020, 20, 984. [Google Scholar] [CrossRef] [PubMed] [Green Version]
- Ghaderpour, E.; Vujadinovic, T. The potential of the least-squares spectral and cross-wavelet analyses for near-real-time disturbance detection within unequally spaced satellite image time series. Remote Sens. 2020, 12, 2446. [Google Scholar] [CrossRef]
- Abdollahi, M.; Hassan, Q.K.; Chowdhury, E.H.; Gupta, A. Exploring the relationships between topographical elements and forest fire occurrences in Alberta, Canada. In Remote Sensing of Hydro-Meteorological Hazards; Petropoulos, G., Islam, T., Eds.; CRC Press: Boca Raton, FL, USA, 2017; Chapter 13. [Google Scholar]
- Ager, A.A.; Vaillant, N.M.; Finney, M.A. Integrating fire behavior models and geospatial analysis for wildland fire risk assessment and fuel management planning. J. Combust. 2011, 2011, 572452. [Google Scholar] [CrossRef] [Green Version]
- Khakzad, N.; Dadashzadeh, M.; Reniers, G. Quantitative assessment of wildfire risk in oil facilities. J. Environ. Manag. 2018, 223, 433–443. [Google Scholar] [CrossRef] [PubMed]
- Ma, W.; Feng, Z.; Cheng, Z.; Chen, S.; Wang, F. Identifying forest fire driving factors and related impacts in china using random forest algorithm. Forests 2020, 11, 507. [Google Scholar] [CrossRef]
- Abdollahi, M.; Dewan, A.; Hassan, Q.K. Applicability of remote sensing-based vegetation water content in modeling lightning-caused forest fire occurrences. ISPRS Int. J. Geoinf. 2019, 8, 143. [Google Scholar] [CrossRef] [Green Version]
- Nation, Food and Agriculture Organization of the United Nations. REDD+ Reducing Emissions from Deforestation and Forest Degradation. Available online: https://www.fao.org/redd/news/detail/en/c/1399089/ (accessed on 16 March 2022).
- Calder, W.J.; Shuman, B. Extensive wildfires, climate change, and an abrupt state change in subalpine ribbon forests, Colorado. Ecology 2017, 98, 2585–2600. [Google Scholar] [CrossRef]
- Stevens-Rumann, C.S.; Kemp, K.B.; Higuera, P.E.; Harvey, B.J.; Rother, M.T.; Donato, D.C.; Morgan, P.; Veblen, T.T. Evidence for declining forest resilience to wildfires under climate change. Ecol. Lett. 2018, 21, 243–252. [Google Scholar] [CrossRef] [PubMed]
- Ardakani, A.; Valadanzooj, M.J.; Mansourian, A. Spatial analysis of fire potential in Iran different region by using RS and GIS. J. Environ. Stud. 2010, 35, 25–34. [Google Scholar]
- Jaafari, A.; Pourghasemi, H.R. Factors influencing regional-scale wildfire probability in Iran: An application of random forest and support vector machine. In Spatial Modeling in GIS and R for Earth and Environmental Sciences; Elsevier: Amsterdam, The Netherlands, 2019; pp. 607–619. [Google Scholar]
- Abdollahi, M.; Islam, T.; Gupta, A.; Hassan, Q.K. An advanced forest fire danger forecasting system: Integration of remote sensing and historical source of ignition data. Remote Sens. 2018, 10, 923. [Google Scholar] [CrossRef] [Green Version]
- Adab, H.; Kanniah, K.D.; Solaimani, K. Modeling forest fire risk in the northeast of Iran using remote sensing and GIS techniques. Nat. Hazards 2013, 65, 1723–1743. [Google Scholar] [CrossRef]
- Adab, H.; Kanniah, K.D.; Solaimani, K.; Sallehuddin, R. Modelling static fire hazard in a semi-arid region using frequency analysis. Int. J. Wildland Fire 2015, 24, 763–777. [Google Scholar] [CrossRef]
- Tao, C.; Huang, S.S.; Brown, G. The impact of festival participation on ethnic identity: The case of Yi torch festival. Event Manag. 2020, 24, 527–536. [Google Scholar] [CrossRef]
- Alkhatib, A.A. A review on forest fire detection techniques. Int. J. Distrib. Sens. Netw. 2014, 10, 1–12. [Google Scholar] [CrossRef] [Green Version]
- Talebi, K.S.; Sajedi, T.; Pourhashemi, M. Forests of Iran: A Treasure from the Past, a Hope for the Future; Springer: Dordrecht, The Netherlands; Heidelberg, Gernamy; New York, NY, USA; London, UK, 2014; p. 152. [Google Scholar] [CrossRef]
- Eskandari, S. Fire of Iranian forests, consequences, opposition methods and solutions. Hum. Environ. 2021, 19, 175–187. [Google Scholar]
- Hedayati, N.; Joneidi, H.; Ebrahimi Mohammadi, S. Fire risk assessment of Kurdistan province natural areas using statistical index method. J. Nat. Environ. 2019, 72, 403–416. [Google Scholar]
- Attarod, P.; Rostami, F.; Dolatshahi, A.; Sadeghi, S.; Amiri, G.Z.; Bayramzadeh, V. Do changes in meteorological parameters and evapotranspiration affect declining oak forests of Iran? J. For. Sci. 2016, 62, 553–561. [Google Scholar] [CrossRef] [Green Version]
- Attarod, P.; Sadeghi, S.; Pypker, T.; Bayramzadeh, V. Oak trees decline; a sign of climate variability impacts in the west of Iran. Casp. J. Environ. Sci. 2017, 15, 373–384. [Google Scholar]
- Moradi, B.; Ravanbakhsh, H.; Meshki, A.; Shabanian, N. The effect of fire on vegetation structure in Zagros forests (Case Study: Sarvabad, Kurdistan province). Iran. J. For. 2016, 8, 381–392. [Google Scholar]
- Preisler, H.K.; Ager, A. Forest-fire models. In Encyclopedia of Environmetrics; El-Shaarawi, A.H., Piegorsch, W.W., Eds.; John Wiley & Sons: Hoboken, NJ, USA, 2013. [Google Scholar] [CrossRef]
- Naderpour, M.; Rizeei, H.M.; Khakzad, N.; Pradhan, B. Forest fire induced Natech risk assessment: A survey of geospatial technologies. Reliab. Eng. Syst. Saf. 2019, 191, 106558. [Google Scholar] [CrossRef]
- Ljubomir, G.; Pamučar, D.; Drobnjak, S.; Pourghasemi, H.R. Modeling the spatial variability of forest fire susceptibility using geographical information systems and the analytical hierarchy process. In Spatial Modeling in GIS and R for Earth and Environmental Sciences; Elsevier: Amsterdam, The Netherlands, 2019; pp. 337–369. [Google Scholar]
- Sivrikaya, F.; Küçük, Ö. Modeling forest fire risk based on GIS-based analytical hierarchy process and statistical analysis in Mediterranean region. Ecol. Inform. 2022, 68, 101537. [Google Scholar] [CrossRef]
- Moayedi, H.; Mehrabi, M.; Bui, D.T.; Pradhan, B.; Foong, L.K. Fuzzy-metaheuristic ensembles for spatial assessment of forest fire susceptibility. J. Environ. Manag. 2020, 260, 109867. [Google Scholar] [CrossRef] [PubMed]
- Ramsay, J.O.; Silverman, B.W. Functional Data Analysis, 2nd ed.; Springer: New York, NY, USA, 2005. [Google Scholar]
- Achu, A.; Thomas, J.; Aju, C.; Gopinath, G.; Kumar, S.; Reghunath, R. Machine-learning modelling of fire susceptibility in a forest-agriculture mosaic landscape of southern India. Ecol. Inform. 2021, 64, 101348. [Google Scholar] [CrossRef]
- Singh, M.; Huang, Z. Analysis of forest fire dynamics, distribution and main drivers in the Atlantic Forest. Sustainability 2022, 14, 992. [Google Scholar] [CrossRef]
- de Santana, R.O.; Delgado, R.C.; Schiavetti, A. Modeling susceptibility to forest fires in the Central Corridor of the Atlantic Forest using the frequency ratio method. J. Environ. Manag. 2021, 296, 113343. [Google Scholar] [CrossRef] [PubMed]
- Hong, H.; Naghibi, S.A.; Moradi Dashtpagerdi, M.; Pourghasemi, H.R.; Chen, W. A comparative assessment between linear and quadratic discriminant analyses (LDA-QDA) with frequency ratio and weights-of-evidence models for forest fire susceptibility mapping in China. Arab. J. Geosci. 2017, 10, 167. [Google Scholar] [CrossRef]
- Abedi Gheshlaghi, H.; Feizizadeh, B.; Blaschke, T. GIS-based forest fire risk mapping using the analytical network process and fuzzy logic. J. Environ. Plan. Manag. 2020, 63, 481–499. [Google Scholar] [CrossRef]
- Sari, F. Forest fire susceptibility mapping via multi-criteria decision analysis techniques for Mugla, Turkey: A comparative analysis of VIKOR and TOPSIS. For. Ecol. Manag. 2021, 480, 118644. [Google Scholar] [CrossRef]
- Amatulli, G.; Peréz-Cabello, F.; de la Riva, J. Mapping lightning/human-caused wildfires occurrence under ignition point location uncertainty. Ecol. Model. 2007, 200, 321–333. [Google Scholar] [CrossRef]
- Tariq, A.; Shu, H.; Siddiqui, S.; Mousa, B.; Munir, I.; Nasri, A.; Waqas, H.; Lu, L.; Baqa, M.F. Forest fire monitoring using spatial-statistical and Geo-spatial analysis of factors determining forest fire in Margalla Hills, Islamabad, Pakistan. Geomat. Nat. Hazards Risk 2021, 12, 1212–1233. [Google Scholar] [CrossRef]
- Ghaderpour, E.; Pagiatakis, S.D.; Hassan, Q.K. A survey on change detection and time series analysis with applications. Appl. Sci. 2021, 11, 6141. [Google Scholar] [CrossRef]
- Lautenberger, C. Wildland fire modeling with an Eulerian level set method and automated calibration. Fire Saf. J. 2013, 62, 289–298. [Google Scholar] [CrossRef]
- Dashti, S.; Amini, J.; Ahmadi Sani, N.; Javanmard, A. Zoning areas prone to fire occurrences in the forest ecosystems of North Zagros (Case study: Sardasht forests in West Azarbaijan). J. Nat. Environ. Hazards 2022, 10, 105–126. [Google Scholar]
- Eskandari, S.; Pourghasemi, H.R.; Tiefenbacher, J.P. Relations of land cover, topography, and climate to fire occurrence in natural regions of Iran: Applying new data mining techniques for modeling and mapping fire danger. For. Ecol. Manag. 2020, 473, 118338. [Google Scholar] [CrossRef]
- Jaafari, A.; Gholami, D.M.; Zenner, E.K. A Bayesian modeling of wildfire probability in the Zagros Mountains, Iran. Ecol. Inform. 2017, 39, 32–44. [Google Scholar] [CrossRef]
- Regmi, N.R.; Giardino, J.R.; Vitek, J.D. Modeling susceptibility to landslides using the weight of evidence approach: Western Colorado, USA. Geomorphology 2010, 115, 172–187. [Google Scholar] [CrossRef]
- Jahdi, R.; Salis, M.; Darvishsefat, A.A.; Alcasena, F.; Mostafavi, M.A.; Etemad, V.; Lozano, O.M.; Spano, D. Evaluating fire modelling systems in recent wildfires of the Golestan National Park, Iran. Forestry 2016, 89, 136–149. [Google Scholar] [CrossRef] [Green Version]
- Eskandari, S.; Chuvieco, E. Fire danger assessment in Iran based on geospatial information. Int. J. Appl. Earth Obs. Geoinf. 2015, 42, 57–64. [Google Scholar] [CrossRef]
- Forests, Range, and Watershed Management Organization. Area and vegetation Map. Area of Natural Resources Areas by Provinces. Available online: https://frw.ir/ (accessed on 16 March 2022).
- Alvares, C.A.; Stape, J.L.; Sentelhas, P.C.; Gonçalves, J.d.M.; Sparovek, G. Köppen’s climate classification map for Brazil. Meteorol. Z. 2013, 22, 711–728. [Google Scholar] [CrossRef]
- NASA Earth Data—Alaska Satellite Facility (ASF). Available online: https://vertex.daac.asf.alaska.edu/ (accessed on 16 March 2022).
- Whelan, R. The Ecology of Fire; Cambridge University Press: Cambridge, UK, 1995; p. 346. [Google Scholar]
- Balzter, H.; Gerard, F.F.; George, C.T.; Rowland, C.S.; Jupp, T.E.; McCallum, I.; Shvidenko, A.; Nilsson, S.; Sukhinin, A.; Onuchin, A. Impact of the Arctic Oscillation pattern on interannual forest fire variability in Central Siberia. Geophys. Res. Lett. 2005, 32, L14709. [Google Scholar] [CrossRef] [Green Version]
- Carrara, A.; Crosta, G.; Frattini, P. Geomorphological and historical data in assessing landslide hazard. Earth Surf. Process. Landforms 2003, 28, 1125–1142. [Google Scholar] [CrossRef]
- Roodposhti, M.S.; Safarrad, T.; Shahabi, H. Drought sensitivity mapping using two one-class support vector machine algorithms. Atmos. Res. 2017, 193, 73–82. [Google Scholar] [CrossRef]
- Zhang, K.; Wu, X.; Niu, R.; Yang, K.; Zhao, L. The assessment of landslide susceptibility mapping using random forest and decision tree methods in the Three Gorges Reservoir area, China. Environ. Earth Sci. 2017, 76, 1–20. [Google Scholar] [CrossRef]
- Dube, F.; Nhapi, I.; Murwira, A.; Gumindoga, W.; Goldin, J.; Mashauri, D. Potential of weight of evidence modelling for gully erosion hazard assessment in Mbire District–Zimbabwe. Phys. Chem. Earth. Parts A/B/C 2014, 67, 145–152. [Google Scholar] [CrossRef]
- Song, K.-Y.; Oh, H.-J.; Choi, J.; Park, I.; Lee, C.; Lee, S. Prediction of landslides using ASTER imagery and data mining models. Adv. Space Res. 2012, 49, 978–993. [Google Scholar] [CrossRef]
- van Westen, C.J. Statistical Landslide Hazard Analysis, ILWIS 2.1 for Windows Application Guide; ITC Publication: Enschede, The Netherlands, 1997; pp. 73–84. [Google Scholar]
- Liuzzo, L.; Sammartano, V.; Freni, G. Comparison between different distributed methods for flood susceptibility mapping. Water Resour. Manag. 2019, 33, 3155–3173. [Google Scholar] [CrossRef]
- Pontius, R.G., Jr.; Schneider, L.C. Land-cover change model validation by an ROC method for the Ipswich watershed, Massachusetts, USA. Agric. Ecosyst. Environ. 2001, 85, 239–248. [Google Scholar] [CrossRef]
- Mukaka, M.M. A guide to appropriate use of correlation coefficient in medical research. Malawi Med. J. 2012, 24, 69–71. [Google Scholar] [PubMed]
- Hinkle, D.; Wiersma, W.; Jurs, S. Applied Statistics for the Behavioral Sciences; Houghton Mifflin: Boston, MA, USA, 2003; Volume 663. [Google Scholar]
- Jin, X.-Y.; Jin, H.-J.; Iwahana, G.; Marchenko, S.S.; Luo, D.-L.; Li, X.-Y.; Liang, S.-H. Impacts of climate-induced permafrost degradation on vegetation: A review. Adv. Clim. Chang. Res. 2021, 12, 29–47. [Google Scholar] [CrossRef]
- Schmidt, I.B.; Moura, L.C.; Ferreira, M.C.; Eloy, L.; Sampaio, A.B.; Dias, P.A.; Berlinck, C.N. Fire management in the Brazilian savanna: First steps and the way forward. J. Appl. Ecol. 2018, 55, 2094–2101. [Google Scholar] [CrossRef] [Green Version]
- Kayet, N.; Chakrabarty, A.; Pathak, K.; Sahoo, S.; Dutta, T.; Hatai, B.K. Comparative analysis of multi-criteria probabilistic FR and AHP models for forest fire risk (FFR) mapping in Melghat Tiger Reserve (MTR) forest. J. For. Res. 2020, 31, 565–579. [Google Scholar] [CrossRef]
- Hong, H.; Jaafari, A.; Zenner, E.K. Predicting spatial patterns of wildfire susceptibility in the Huichang County, China: An integrated model to analysis of landscape indicators. Ecol. Indic. 2019, 101, 878–891. [Google Scholar] [CrossRef]
- Koutsias, N.; Xanthopoulos, G.; Founda, D.; Xystrakis, F.; Nioti, F.; Pleniou, M.; Mallinis, G.; Arianoutsou, M. On the relationships between forest fires and weather conditions in Greece from long-term national observations (1894–2010). Int. J. Wildland Fire 2012, 22, 493–507. [Google Scholar] [CrossRef] [Green Version]
- Wu, Z.; He, H.S.; Yang, J.; Liang, Y. Defining fire environment zones in the boreal forests of northeastern China. Sci. Total Environ. 2015, 518, 106–116. [Google Scholar] [CrossRef] [PubMed]
- Balch, J.K.; Brando, P.M.; Nepstad, D.C.; Coe, M.T.; Silvério, D.; Massad, T.J.; Davidson, E.A.; Lefebvre, P.; Oliveira-Santos, C.; Rocha, W. The susceptibility of southeastern Amazon forests to fire: Insights from a large-scale burn experiment. Bioscience 2015, 65, 893–905. [Google Scholar] [CrossRef] [Green Version]
- Cawson, J.G.; Duff, T.J.; Tolhurst, K.G.; Baillie, C.C.; Penman, T.D. Fuel moisture in Mountain Ash forests with contrasting fire histories. For. Ecol. Manag. 2017, 400, 568–577. [Google Scholar] [CrossRef]
- Juliev, M.; Mergili, M.; Mondal, I.; Nurtaev, B.; Pulatov, A.; Hübl, J. Comparative analysis of statistical methods for landslide susceptibility mapping in the Bostanlik District, Uzbekistan. Sci. Total Environ. 2019, 653, 801–814. [Google Scholar] [CrossRef] [PubMed]
- Eugenio, F.C.; dos Santos, A.R.; Fiedler, N.C.; Ribeiro, G.A.; da Silva, A.G.; dos Santos, Á.B.; Paneto, G.G.; Schettino, V.R. Applying GIS to develop a model for forest fire risk: A case study in Espírito Santo, Brazil. J. Environ. Manag. 2016, 173, 65–71. [Google Scholar] [CrossRef] [PubMed]
- Catry, F.; Rego, F.; Moreira, F.; Fernandes, P.; Pausas, J. Post-fire tree mortality in mixed forests of central Portugal. For. Ecol. Manag. 2010, 260, 1184–1192. [Google Scholar] [CrossRef] [Green Version]
- Martínez-Fernández, J.; Chuvieco, E.; Koutsias, N. Modelling long-term fire occurrence factors in Spain by accounting for local variations with geographically weighted regression. Nat. Hazards Earth Syst. Sci. 2013, 13, 311–327. [Google Scholar] [CrossRef]


| Factor | Class | Pixels (%) | Fire (%) | ||||
|---|---|---|---|---|---|---|---|
| Aspect | Flat | 0.00 | 0.00 | 0.00 | 0.00 | 0.00 | 0.00 |
| North | 0.11 | 0.12 | 0.06 | −0.01 | 0.07 | 1.06 | |
| Northeast | 0.12 | 0.12 | −0.04 | 0.01 | −0.04 | 0.96 | |
| East | 0.13 | 0.14 | 0.12 | −0.02 | 0.14 | 1.13 | |
| Southeast | 0.13 | 0.19 | 0.36 | −0.07 | 0.43 | 1.43 | |
| South | 0.13 | 0.10 | −0.28 | 0.04 | −0.31 | 0.76 | |
| Southwest | 0.14 | 0.13 | −0.10 | 0.02 | −0.12 | 0.90 | |
| West | 0.13 | 0.09 | −0.30 | 0.04 | −0.34 | 0.74 | |
| Northwest | 0.11 | 0.12 | 0.05 | −0.01 | 0.06 | 1.05 | |
| Slope (degree) | 0–7 | 0.13 | 0.18 | 0.34 | −0.06 | 0.41 | 1.35 |
| 7–14 | 0.24 | 0.22 | −0.09 | 0.03 | −0.12 | 0.87 | |
| 14–21 | 0.28 | 0.23 | −0.23 | 0.08 | −0.30 | 0.76 | |
| 21–28 | 0.23 | 0.24 | 0.04 | −0.01 | 0.05 | 0.99 | |
| 28–35 | 0.12 | 0.13 | 0.12 | −0.02 | 0.14 | 1.08 | |
| >35 | 0.04 | 0.05 | 0.04 | 0.00 | 0.04 | 0.99 | |
| Elevation (m) | 1218–1500 | 0.08 | 0.17 | 0.73 | −0.10 | 0.83 | 2.07 |
| 1500–1750 | 0.27 | 0.38 | 0.32 | −0.15 | 0.47 | 1.37 | |
| 1750–2000 | 0.33 | 0.23 | −0.34 | 0.13 | −0.47 | 0.71 | |
| 2000–2250 | 0.22 | 0.19 | −0.12 | 0.03 | −0.16 | 0.88 | |
| 2250–2500 | 0.08 | 0.03 | −1.08 | 0.06 | −1.13 | 0.34 | |
| >2500 | 0.02 | 0.00 | 0.00 | 0.02 | −0.02 | 0.00 | |
| Distance to river (m) | 0–300 | 0.38 | 0.22 | −0.53 | 0.22 | −0.75 | 1.02 |
| 300–600 | 0.27 | 0.15 | −0.57 | 0.15 | −0.73 | 0.80 | |
| 600–900 | 0.17 | 0.19 | 0.11 | −0.02 | 0.13 | 1.10 | |
| 900–1200 | 0.11 | 0.13 | 0.16 | −0.02 | 0.18 | 0.90 | |
| >1200 | 0.07 | 0.30 | 1.50 | −0.29 | 1.79 | 1.12 | |
| Distance to road (m) | 0–300 | 0.24 | 0.39 | 0.50 | −0.23 | 0.73 | 1.65 |
| 300–600 | 0.16 | 0.22 | 0.31 | −0.07 | 0.38 | 1.36 | |
| 600–900 | 0.10 | 0.09 | −0.02 | 0.00 | −0.02 | 0.98 | |
| 900–1200 | 0.11 | 0.08 | −0.39 | 0.04 | −0.43 | 0.68 | |
| 1200–10,600 | 0.39 | 0.22 | −0.60 | 0.25 | −0.85 | 0.55 | |
| LULC | Agriculture | 0.31 | 0.40 | 0.24 | −0.13 | 0.37 | 1.26 |
| Gardening | 0.10 | 0.09 | −0.14 | 0.01 | −0.16 | 0.87 | |
| Forest | 0.12 | 0.04 | −0.97 | 0.08 | −1.05 | 0.38 | |
| Pasturage | 0.45 | 0.44 | −0.03 | 0.02 | −0.05 | 0.97 | |
| Urban | 0.01 | 0.03 | 0.88 | −0.02 | 0.90 | 2.41 | |
| Water | 0.00 | 0.00 | 0.00 | 0.00 | 0.00 | 0.00 | |
| Rainfall (mm) | 389–420 | 0.02 | 0.00 | 0.00 | 0.02 | −0.02 | 0.00 |
| 420–450 | 0.05 | 0.02 | −1.01 | 0.03 | −1.04 | 0.36 | |
| 450–480 | 0.24 | 0.22 | −0.11 | 0.03 | −0.14 | 0.90 | |
| 480–510 | 0.52 | 0.71 | 0.31 | −0.51 | 0.82 | 1.37 | |
| 510–540 | 0.14 | 0.03 | −1.43 | 0.12 | −1.54 | 0.24 | |
| 540–570 | 0.03 | 0.02 | −0.41 | 0.01 | −0.42 | 0.66 | |
| 570–611 | 0.01 | 0.01 | −0.49 | 0.00 | −0.50 | 0.61 | |
| Temperature (C) | 38.18–38.7 | 0.03 | 0.00 | 0.00 | 0.03 | −0.03 | 0.00 |
| 38.7–39.2 | 0.09 | 0.00 | 0.00 | 0.10 | −0.1 | 0.00 | |
| 39.2–39.7 | 0.26 | 0.23 | −0.13 | 0.04 | −0.17 | 0.66 | |
| 39.7–40.2 | 0.36 | 0.10 | −1.29 | 0.35 | −1.64 | 0.21 | |
| 40.2–40.7 | 0.25 | 0.67 | 0.98 | −0.81 | 1.79 | 1.99 |
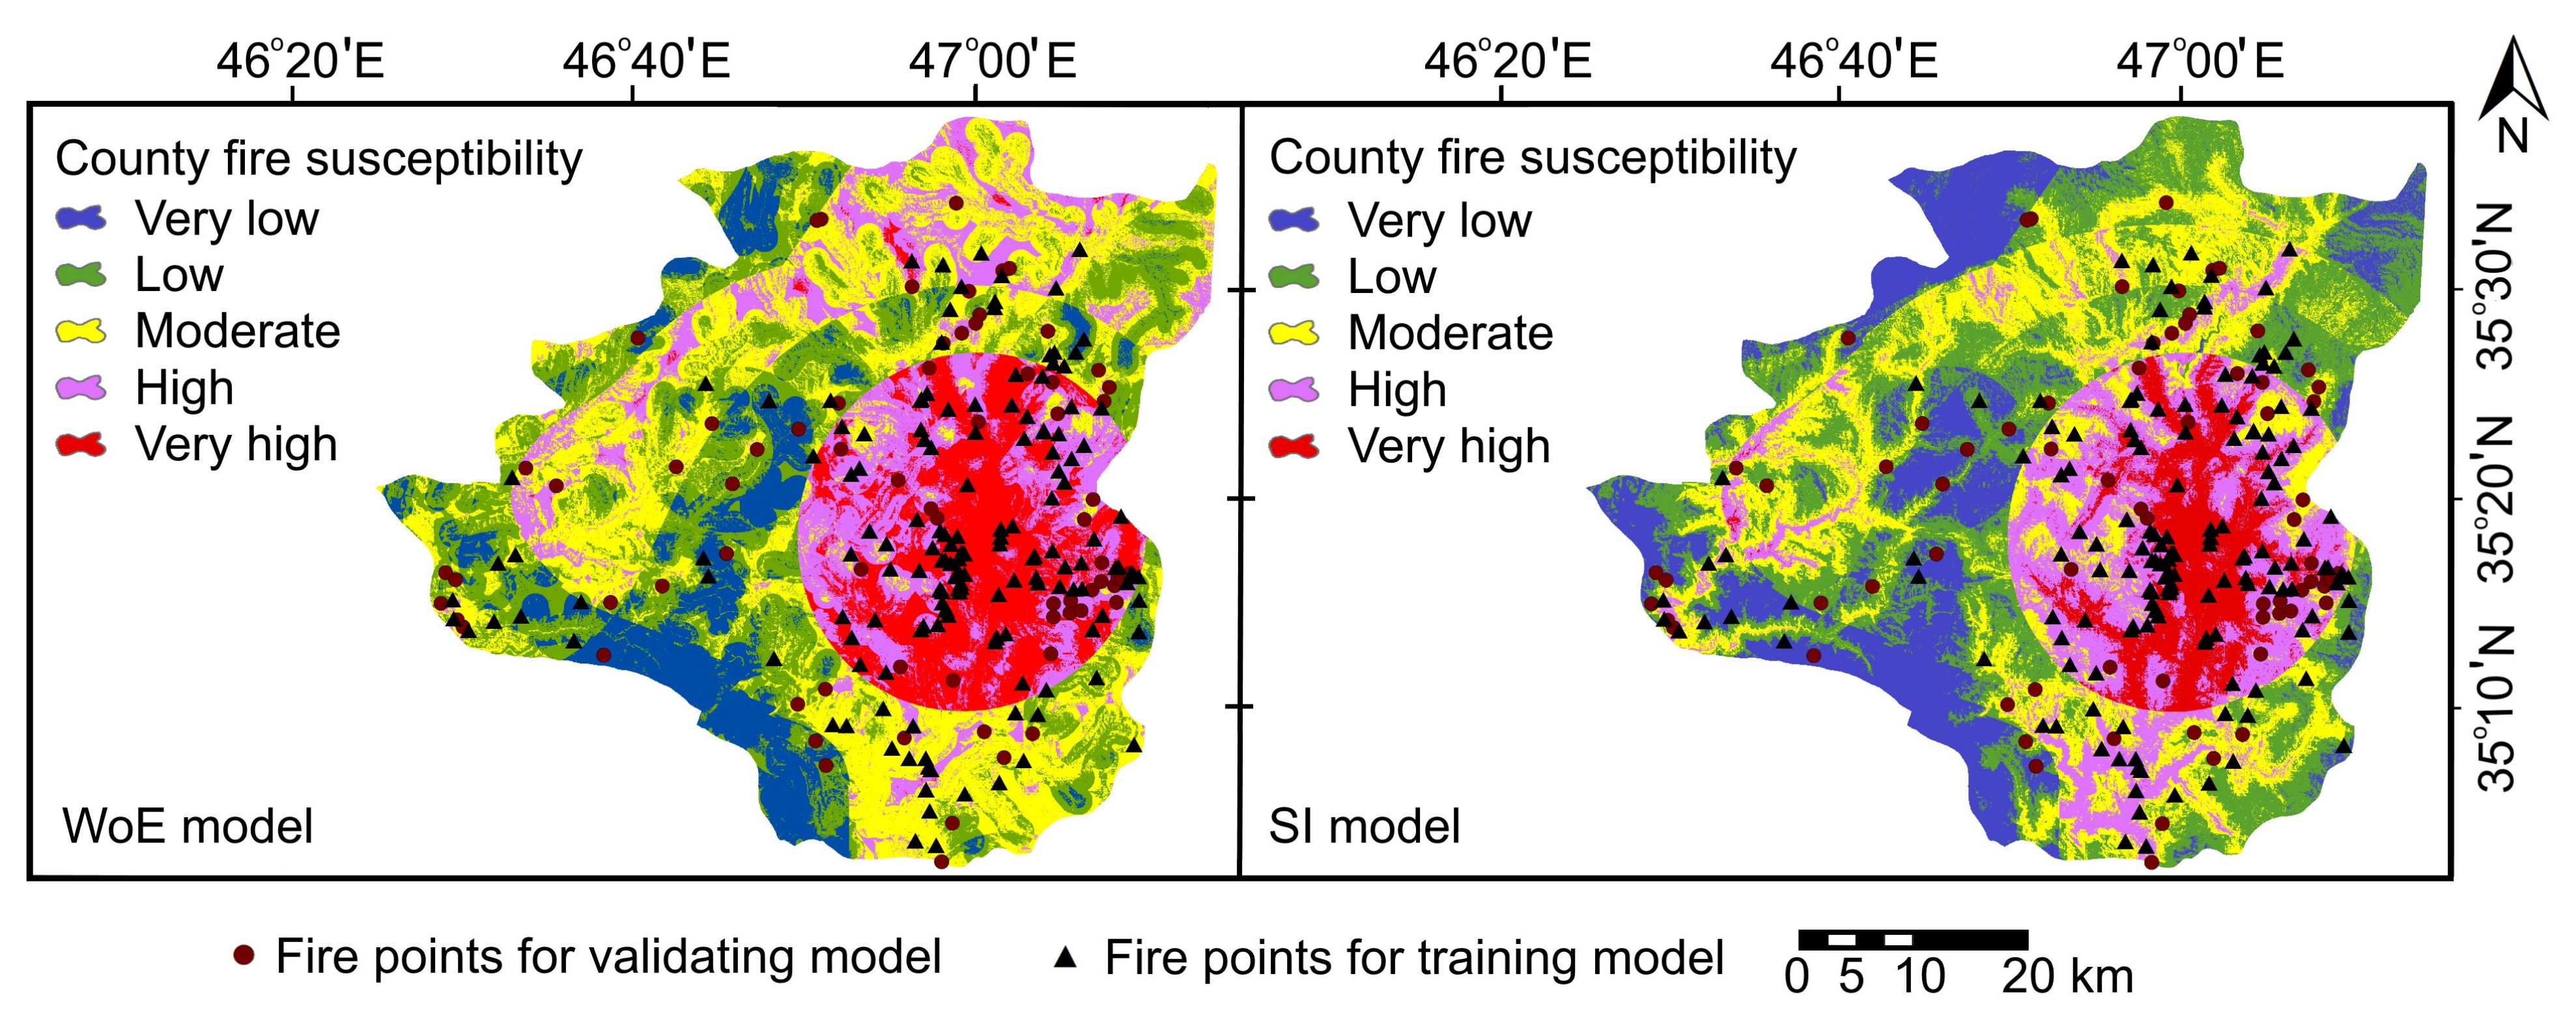
| Classes | WoE Area (ha) | WoE Area (%) | SI Area (ha) | SI Area (%) |
|---|---|---|---|---|
| Very low | 34,751 | 11.79 | 51,340 | 17.42 |
| Low | 74,398 | 25.25 | 87,895 | 29.83 |
| Moderate | 88,162 | 29.92 | 76,487 | 25.96 |
| High | 56,852 | 19.29 | 54,119 | 18.37 |
| Very high | 40,504 | 13.75 | 24,825 | 8.42 |
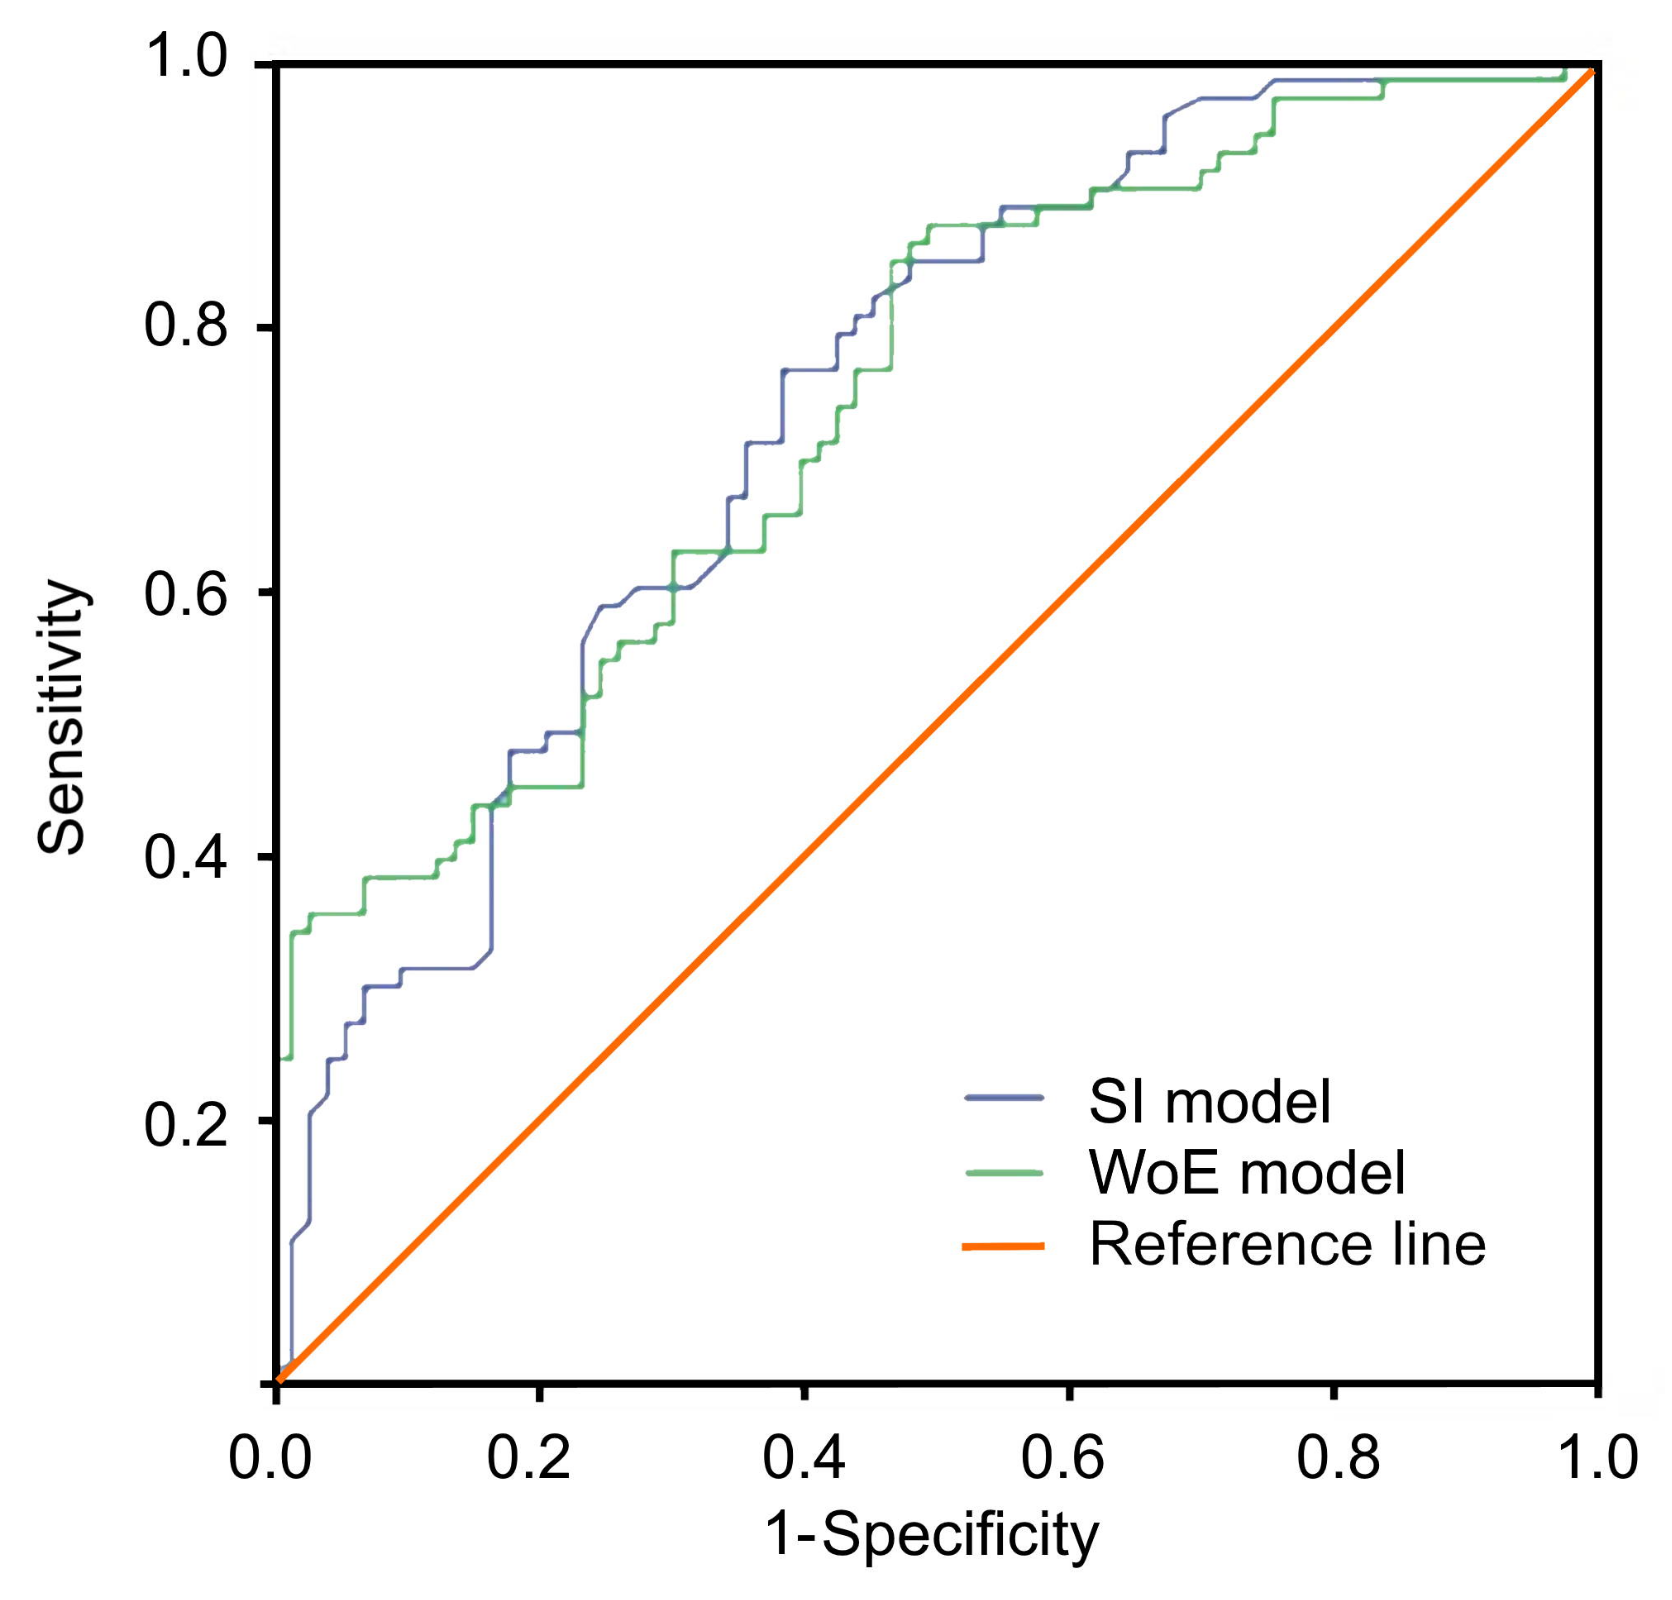
| Validation Data | Prediction Model |
|---|---|
| WoE | 0.741 |
| SI | 0.739 |
Publisher’s Note: MDPI stays neutral with regard to jurisdictional claims in published maps and institutional affiliations. |
© 2022 by the authors. Licensee MDPI, Basel, Switzerland. This article is an open access article distributed under the terms and conditions of the Creative Commons Attribution (CC BY) license (https://creativecommons.org/licenses/by/4.0/).
Share and Cite
Salavati, G.; Saniei, E.; Ghaderpour, E.; Hassan, Q.K. Wildfire Risk Forecasting Using Weights of Evidence and Statistical Index Models. Sustainability 2022, 14, 3881. https://doi.org/10.3390/su14073881
Salavati G, Saniei E, Ghaderpour E, Hassan QK. Wildfire Risk Forecasting Using Weights of Evidence and Statistical Index Models. Sustainability. 2022; 14(7):3881. https://doi.org/10.3390/su14073881
Chicago/Turabian StyleSalavati, Ghafar, Ebrahim Saniei, Ebrahim Ghaderpour, and Quazi K. Hassan. 2022. "Wildfire Risk Forecasting Using Weights of Evidence and Statistical Index Models" Sustainability 14, no. 7: 3881. https://doi.org/10.3390/su14073881
APA StyleSalavati, G., Saniei, E., Ghaderpour, E., & Hassan, Q. K. (2022). Wildfire Risk Forecasting Using Weights of Evidence and Statistical Index Models. Sustainability, 14(7), 3881. https://doi.org/10.3390/su14073881