Communication

Dietary Choices Impact on Greenhouse Gas Emissions: Determinants and Correlates in a Sample of Adults from Eastern Germany

by
Liselot Koelman
1,2,
Inge Huybrechts
3,
Sander Biesbroek
4,
Pieter van ‘t Veer
4,
Matthias B. Schulze
1,2 and
Krasimira Aleksandrova
5,6,*
1
Department of Molecular Epidemiology, German Institute of Human Nutrition Potsdam-Rehbruecke (DIFE), 14558 Nuthetal, Germany
2
Institute of Nutritional Science, University of Potsdam, 14469 Potsdam, Germany
3
Nutrition and Metabolism Section, International Agency for Research on Cancer, 69008 Lyon, France
4
Division of Human Nutrition and Health, Wageningen University and Research, 6708 PB Wageningen, The Netherlands
5
Department of Epidemiological Methods and Etiological Research, Leibniz Institute for Prevention Research and Epidemiology (BIPS), 28359 Bremen, Germany
6
Faculty of Human and Health Sciences, University of Bremen, 28359 Bremen, Germany
*
Author to whom correspondence should be addressed.
Sustainability 2022, 14(7), 3854; https://doi.org/10.3390/su14073854
Submission received: 28 February 2022 / Revised: 11 March 2022 / Accepted: 14 March 2022 / Published: 24 March 2022
(This article belongs to the Special Issue Sustainable Food Systems, Nutrition, and Health)

Abstract

:
The present study estimated diet-related greenhouse gas emissions (GHGE) and land use (LU) in a sample of adults, examined main dietary contributors of GHGE, and evaluated socio demographic, lifestyle, and wellbeing factors as potential determinants of high environmental impact. A cross-sectional design based on data collected from the European Prospective Investigation into Cancer and Nutrition (EPIC)—Potsdam cohort (2010–2012) was used. Usual diet was assessed using food frequency questionnaires. Diet-related GHGE and LU were calculated using a European-average lifecycle analyses-food-item database (SHARP-ID). Information on potential determinants were collected using self-administered questionnaires. Men (n = 404) and women (n = 401) at an average age of 66.0 ± 8.4 years were included. Dietary-related energy-adjusted GHGE in men was 6.6 ± 0.9 and in women was 7.0 ± 1.1 kg CO2 eq per 2000 kcal. LU in men was 7.8 ± 1.2 and in women was 7.7 ± 1.2 m2/year per 2000 kcal. Food groups contributing to most GHGE included dairy, meat and non-alcoholic beverages. Among women, being single, having a job, being a smoker and having higher BMI were characteristics associated with higher GHGE, whereas for men these included being married, longer sleeping duration and higher BMI. Further studies are warranted to provide insights into population-specific determinants of sustainable dietary choices.

1. Introduction

Climate change has been identified as one of the biggest global health and food security threats of the 21st century [1]. Food production is among the main contributors to the increases in greenhouse gas emissions (GHGE) that drive global climate change [2]. In fact, worldwide and in Europe, emissions from the food supply chain contribute to an estimated 21–37% of total GHGE [1]. With rising urbanization, the GHGE contribution is expected to increase as populations shift to diets higher in animal products [3,4]. As such, a transformation to healthy diets, consisting of diverse plant-based foods and low amounts of animal-based foods, from sustainable food systems is necessary to achieve the UN Sustainable Development Goals [5]. Achieving this will require shifts towards sustainable diets, an emerging direction within the field of public health nutrition. In this context, the Food and Agriculture Organization of the United Nations (FAO) defined sustainable diets as those “protective and respectful of biodiversity and ecosystems, culturally acceptable, accessible, economically fair and affordable; nutritionally adequate, safe and healthy; while optimizing natural and human resources” [6].
In order to allow the development of policies towards transitioning to more environmentally sustainable diets, there is a need to evaluate the existing status quo of consumption patterns and identify main contributors to high environmental footprint in various population groups. The necessary dietary changes from current diets to sustainable diets differ greatly by region [5]. In Germany, the consumption of meat—a significant contributor to diet-related GHGE—is especially high: 16 kg per person per year higher than the European Union average [7,8]. Under new targets, Germany aims to reduce GHGE by at least 65% by 2030 from 1990 levels [9], and therefore the regular consumption of meat and animal-sourced products is not compatible with climate objectives [10].
Over the years, several studies have provided estimations of diet-related environmental indicators in Germany [11,12,13,14,15]. Studies have used differing dietary data, including data from National Nutrition Surveys (NNS) I and II, representative of people living in the former Federal Republic of Western Germany (1985–1989) and the reunified country (2006). So far, no studies have evaluated potential determinants of dietary choices in people living in the former East Germany. Yet, these populations may be of special interest as economic changes after the reunification have influenced dietary choices and lifestyle patterns that still remain years after [16,17], including higher obesity rates among elderly, higher smoking rates among women, and lower participation in sports among adolescents [16,18].
We therefore aimed to estimate diet-related GHGE and land use (LU) in a population sample of older-aged adults living in eastern Germany and to examine main dietary contributors and socio-demographic, lifestyle, and wellbeing-related factors as potential determinants of high environmental impact.

2. Materials and Methods

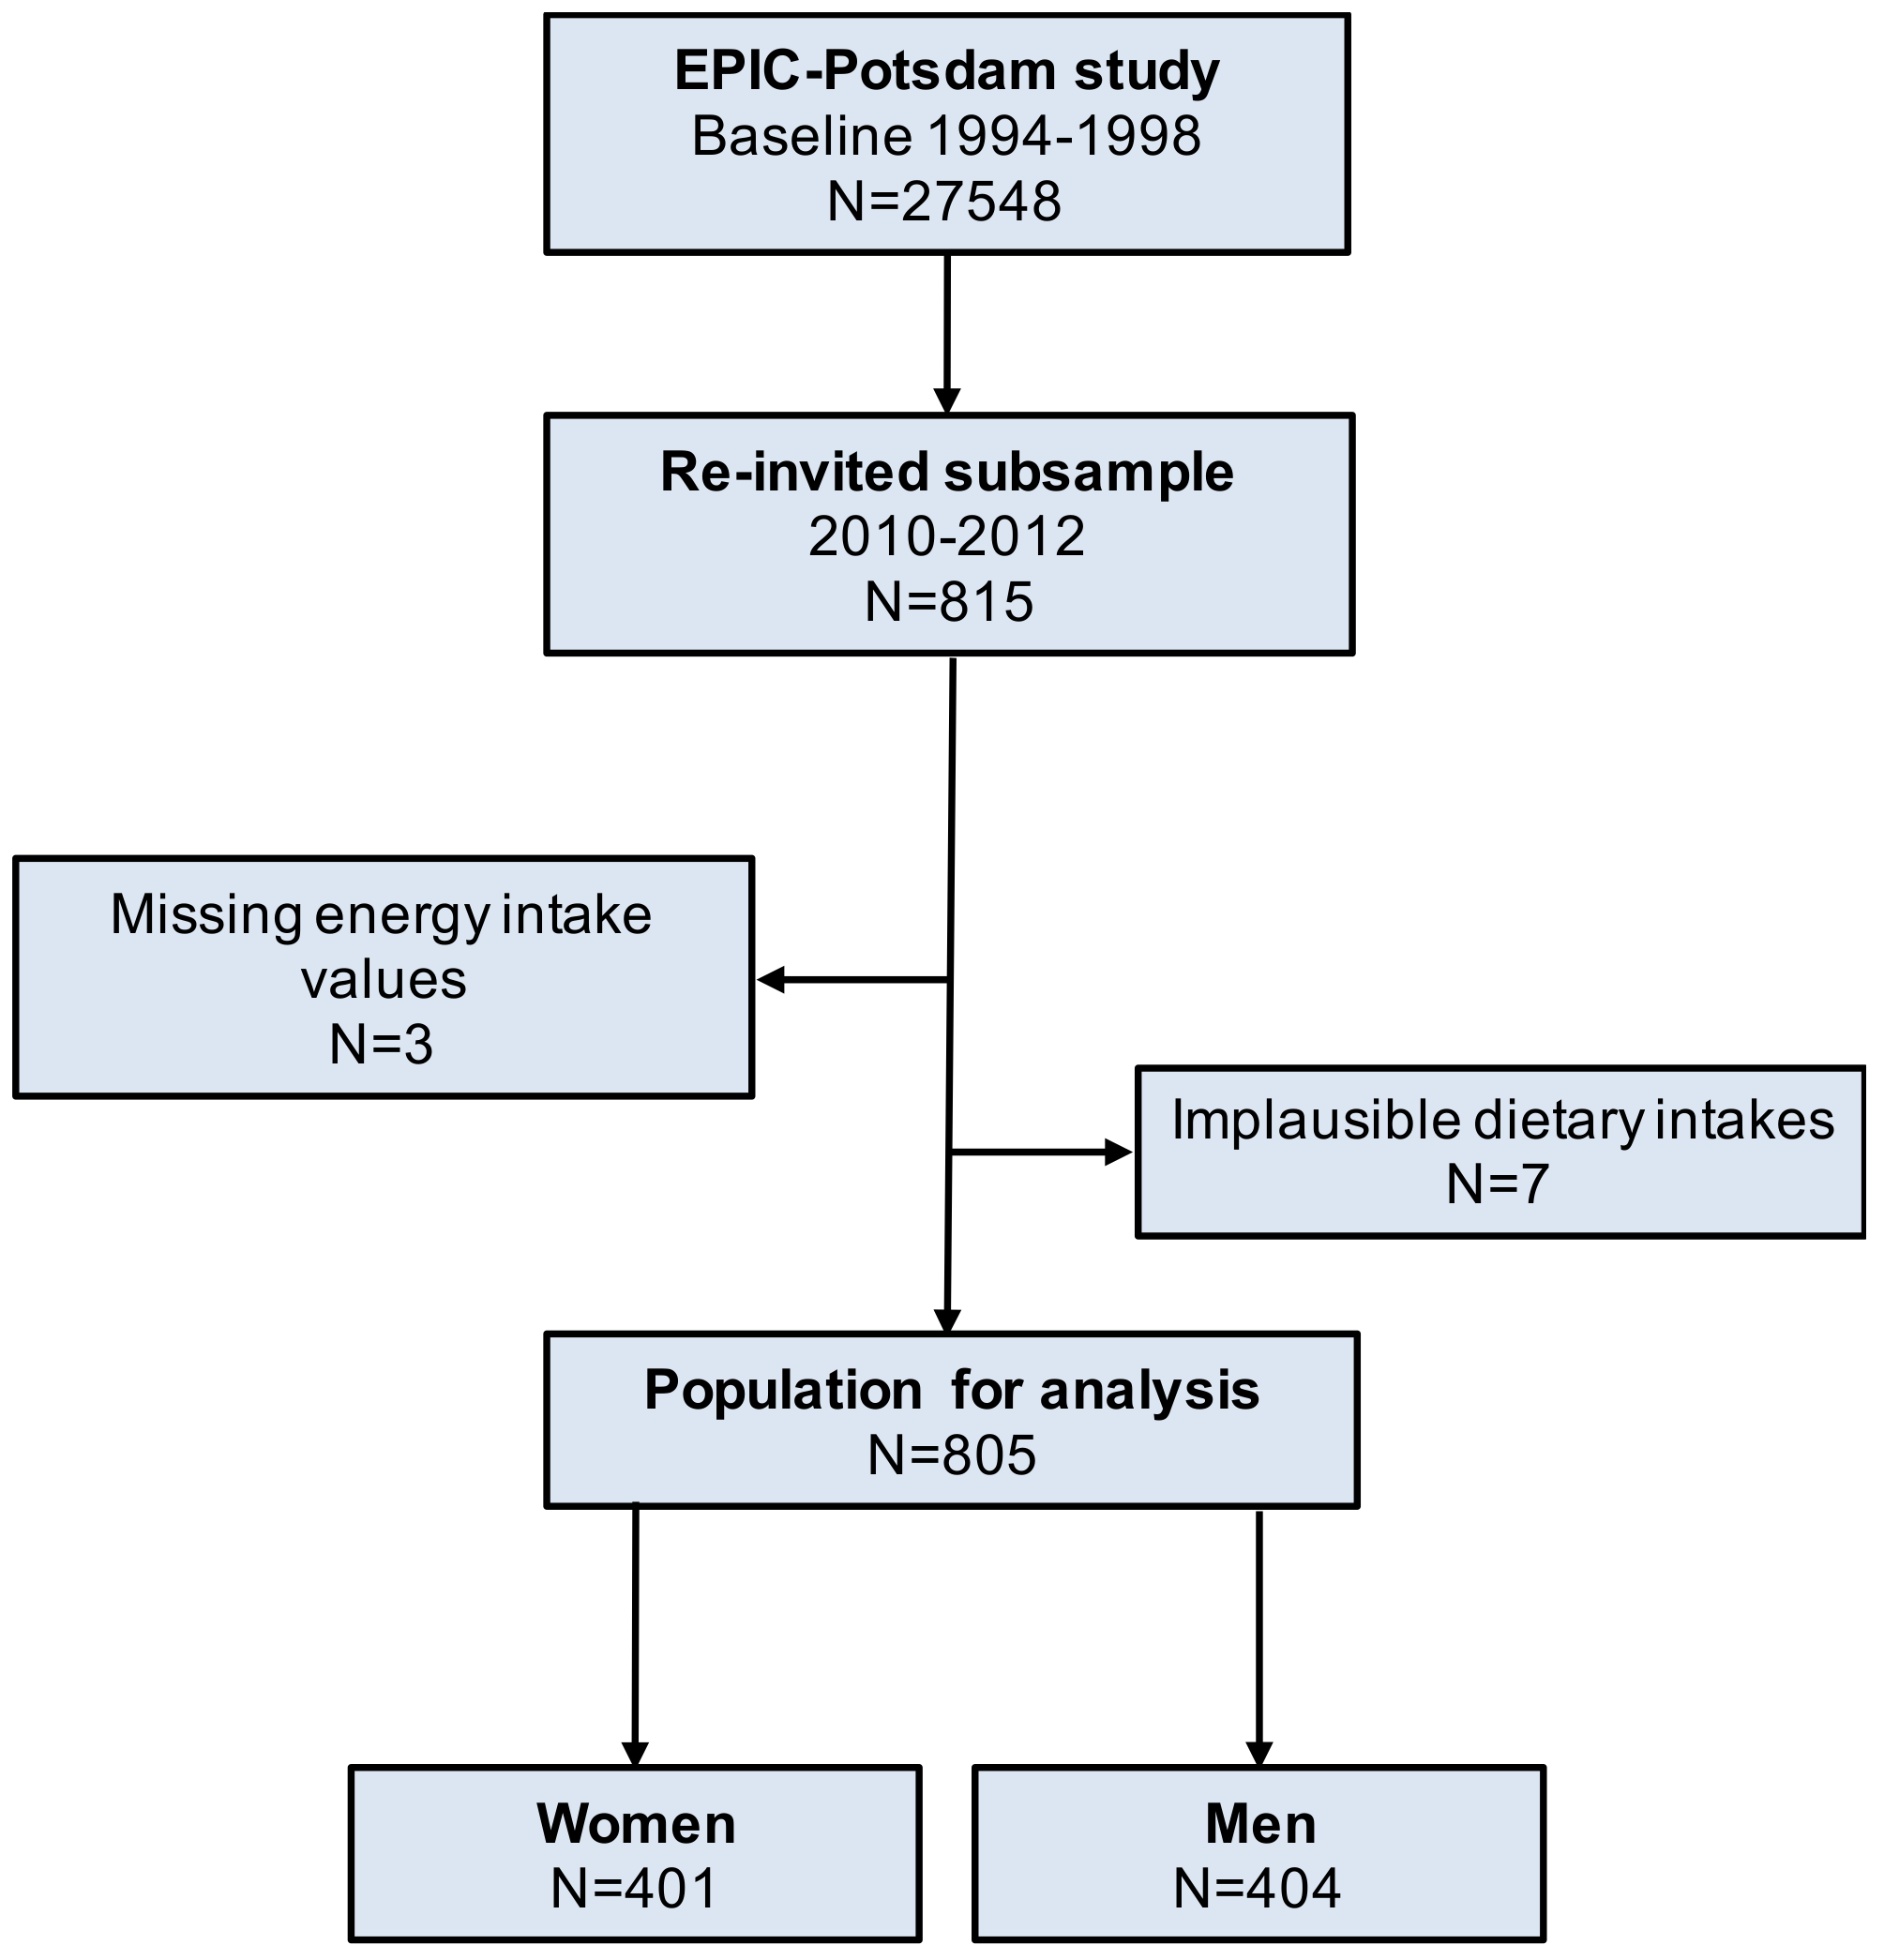
2.1. Study Population

The European Prospective Investigation into Cancer and Nutrition (EPIC) study is a multi-center prospective cohort designed to investigate the relation between diet, lifestyle, metabolic characteristics, and the risk of chronic diseases in 10 European countries [19]. In the EPIC—Potsdam cohort, 27,468 participants were recruited at baseline between 1994 and 1998, mostly aged 35–65 years [20]. During 2010–2012, a subsample (N = 815) was recruited randomly from 23,881 cohort members that were still actively participating in the follow-up. According to a rectangular sampling scheme, equal representation of men and women, and equal participants in each of the three categories for age at baseline (35–44 years, 45–54 years, 55–64 years) were selected. After excluding participants with missing values of energy intake and implausible dietary intakes (women: <600 kcal or >3500 kcal; men: <800 kcal or >4200 kcal), 805 individuals remained eligible for data analysis (see Figure 1 for flow-chart).

2.2. Data Collection

Habitual dietary intakes of 12 months prior to recruitment were assessed through validated 148-item semi-quantitative food frequency questionnaires (FFQs) [21]. Information on socio-economic and demographic characteristics, i.e., occupation (employment status), education, age, partner status, wellbeing-related factors, i.e., health and life satisfaction, and lifestyle factors, i.e., smoking, physical activity, gardening, cycling, and sleeping habits were collected with self-administered questionnaires. Weight and height measurements and the derived body mass index (BMI) assessment were performed by trained staff according to standardized protocol. Chronic stress was estimated from hair cortisol concentrations using commercially available immunoassay with chemiluminescence detection (CLI) (CLIA, IBL, Hamburg, Germany).

2.3. Environmental Indicators

GHGE (kg CO2 equivalents) and LU (m2/year) from food consumed for each individual were determined using attributional lifecycle analyses from a European-average database for indicators of environmental sustainability of the diet—SHARP Indicators Database (SHARP-ID) [22]. Food items were selected that matched the food groups obtained from the FFQ. The mean GHGE and LU were calculated per food group and standardized to 2000 kcal daily diet. The Spearman partial correlation between GHGE and LU adjusted for age and sex was moderate to strong [0.77 (95% CI: 0.74, 0.80); p < 0.0001]; therefore, in analyses where we evaluated determinants, GHGE from diet was used as single outcome representative of both indicators.

2.4. Statistical Analysis
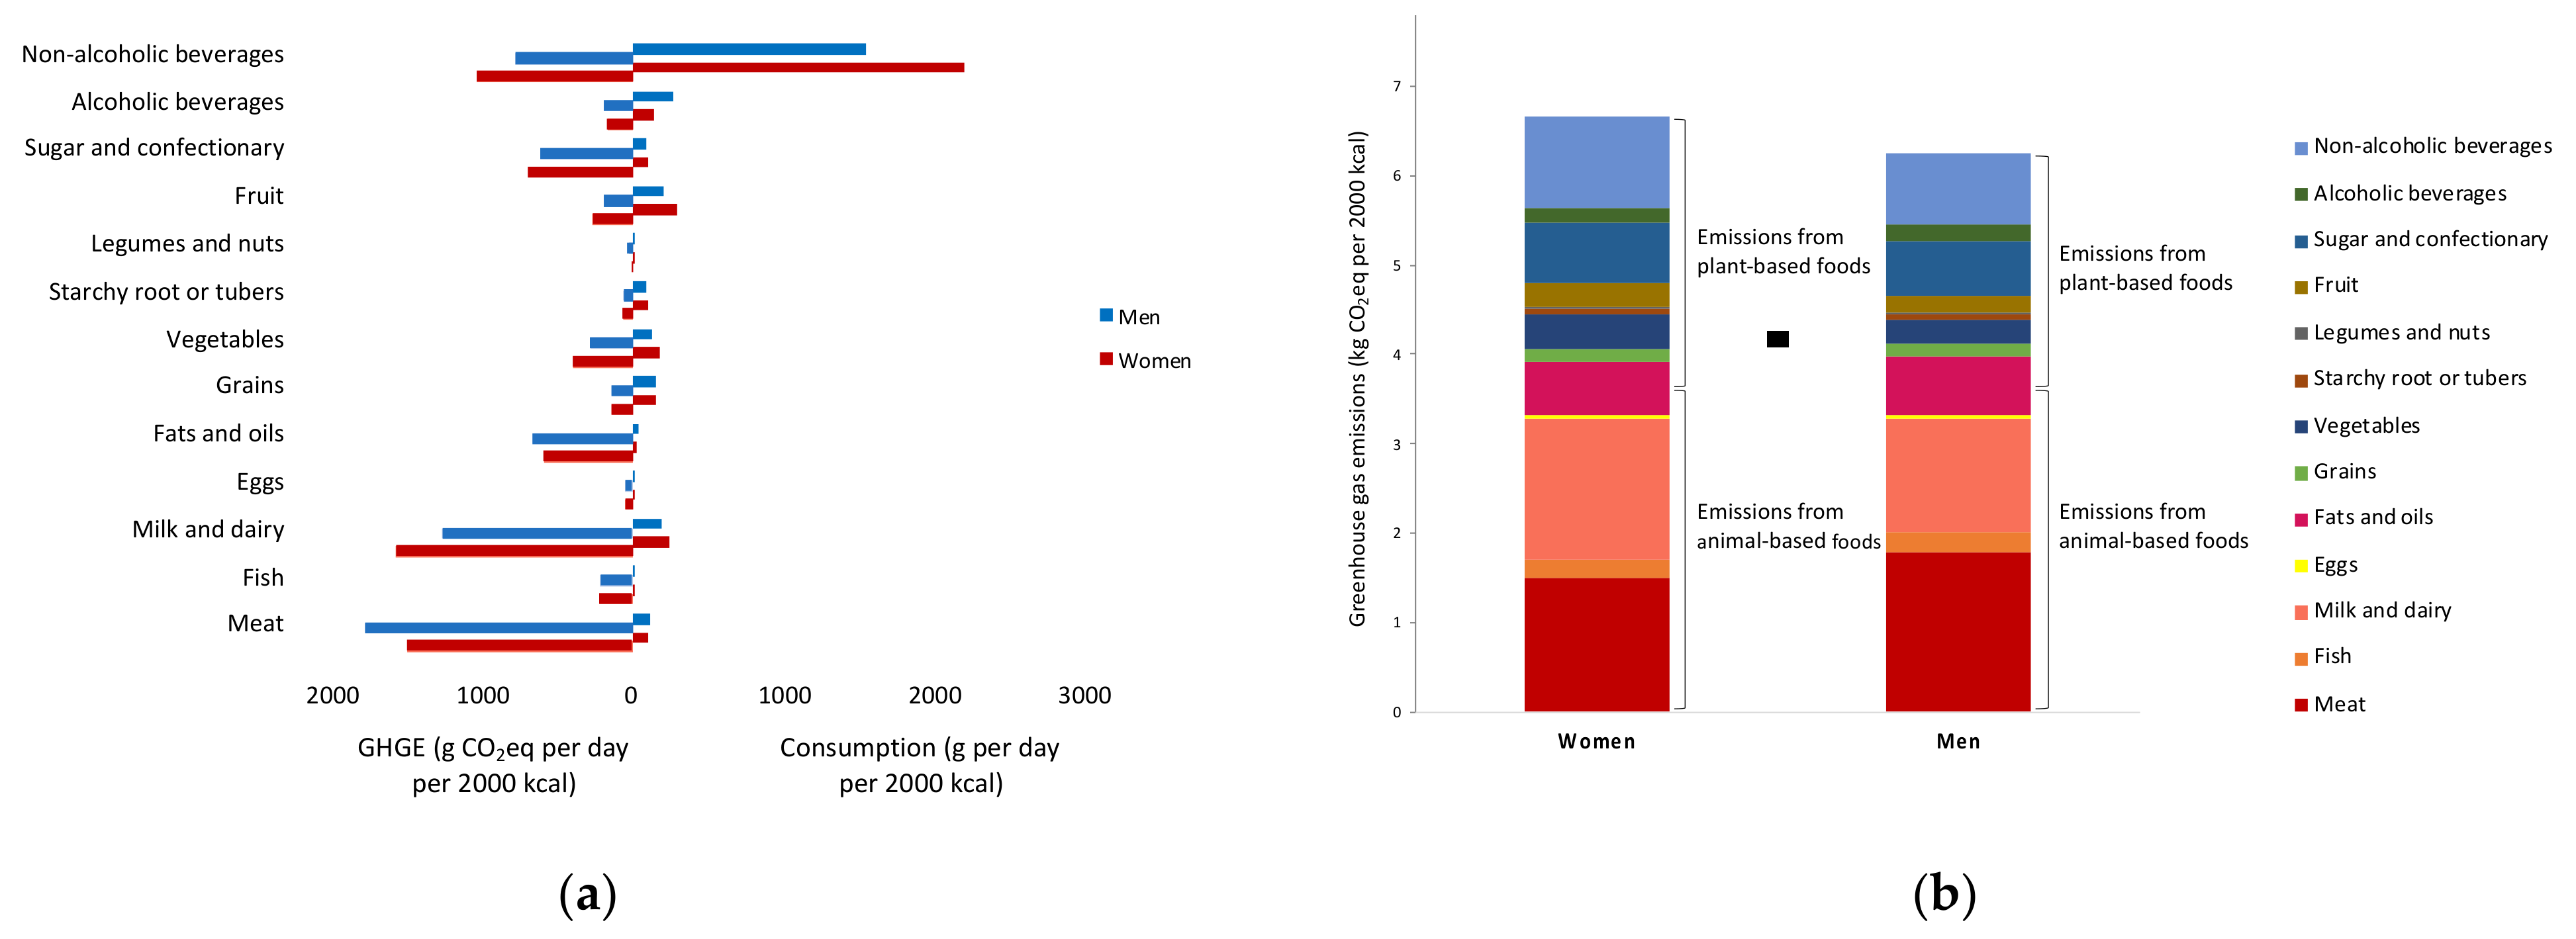
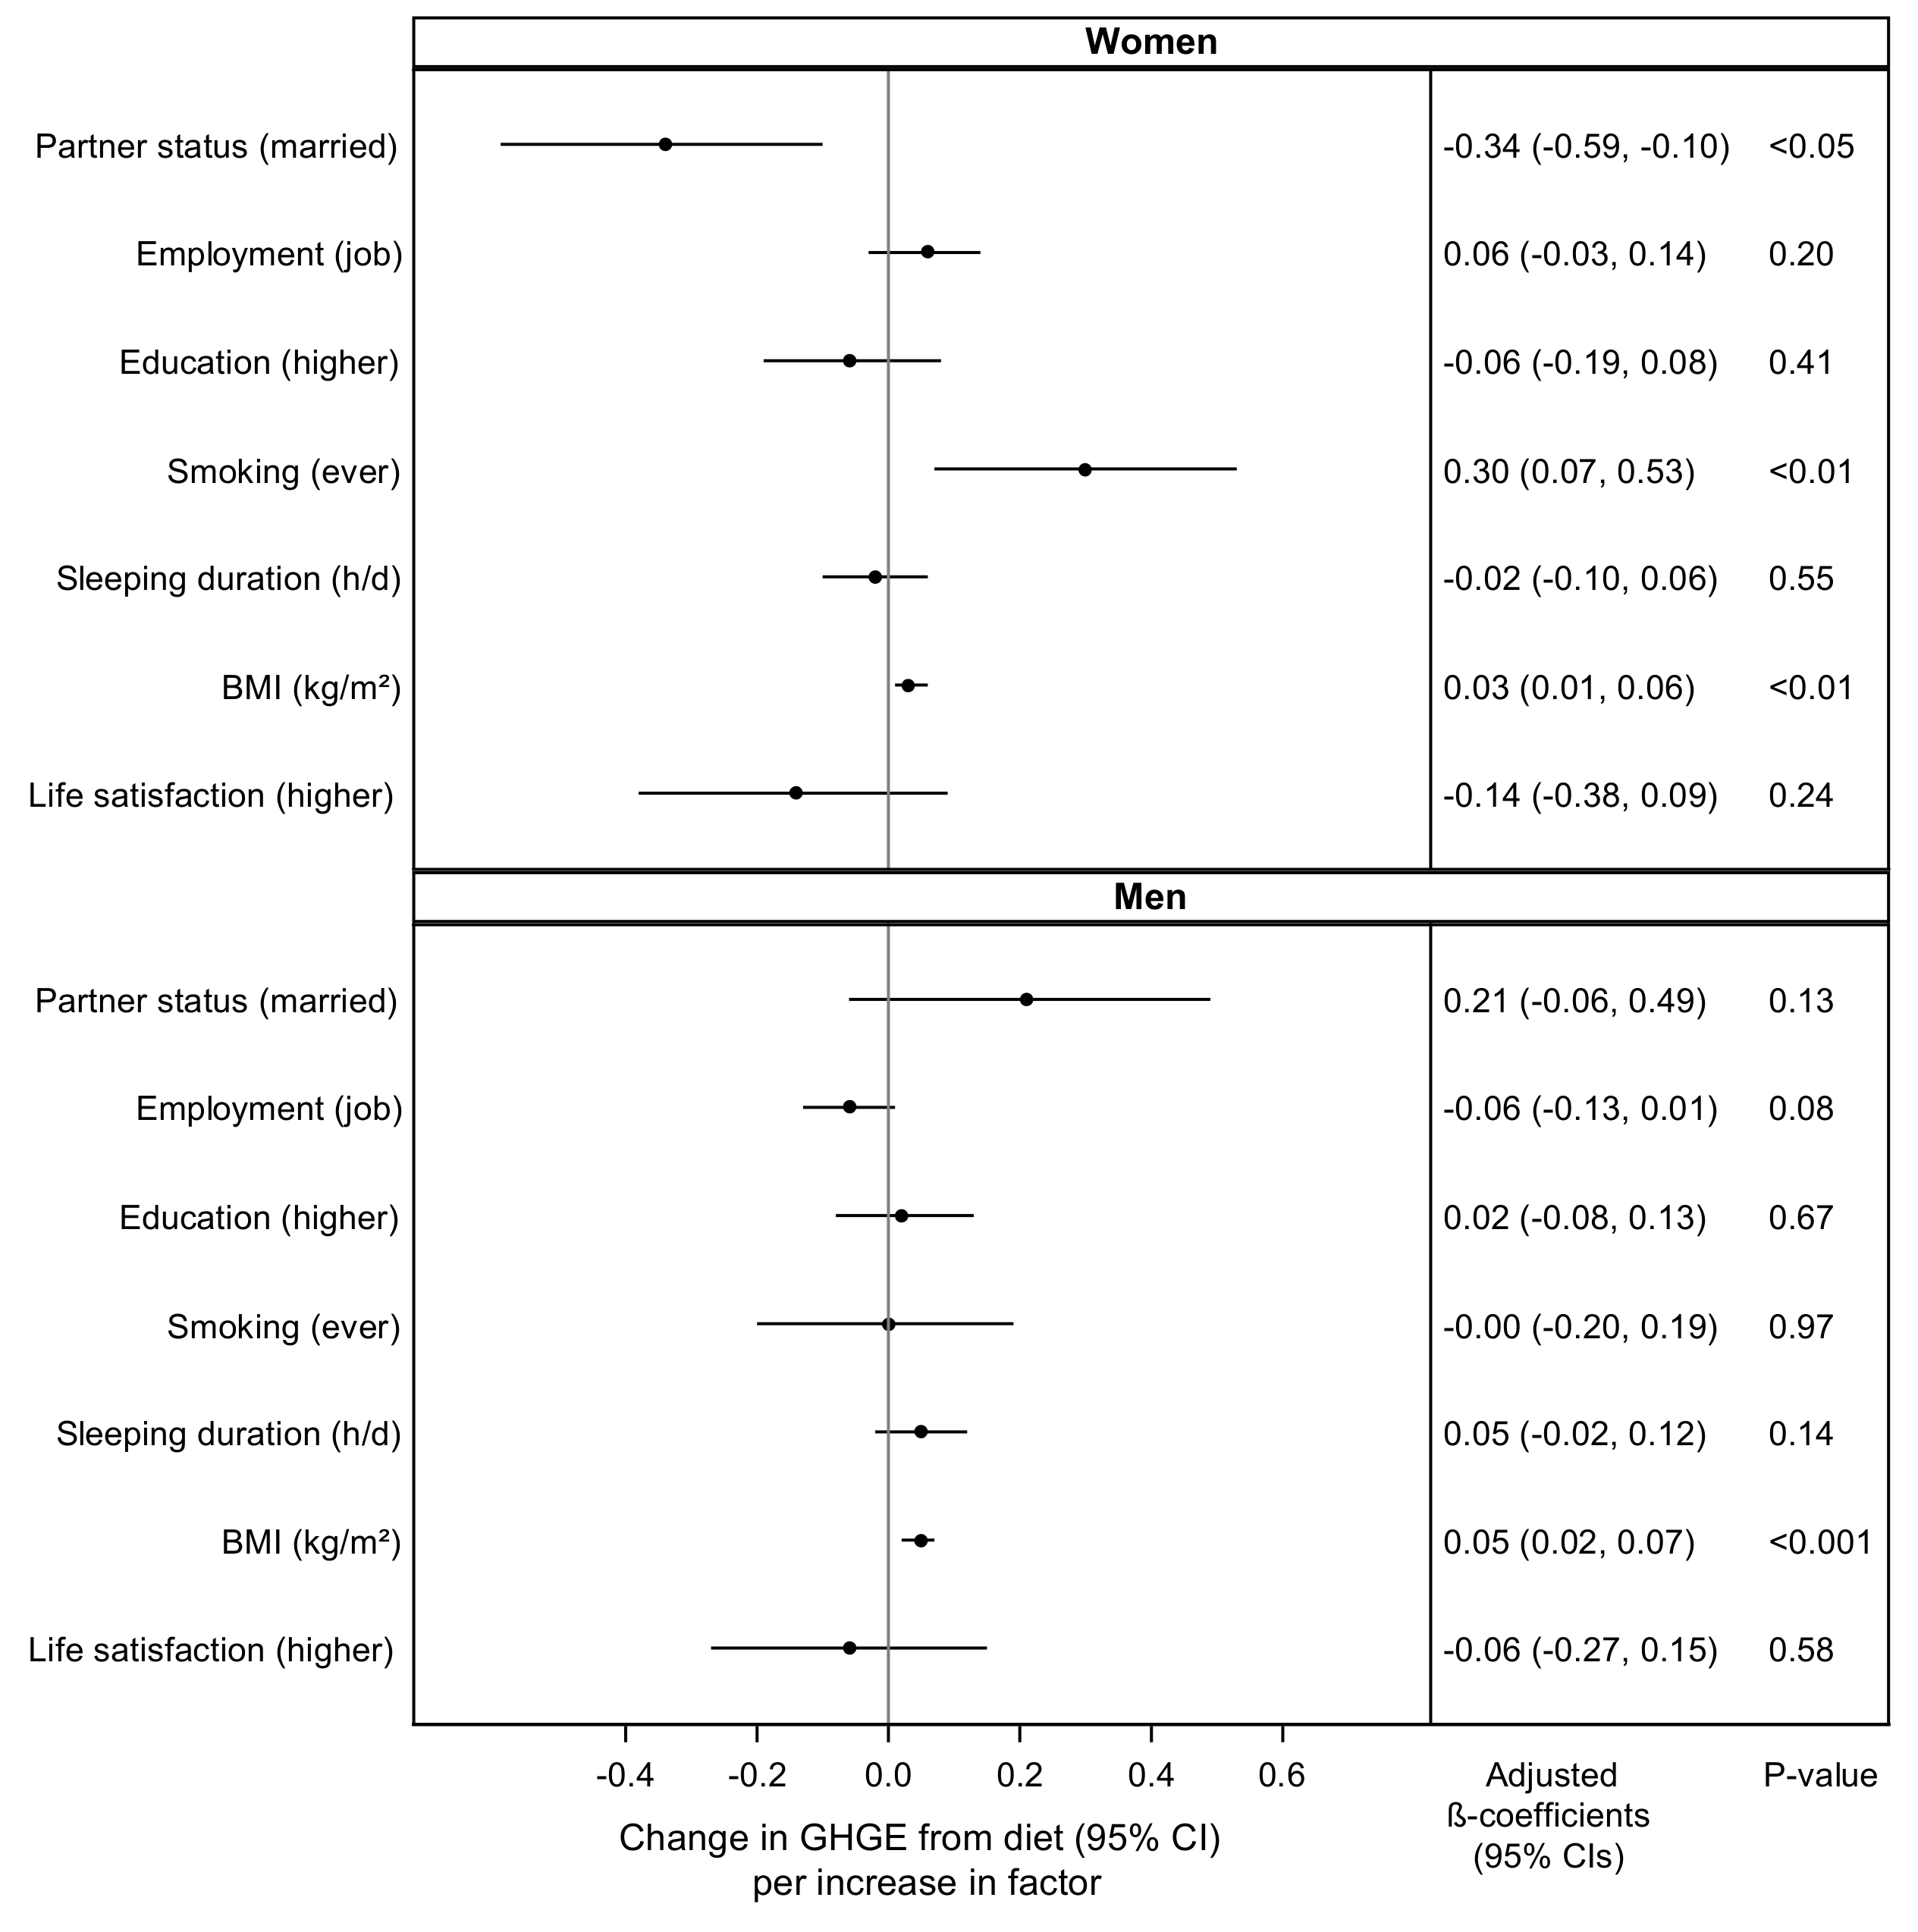
The means and standard deviations (SDs) of GHGE and LU from diet were calculated for all study participants and according to categories by sex (men vs. women), education status (no training or vocational training (low education) vs. university degree (high education)), partner status (single vs. married), obesity status (BMI < 30 vs. ≥30 kg/m2) and age groups (<60 vs. ≥60 years).
To examine which food groups contributed most to environmental impact of diet, we calculated the mean consumption of individual major food groups and estimated their relative contribution to GHGE from diet by sex. To evaluate characteristics associated with high GHGE from diet, we first assessed the distribution of a range of socio-demographic, lifestyle, and wellbeing-related factors according to quartiles of GHGE. These included employment status (unemployed or employed), education (no or vocational training, technical college, or university degree), age, partner status (single or married), health satisfaction (dissatisfied or satisfied), life satisfaction (dissatisfied or satisfied), smoking (never smoker or ever smoker), physical activity duration, gardening duration, cycling duration, and sleeping duration.
Next, we calculated the strength and direction of association of candidate determinants using multivariable-adjusted linear regression analyses. Models were adjusted for age, prevalent hypertension, diabetes, cancer, cardiovascular disease, and mutually adjusted for the remaining factors under evaluation. Finally, to determine the main determinants among a set of predefined factors we used a backward elimination linear regression analysis (p < 0.15 as cut-off) and calculated percentages of explained variance of GHGE.
Statistical analyses were performed in SAS (v9.4, Enterprise Guide 7.1, SAS Institute Inc., Cary, NC, USA) and R (v3.4.3, R Foundation for Statistical Computing, Vienna, Austria).

3. Results

Participants had a mean ± SD age of 66.0 ± 8.4 years and BMI of 27.5 ± 4.4 kg/m2. In men and women, absolute dietary-related GHGE and LU were 6.9 ± 1.8 and 5.7 ± 1.4 kg CO2 eq and 8.2 ± 2.3 and 6.3 ± 1.8 m2/year, respectively. Energy-adjusted GHGE in men was 6.6 ± 0.9 kg CO2 eq per 2000 kcal and in women was 7.0 ± 1.1 kg CO2 eq per 2000 kcal. Energy-adjusted LU in men was 7.8 ± 1.2 m2/year per 2000 kcal and in women was 7.7 ± 1.2 m2/year per 2000 kcal. In subgroup analyses, GHGE and LU were estimated in individuals with: lower vs. higher education [6.9 ± 1.0 vs. 6.7 ± 1.1 kg CO2 eq per 2000 kcal and 7.9 ± 1.2 vs. 7.7 ± 1.2 m2/year per 2000 kcal, respectively]; single vs. married [7.0 ± 1.1 vs. 6.8 ± 1.0 kg CO2 eq per 2000 kcal and 7.8 ± 1.07 vs. 7.7 ± 1.2 m2/year per 2000 kcal, respectively]; non-obese vs. obese [6.7 ± 1.0 vs. 7.1 ± 1.2 kg CO2 eq per 2000 kcal and 7.6 ± 1.1 vs. 8.1 ± 1.2 m2/year per 2000 kcal respectively]; and in younger vs. older participants [6.7 ± 1.1 vs. 6.8 ± 1.0 kg CO2 eq per 2000 kcal and 7.6 ± 1.1 vs. 7.8 ± 1.2 m2/year per 2000 kcal, respectively].
Figure 2a presents the mean consumption of individual food groups and their relative contribution to GHGE from diet in men and women. Overall, the food groups contributing to most to GHGE included dairy, meat, and non-alcoholic beverages. Other foods that additionally contributed to GHGE in men included alcoholic beverages and fats and oils, whereas in women, foods included grains, sugar and confectionary, fruit and vegetables. Figure 2b shows the proportion of GHGE from animal and plant-based foods in men and women. Intake of animal-based foods including meat, fish, dairy, and eggs contributed to 63% of GHGE from major food groups in men and 57% of GHGE from major food groups in women.
Table 1 presents the distribution of evaluated socio-demographic, lifestyle, and wellbeing-related factors according to quartiles of GHGE. GHGE ranged from mean (SD) of 5.6 (0.5) kg CO2 eq per 2000 kcal in the lowest quartile to 8.2 (0.7) kg CO2 eq per 2000 kcal in the highest quartile. These analyses revealed a trend of increasing GHGE with being female, being single, being unemployed, being lower educated, being a smoker, having a longer sleeping duration, and having a higher BMI.
Figure 3 shows results from multivariable linear regression analyses that demonstrate the strength and direction of the association between GHGE and selected participants’ characteristics. The adjusted beta-coefficients and p-values of the associations are provided in the figure. In men and women, having a higher BMI was associated with higher GHGE (standardized beta = 0.05 (95% CI: 0.02, 0.07) and 0.03 (0.01, 0.06) kg CO2 eq per 2000 kcal, respectively). In women, ever having smoked was associated with higher GHGE (0.30 (0.07, 0.53) kg CO2 eq per 2000 kcal), whereas having a partner was associated with lower GHGE (−0.34 (−0.59, −0.10) kg CO2 eq per 2000 kcal). In men, having a partner versus being single was associated with higher GHGE (0.21 (−0.06, 0.49) kg CO2 eq per 2000 kcal) and having a job versus being unemployed with lower GHGE (−0.06 (−0.13, 0.01) kg CO2 eq per 2000 kcal).
Characteristics that explained most variance of GHGE from diet in women included being single, having a job, smoking, and higher BMI (cumulative variance: 8%). In men, selected characteristics included having a partner, longer sleeping duration, and a higher BMI (cumulative variance: 4%).
Sensitivity analyses revealed that women were higher consumers of coffee, infused or herbal tea, and water, which were the main contributors of GHGE from non-alcoholic beverages (Supplementary Table S1). Especially single women consumed larger amounts of non-alcoholic beverages, as well as dairy, fruits, and vegetables, whereas married women consumed higher quantities of alcohol and meat (Supplementary Table S2). No differences in marital status among women were observed according to age categories and obesity prevalence.
All estimates are adjusted for age, prevalent hypertension, diabetes, cancer, cardiovascular disease, and mutually adjusted for the remaining factors under evaluation.

4. Discussion

In this study, we provide first insights into environmental aspects of usual food intake in populations living in eastern Germany, and their associated determinants. In both men and women, the main dietary contributors related to high GHGE included animal-based foods, i.e., meat and dairy, and non-alcoholic beverages. Our results further suggested that women and obese individuals contribute to a higher relative climate impact from diet (per 2000 kcal eaten) as compared to other groups in this population sample. Among women, being single and smoking were additionally selected as characteristics associated with high GHGE. Remaining socio-demographic, lifestyle, and wellbeing-related factors seemed to be of less importance in explaining the environmental impact of diet in our study.
Among the variety of dietary factors, dairy, meat, and non-alcoholic beverages were suggested to be the strongest drivers of daily emissions of GHG from diet. Similar results were reported in other European populations, such as in Dutch individuals [23]. In our study, dairy and meat contributed to approximately half of GHGE, where men consumed higher quantities of meat and women consumed more dairy products. Another study representative of German population aged 14–80 years similarly found that men consume a relatively higher share of meat compared to women [12]. Among non-alcoholic beverages, coffee and tea mainly contributed to climate footprint. Especially preparation methods of tea from the consumer (i.e., using tea bags instead of loose tea or boiling more water than needed) seem to contribute to higher GHGE [24]. This finding is important to highlight, as promoting sustainable diets should not focus solely on reducing animal-based foods. Plant-based dietary aspects that significantly contribute to environmental impact should nevertheless also be considered.
Women with unfavorable lifestyle characteristics, i.e., smoking, obesity, and reduced life satisfaction, consumed diets that were less climate-friendly. Smoking and obesity are associated [25], and reduced ‘subjective wellbeing’ (life satisfaction) may rival these characteristics. It has also been found that people with higher BMI consume more animal-based foods including meat [26], which indeed was also the case in our population. This hypothesis has been confirmed in other studies as well [27,28]. Among participants with obesity, the underreporting of unhealthy foods with low GHGE (fats, sugars) [29], or overreporting of foods with high GHGE (meat, dairy) may further explain this finding. Of course, also higher food intake per se is related to higher environmental footprint, though we focused on comparing the quality of diets among different participant characteristics instead of quantity. Moreover, among women, being single was associated with higher GHGE compared to being married. Women had a higher prevalence of being single (27.7%) compared to men (12.8%). Different food consumption patterns, including higher intakes of dairy foods and non-alcoholic beverages among singles may explain this difference.
This study has several limitations. First, selection bias may influence the generalizability of this study, as EPIC-Potsdam data is not a representative sample of people living in eastern parts of Germany. Participants that volunteered were motivated, likely to be health conscious, and highly educated (>40% had a university degree). In addition, the calculation methods for estimating environmental impact were based on a European-average (SHARP-ID) obtained from various LCA studies conducted in differing years, and not Germany in particular. Diet-related GHGE values obtained from different LCA calculation methods must be interpreted with caution, however, major food contributors are still expected to be comparable among different methods [30]. The environmental indicators were limited to GHGE and LU, yet there are other important indicators that contribute to sustainability of diet. These may include water use, eutrophication, acidification or biodiversity loss indicators [31].

5. Conclusions

The present study is the first to describe several characteristics associated with climate impact of diet in men and women living in eastern Germany. The results suggested that the quality of diet in women and obese individuals may be less environmentally friendly in this population sample. Further larger-scale studies covering multiple and diverse populations with high environmental footprint are warranted to provide further insights into transforming to sustainable diets. Ultimately, such studies may guide the development of strategies to promote sustainable food choices adapted to regional conditions.

Supplementary Materials

The following supporting information can be downloaded at: https://www.mdpi.com/article/10.3390/su14073854/s1, Table S1: Sources of non-alcoholic beverages as contributors to greenhouse gas emissions in women and men; Table S2: Food consumption trends, and age and obesity characteristics among women that are single and married.

Author Contributions

Conceptualization, L.K. and K.A.; formal analysis, L.K.; writing—original draft preparation, L.K.; writing—review and editing, L.K., K.A., I.H., M.B.S., S.B. and P.v.‘t.V.; visualization, L.K.; supervision, K.A. All authors have read and agreed to the published version of the manuscript.

Funding

This study was supported by the Federal Ministry of Science, Germany, (grant 01 EA 9401) and the European Union (grant SOC 95201408 05 F02) for the recruitment phase of the EPIC—Potsdam study and by the German Cancer Aid (grant 70-2488-Ha I) and the German Federal Ministry of Education and Research (BMBF) under the promotional reference 01ER0808. The publication of this article was funded by the Open Access Fund of the Leibniz Association. The funders had no role in study design, data collection and analysis, preparation of the manuscript, or decision to publish.

Institutional Review Board Statement

The study was conducted in accordance with the Declaration of Helsinki, and all procedures involving research study participants were approved by the Medical Society of the State of Brandenburg, Germany.

Informed Consent Statement

Written informed consent was obtained from all participants prior to enrollment.

Data Availability Statement

Data available on request.

Acknowledgments

We thank the Human Study Centre (HSC) of the German Institute of Human Nutrition Potsdam-Rehbruecke, the trustee and the data hub for the processing, and the participants for the provision of the data.

Conflicts of Interest

The authors declare no conflict of interest.

References

  1. Shukla, P.R.; Skea, J.; Buendia, E.C.; Masson-Delmotte, V.; Pörtner, H.-O.; Roberts, D.C.; Zhai, P.; Slade, R.; Connors, S.; Diemen, R.V.; et al. Climate Change and Land: An IPCC Special Report on Climate Change, Desertification, Land Degradation, Sustainable Land Management, Food Security, and Greenhouse Gas Fluxes in Terrestrial Ecosystems; IPCC: Geneva, Switzerland, 2019. [Google Scholar]
  2. Foley, J.A.; Ramankutty, N.; Brauman, K.A.; Cassidy, E.S.; Gerber, J.S.; Johnston, M.; Mueller, N.D.; O’Connell, C.; Ray, D.K.; West, P.C.; et al. Solutions for a cultivated planet. Nature 2011, 478, 337–342. [Google Scholar] [CrossRef] [PubMed] [Green Version]
  3. Popkin, B.M.; Adair, L.S.; Ng, S.W. Global nutrition transition and the pandemic of obesity in developing countries. Nutr. Rev. 2012, 70, 3–21. [Google Scholar] [CrossRef] [PubMed] [Green Version]
  4. Tilman, D.; Clark, M. Global diets link environmental sustainability and human health. Nature 2014, 515, 518–522. [Google Scholar] [CrossRef] [PubMed]
  5. Willett, W.; Rockström, J.; Loken, B.; Springmann, M.; Lang, T.; Vermeulen, S.; Garnett, T.; Tilman, D.; DeClerck, F.; Wood, A.; et al. Food in the Anthropocene: The EAT—Lancet Commission on healthy diets from sustainable food systems. Lancet 2019, 393, 447–492, Erratum in Lancet 2019. [Google Scholar] [CrossRef]
  6. Burlingame, B.; Dernini, S. Sustainable Diets and Biodiversity; Food and Agriculture Organization of the United Nations, Bioversity International: Rome, Italy, 2012. [Google Scholar]
  7. BMEL. Statistisches Jahrbuch über Ernährung, Landwirtschaft und Forsten der Bundesrepublik Deutschland, 61. Jahrgang; Bundesinformationcentrum: Landwirtshaft, Germany, 2017; pp. 146–152. [Google Scholar]
  8. OECD. Meat Consumption (Indicator); Organisation for Economic Cooperation and Development: Paris, France, 2020. [Google Scholar] [CrossRef]
  9. Umwelt Bundesamt. Treibhausgasminderungsziele Deutschlands. Available online: https://www.umweltbundesamt.de/daten/klima/treibhausgasminderungsziele-deutschlands#internationale-vereinbarungen-weisen-den-weg (accessed on 20 November 2021).
  10. Kolbe, K. Mitigating climate change through diet choice: Costs and CO2 emissions of different cookery book-based dietary options in Germany. Adv. Clim. Chang. Res. 2020, 11, 392–400. [Google Scholar] [CrossRef]
  11. Fritsche, U.R.; Eberle, U. Treibhausgasemissionen durch Erzeugung und Verarbeitung von Lebensmitteln: Arbeitspapier; Nahrungsmittel-Klima; Öko-Institut e.V.: Darmstadt, Germany, 2007. [Google Scholar] [CrossRef]
  12. Meier, T.; Christen, O. Gender as a factor in an environmental assessment of the consumption of animal and plant-based foods in Germany. Int. J. Life Cycle Assess. 2012, 17, 550–564. [Google Scholar] [CrossRef]
  13. Meier, T.; Christen, O. Umweltwirkungen der Ernährung: Ökobilanzierung des Nahrungsmittelverbrauchs tierischer Produkte nach Gesellschaftsgruppen in Deutschland. In Proceedings of the Beitrag zur Jahrestagung der Gesellschaft für Wirtschafts-und Sozialwissenschaften des Landbaus (GEWISOLA), Halle, Germany, 28–30 September 2011. [Google Scholar]
  14. Reinhardt, G.; Gärtner, S.; Münch, J.; Häfele, S. Ökologische Optimierung Regional Erzeugter Lebensmittel: Energie- und Klimabilanzen; IFEU: Heidelberg, Germany, 2009. [Google Scholar]
  15. Taylor, C. Ökologische Bewertung von Ernährungsweisen Anhand Ausgewählter Indikatoren. Master’s Thesis, Justus-Liebig-Universität, Gießen, Germany, 2000. [Google Scholar]
  16. Prütz, F.; Rommel, A.; Kroll, L.E.; Lampert, T. 25 Years after the Fall of the Berlin Wall: Regional Differences in Health; Robert Koch Institut: Berlin, Germany, 2014; Volume 5, p. 13. [Google Scholar] [CrossRef]
  17. Mensink, G.B.M.; Beitz, R. Food and nutrient intake in East and West Germany, 8 years after the reunification—The German Nutrition Survey 1998. Eur. J. Clin. Nutr. 2004, 58, 1000–1010. [Google Scholar] [CrossRef] [Green Version]
  18. Vogt, T.; Van Raalte, A.; Grigoriev, P.; Myrskylä, M. The German East-West Mortality Difference: Two Crossovers Driven by Smoking. Demography 2017, 54, 1051–1071. [Google Scholar] [CrossRef] [Green Version]
  19. Riboli, E.; Hunt, K.J.; Slimani, N.; Ferraria, P.; Norata, T.; Fahey, M.; Charrondierea, U.R.; Hemona, B.; Casagrandea, C.; Vignata, J.; et al. European Prospective Investigation into Cancer and Nutrition (EPIC): Study populations and data collection. Public Heal. Nutr. 2002, 5, 1113–1124. [Google Scholar] [CrossRef]
  20. Boeing, H.; Wahrendorf, J.; Becker, N. EPIC-Germany—A source for studies into diet and risk of chronic diseases. European Investigation into Cancer and Nutrition. Ann. Nutr. Metab. 1999, 43, 195–204. [Google Scholar] [CrossRef]
  21. Bohlscheid-Thomas, S.; Hoting, I.; Boeing, H.; Wahrendorf, J. Reproducibility and relative validity of energy and macronutrient intake of a food frequency questionnaire developed for the German part of the EPIC project. European Prospective Investigation into Cancer and Nutrition. Int. J. Epidemiol. 1997, 26 (Suppl. 1), 71–81. [Google Scholar] [CrossRef] [Green Version]
  22. Mertens, E.; Kaptijn, G.; Kuijsten, A.; van Zanten, H.; Geleijnse, J.M.; Veer, P.V.‘t. SHARP-Indicators Database towards a public database for environmental sustainability. Data Brief 2019, 27, 104617. [Google Scholar] [CrossRef]
  23. Vellinga, R.E.; Van De Kamp, M.; Toxopeus, I.B.; Van Rossum, C.T.M.; De Valk, E.; Biesbroek, S.; Hollander, A.; Temme, E.H.M. Greenhouse Gas Emissions and Blue Water Use of Dutch Diets and Its Association with Health. Sustainability 2019, 11, 6027. [Google Scholar] [CrossRef] [Green Version]
  24. Liang, L.; Ridoutt, B.; Wang, L.; Xie, B.; Li, M.; Li, Z. China’s Tea Industry: Net Greenhouse Gas Emissions and Mitigation Potential. Agriculture 2021, 11, 363. [Google Scholar] [CrossRef]
  25. Taylor, A.E.; Richmond, R.C.; Palviainen, T.; Loukola, A.; Wootton, R.E.; Kaprio, J.; Relton, C.L.; Smith, G.D.; Munafò, M.R. The effect of body mass index on smoking behaviour and nicotine metabolism: A Mendelian randomization study. Hum. Mol. Genet. 2018, 28, 1322–1330. [Google Scholar] [CrossRef] [Green Version]
  26. Spencer, E.A.; Appleby, P.N.; Davey, G.K.; Key, T.J. Diet and body mass index in 38 000 EPIC-Oxford meat-eaters, fish-eaters, vegetarians and vegans. Int. J. Obes. 2003, 27, 728–734. [Google Scholar] [CrossRef] [Green Version]
  27. Hasan, M.M. Does Consumer Behaviour on Meat Consumption Increase Obesity?—Empirical Evidence from European Countries. Int. J. Econ. Behav. Organ. 2014, 2, 1–5. [Google Scholar] [CrossRef] [Green Version]
  28. Tucker, L.A.; Tucker, J.; Bailey, B.; LeCheminant, J.D. Meat Intake Increases Risk of Weight Gain in Women: A Prospective Cohort Investigation. Am. J. Heal. Promot. 2014, 29, e43–e52. [Google Scholar] [CrossRef]
  29. Fricker, J.; Baelde, D.; Igoin-Apfelbaum, L.; Huet, J.-M.; Apfelbaum, M. Underreporting of food intake in obese “small eaters”. Appetite 1992, 19, 273–283. [Google Scholar] [CrossRef]
  30. Sugimoto, M.; Murakami, K.; Asakura, K.; Masayasu, S.; Sasaki, S. Diet-related greenhouse gas emissions and major food contributors among Japanese adults: Comparison of different calculation methods. Public Health Nutr. 2020, 24, 973–983. [Google Scholar] [CrossRef]
  31. Vieux, F.; Perignon, M.; Gazan, R.; Darmon, N. Dietary changes needed to improve diet sustainability: Are they similar across Europe? Eur. J. Clin. Nutr. 2018, 72, 951–960. [Google Scholar] [CrossRef]
Figure 1. Flow-chart of study population with exclusion criteria
Sustainability 14 03854 g001
Figure 2. (a) Mean consumption and associated greenhouse gas emissions (GHGE) of major food groups in men (blue) and women (red); (b) Proportion of daily GHGE from animal and plant-based foods in men and women.
Sustainability 14 03854 g002
Figure 3. Multivariable linear regression showing change in greenhouse gas emissions from diet per unit-increase in selected predictor, by sex.
Sustainability 14 03854 g003
Table 1. Socio-demographic, lifestyle, and wellbeing-related factors according to quartiles of GHGE from diet (kg CO2 eq per 2000 kcal).
Quartile 1Quartile 2Quartile 3Quartile 4
n = 202n = 200n = 202n = 201
Total greenhouse gas emissions from diet [kgCO2 eq per 2000 kcal], mean (SD)5.6 (0.5)6.4 (0.2)7.0 (0.2)8.2 (0.7)
Socio-demographic factors
AgeAge [years], mean (SD)64.9 (8.2)66.0 (8.2)66.8 (8.3)66.1 (8.4)
SexFemale, n (%)79 (39.1)85 (42.5)109 (54.0)128 (63.7)
Partner statusSingle, n (%)33 (16.3)31 (15.5)43 (21.3)56 (27.9)
EmploymentUnemployed, n (%)117 (57.9)124 (62.0)137 (67.8)126 (62.7)
EducationUniversity degree, n (%)103 (51.0)87 (43.5)81 (40.1)86 (42.8)
Lifestyle factors
SmokingCurrent smoker, n (%)23 (11.4)13 (6.5)21 (10.4)26 (12.9)
Past smoker, n (%)89 (44.1)82 (41.0)88 (43.6)86 (42.8)
Non-smoker, n (%)90 (44.5)105 (52.5)93 (46.0)89 (44.3)
SleepSleeping duration [h/24 h], median (IQR)7.5 (7.0, 8.2)7.5 (7.0, 8.3)7.6 (7.0, 8.5)8.0 (7.0, 8.2)
Physical activityRecreational sports [h/w], median (IQR)1.5 (0.0, 3.0)2.0 (1.0, 3.3)2.0 (1.0, 3.0)2.0 (0.5, 3.5)
Gardening [h/w], median (IQR)3.0 (0.5, 7.5)3.3 (1.0, 6.0)3.0 (0.5, 7.0)3.0 (0.5, 6.0)
Cycling [h/w], median (IQR)1.5 (0.0, 4.0)2.5 (0.5, 5.0)1.5 (0.0, 3.5)1.5 (0.0, 4.5)
ObesityBMI ≥ 30 kg/m2, n (%)35 (17.3)46 (23.0)45 (22.3)64 (31.8)
Wellbeing-related factors
Chronic stressHair cortisol [pg/mg], median (IQR)28.7 (17.2, 43.4)26.3 (16.2, 43.2)27.0 (17.3, 49.5)27.8 (16.6, 50.4)
Self-reported wellbeingHealth satisfaction—Satisfied, n (%)164 (81.2)157 (78.5)170 (84.2)164 (81.6)
Life satisfaction—Satisfied, n (%)149 (73.8)142 (71.0)149 (73.8)137 (68.2)
Abbreviations: eq; equivalent; GHGE, greenhouse gas emissions; IQR, interquartile range; n, number; SD, standard deviation.
Publisher’s Note: MDPI stays neutral with regard to jurisdictional claims in published maps and institutional affiliations.

