Article

Optimising the Cost of Reducing the CO2 Emissions in Sustainable Energy and Climate Action Plans

Faculty of Mechanical Engineering and Naval Architecture, University of Zagreb, 10000 Zagreb, Croatia
*
Author to whom correspondence should be addressed.
Sustainability 2022, 14(6), 3462; https://doi.org/10.3390/su14063462
Submission received: 11 February 2022 / Revised: 10 March 2022 / Accepted: 11 March 2022 / Published: 16 March 2022
(This article belongs to the Section Energy Sustainability)

Abstract

:
Tackling climate change can be achieved through local and regional initiatives, such as the Covenant of Mayors, which create energy and climate plans with mitigation measures. Upon the development of energy plans, the mitigation of greenhouse gas emissions (GHG) can be achieved through an individual or joint approach. The research aims to upgrade methods for local and regional energy planning through the choice of mitigation actions and alternative scenarios for the reduction of GHG emissions. This is achieved through optimisation of the selection of mitigation measures in the case of the wider Dubrovnik area in Croatia by choosing the most suitable option for implementation when comparing individual and joint approaches for the planning of the measures. Moreover, the implementation of single and sets of mitigation measures is compared through the total cost abatement curve. The modelled problem represents a non-linear problem as exponential functions and multiplication of variables occurs in the modelled equations. Visualisation of the results is achieved via the total cost abatement curve which ranks measures from the most cost-effective to the least cost-effective. It is shown that with the use of optimisation models, it is possible to find such sets of measures and alternative scenarios, which will, with less financial means, reach a minimal reduction of CO2 emissions by 40% in local and regional energy systems and result in financial savings of three times in the analysed case. In this way, it could be possible to increase the overall implementation of SECAP measures and mitigate the problem of the lack of appropriate financial planning.

1. Introduction

Sustainable energy planning at a local level is an important part of the European Union (EU) climate neutral strategy for 2050 and Fit for 55 plan by 2030 [1]. A serious approach to sustainable local energy planning has been initiated during the last 15 years, and especially after the European Commission started the Covenant of Mayor’s initiative. The energy and climate goal of the European Union, Fit for 55 by 2030, can be most easily achieved by planning the sustainable development on a local level, due to a bottom-up approach, direct investments, and implementation. It is concluded that local governments have a crucial role in the mitigation of climate change [2]. The importance of the local initiatives in the energy transition towards carbon neutral societies can also be seen from the large number of signatories of the Covenant of Mayor’s initiative, which is more than 10,000, and the fact that it includes more than half of the EU population [3].
Despite the growing number of sustainable energy and climate action plans, this area has not been adequately documented in the scientific literature [4], even though local authorities can have a significant influence on the reduction of energy consumption and greenhouse gas (GHG) emissions [5]. A local energy policy that is focused on utilising the strong potential of renewable energy and energy efficiency can strengthen local capacities for energy production [6]. For those reasons, it is necessary to encourage local and regional governments to use efficient standardised methods when developing sustainable local energy plans [7]. Recommendations for further research in this area are given in [8] and they include the development of standardised methodologies for tracking emissions on a local level such as ISO 37120 standards, the introduction of different indicators for tracking the goals of sustainable energy plans, a collection of microclimate data as a support for local planning and involving citizens and stakeholders.
Much work regarding local energy planning is focused on how the cities and municipalities are responding to climate change and what are their main drivers. It is shown that national legislation in the EU has a strong impact as well as the Covenant of Mayors under which most of the local plans are developed [9]. Performance and implementation of local plans developed under the Covenant of Mayors are investigated, considering climate neutrality and positioning in line with the Paris Agreement. Slavia et al. [10] show that European cities with a reduction target of 47% are not on track to reach the Paris Agreement. Moreover, the developed plans, which have lower targets, also show problems with the execution due to the lack of the necessary financial and human resources assigned to the initiative [11]. On the other hand, more than 600 plans from the Covenant of Mayors are on track to reach their goals, and their characteristics are less ambitious targets, higher baseline emissions and more ambitious national targets [12]. Moreover, according to the monitoring reports from the Covenant of Mayors, the cities are on the right track to reduce emissions to nearly zero by 2050 [13]. This provides evidence that the initiative has medium success in implementation which could be further improved by integration between actions that cover multiple sectors [14].
The most important steps in the development of local and regional energy plans according to [15] are the analysis of the present situation considering energy consumption and GHG emissions; present and future energy and CO2 balance and estimation of reduction potential; a strategy to reach targets, with targets’ definition, measures and implementation plan; and a regular plan for monitoring the implementation and reaching the reduction goals. In this way, all phases in the process of local energy planning are included in the process. The general process of how the planning works is explained in [16], where steps are effectively shown as a circular activity with four main parts, namely strategic, tactical, operational and reflective, while [17] provides an innovative tool for the development of SECAPs following the main guidelines of the Covenant of Mayors. The methodologies for the analysis of the present situation considering energy consumption and GHG emissions are constantly updated and one of the common approaches which shows how to calculate energy consumption and emissions is tested in Italy [18], while methodology for scaling data from the national level is given in [19]. The option to extend the accounted emissions and provide more potential for mitigation measures is provided and tested in Lombardy, showing that this approach can bring about an additional reduction of CO2 emissions [20]. When it comes to the measures and their implementation, they are divided into sectors, of which the most common in energy plans are residential buildings, public lighting, local electricity production, transport and tertiary buildings, including public ones [21]. The effects of different measures are also investigated by sectors in [22], showing that the greatest number of actions is related to municipal buildings, public lighting and local electricity production. In addition, new approaches, other than just CO2 emissions, can be used for tracking the implementation and reporting on climate change mitigation and sustainability, such as SDEWES Index which tracks 7 dimensions with 35 indicators [23].
One of the deficiencies noticed during the literature analysis is insufficient planning of selection of measures and actions, which are set in order to reach goals in the reduction of energy usage and GHG emissions, since these need to be a part of the overall methodology for local energy planning. Currently, the process is mostly implemented by drafting a small group, consisting of a few of the most relevant municipal employees, which includes interested stakeholders, to reach a common decision on which measures should be implemented [24]. Targeted reduction of CO2 emissions is often conducted ad hoc and does not follow the rule to have the lowest costs and reach the maximal influence of the local economy while trying to reach the given reduction goals, which is particularly important when considering that most of the cities do not have sufficient budget for planned SECAP projects [25]. The selection of measures for the reduction of CO2 emissions and implementation of renewables in municipalities is analysed in [26]. One of the basic conclusions reached is that in small cities and municipalities, which are mostly rural, there is a possibility to have a higher penetration of renewable energy sources in the reduction of CO2 emissions [27], while in big cities, energy efficiency measures have priority. With the development of different tools and scenarios, local authorities are often trying to actively include local stakeholders and decision makers so that they could be involved in the selection of alternative scenarios and select the most appropriate one for their own local or regional community [28]. Some authors argue that diverse stakeholders need to be involved to ensure that the process is participative, inclusive, holistic, simple and transparent, in order to be successful [29]. This brings us to the choice of alternative measures and scenarios, which are not always optimal for common economic and environmental criteria, although some methods could help stakeholders find the optimal solution by giving them the possibility to evaluate different scenarios [30].
The objective of this research is to upgrade the methods for local and regional energy planning through optimal selection of measures and alternative scenarios for the reduction of CO2 emissions. We aim to optimise the application of measures on local and regional levels considering economic and environmental criteria. The hypothesis is that with the use of optimisation models it is possible to find such sets of measures and alternative scenarios that will allow those with less financial means to reach a minimal reduction of CO2 emissions of 40% in local and regional energy systems. With aggregation of local plans and disaggregation of regional plans, use of financial means and available financing mechanisms for the implementation of measures can be optimised. This will result in the upgrade of a method for the optimal choice of measures in the energy planning on the local and regional level through a modified total cost abatement curve considering economic criteria. This will increase the accuracy of the current method for the visualisation of choice of measures for emission reduction and alternative scenarios on the local and regional level and provide stakeholders and decision makers with a new tool for the selection of mitigation measures.
The paper is structured as follows. After Section 1 in which the introduction to the topic and literature review is given, in the Section 2, method used for the optimisation of measures and presentation of the results is given. Then, Section 3 provides the data on the case study location as well as the results of the mitigation measures analysis and the results of the optimisation. In the final section, results are discussed in comparison with the already published work from this research topic.

2. Materials and Methods

To reach the objective of the research, the methodology was developed. The methodology consists of several parts. In the first part, the analysis of sustainable energy and climate action plans that are developed by cities and municipalities within the Covenant of Mayors’ initiative is performed. Due to the availability of many sustainable energy and climate action plans, it is considered that in this way enough methods and approaches, which were used for their development, will be covered. The focus was on the SECAPs developed in Croatia due to the accessibility of the data on the cost and mitigation measures. During the analysis, special attention was focused on the measures and the development of alternative scenarios for the reduction of energy consumption and CO2 emissions. The focus of the analysis was to provide enough data on the cost-effectiveness of the measures to construct the basis for the optimisation analysis of potential measures. The data which were used from the existing plans are CO2 reduction potential, reduction of energy consumption, production of renewable energy and total cost of the measure implementation.
Measures for the reduction of energy consumption and CO2 emissions are most often grouped by sectors of energy consumption. Analysed measures can be found in sectors of energy consumption listed in sustainable energy action plans such as buildings, transport, public lighting, industry, water and wastewater management, etc. The sector of buildings is further subdivided into public buildings, households and commercial buildings. The transport sector is subdivided into public transport, vehicles owned by the local and regional government and other road transport. In this way, it is determined which measures are mostly used in each sector and what are their expected effects and how large are the costs connected to their implementation. The potential influence of each measure on the reduction of energy consumption and CO2 emissions is determined.
In the second part of the research, based on the collected data on measures, the regression functions were created in Microsoft Excel tools. The regression functions can be updated through the changing of the coefficients when the new data are added from additional SECAPs. The SECAPs used for the development of the functions and coefficients are listed in Appendix A, Table A1. The functions were used for the generation of the equations which connect the cost of the measure with total CO2 emission reduction potential. The functions were later used in the optimisation part of the research together with restrictions of the case study example to provide an optimal cost solution. The objective of the proposed optimisation problem is to minimise the objective function f given in Equation (1). The objective function includes all previously defined regression functions and represents the overall cost of implemented measures. Thus, the objective of the problem is to minimise the overall cost of the implementation of the mitigation measures.
min   f min { x 1 · k 11 · e k 12 · x 1 + x 2 · k 21 · e k 22 · x 2 + x 3 · k 31 · e k 32 · x 3 + x 4 · k 41 · x 4 k 42 + x 5 · k 51 · x 5 k 52 + x 6 · ( k 61 · x 6 2 k 62 · x 6 + k 63 ) + x 7 · k 71 · e k 72 · x 7 x 8 · ( k 81 · ln x 8 k 82 ) x 9 · ( k 91 · ln x 9 k 92 ) + x 10 · k 101 · e k 102 · x 10 x 11 · ( k 111 · ln x 11 k 112 ) + x 12 · ( k 121 · x 12 k 122 ) + x 13 · ( k 131 · x 13 2 k 132 · x 13 + k 133 ) + x 14 · k 141 · x 14 k 142
where:
  • x1 is the level of reduction of CO2 emissions by the implementation of integrated renovation of public buildings;
  • k11 and k12—coefficients for the calculation of specific cost gained from regression analysis of integrated renovation of public buildings from other SECAPs, k11 = 16,411.76, k12 = 0.00019845;
  • x2 is the level of reduction of CO2 emissions by the implementation of energy renovation of public buildings;
  • k21 and k22—coefficients for the calculation of specific cost gained from regression analysis of energy renovation of public buildings from other SECAPs, k21 = 3040.48, k22 = 0.00022593;
  • x3 is the level of reduction of CO2 emissions by the implementation of PVs on public buildings;
  • k31 and k32—coefficients for the calculation of specific cost gained from regression analysis of PVs on public buildings from other SECAPs, k31 = 6128.25, k32 = 0.0016649;
  • x4 is the level of reduction of CO2 emissions by the implementation of solar thermal on public buildings;
  • k41 and k42—coefficients for the calculation of specific cost gained from regression analysis of solar thermal on public buildings from other SECAPs, k41 = 11,131, k42 = 0.527;
  • x5 is the level of reduction of CO2 emissions by the implementation of electrification of public transport;
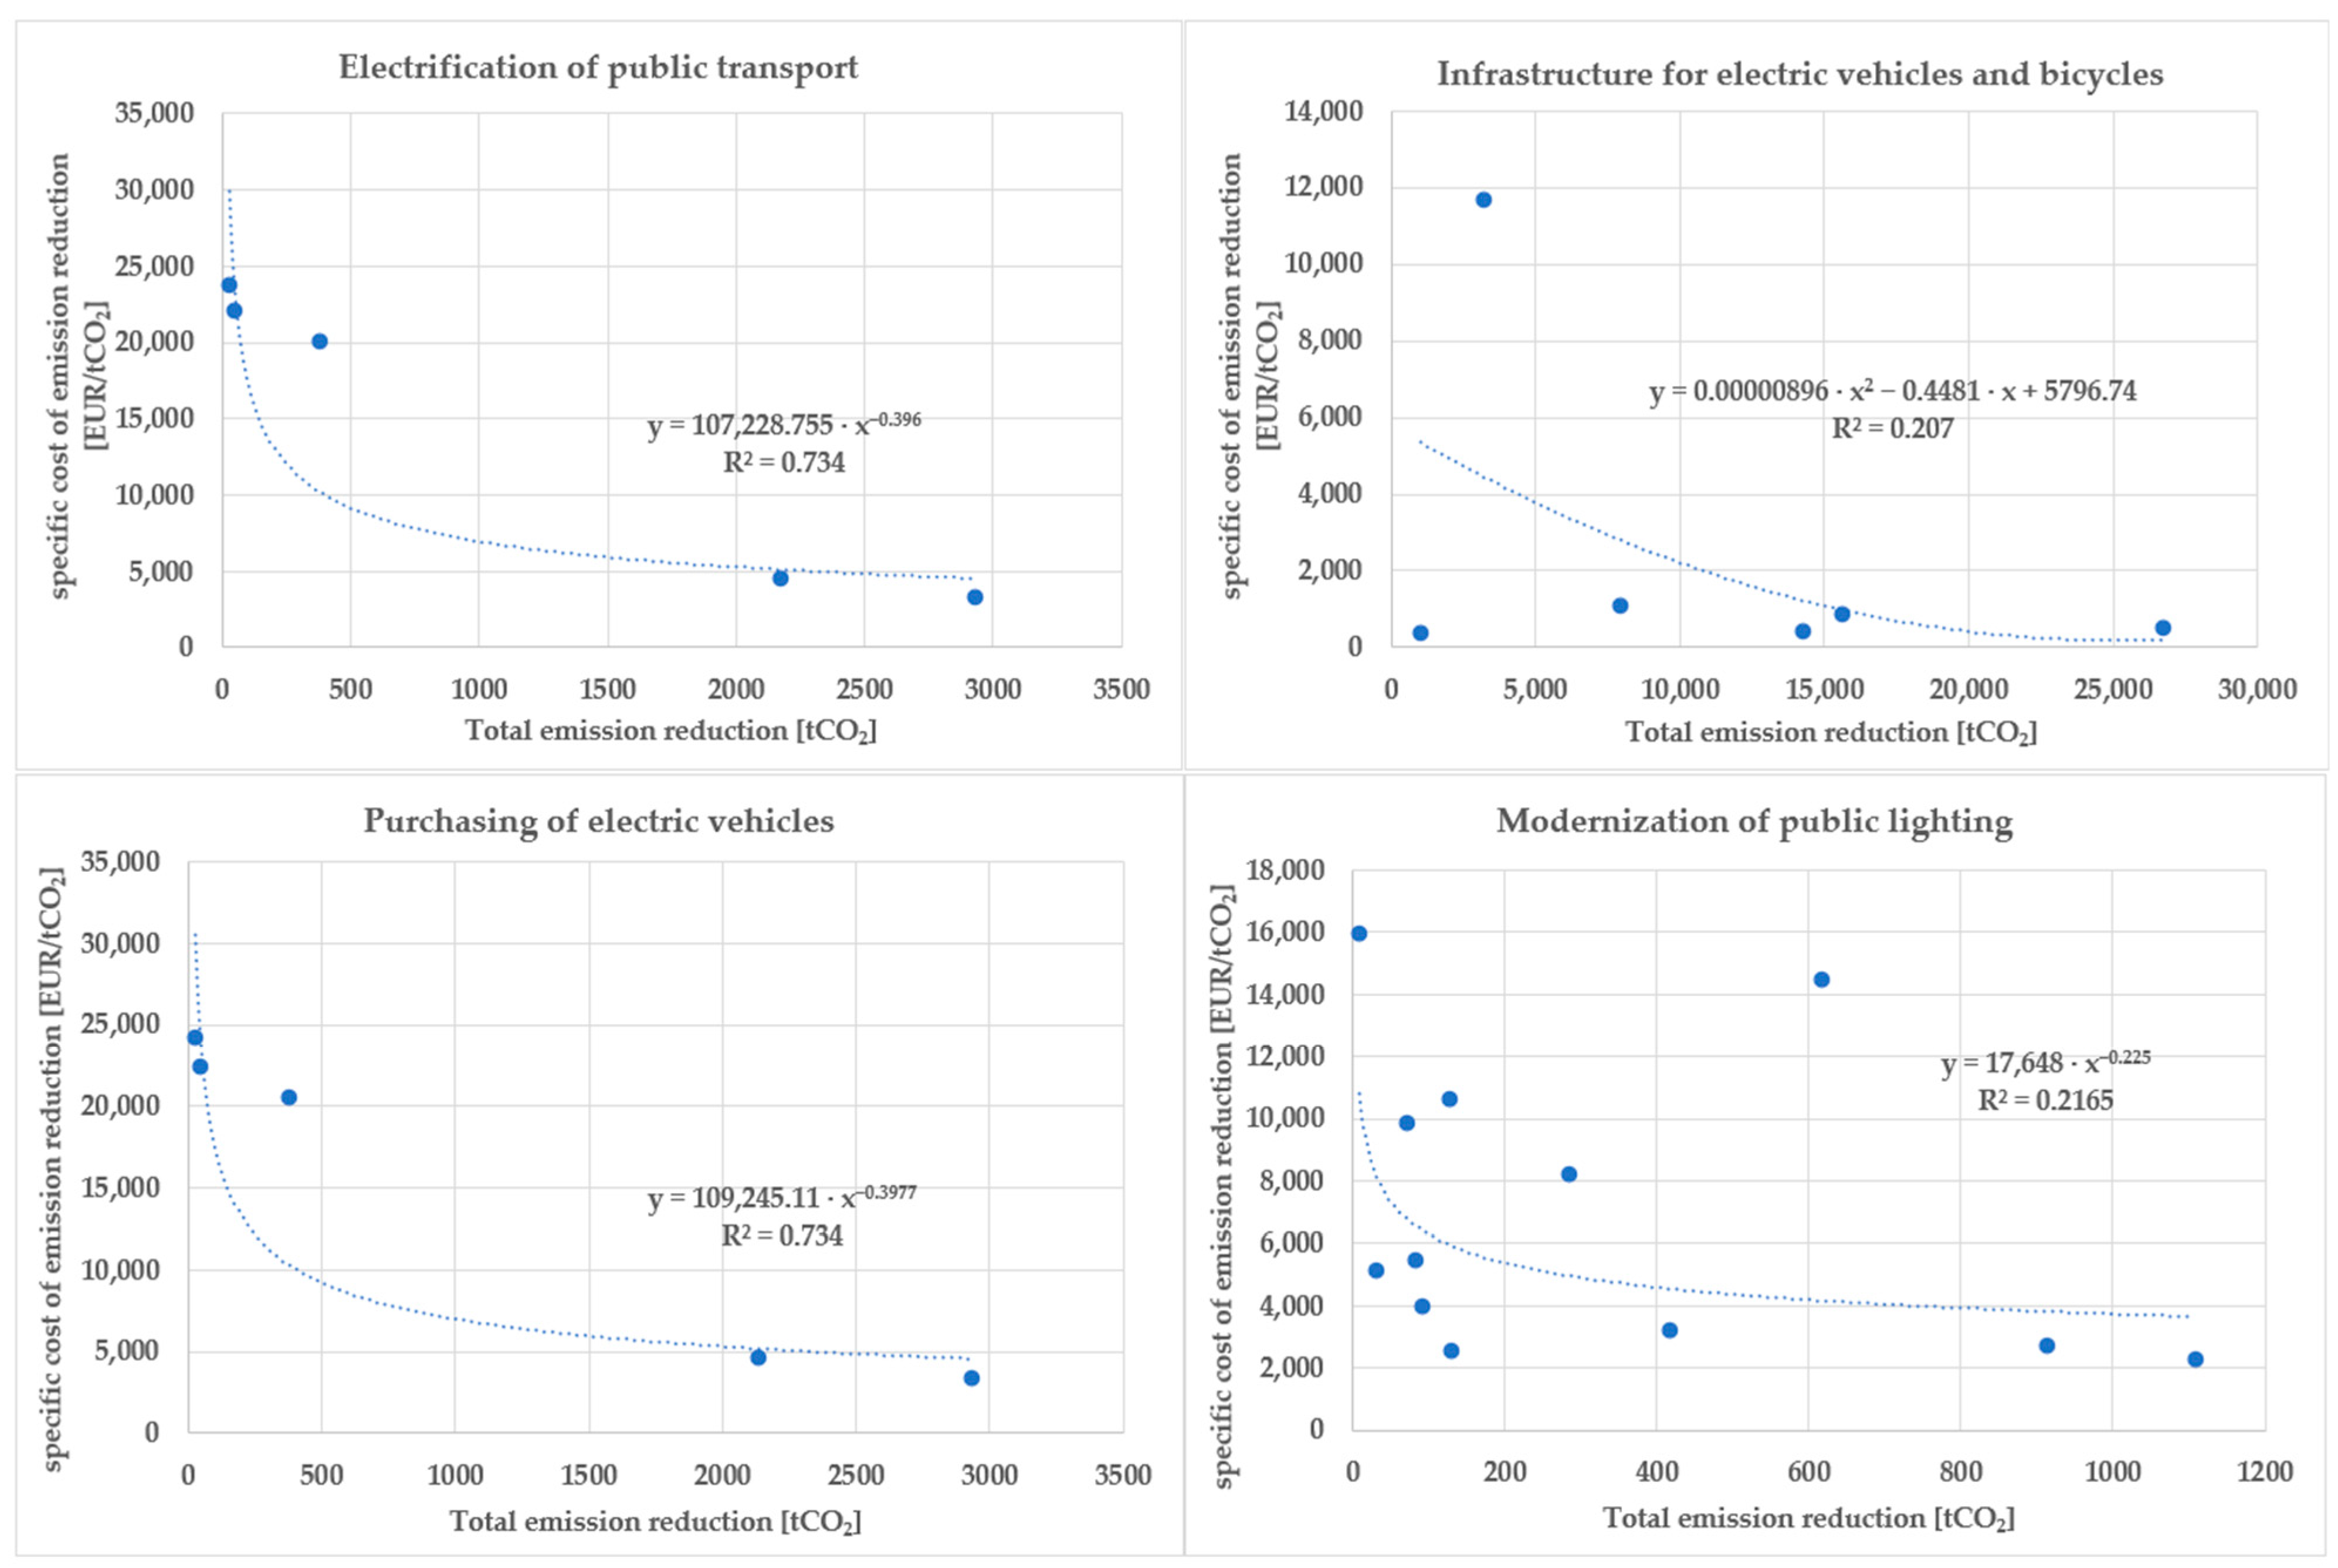
  • k51 and k52—coefficients for the calculation of specific cost gained from regression analysis of electrification of public transport from other SECAPs, k51 = 107,229, k52 = 0.396;
  • x6 is the level of reduction of CO2 emissions by the implementation of integrated renovation of multi-apartment buildings;
  • k61, k62 and k63—coefficients for the calculation of specific cost gained from regression analysis of integrated renovation of multi-apartment buildings from other SECAPs, k61 = 0.00023089, k62 = 4.67701, k63 = 29,089.21;
  • x7 is the level of reduction of CO2 emissions by the implementation of integrated energy renovation of residential buildings;
  • k71 and k72—coefficients for the calculation of specific cost gained from regression analysis of integrated energy renovation of residential buildings from other SECAPs, k71 = 35,236.21, k72 = 0.00007884;
  • x8 is the level of reduction of CO2 emissions by the implementation of energy renovation of residential buildings;
  • k81 and k82—coefficients for the calculation of specific cost gained from regression analysis of energy renovation of residential buildings from other SECAPs, k81 = 722.1, k82 = 13,030;
  • x9 is the level of reduction of CO2 emissions by the implementation of PVs on residential buildings;
  • k91 and k92—coefficients for the calculation of specific cost gained from regression analysis of PVs on residential buildings from other SECAPs, k91 = 627.8, k92 = 7772.2;
  • x10 is the level of reduction of CO2 emissions by the implementation of energy renovation of commercial buildings;
  • k101 and k102—coefficients for the calculation of specific cost gained from regression analysis of energy renovation of commercial buildings from other SECAPs, k101 = 9744.8, k102 = 0.0000328;
  • x11 is the level of reduction of CO2 emissions by the implementation of PVs on commercial buildings;
  • k111 and k112—coefficients for the calculation of specific cost gained from regression analysis of PVs on commercial buildings from other SECAPs, k111 = 627.8, k112 = 7772.2;
  • x12 is the level of reduction of CO2 emissions by the implementation of modernisation of public lighting;
  • k121 and k122—coefficients for the calculation of specific cost gained from regression analysis of modernisation of public lighting from other SECAPs, k121 = 17,648, k122 = 0.225;
  • x13 is the level of reduction of CO2 emissions by the implementation of infrastructure for electric vehicles and bicycles;
  • k131, k132 and k133—coefficients for the calculation of specific cost gained from regression analysis of infrastructure for electric vehicles and bicycles from other SECAPs, k131 = 0.00000896, k132 = 0.4481, k133 = 5796.741;
  • x14 is the level of reduction of CO2 emissions by the implementation of purchasing of electric vehicles;
  • k141 and k142—coefficients for the calculation of specific cost gained from regression analysis of purchasing of electric vehicles from other SECAPs, k141 = 109,245.1, k142 = 0.3977;
Other equations provide restrictions based on the physical limitations for the reduction of CO2 in the case study used for the demonstration of the optimisation model. Equation (2) gives the required reduction of CO2 emissions level for the model. Equation (3) provides the limit for the maximal reduction of CO2 emissions in the public building by limiting the effect of measures 1, 2, 3 and 4 which contribute to the reduction of CO2 in public buildings. Furthermore, Equation (4) provides a limitation for the reduction of CO2 emissions with measures in residential buildings, while Equation (5) provides limitations for commercial buildings. Additionally, Equation (6) gives a limit for the maximal CO2 reduction in the transport sector and Equations (7) and (8) provide correlation between two transport sector measures optimised in the paper. The last Equation (9) provides a limit that one measure can contribute only to the maximal level of reduction, which is possible to achieve by that measure.
i = 1 n x i requested   level   of   CO 2   reduction
x 1 + x 2 + x 3 + x 4 max   CO 2   reduction   in   public   buildings
x 6 + x 7 + x 8 + x 9 max   CO 2   reduction   in   residential   buildings
x 10 + x 11 max   CO 2   reduction   in   commercial   buildings
x 13 + x 14 max   CO 2   reduction   in   the   transport   sector
x 3 x 3 max x 4 x 4 max
x 3 x 3 max + x 4 x 4 max 1
x i n x max i n
The next step in the methodology is the optimisation of the measures based on the given equations and parameters of the case study. The modelled problem represents a non-linear (NLP) problem as exponential functions and multiplication of variables occurs in the modelled equations. This means that the solution of the problem will not guarantee a global optimum and that the problem must be solved by implementing iterative techniques. However, since the described problem does not have a significant number of variables (15 variables and 9 constraints), the solution of such a problem will have a neglectable deviation from the global optimum. Thus, the problem was solved in the GAMS tool with an NLP solver on a 16 GB RAM machine, similar to [31].
In the final part of the method, visualisation of the results is achieved via the total cost abatement curve which, on the diagrams for the different total levels of CO2 reduction, rank measures based on their cost and abatement level from the most cost-effective to the least cost-effective.

3. Results

The results section is divided into three subsections. In the first subsection, the basic data of the case study location are presented with a summary of the area and the data on the energy consumption in different sectors and by different fuels as well as emissions of CO2 emitted from those sectors. The second subsection gives details on the analysed measures and SECAPs which were investigated to provide data for the analysis. It also provides figures which show the inputs for the equations of the optimisation model, and which were used to calculate the costs of the reference scenario which was developed in the stakeholders’ participatory approach as a part of the Joint_SECAP Interreg Italy Croatia project. The last subsection of the results chapter provides results of the optimisation model as a total cost abatement curve for different levels of CO2 reduction, respectively, 40%, 45%, 55% and 63%, which is maximal considering given constraints.

3.1. Data on the Case Study

The case study location, referred to as the wider Dubrovnik area, represents the southernmost part of the Republic of Croatia which consists of five administrative units which gravitate towards the city of Dubrovnik, namely: Municipality of Konavle, Municipality of Zupa Dubrovacka, Municipality of Dubrovacko primorje and Municipality of Ston. The area is surrounded by the Bosnian border on the north and east, the Montenegro border on the south and the sea on the west. The main economic activity in the area is tourism and agriculture, mainly aquaculture, and therefore sustainability is a priority for the local authorities. The energy consumption of the area in 2015, which is used as a baseline year for the development of the SECAP, is given in Table 1, while Table 2 gives the yearly CO2 emissions. The CO2 emissions per different fuel and sector shown in Table 2 are calculated based on the standard emission factors provided in Table 3.
Electricity is the most consumed energy source in the area, followed by diesel and petrol fuels. The sector consuming most of the energy is transportation, followed by residential and commercial buildings. On the other hand, diesel fuel emits the highest emissions while electricity takes second place due to the low CO2 national emission factor. The sector with the highest emissions is transportation, which emits almost 58% of total emissions, making it the first candidate for the CO2 reduction measures. Since in buildings, most of the energy is covered by electricity and biomass which have low CO2 emission factors, buildings are not the main emitter of CO2.

3.2. Measures for the Reduction of CO2 Emissions

To provide measures for the CO2 emission reduction in the given area, analysis of the measures in the existing SECAPs was performed. SECAPs for the cities and municipalities which were analysed are listed in Appendix A, Table A1. The analysed SECAPs range from small municipalities with a few thousand citizens, through Mediterranean islands and cities to a large city with 800,000 inhabitants, thus providing a good representation of different cases. The analysed SECAPs provided a baseline that was used for the selection of the most common measures for the reduction of CO2 emissions which are grouped by sectors and divided on individual measures and set of measures. The list of the individual measures and their factors used in the optimisation equation is the following:
  • Energy renovation of public buildings (x2);
  • PV on public buildings (x3);
  • Solar thermal on public buildings (x4);
  • Electrification of public transport (x5);
  • Energy renovation of residential buildings (x8);
  • PV on residential buildings (x9);
  • Energy renovation of commercial buildings (x10);
  • PV on commercial buildings (x11);
  • Modernisation of public lighting (x12);
  • Infrastructure for electric vehicles and bicycles (x13);
  • Purchasing of electric vehicles (x14).
Besides individual measures, there are also sets of measures which consist of a combination of at least two individual measures:
  • Integrated renovation of public buildings (x1);
  • Integrated renovation of multi-apartment buildings (x6);
  • Integrated energy renovation of residential buildings (x7);
  • Electrification of transport (x13 + x14).
The measures are also listed according to sectors and those are shown in the following figures, which also show the relationship between the specific cost of CO2 emission reduction and total CO2 emission reduction. These inputs were used to model the minimum cost optimisation function. Figure 1 gives the overview of the measures and equations used in the calculation of cost for the reduction of CO2 emissions in public buildings.
All the measures shown in Figure 1 have a reduction of specific costs with the increase of the total emission reduction. The specific cost ranges from min of 1000 EUR/tCO2 for solar thermal on the public building to the max of 40,000 EUR/tCO2 in the case of integrated renovation of public buildings. The average values of specific costs for measures range from 2000 to 8000 EUR/tCO2. Figure 2, Figure 3 and Figure 4 also show the relationship between the specific cost of CO2 emission reduction and total CO2 emission reduction just for the different sectors. Figure 2 shows the sector of commercial buildings while Figure 3 shows the transport and public lighting. Figure 4 gives an overview of measures in the residential sector.
Measures in all sectors experience the same trend as the ones in the public building sector in which the specific cost is reduced by the higher reduction of the total CO2 emissions. The two measures are exceptions from this trend and those are PV on commercial buildings which shows a slight increase of the specific cost and energy renovation of the multi-apartment building which shows the first reduction and after some point increases in the specific cost. The reason why the specific cost has these trends should be further investigated since this was not the focus of the research and the specific cost data from SECAPs were used as an input for the optimisation model.

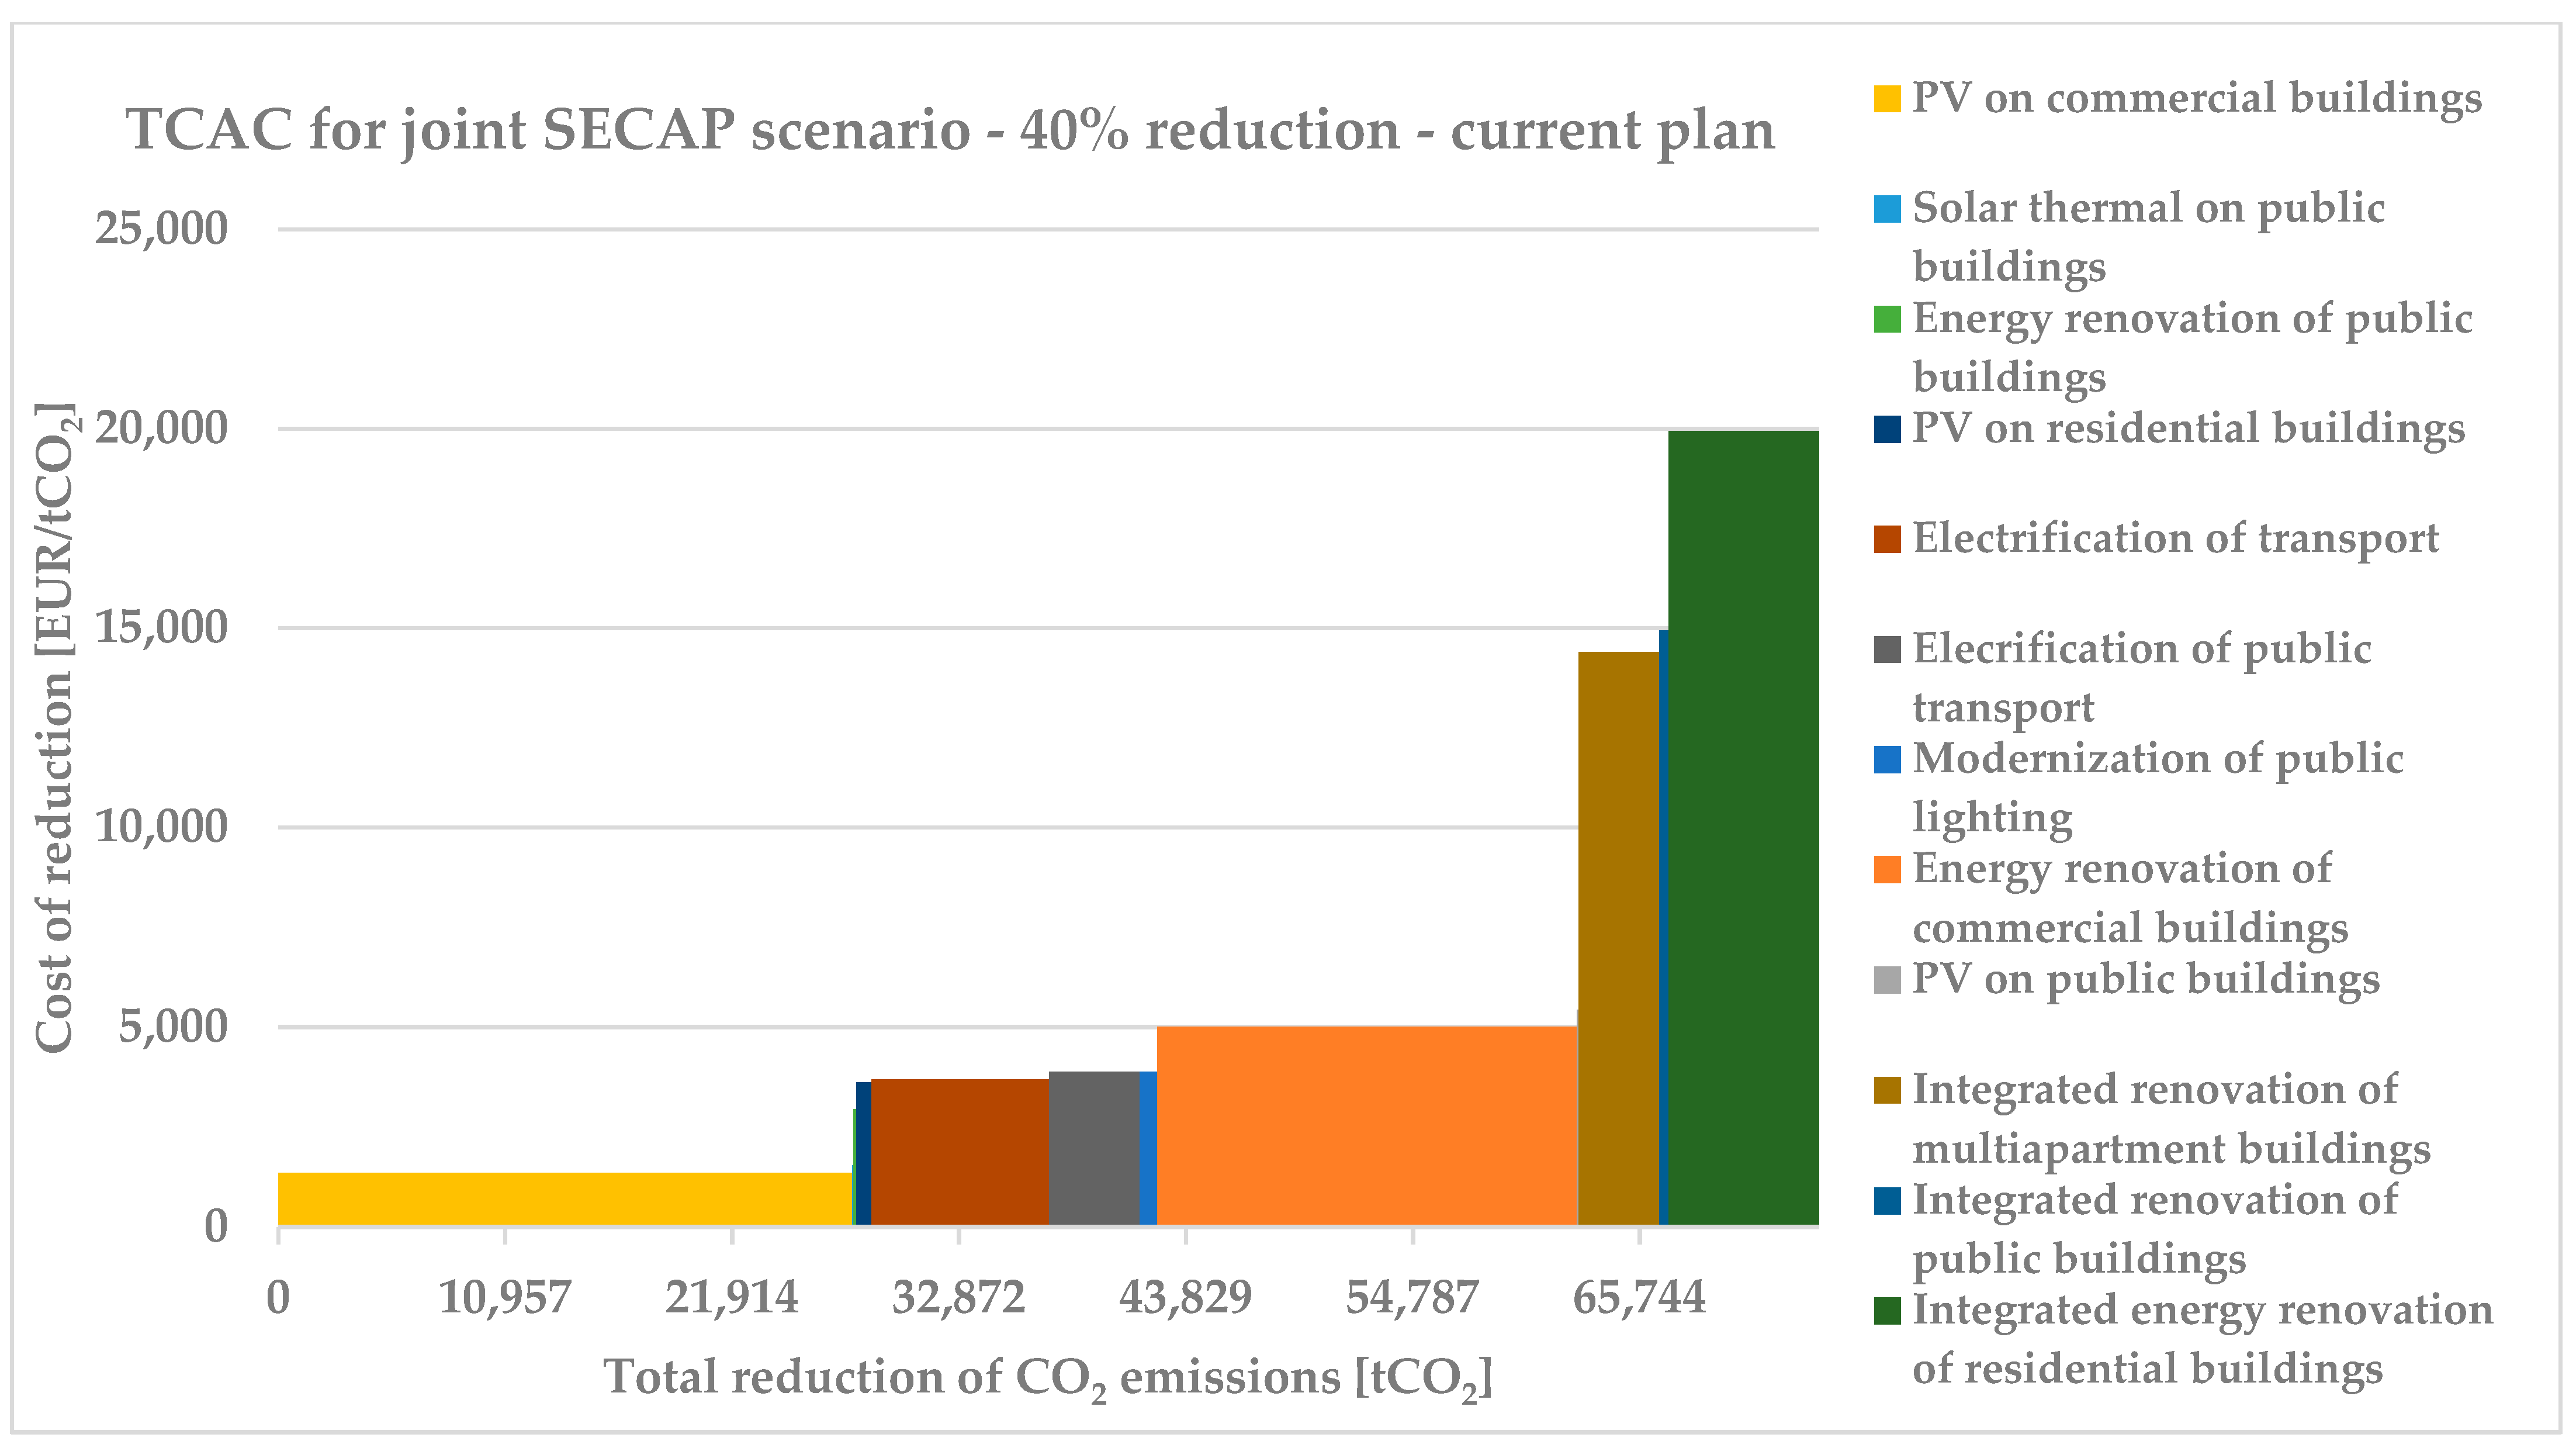
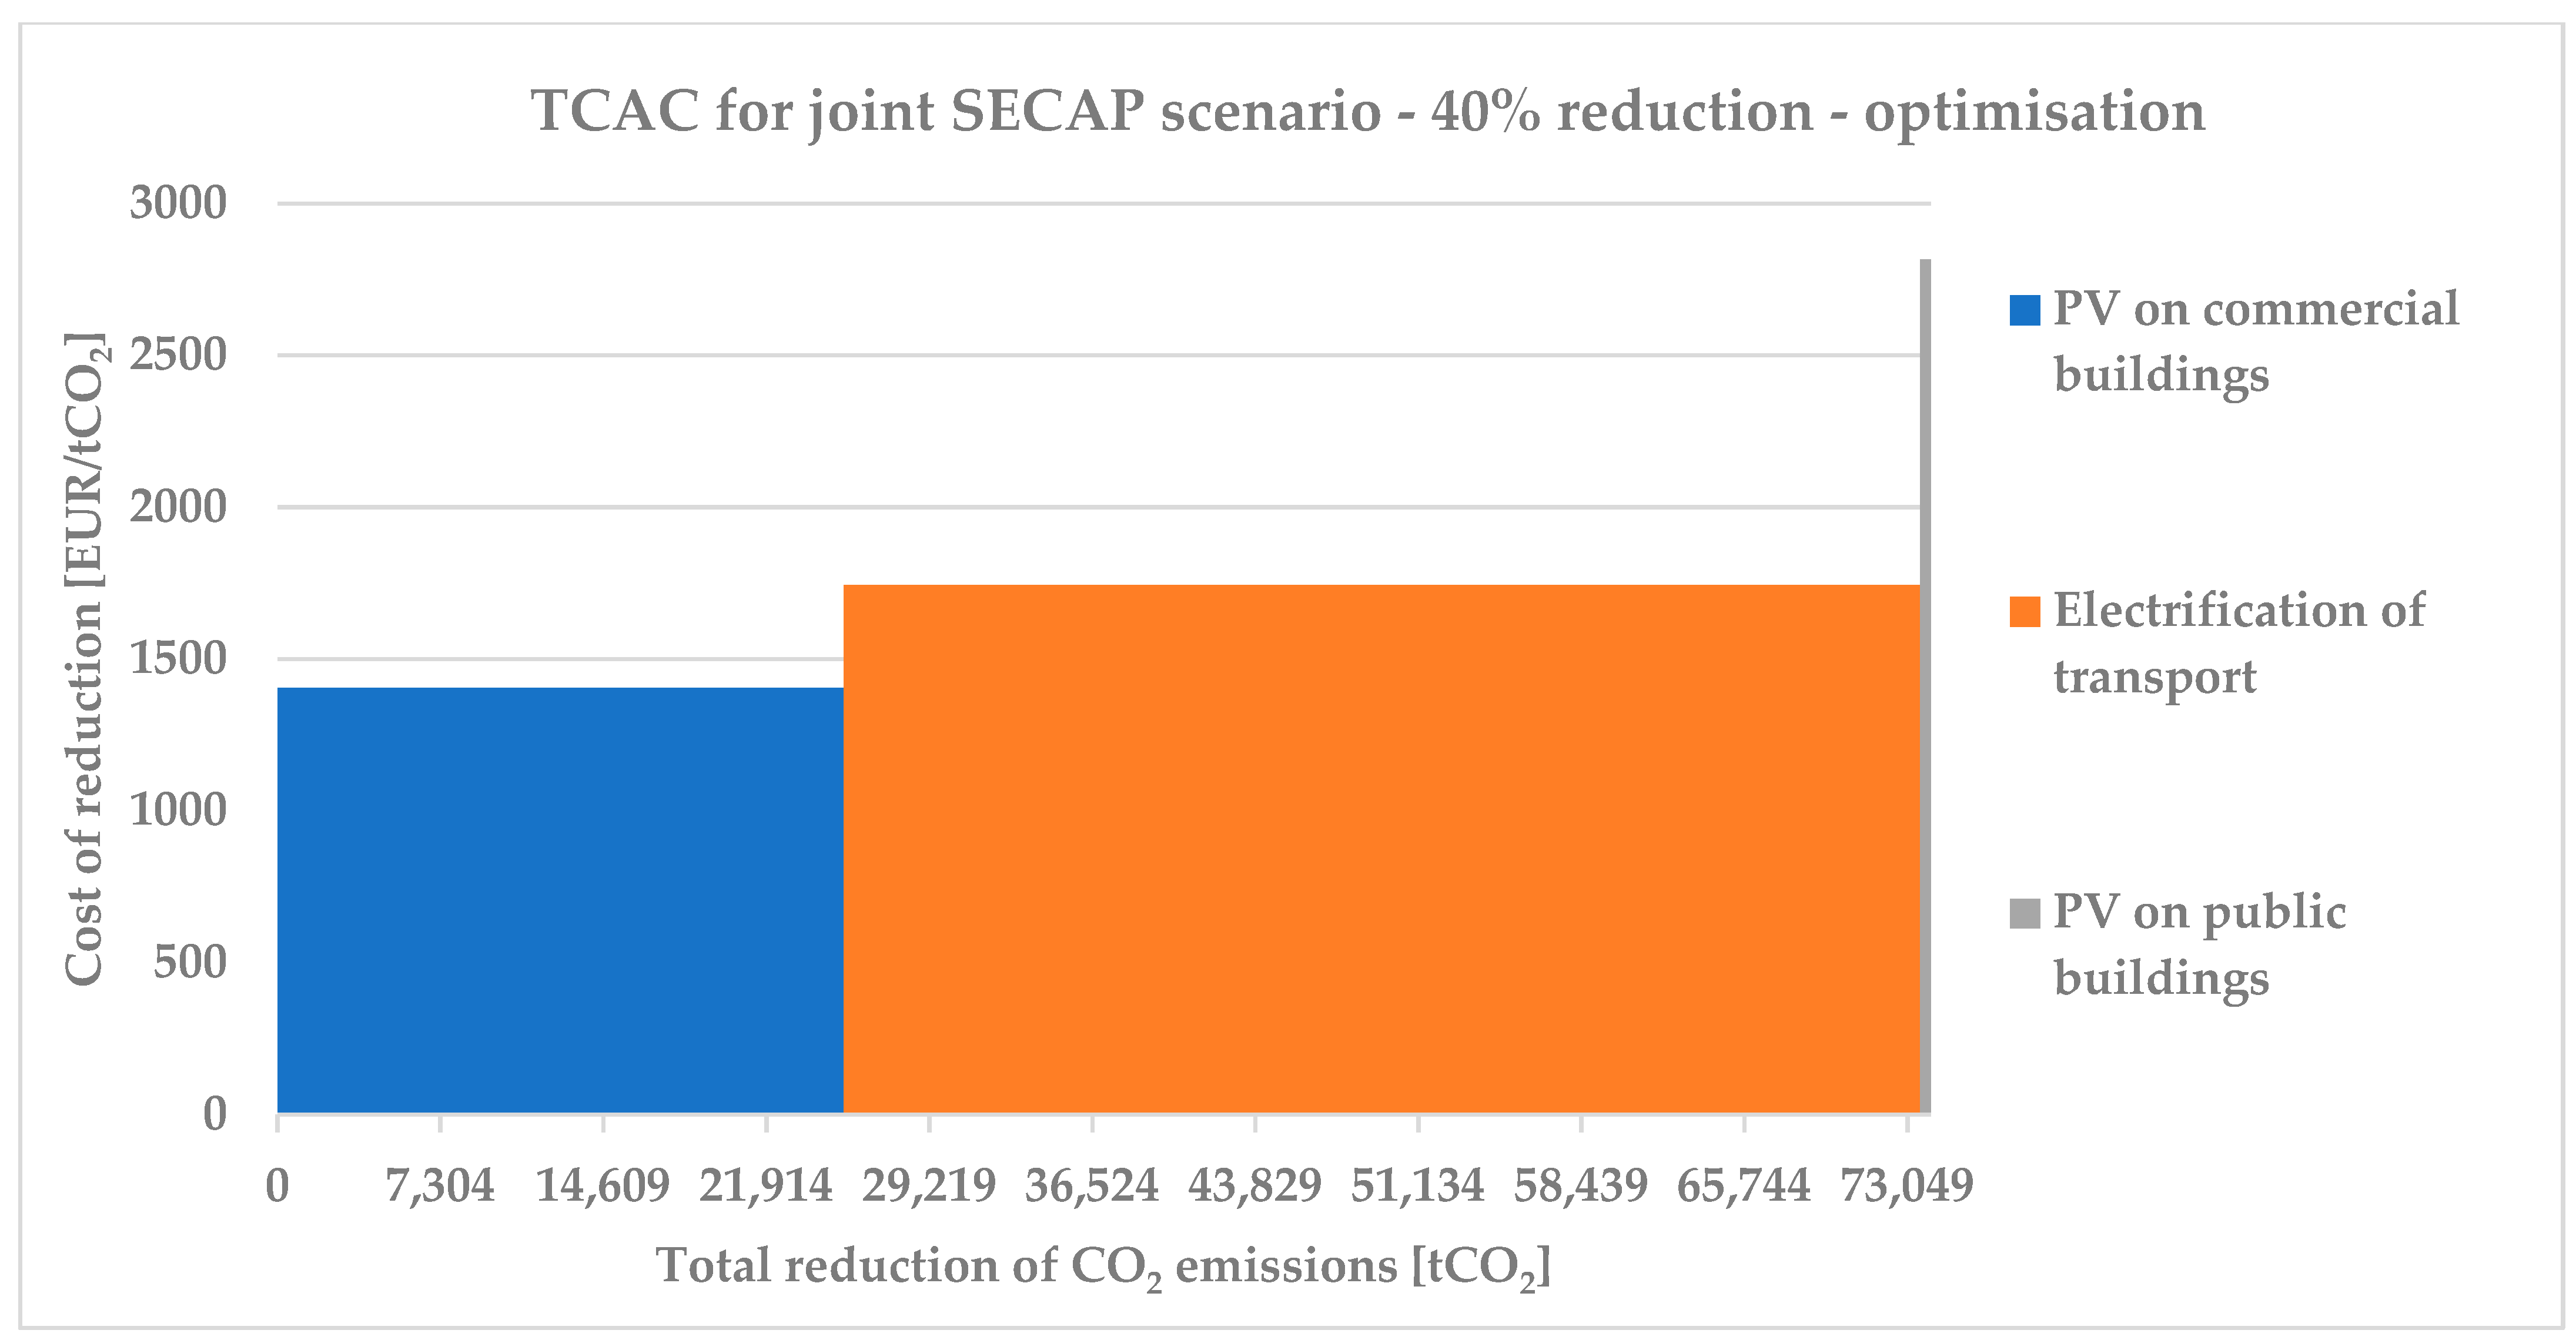
3.3. Optimisation of Measures Implementation

After the most common measures were analysed and written as the equation connecting the specific cost of emission reduction to the total emission reduction level, the equations were used to create a minimum cost equation. Together with the model limitations, a minimal cost equation was used for the optimisation of the implementation of the measures, whose results will be shown in the following figures. To compare the current cost of the reduction of CO2 emissions for the case study area with the optimisation of measures, implementing the calculation of the current plan cost was performed. The level of implementation of each measure and set of measures was taken from the existing SECAP for the wider Dubrovnik area [33]. The results of the implementation of the current plan with the order of implementation of measures and their specific cost and contribution to the total CO2 emission reduction are shown in Figure 5. The contribution to the total CO2 reduction can be seen on the horizontal axis while the specific cost is shown on the vertical one. The total cost of one measure in EUR is represented by the rectangular area showing each measure. Measures should be implemented in the order of how they are presented on the figure from those with the lowest to those with the highest specific costs.
The measures that most contribute to the CO2 emission reduction are PVs on commercial buildings, energy renovation of commercial buildings, electrification of transport and integrated energy renovation of residential buildings. On the other hand, Figure 5 provides clear instructions on which measures should be implemented first and which should be implemented last to reach the reduction with the lowest cost possible. The current plan has an estimation of the total cost reaching a 40% reduction considering current CO2 emissions of 401.5 MEUR. To make it possible to reduce the current plan cost and reach the same level of CO2 reduction for the case study area, the before mentioned optimisation model was developed. The results of the model optimisation of measures implementation are shown in Figure 6, while the total cost of the reduction reached 121.1 MEUR in this case. The optimisation model followed limitations given in Equations (3)–(8) and resulted in the need to implement only three measures to reach the 40% emission reduction for the given area. Those measures are, in the order of implementation, PV on commercial buildings, electrification of transport and PV on public buildings. Furthermore, the model was tested on the reduction of CO2 emissions by more than 40% by increasing the wanted level of reduction by 5%, thus creating new goals of 45%, 50%, 55%, 60% and 65%, respectively. Those results are shown in Figure 7 and measures are organised in the order of how they should be implemented. The result for the reduction of the emissions by 65% was not possible to calculate since the limitations of the case study applied to the model allow reduction of emission up to 63.52%.
The results for the reduction of emission for 45% have the same measures as the 40% ones except they add a measure of implementation of PVs in residential buildings. When looking at the 55% reduction, the two additional measures are added: renovation of public buildings and electrification of public transport. The last emission reduction level of 63.5% which is shown in Figure 7 adds three new measures, which are the modernisation of public lighting, renovation of multi-apartment buildings and energy renovation of commercial buildings.
The results shown in the previous two figures show that the most promising measures for the reduction are those which promote the installation of PVs and electrification of transport. This is expected since the highest reduction potential is in the transportation sector while electricity is the highest energy source consumed in the case study area. The other reason is that those measures have the lowest specific cost when implemented on a large scale which can be shown from the results of the analysis from developed SECAPs in Figure 1, Figure 2, Figure 3 and Figure 4. The comparison of the total cost of the CO2 emission reduction for different levels comparing the original scenario and optimisation ones from 40% to 63.5% is provided in Figure 8. The total costs of the optimisation scenarios are much lower than the original, which shows that it is possible to reach the same or higher levels of CO2 emission reduction with lower use of financial resources.

4. Discussion and Conclusions

The results presented in the previous chapter provide a good overview of the actions for the reduction of energy consumption and CO2 emissions for the SECAPs in Croatia. When the given list of measures is correlated with the specifics of the case study, the most suitable measures are highlighted as the ones which should be first implemented. The case study area has a Mediterranean climate and high penetration of electricity with low CO2 emission factor in the consumption of buildings, thereby promoting transport as the highest emitting sector. This has a large impact on the selection of the measures for reducing CO2 emissions where the electrification of transport is the measure with the highest reduction potential. The other actions which are presented in all optimisation scenarios are related to the installation of PVs on buildings which will provide further reduction of CO2 emissions from electricity and open the path for further penetration of electrification in all buildings and transport sectors. The production of energy on the site of consumption will increase the level of self-sufficiency from the energy point of view and in the wider logic of self-efficient social communities [34]. The proposed measures are in line with other analyses performed on the most common actions in which the local electricity production is highlighted as one of the best measures for energy and emission reductions [22].
The result of the measures optimisation is the key enabling factor for high reduction of the CO2 emissions and mitigation actions on the analysed territory since the model supports the alignment with the baseline emission inventory by focusing the implementation in the sectors with the highest emission, i.e., transport. The alignment of the measures with the highest emitting sectors is the most important since it allows local authorities to achieve ambitious reduction goals [35].
Another specific factor of the case study is that it consists of small municipalities and one city with less than 50,000 inhabitants which without a joint approach could not reach the economy of scale for the cost-effective optimisation of the measures as shown in Figure 1, Figure 2, Figure 3 and Figure 4. With the joint implementation of measures, the small municipalities need coordination from the upper regional level which can provide tailor-made solutions for sustainable energy planning as well as concrete financing opportunities for mitigation measures on their territories [36]. Another benefit of the joint development of the action plan is the support received from the upper level in the calculation of baseline and monitoring emission inventory and development of the action plan [36].
The specific cost for the reduction of CO2 emissions is in a wide range from 1000 EUR/tCO2 to 40,000 EUR/tCO2 with the average values being between 2000 and 8000 EUR/tCO2. This can be considered rather high compared to the previous analysis [22] but it has to be taken into account that in this work we only took into account so-called hard measures. The resulting cost of the measures is based on the minimisation of the cost function with the coefficients calculated based on the mitigation measures from the previously developed SECAPs. This approach has limited power since the changing of the form of the function can lead to different conclusions as well as changes in the coefficients.
The results of measures cost from the analysis considering the measures per sector are in line with the previous research showing that the highest cost is related to the measures in residential buildings and the lowest with the measures for local electricity production [22]. On the other hand, the electrification of transport is one of the cheapest measures in our analysis, but in the previous research [22] it was one of the most expensive. This could be due to the specifics of the case study with very low emissions from the electricity and buildings and very high emissions from transport. A similar conclusion can be taken from other studies where cases were cities which had high emissions from the transport sector and where the main measures which should have been prioritised are the ones in the transport sector [37]. Additionally, the measures in the transport sector could be more easily implemented than the measures in the buildings sector since it has fewer key decision makers [38]. Another benefit of focusing on the reduction of CO2 emissions from the transport sector is also the reduction of air pollutant emissions, which is not always clear for the residential sector, where CO2 emissions can be reduced but air pollutant emissions are increased, for example, in the case of introducing biomass heating [39]. The reduction of local air pollutant emissions is also increased by the installation of the PVs on buildings, which is another measure that is prioritised in our case. This can be beneficial for reducing local air pollutants from local electricity production as well as for heating if the PVs are combined with heat pumps. Another measure that is beneficial both for local air quality and the reduction of CO2 emissions is energy renovation of buildings [39], which is the next measure in terms of prioritisation in our case study (Figure 7). Since the benefits of the air pollution reduction are not validated in the model, this should be part of the future research as well as the validation of other external costs reduced by implementation of measures such as additional green jobs, health and social benefits for the community.
The results of the optimisation of measures are also important to organise measures in order of implementation by prioritising lower cost measures. In this way, it could be possible to increase the overall implementation of SECAP measures which is currently considered to be low, with only 19% of measures fully implemented [40]. Moreover, in this way, the lack of appropriate financial planning which is marked as the constant and most common element in existing SECAPs [34] is being reduced since lower financial means are required. The lack of the financial and cost-benefit analysis in current SECAPs, as well as business plans and risk analysis, is a very negative element in implementation that needs to be properly addressed in the future [34].
The other important benefit of measures prioritisation and optimisation is the financial savings, but also the saving of other resources such as human and organisational [41]. This could provide a significant saving in our case, from 70% to 3 times reduction of costs for achieving the same or higher reduction of CO2 emissions. The results of the prioritisation can be helpful to the policymakers in the cities and municipalities to forge their mitigation strategies and to give an answer on which sectors and measures they should focus their activities. Even though the prioritisation provides the most cost-beneficial measures to be implemented first, the policymakers should also work on the integrated and mixed mitigation strategies, considering the influence and interaction [42] between the measures from different sectors since the potential synergies and trade-offs between different policies could provide acceleration in the reaching of the mitigation goals [43]. The prioritisation could also provide a faster reduction of the emissions in the beginning and thus could encourage good practice, inspire both green investments and energy savings and go beyond the target set without increasing public debt [44]. Moreover, the prioritising of measures provides a strong tool for the local government which has opted for smart planning, sustainable development, environmental protection and increasing security of supply as pointed out in [45]. Additionally, the increased implementation can have social benefits such as increased employment and reduced cost for the import of fossil fuels [46].
In future work, the interaction and integration of different measures need to be further investigated since they could have different effects on each other as shown in [42]. This was evaluated to some level and it was shown that transport sector measures for electrification need to be jointly implemented and that integrated renovation of the building does not reduce the cost of implementation and reach a high reduction level due to the limited levels of CO2 emissions from buildings in our case. Another integration of measures that should be further investigated is the joint implementation of adaptation and mitigation measures which will result in higher costs but could provide additional benefits in CO2 and local pollution reduction. An option for this integration could be the use of the SET-Plan on the regional and local levels by implementing synergies between different stakeholders [47].

Author Contributions

Conceptualisation, N.M. and G.K.; methodology, N.M. and M.M.; software, N.M. and M.M.; validation, N.M.; formal analysis, N.M.; investigation, N.M.; resources, G.K.; data curation, N.M.; writing—original draft preparation, N.M.; writing—review and editing, N.M., M.M. and G.K.; visualisation, N.M.; supervision, G.K.; project administration, N.M.; funding acquisition, G.K. All authors have read and agreed to the published version of the manuscript.

Funding

This research was funded by Interreg V A Italy Croatia Cross-border Cooperation Programme 2014-2020, project Joint strategies for Climate Change Adaptation in coastal areas—Joint_SECAP, grant number 10047506.

Institutional Review Board Statement

Not applicable.

Informed Consent Statement

Not applicable.

Conflicts of Interest

The authors declare no conflict of interest.

Appendix A

Table A1. List of measures, coefficients and SECAPs which were used as the data source.
Name of the Measurex Corresponding to the MeasureCoefficients for Calculation of the MeasureSECAPs Used as Data Sources [48]
Integrated renovation of public buildings x1k11 and k12City of Rijeka, City of Zadar, City of Osijek, City of Koprivnica, City of Varazdin, City of Cakovec
Energy renovation of public buildings x2k21 and k22City of Novigrad, City of Porec, City of Pula, City of Rovinj, Municipality of Brtonigla, City of Buje, City of Labin, City of Pazin, Island of Brac
PV on public buildings x3k31 and k32The city of Rijeka, City of Zadar, City of Osijek, City of Varazdin, City of Novigrad, City of Porec, City of Pula, City of Rovinj, Municipality of Brtonigla, City of Buje, City of Labin, City of Pazin, Island of Brac
Solar thermal on public buildings x4k41 and k42City of Zadar, City of Osijek, City of Cakovec, City of Novigrad, City of Porec, City of Pula, City of Rovinj, Municipality of Brtonigla, City of Labin, City of Pazin
Electrification of public transportx5k51 and k52City of Rijeka, City of Zadar, City of Osijek, City of Koprivnica, City of Varazdin
Integrated renovation of multi-apartment buildingsx6k61, k62 and k63City of Rijeka, City of Zadar, City of Koprivnica, City of Varazdin
Integrated energy renovation of residential buildingsx7k71 and k72City of Rijeka, City of Zadar, City of Osijek, City of Koprivnica, City of Varazdin
Energy renovation of residential buildingsx8k81 and k82City of Osijek, City of Varazdin, City of Cakovec, City of Prelog
PV on residential buildings x9k91 and k92The city of Rijeka, City of Zadar, City of Osijek, City of Varazdin, City of Cakovec, City of Novigrad, City of Porec, City of Pula, City of Rovinj, Municipality of Brtonigla, City of Buje, City of Labin, the City of Pazin, Island of Brac, City of Prelog
Energy renovation of commercial buildingsx10k101 and k102City of Rijeka, City of Zadar, City of Osijek, City of Koprivnica, City of Varazdin
PV on commercial buildings x11k111 and k112The city of Rijeka, City of Zadar, City of Osijek, City of Varazdin, City of Cakovec, City of Novigrad, City of Porec, City of Pula, City of Rovinj, Municipality of Brtonigla, City of Buje, City of Labin, the City of Pazin, Island of Brac, City of Prelog
Modernisation of public lighting x12k121 and k122City of Rijeka, City of Zadar, City of Osijek, City of Koprivnica, City of Varazdin, City of Cakovec, City of Porec, City of Pula, City of Buje, City of Labin, City of Pazin, Island of Brac
Infrastructure for electric vehicles and bicyclesx13k131, k132 and k133City of Zadar, City of Osijek, City of Koprivnica, City of Varazdin, City of Cakovec, City of Prelog
Purchasing of electric vehiclesx14k141 and k142City of Rijeka, City of Zadar, City of Osijek, City of Koprivnica, City of Varazdin
Additional SECAPs analysed used for measures development Non-applicableNon-applicableThe city of Buzet, Island of Korcula, City of Kastva, City of Krizevci, City of Ludbreg, Municipality of Matulji, City of Slatina, City of Velika Gorica, City of Virovitica, City of Zagreb

References

  1. Tavella, C.; Spoerndli, C.; Beu, D.; Ceclan, A. CoME EASY—Synchronizing European Energy Award with Other Initiatives. Case Study: Romanian Local Communities. Energies 2021, 14, 6248. [Google Scholar] [CrossRef]
  2. Feleki, E.; Moussiopoulos, N. Setting emission reduction trajectories in mediterranean cities with the use of science-based targets: The pathway towards climate neutrality and the ambitious european goals by 2050. Atmosphere 2021, 12, 1505. [Google Scholar] [CrossRef]
  3. Kona, A.; Monforti-Ferrario, F.; Bertoldi, P.; Baldi, M.G.; Kakoulaki, G.; Vetters, N.; Thiel, C.; Melica, G.; Lo Vullo, E.; Sgobbi, A.; et al. Global Covenant of Mayors, a dataset of greenhouse gas emissions for 6200 cities in Europe and the Southern Mediterranean countries. Earth Syst. Sci. Data 2021, 13, 3551–3564. [Google Scholar] [CrossRef]
  4. Neves, A.R.; Leal, V.; Lourenço, J.C. A methodology for sustainable and inclusive local energy planning. Sustain. Cities Soc. 2015, 17, 110–121. [Google Scholar] [CrossRef]
  5. Kona, A.; Bertoldi, P.; Kilkiş, Ş. Covenant of mayors: Local energy generation, methodology, policies and good practice examples. Energies 2019, 12, 985. [Google Scholar] [CrossRef] [Green Version]
  6. Coelho, S.; Russo, M.; Oliveira, R.; Monteiro, A.; Lopes, M.; Borrego, C. Sustainable energy action plans at city level: A Portuguese experience and perception. J. Clean. Prod. 2018, 176, 1223–1230. [Google Scholar] [CrossRef] [Green Version]
  7. Salvia, M.; Simoes, S.G.; Herrando, M.; Čavar, M.; Cosmi, C.; Pietrapertosa, F.; Gouveia, J.P.; Fueyo, N.; Gómez, A.; Papadopoulou, K.; et al. Improving policy making and strategic planning competencies of public authorities in the energy management of municipal public buildings: The PrioritEE toolbox and its application in five mediterranean areas. Renew. Sustain. Energy Rev. 2021, 135. [Google Scholar] [CrossRef]
  8. Pasimeni, M.R.; Petrosillo, I.; Aretano, R.; Semeraro, T.; De Marco, A.; Zaccarelli, N.; Zurlini, G. Scales, strategies and actions for effective energy planning: A review. Energy Policy 2014, 65, 165–174. [Google Scholar] [CrossRef]
  9. Reckien, D.; Salvia, M.; Heidrich, O.; Church, J.M.; Pietrapertosa, F.; De Gregorio-Hurtado, S.; D’Alonzo, V.; Foley, A.; Simoes, S.G.; Krkoška Lorencová, E.; et al. How are cities planning to respond to climate change? Assessment of local climate plans from 885 cities in the EU-28. J. Clean. Prod. 2018, 191, 207–219. [Google Scholar] [CrossRef]
  10. Salvia, M.; Reckien, D.; Pietrapertosa, F.; Eckersley, P.; Spyridaki, N.A.; Krook-Riekkola, A.; Olazabal, M.; De Gregorio Hurtado, S.; Simoes, S.G.; Geneletti, D.; et al. Will climate mitigation ambitions lead to carbon neutrality? An analysis of the local-level plans of 327 cities in the EU. Renew. Sustain. Energy Rev. 2021, 135. [Google Scholar] [CrossRef]
  11. Messori, G.; Brocchieri, F.; Morello, E.; Ozgen, S.; Caserini, S. A climate mitigation action index at the local scale: Methodology and case study. J. Environ. Manage. 2020, 260, 110024. [Google Scholar] [CrossRef] [PubMed]
  12. Hsu, A.; Tan, J.; Ng, Y.M.; Toh, W.; Vanda, R.; Goyal, N. Performance determinants show European cities are delivering on climate mitigation. Nat. Clim. Chang. 2020, 10, 1015–1022. [Google Scholar] [CrossRef]
  13. Kona, A.; Bertoldi, P.; Monforti-Ferrario, F.; Rivas, S.; Dallemand, J.F. Covenant of mayors signatories leading the way towards 1.5 degree global warming pathway. Sustain. Cities Soc. 2018, 41, 568–575. [Google Scholar] [CrossRef]
  14. Scorza, F.; Santopietro, L. A systemic perspective for the Sustainable Energy and Climate Action Plan (SECAP). Eur. Plan. Stud. 2021, 1–21. [Google Scholar] [CrossRef]
  15. Amorim, E.V. Sustainable energy action plans: Project management intercomparison. Procedia Technol. 2014, 16, 1183–1189. [Google Scholar] [CrossRef] [Green Version]
  16. Nagorny-Koring, N.C.; Nochta, T. Managing urban transitions in theory and practice—The case of the Pioneer Cities and Transition Cities projects. J. Clean. Prod. 2018, 175, 60–69. [Google Scholar] [CrossRef]
  17. Saad, S.; Lahoud, C.; Brouche, M.; Hmadi, M.; Ghandour, M.; Mourtada, A. Advanced tool for elaborating a sustainable energy and climate action plan at municipalities level. Energy Rep. 2021, 7, 51–69. [Google Scholar] [CrossRef]
  18. Di Battista, D.; Barchiesi, C.; Di Paolo, L.; Abbate, S.; Sorvillo, S.; Cinocca, A.; Carapellucci, R.; Ciamponi, D.; Cardone, D.; Corroppolo, S.; et al. The reporting of sustainable energy action plans of municipalities: Methodology and results of case studies from the abruzzo region. Energies 2021, 14, 5932. [Google Scholar] [CrossRef]
  19. McGookin, C.; Ó Gallachóir, B.; Byrne, E. An innovative approach for estimating energy demand and supply to inform local energy transitions. Energy 2021, 229. [Google Scholar] [CrossRef]
  20. Martire, S.; Mirabella, N.; Sala, S. Widening the perspective in greenhouse gas emissions accounting: The way forward for supporting climate and energy policies at municipal level. J. Clean. Prod. 2018, 176, 842–851. [Google Scholar] [CrossRef]
  21. Santopietro, L.; Scorza, F. The Italian experience of the covenant of mayors: A territorial evaluation. Sustainability 2021, 13, 1289. [Google Scholar] [CrossRef]
  22. Pablo-Romero, M.d.P.; Pozo-Barajas, R.; Sánchez-Braza, A. Analyzing the effects of the benchmark local initiatives of Covenant of Mayors signatories. J. Clean. Prod. 2018, 176, 159–174. [Google Scholar] [CrossRef]
  23. Altamirano-Avila, A.; Martínez, M. Urban sustainability assessment of five Latin American cities by using SDEWES index. J. Clean. Prod. 2021, 287, 125495. [Google Scholar] [CrossRef]
  24. Jekabsone, A.; Marín, J.P.D.; Martins, S.; Rosa, M.; Kamenders, A. Upgrade from SEAP to SECAP: Experience of 6 European Municipalities. Environ. Clim. Technol. 2021, 25, 254–264. [Google Scholar] [CrossRef]
  25. Spyridaki, N.A.; Kleanthis, N.; Tzani, D.; Matosović, M.D.; Flamos, A. A city capability assessment framework focusing on planning, financing, and implementing sustainable energy projects. Sustainability 2020, 12, 8447. [Google Scholar] [CrossRef]
  26. Fiaschi, D.; Bandinelli, R.; Conti, S. A case study for energy issues of public buildings and utilities in a small municipality: Investigation of possible improvements and integration with renewables. Appl. Energy 2012, 97, 101–114. [Google Scholar] [CrossRef]
  27. Pablo-Romero, M.d.P.; Pozo-Barajas, R.; Sanchez-Braza, A. Understanding local CO2 emissions reduction targets. Renew. Sustain. Energy Rev. 2015, 48, 347–355. [Google Scholar] [CrossRef]
  28. Dall’O’, G.; Norese, M.F.; Galante, A.; Novello, C. A multi-criteria methodology to support public administration decision making concerning sustainable energy action plans. Energies 2013, 6, 4308–4330. [Google Scholar] [CrossRef] [Green Version]
  29. Fouché, E.; Brent, A. Explore, design and act for sustainability: A participatory planning approach for local energy sustainability. Sustainability 2020, 12, 862. [Google Scholar] [CrossRef] [Green Version]
  30. Papapostolou, A.; Karakosta, C.; Kourti, K.A.; Doukas, H.; Psarras, J. Supporting Europe’s energy policy towards a decarbonised energy system: A comparative assessment. Sustainability 2019, 11, 4010. [Google Scholar] [CrossRef] [Green Version]
  31. Mimica, M.; Dominković, D.F.; Capuder, T.; Krajačić, G. On the value and potential of demand response in the smart island archipelago. Renew. Energy 2021, 176, 153–168. [Google Scholar] [CrossRef]
  32. Energy Institute Hrvoje Požar. Energy in Croatia Annual Energy Report 2019; Ministry of Economy and Sustainable Development: Zagreb, Croatia, 2021. [Google Scholar]
  33. Lizačić-Vidaković, M.; Kulić, F.; Vidaković, D.; Šnidaršić, T.; Vidaković, D. Zajednički Akcijski Plan Energetski Održivog Razvitka I Klimatskih Promjena (Joint SECAP) za Područje Grada Dubrovnika, Općine Konavle, Općine Župa dubrovačka, Općine Dubrovačko primorje i Općine Ston; University of Zagreb: Zagreb, Croatia, 2020. [Google Scholar]
  34. Schenone, C.; Delponte, I. Renewable energy sources in local sustainable energy action PLANs (SEAPs): Analysis and outcomes. Energy Policy 2021, 156, 112475. [Google Scholar] [CrossRef]
  35. Rivas, S.; Urraca, R.; Bertoldi, P.; Thiel, C. Towards the EU Green Deal: Local key factors to achieve ambitious 2030 climate targets. J. Clean. Prod. 2021, 320, 128878. [Google Scholar] [CrossRef]
  36. Melica, G.; Bertoldi, P.; Kona, A.; Iancu, A.; Rivas, S.; Zancanella, P. Multilevel governance of sustainable energy policies: The role of regions and provinces to support the participation of small local authorities in the Covenant of Mayors. Sustain. Cities Soc. 2018, 39, 729–739. [Google Scholar] [CrossRef]
  37. Mutlu, V.; Cindoruk, Y.O.; Cindoruk, S.S. Evaluation of Bursa metropolitan greenhouse Gas inventory and reduction targets. Urban Clim. 2020, 34. [Google Scholar] [CrossRef]
  38. Palermo, V.; Walsh, C.L.; Dawson, R.J.; Fichera, A.; Inturri, G. Multi-sector mitigation strategies at the neighbourhood scale. J. Clean. Prod. 2018, 187, 893–902. [Google Scholar] [CrossRef] [Green Version]
  39. Peduzzi, E.; Baldi, M.G.; Pisoni, E.; Kona, A.; Bertoldi, P.; Monforti-Ferrario, F. Impacts of a climate change initiative on air pollutant emissions: Insights from the Covenant of Mayors. Environ. Int. 2020, 145, 106029. [Google Scholar] [CrossRef]
  40. Palermo, V.; Bertoldi, P.; Apostoulu, M.; Kona, A.; Rivas, S. Assessment of climate change mitigation policies in 315 cities in the Covenant of Mayors initiative. Sustain. Cities Soc. 2020, 60, 102258. [Google Scholar] [CrossRef]
  41. Buga, N.; Yousif, C. Evaluating drivers and barriers to adopting a local energy policy under The Covenant of Mayors Initiative in the Small Island State of Malta. Energy Policy 2021, 159, 112586. [Google Scholar] [CrossRef]
  42. Matak, N.; Krajačić, G. Assessment of mitigation measures contribution to CO2 reduction in sustainable energy action plan. Clean Technol. Environ. Policy 2019, 22, 2039–2052. [Google Scholar] [CrossRef]
  43. Croci, E.; Lucchitta, B.; Molteni, T. Low carbon urban strategies: An investigation of 124 European cities. Urban Clim. 2021, 40, 101022. [Google Scholar] [CrossRef]
  44. Bernardo, G.; Alessandro, S.D. Societal implications of sustainable energy action plans: From energy modelling to stakeholder learning. J. Environ. Plan. Manag. 2019, 62, 399–423. [Google Scholar] [CrossRef]
  45. Panuccio, P. Smart planning: From city to territorial system. Sustainability 2019, 11, 7184. [Google Scholar] [CrossRef] [Green Version]
  46. Prina, M.G.; Cozzini, M.; Garegnani, G.; Manzolini, G.; Moser, D.; Filippi Oberegger, U.; Pernetti, R.; Vaccaro, R.; Sparber, W. Multi-objective optimization algorithm coupled to EnergyPLAN software: The EPLANopt model. Energy 2018, 149, 213–221. [Google Scholar] [CrossRef]
  47. Manni, M.; Coccia, V.; Paoletti, D.; Raspadori, F.; Ritonummi, T.; Cotana, F. Shaping multi-level energy and climate policy within the set plan framework. Sustainability 2020, 12, 9545. [Google Scholar] [CrossRef]
  48. Covenant of Mayors. Available online: https://www.covenantofmayors.eu/en/ (accessed on 21 January 2022).
Figure 1. Functions used for the optimisation of public buildings measures.
Sustainability 14 03462 g001
Figure 2. Functions used for the optimisation of measures in commercial buildings.
Sustainability 14 03462 g002
Figure 3. Functions used for the optimisation of measures in the transport and public lighting sector.
Sustainability 14 03462 g003
Figure 4. Functions used for the optimisation of measures in residential buildings.
Sustainability 14 03462 g004
Figure 5. Total cost abatement curve for the 40% CO2 reduction in the current plan.
Sustainability 14 03462 g005
Figure 6. Total cost abatement curve in the case of optimisation of measures for the 40% CO2 reduction.
Sustainability 14 03462 g006
Figure 7. Total cost abatement curve in the case of optimisation of measures for the 45%, 55% and maximal (63%) CO2 reduction.
Sustainability 14 03462 g007
Figure 8. The total cost of mitigation measures in analysed scenarios in million EUR.
Sustainability 14 03462 g008
Table 1. The energy consumption of the analysed area.
MWh/YearResidential BuildingsCommercial BuildingsTransportationPublic VehiclesPublic BuildingsPublic LightingPublic TransportationTotal
Electricity149,276171,61700315310,0720334,118
Fuel oil26,58919,4970023100048,396
LPG17,69066266427011980031,941
Biomass71,70700000071,707
Diesel00264,90442490023,214292,367
Petrol00132,862259000133,121
Total265,261197,740404,1944508666110,07223,214911,649
Table 2. The yearly CO2 emissions of the analysed area.
tCO2/YearResidential BuildingsCommercial BuildingsTransportationPublic VehiclesPublic BuildingsPublic LightingPublic TransportationTotal
Electricity22,09325,399004671491049,449
Fuel oil79655841006920014,498
LPG4615172816770313008333
Biomass3400000034
Diesel0070,729113400619878,062
Petrol0033,0836400033,147
Total34,70732,969105,4891199147114916198183,523
Table 3. CO2 emission factors for different energy carriers used in the analysed area [32].
gCO2/kWh
Electricity0.1480
Fuel oil0.2996
LPG0.2609
Biomass0.0005
Diesel0.2670
Petrol0.2490
PV electricity0.0000
Publisher’s Note: MDPI stays neutral with regard to jurisdictional claims in published maps and institutional affiliations.

