
The Improvement of User Satisfaction for Two Urban Parks in Dubai, UAE: Bay Avenue Park and Al Ittihad Park


Abstract
:1. Introduction
2. Materials and Methods
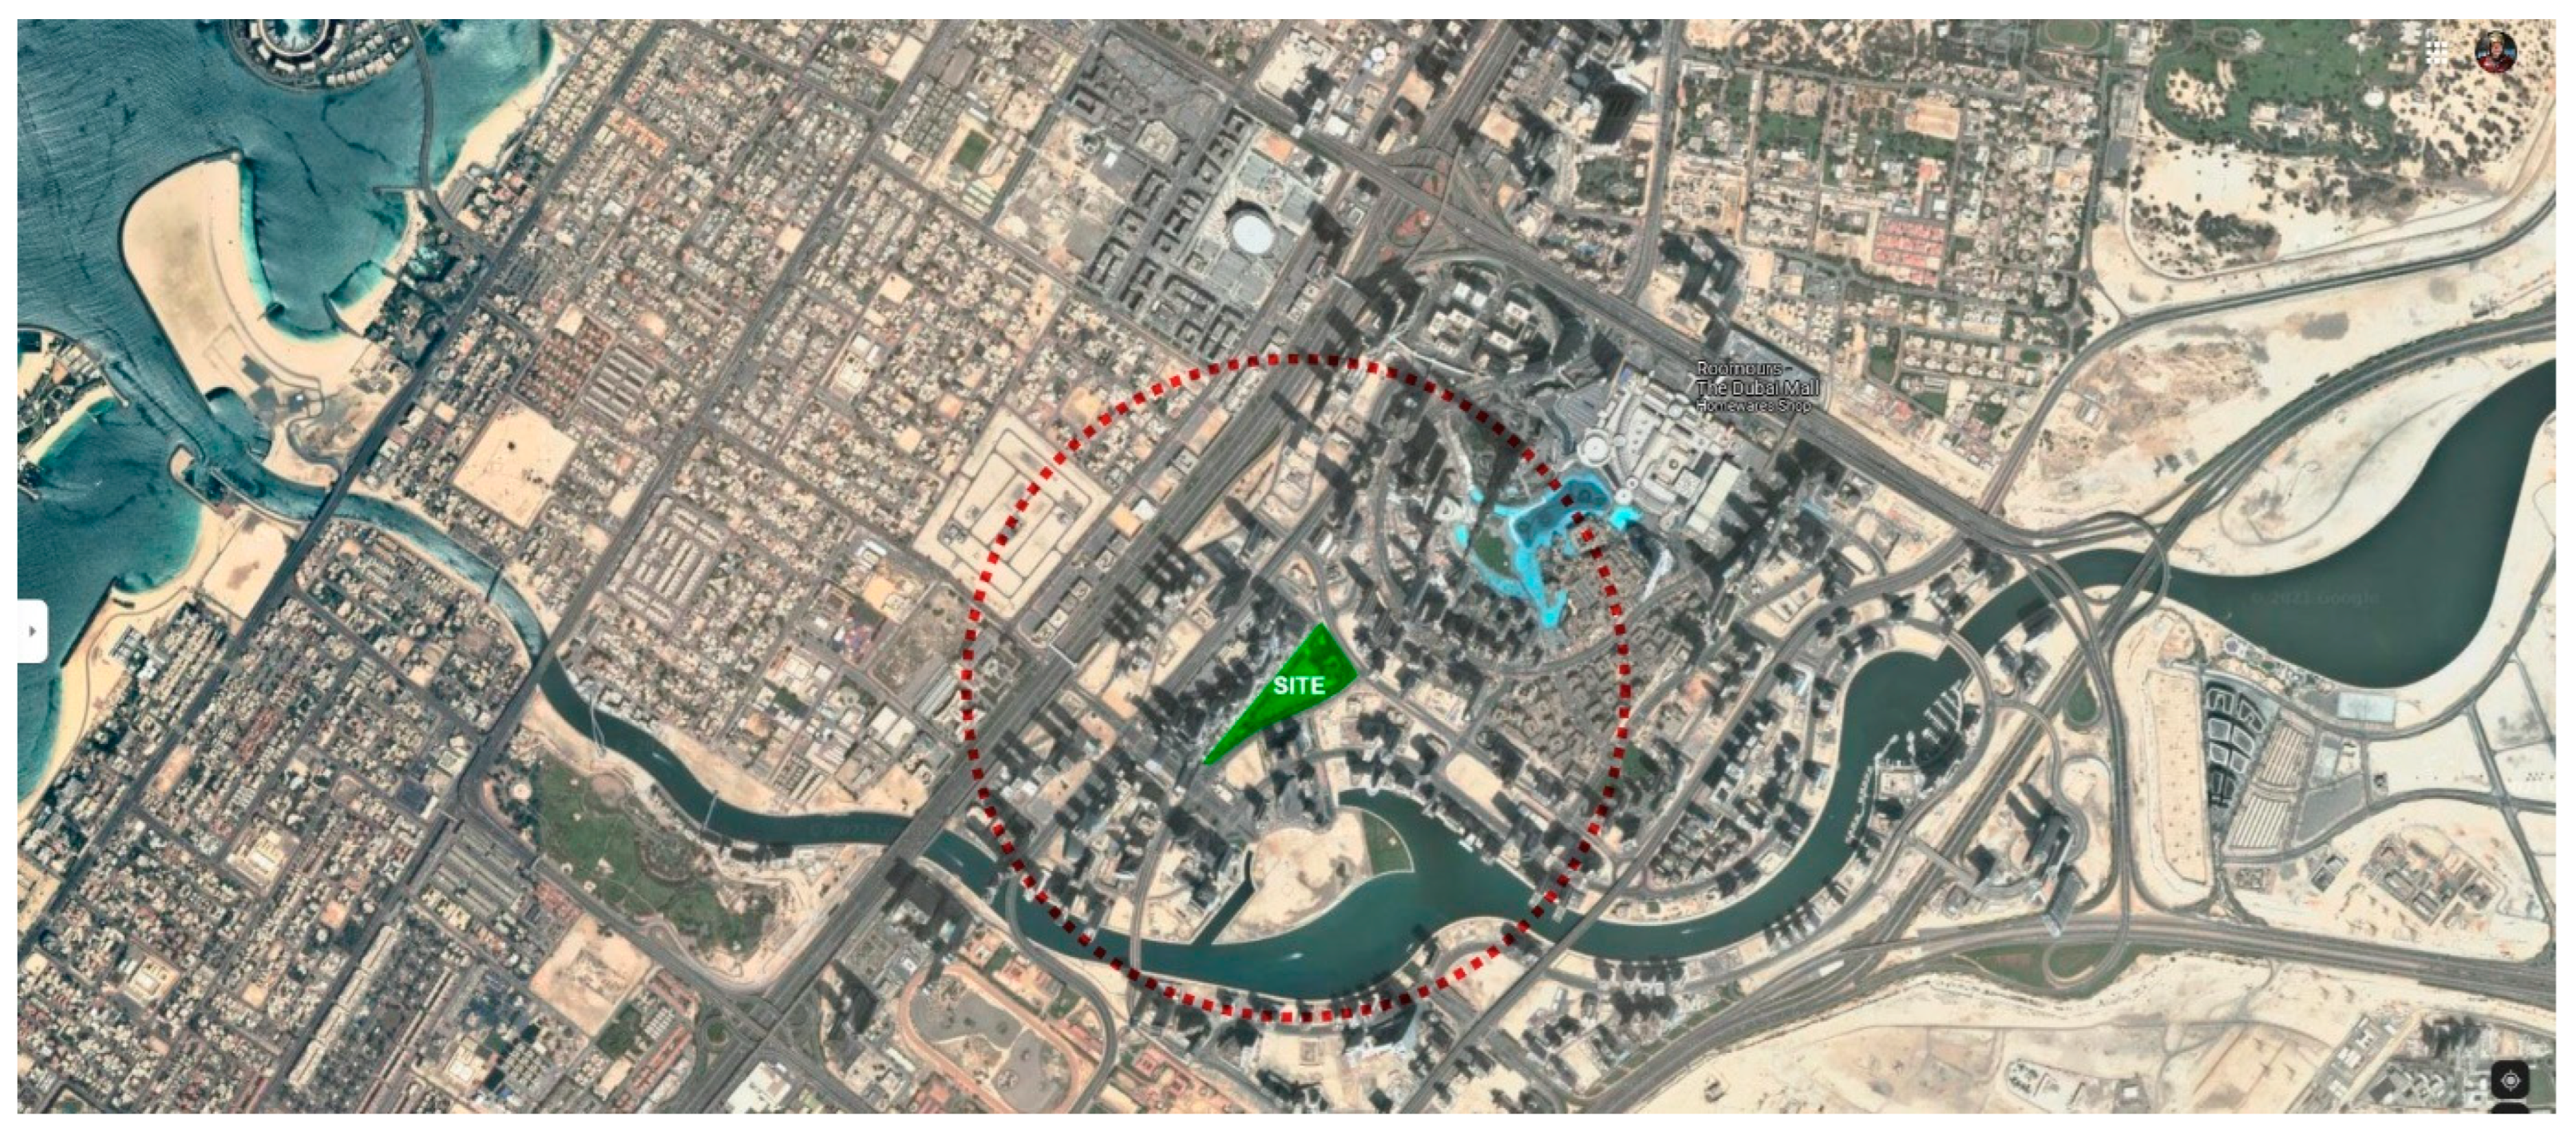
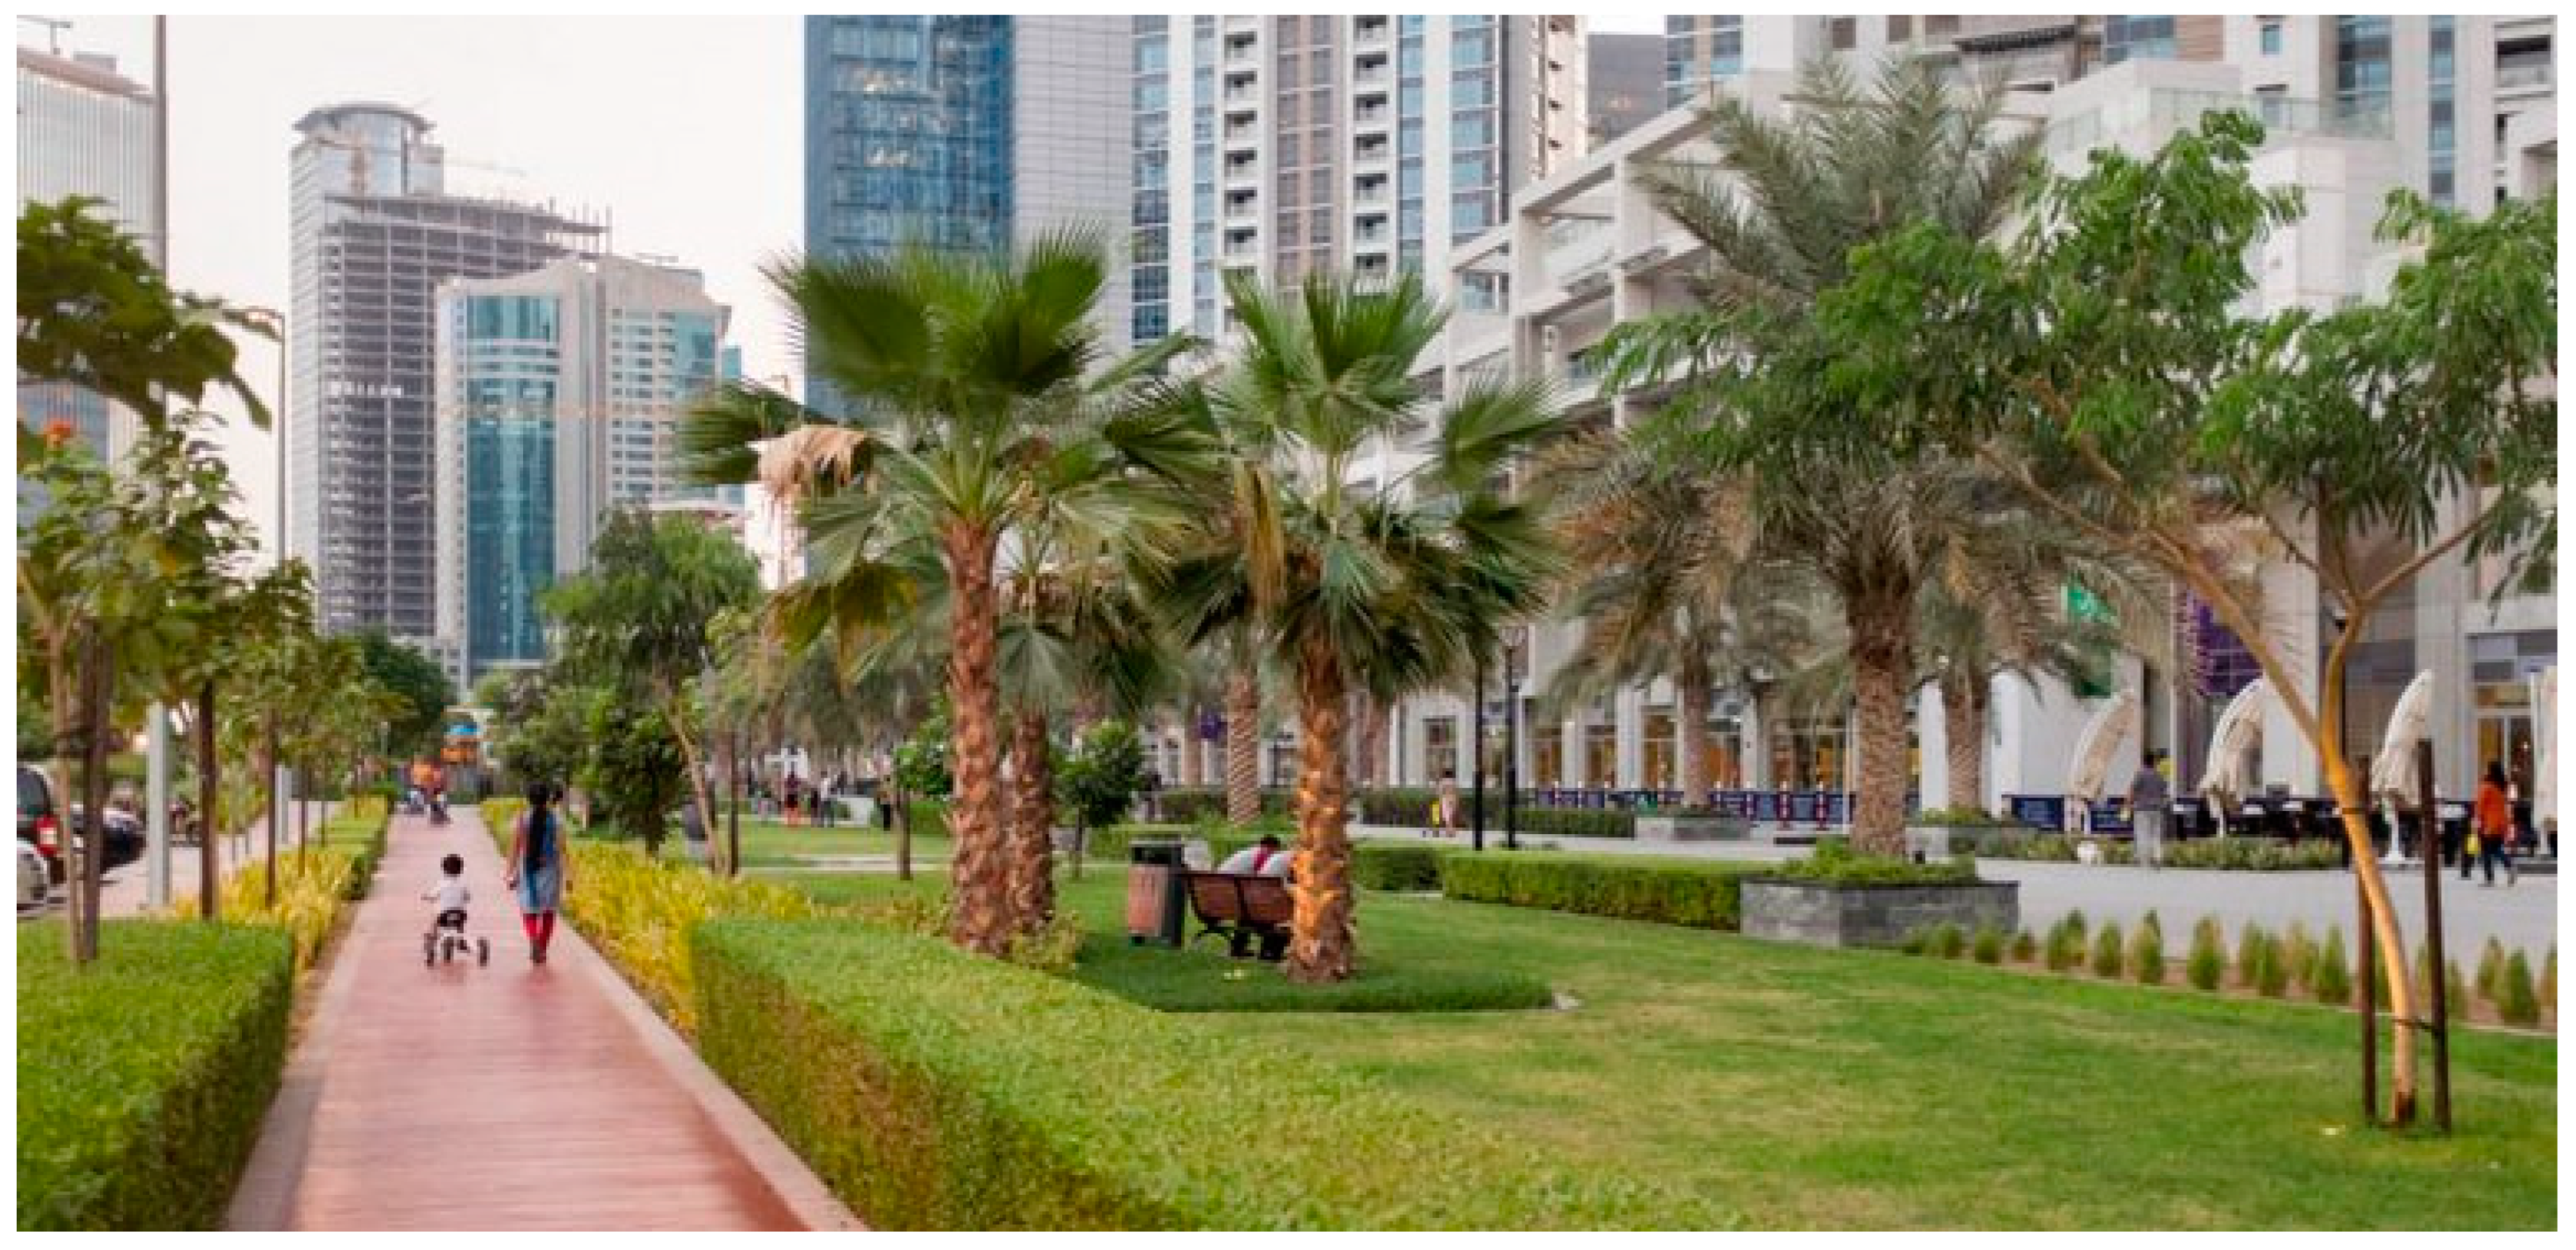
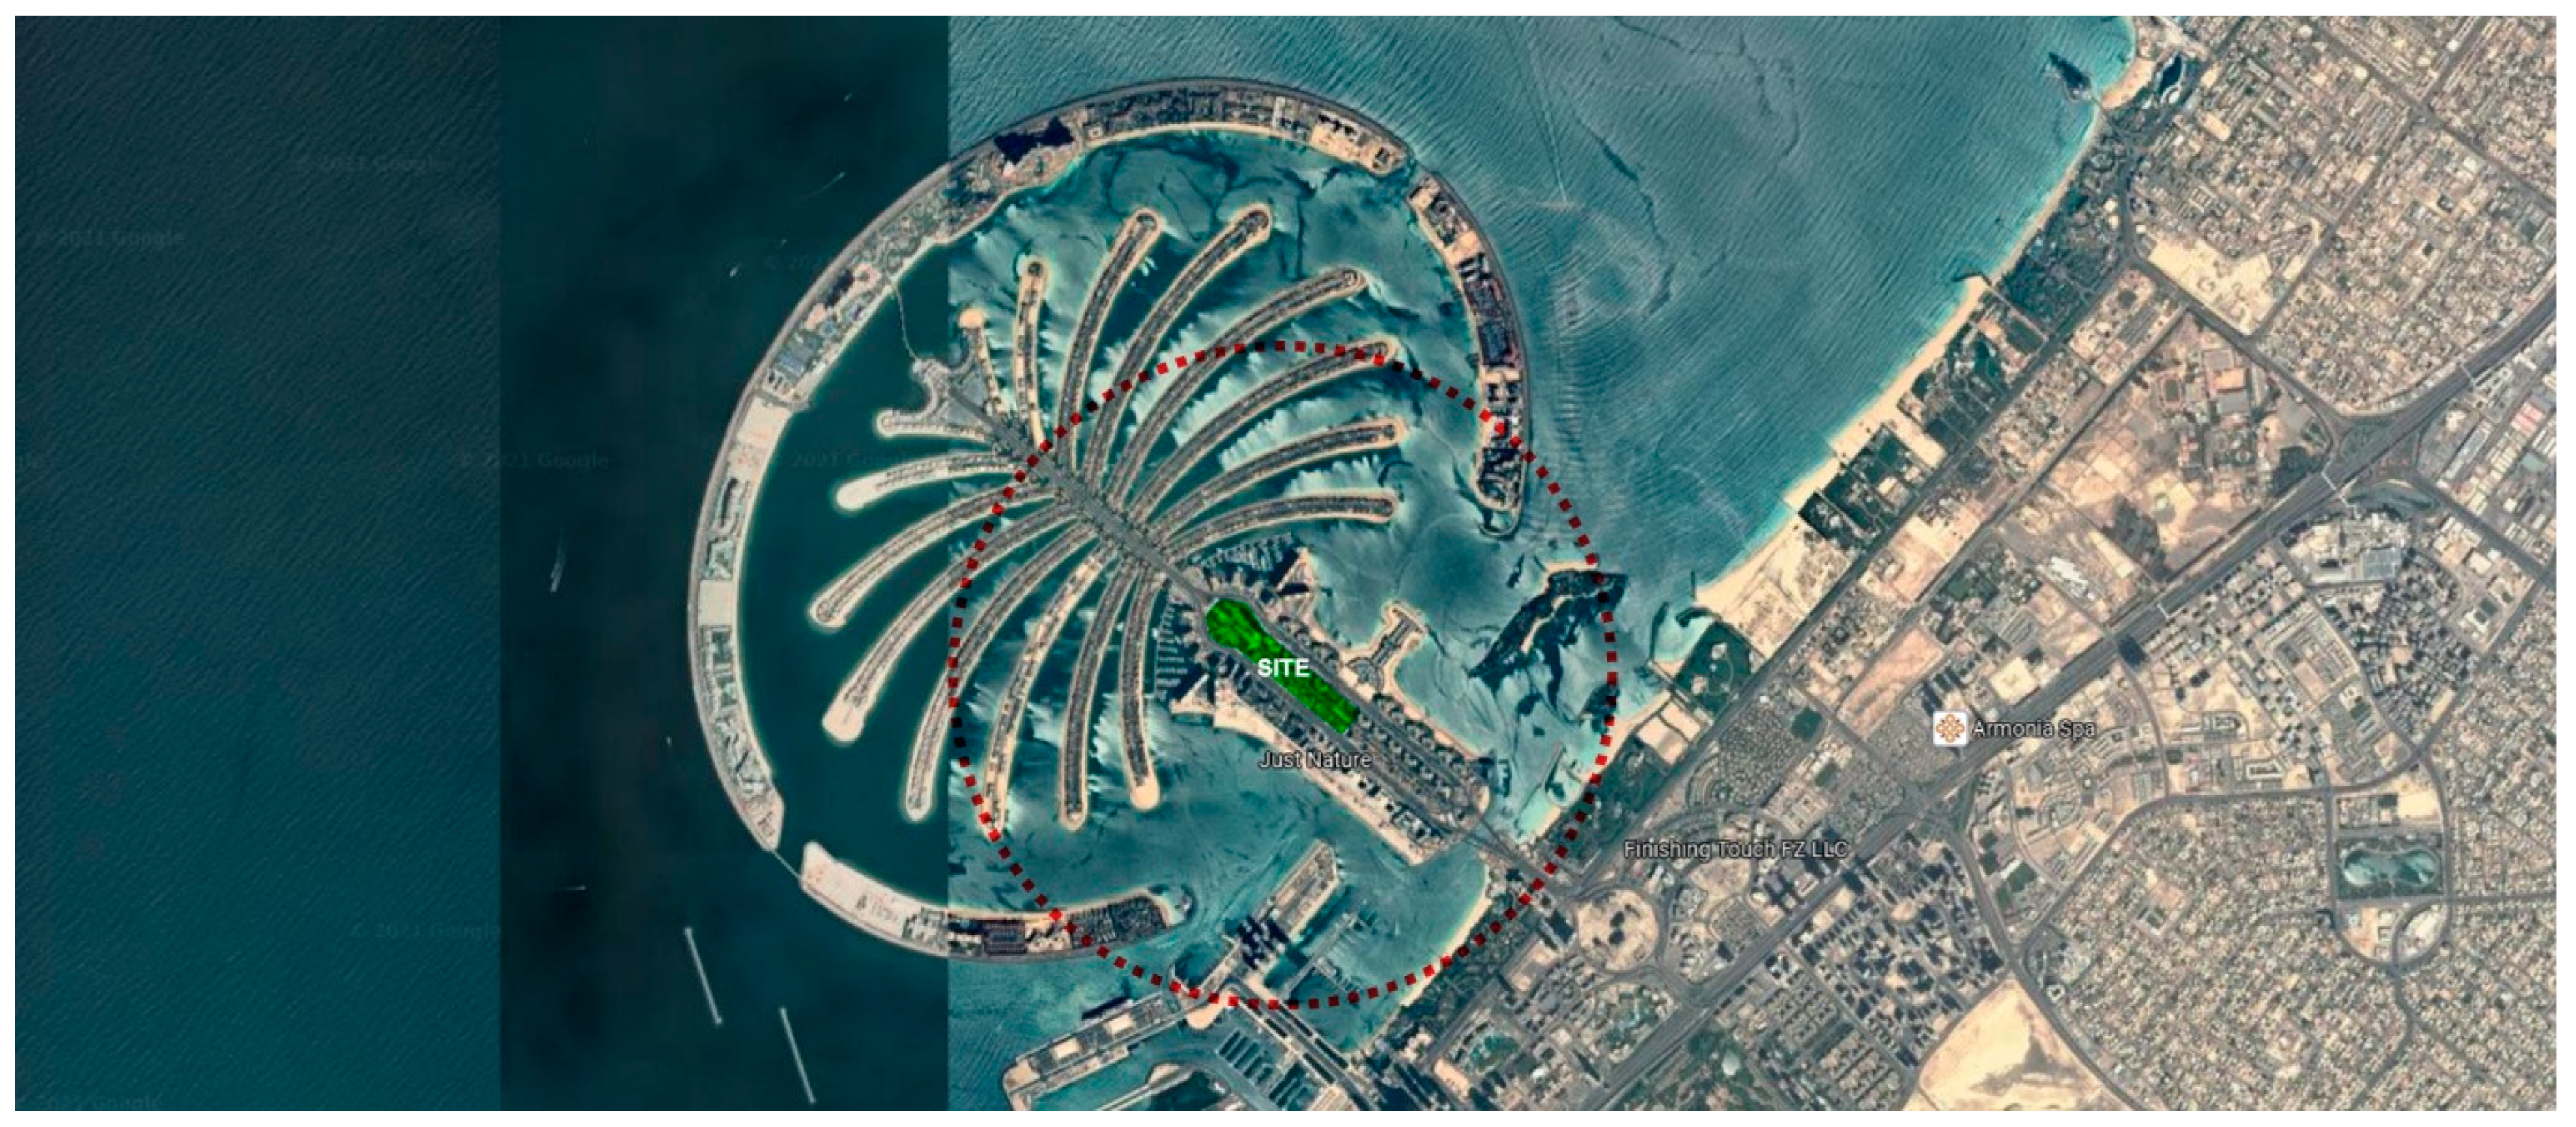
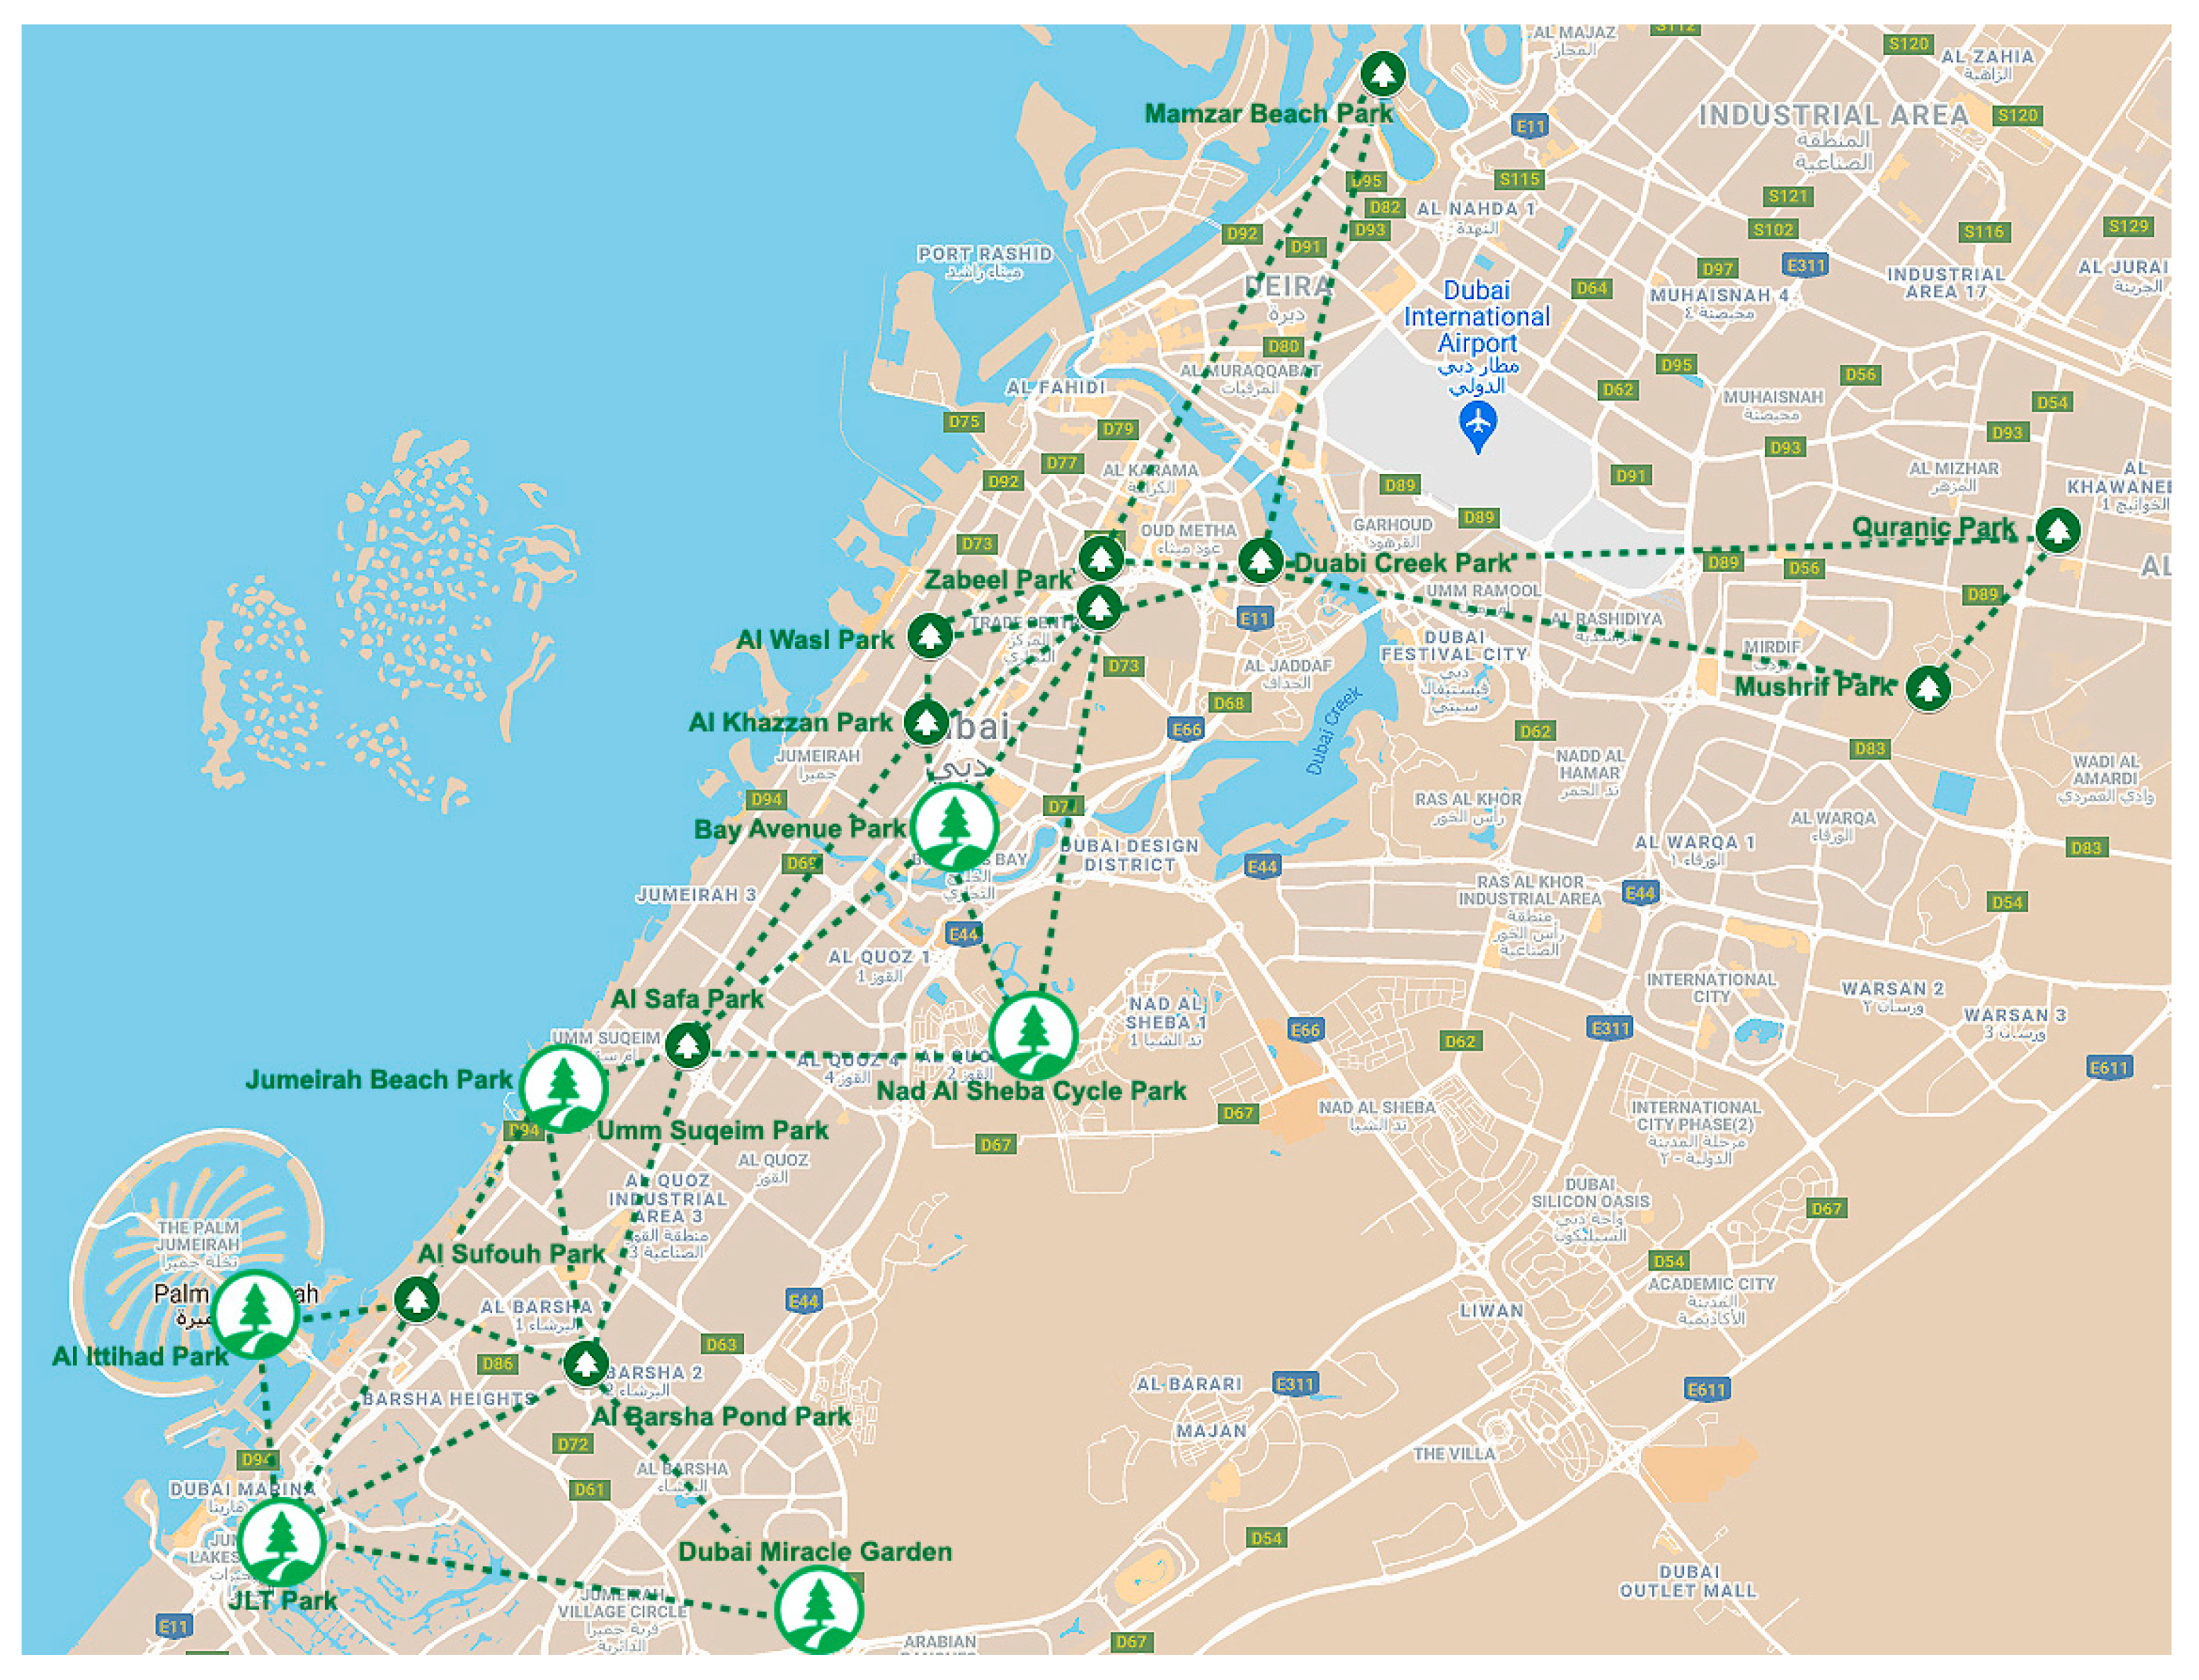
2.1. Target Sites
2.2. Survey Method
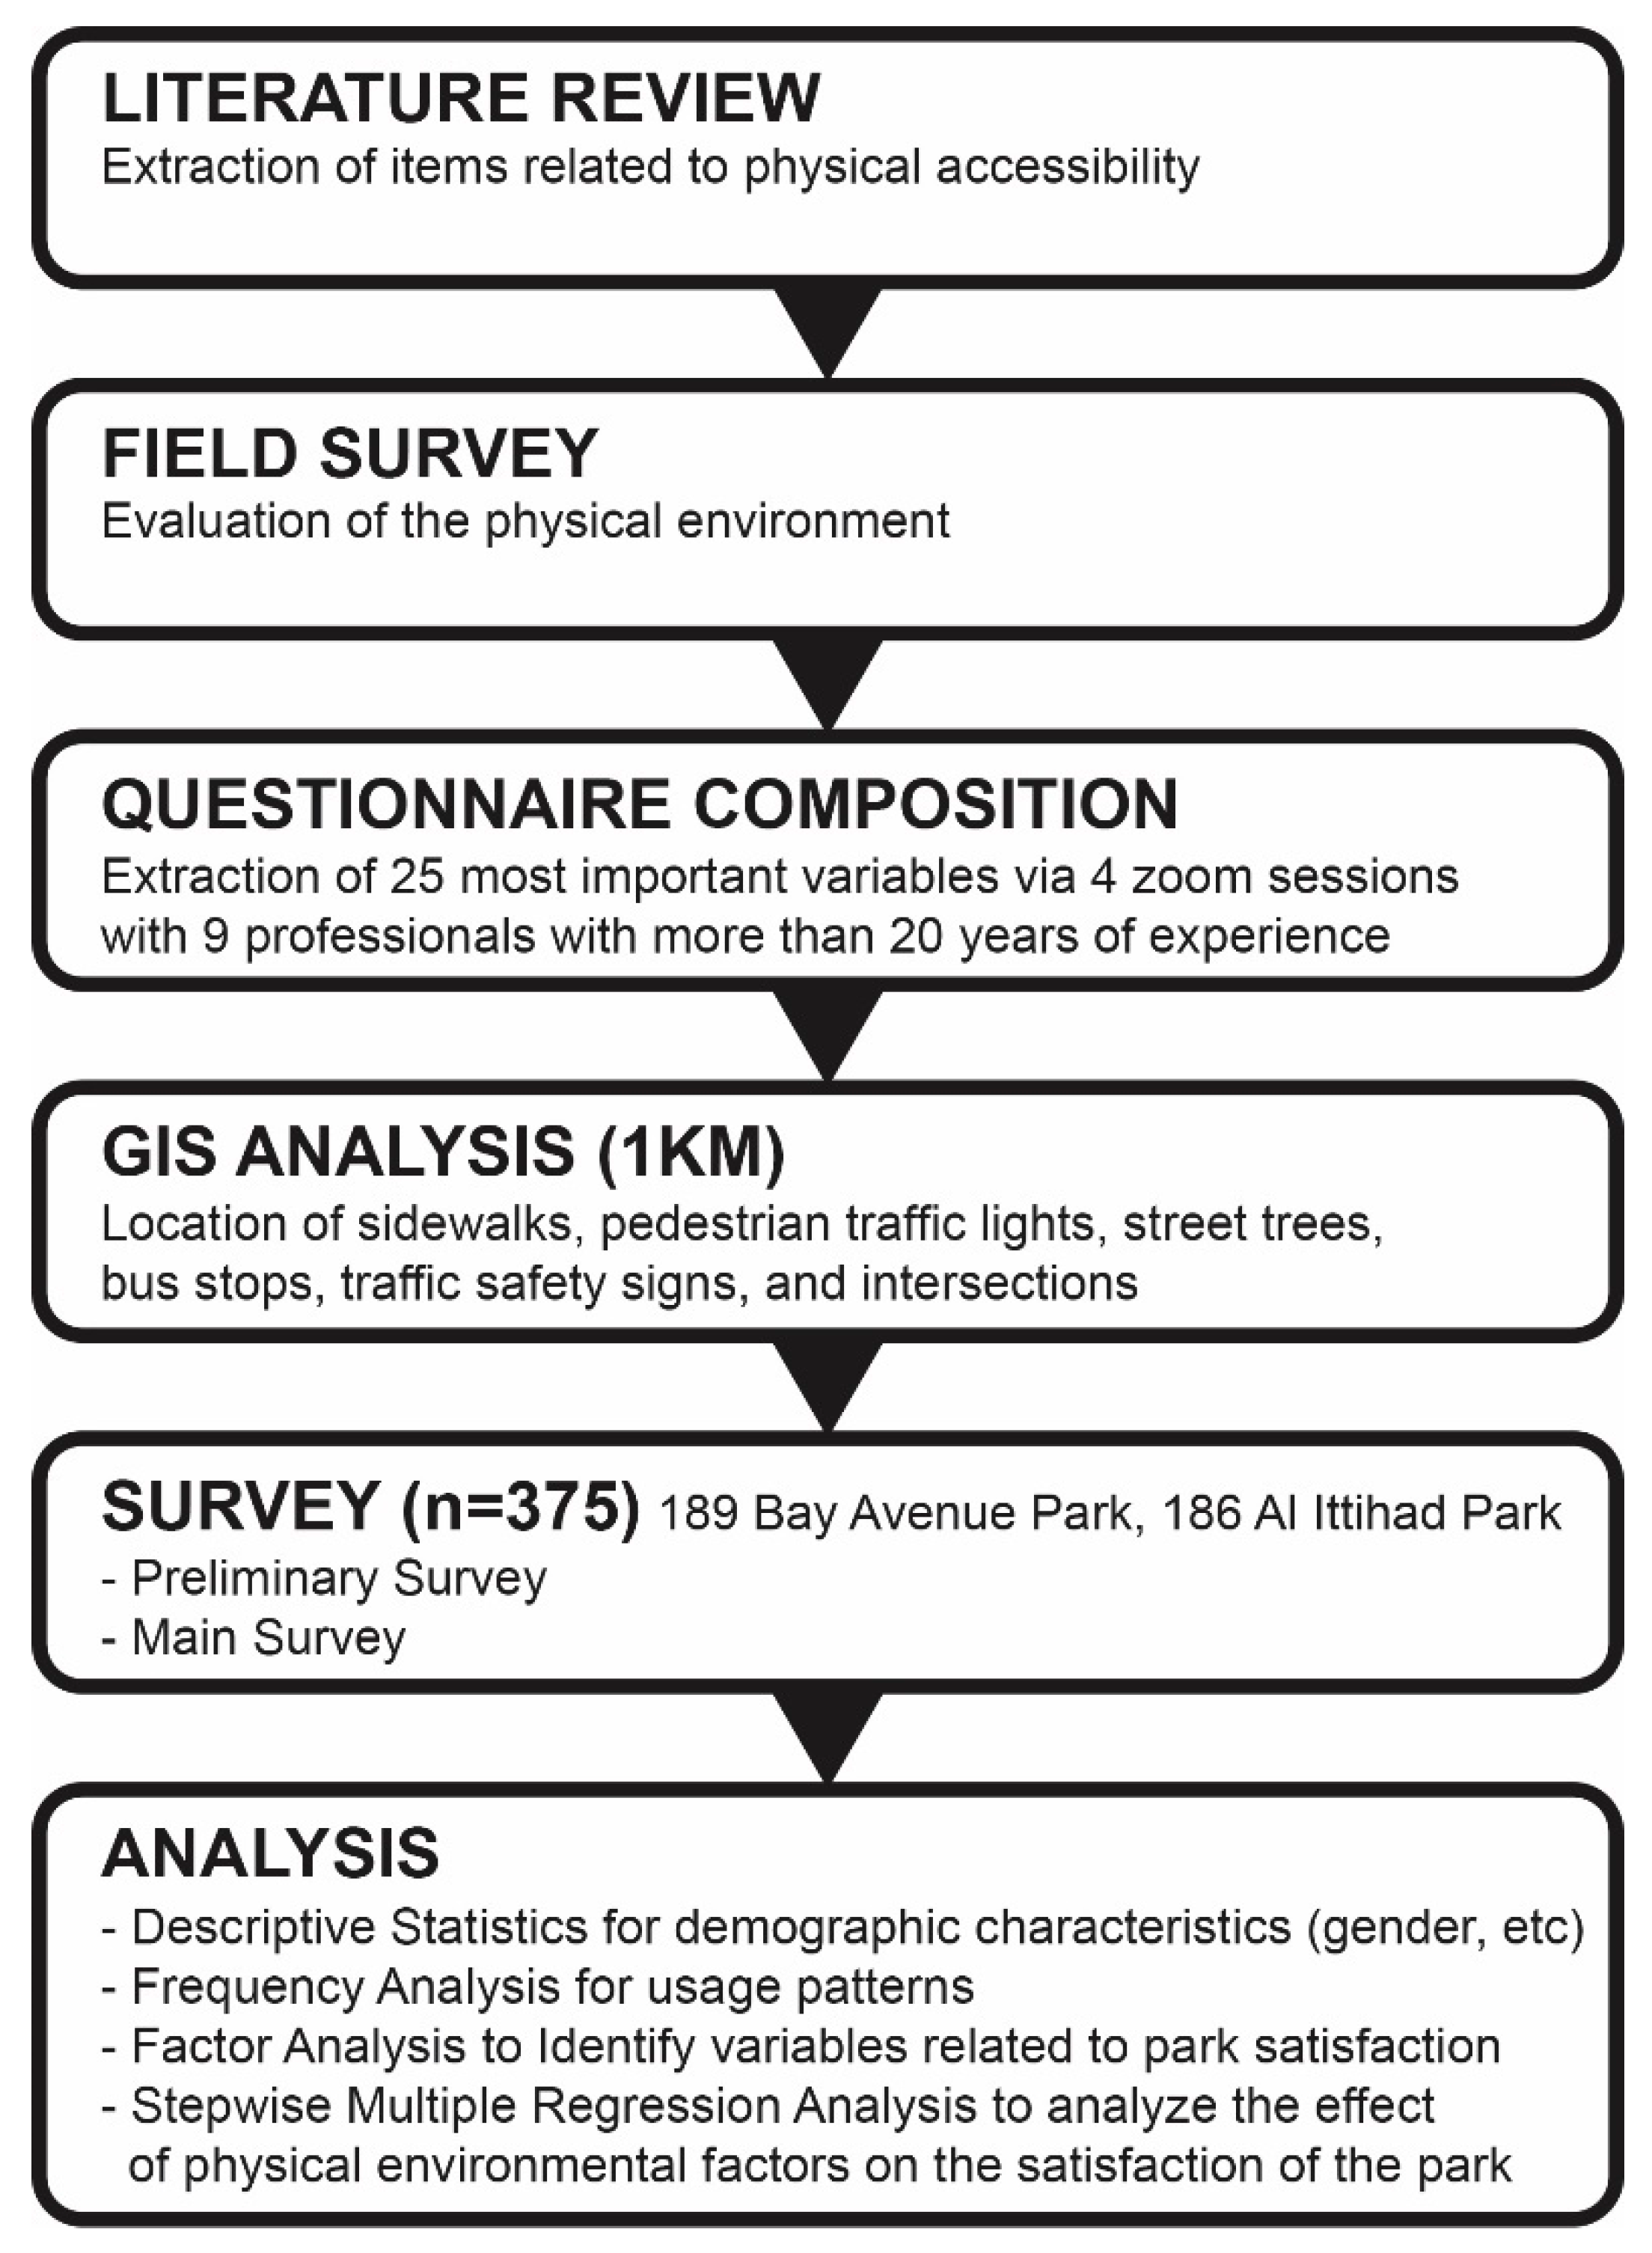
2.3. Analysis Method
3. Results
3.1. Physical Environment & Accessibility Assessment
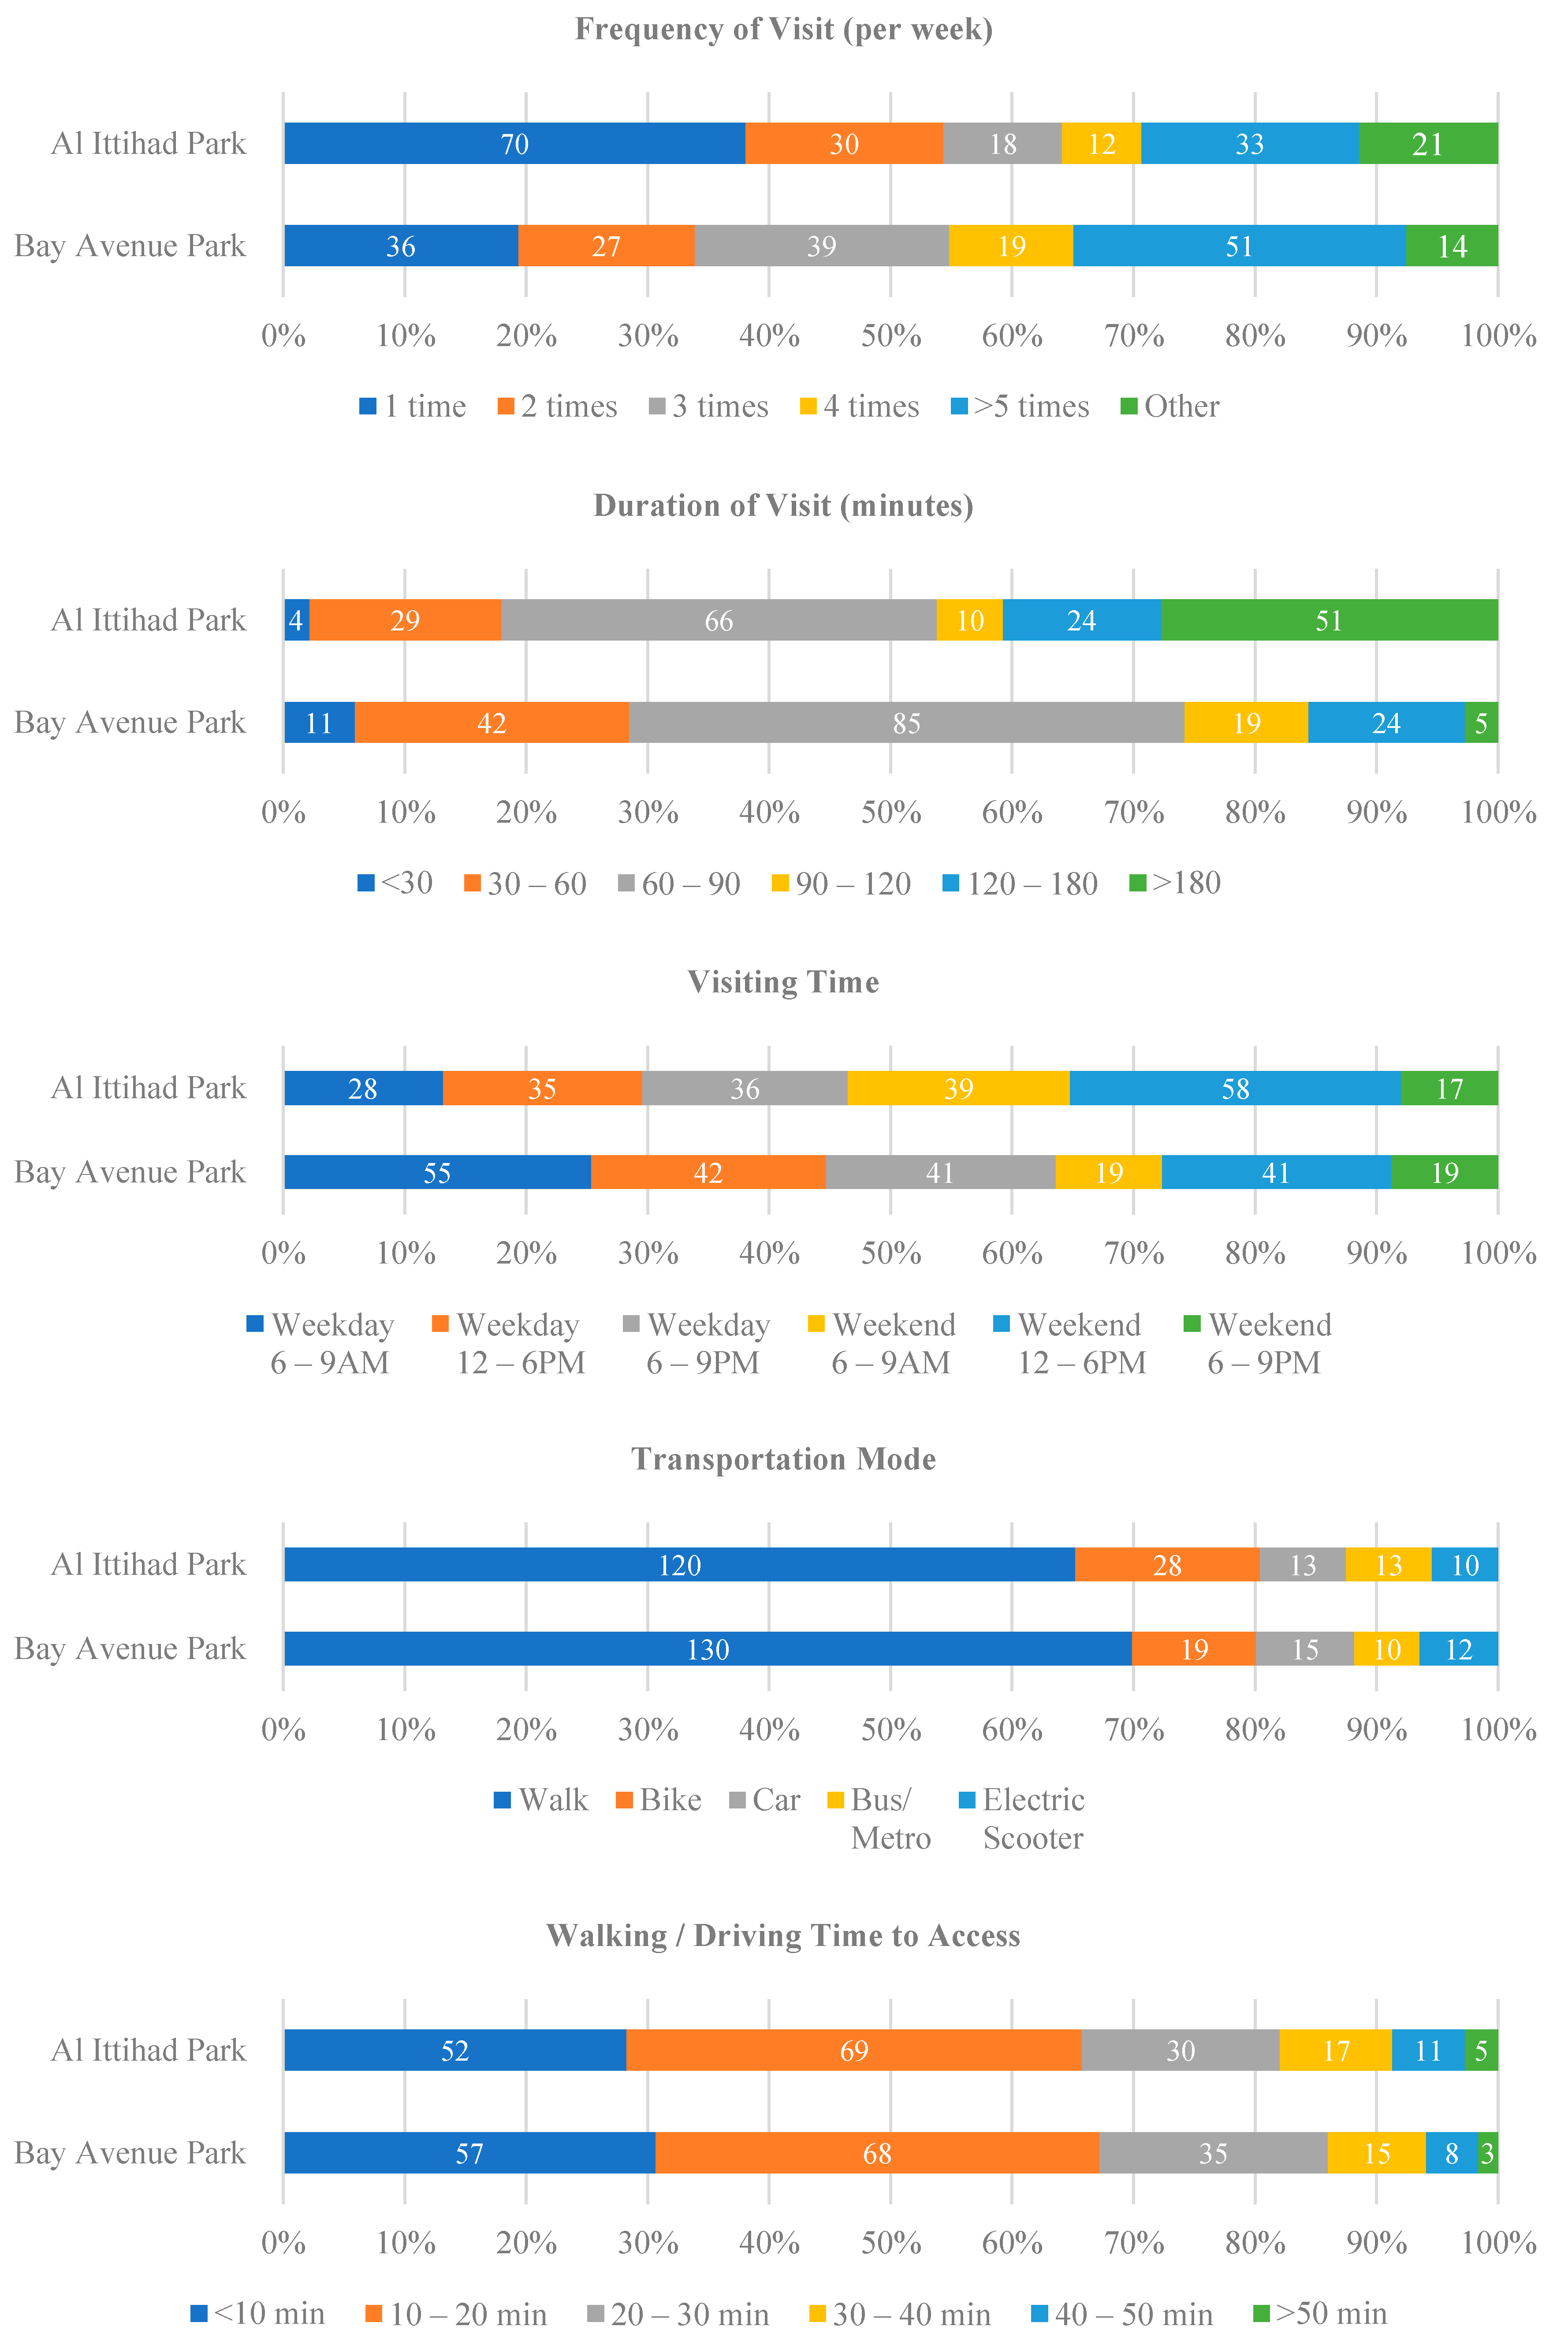
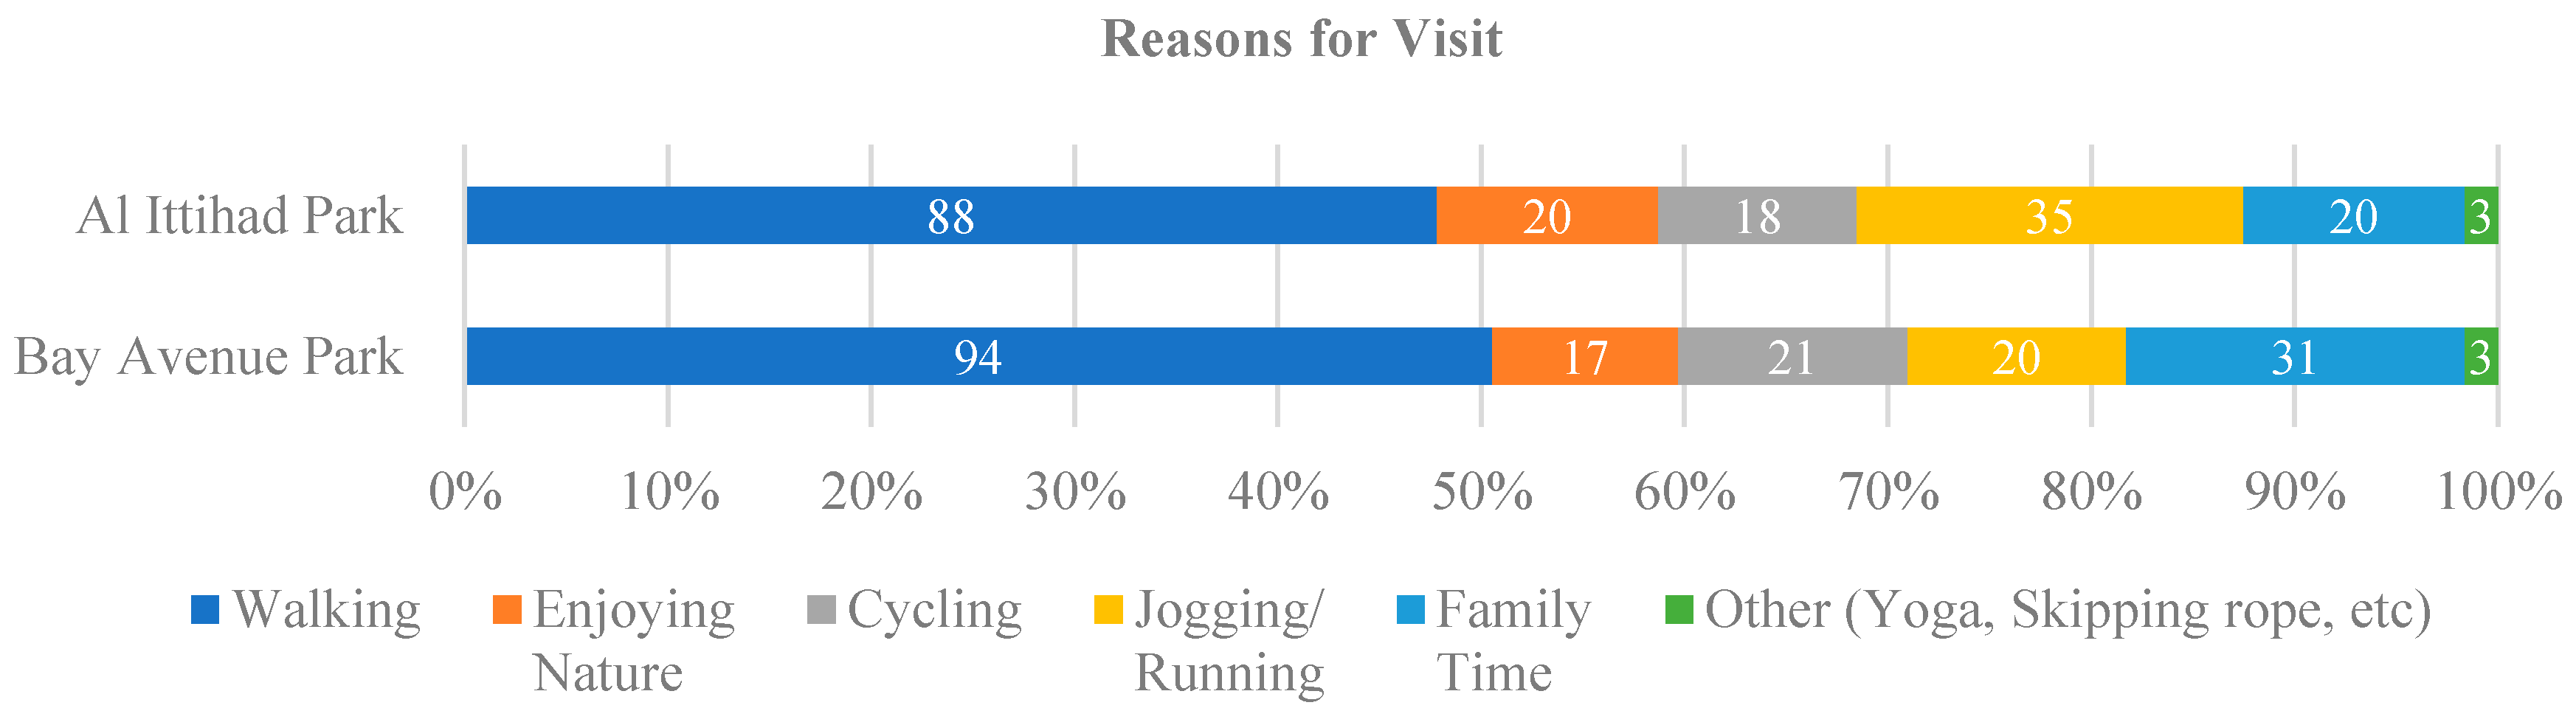
3.2. User Behavior and Satisfaction Assessment
3.3. Park Physical Environment & Accessibility Satisfaction Assessment
3.4. Factoring of Physical Environment Variables
3.5. Analysis of Factors Affecting User Satisfaction
4. Discussion & Conclusions
Author Contributions
Funding
Institutional Review Board Statement
Informed Consent Statement
Data Availability Statement
Acknowledgments
Conflicts of Interest
Appendix A

| Variables | Factors | ||||
|---|---|---|---|---|---|
| Factor 1 | Factor 2 | Factor 3 | Factor 4 | Factor 5 | |
| Safe Environment | 0.788 | 0.206 | 0.104 | 0.109 | 0.192 |
| Level of Slopes | 0.756 | 0.217 | 0.046 | 0.184 | 0.174 |
| Lightings on the Access Roads | 0.668 | −0.021 | 0.381 | 0.283 | 0.076 |
| The hindrance on the Access Roads | 0.628 | 0.123 | 0.291 | 0.149 | −0.011 |
| Car Speed on the Access Roads | 0.612 | 0.093 | 0.312 | 0.381 | 0.078 |
| The scenery on the Access Roads | 0.521 | 0.359 | −0.120 | 0.220 | 0.344 |
| The Size of the Park | 0.128 | 0.818 | 0.179 | 0.115 | 0.076 |
| Trail Length | 0.283 | 0.747 | 0.278 | 0.087 | 0.031 |
| Trail Width | 0.105 | 0.742 | 0.044 | 0382 | 0.088 |
| Parking | 0.092 | 0.595 | 0.334 | 0.005 | 0.222 |
| The scenery in the Park | 0.172 | 0.545 | 0.215 | 0.383 | 0.354 |
| Public Facility | 0.082 | 0.182 | 0.688 | 0.297 | 0.163 |
| Lighting Facility | 0.316 | 0.223 | 0.675 | 0.183 | −0.022 |
| Children’s Facility | 0.170 | 0.331 | 0.616 | 0.021 | 0.265 |
| Sports Facility | 0.214 | 0.236 | 0.563 | 0.091 | 0.346 |
| Safe Environment | 0.342 | 0.182 | 0.555 | 0.293 | 0.199 |
| Connectivity of Walkway | 0.308 | 0.121 | 0.102 | 0.681 | 0.209 |
| Green Area | 0.135 | 0.381 | 0.205 | 0.679 | 0.000 |
| Tree Shades in Sidewalk | 0.349 | 0.080 | 0.132 | 0.666 | 0.242 |
| Shades in the Park | 0.261 | 0.347 | 0.337 | 0.657 | 0.013 |
| Pedestrian/Car Separation | 0.486 | 0.056 | 0.128 | 0.576 | 0.210 |
| Sports Facility | 0.044 | 0.324 | 0.186 | 0.060 | 0.685 |
| Sports Court | 0.218 | 0.067 | 0.502 | 0.074 | 0.608 |
| Attractions on the Access Roads | 0.253 | −0.068 | 0.079 | 0.344 | 0.586 |
| Attractions in the Park | 0.114 | 0.455 | 0.323 | 0.201 | 0.521 |
| Eigenvalue | 4.309 | 3.591 | 3.262 | 3.258 | 2.262 |
| Percentage of Variance (%) | 16.573 | 13.813 | 12.547 | 12.537 | 8.703 |
| Cumulative Variance (%) | 16.573 | 30.388 | 42.937 | 55.476 | 64.181 |
| Sampling Adequacy by KMO Measure | 0.912 | ||||
| Bartlett’s Test of Sphericity | p = 0.000 | ||||
| Variables | Factors | ||||
|---|---|---|---|---|---|
| Factor 1 | Factor 2 | Factor 3 | Factor 4 | Factor 5 | |
| Children’s Facility | 0.818 | −0.078 | 0.071 | 0.040 | 0.052 |
| Sports Facility | 0.699 | 0.130 | 0.073 | 0.307 | −0.177 |
| Sports Court | 0.672 | −0.002 | 0.204 | 0.214 | 0.033 |
| Attractions in the Park | 0.651 | 0.086 | 0.122 | 0.216 | 0.028 |
| Lighting Facility | 0.634 | 0.297 | 0.118 | 0.095 | 0.111 |
| Parking | 0.564 | 0.134 | 0.330 | −0.264 | 0.138 |
| Public Facility | 0.558 | 0.043 | 0.204 | 0.175 | 0.398 |
| Resting Place | 0.527 | 0.118 | 0.452 | 0.134 | 0.234 |
| Safe Environment | 0.509 | 0.093 | 0.302 | 0.176 | 0.354 |
| Lightings on the Access Roads | 0.222 | 0.808 | 0.041 | 0.077 | 0.085 |
| Pedestrian/Car Separation | −0.078 | 0.753 | 0.271 | 0.265 | 0.078 |
| Car Speed on the Access Roads | 0.125 | 0.698 | 0.095 | 0.094 | 0.280 |
| Connectivity of Walkway | 0.042 | 0.598 | 0.189 | 0.432 | 0.042 |
| The hindrance on the Access Roads | 0.080 | 0.532 | 0.354 | 0.053 | 0.452 |
| The scenery on the Access Roads | 0.053 | 0.510 | 0.324 | 0.124 | 0.453 |
| The Size of the Park | 0.249 | 0.161 | 0.796 | 0.203 | 0.092 |
| Trail Length | 0.265 | 0.217 | 0.765 | 0.164 | 0.015 |
| Trail Width | 0.296 | 0.261 | 0.757 | 0.214 | 0.038 |
| Tree Shades in Sidewalk | 0.182 | 0.292 | 0.053 | 0.723 | 0.193 |
| Shades in the Park | 0.205 | 0.102 | 0.346 | 0.631 | 0.304 |
| Green Area | 0.199 | 0.068 | 0.396 | 0.625 | 0.297 |
| The scenery in the Park | 0.425 | 0.114 | 0.244 | 0.605 | 0.004 |
| The scenery on the Access Roads | 0.242 | 0.378 | 0.076 | 0.535 | 0.292 |
| Safe Environment | 0.119 | 0.254 | 0.081 | 0.209 | 0.712 |
| Level of Slopes | 0.010 | 0.246 | −0.097 | 0.424 | 0.668 |
| Eigenvalue | 4.286 | 3.302 | 3.041 | 2.948 | 2.186 |
| Percentage of Variance (%) | 17.151 | 13.211 | 12.173 | 11.801 | 8.749 |
| Cumulative Variance (%) | 17.151 | 30.363 | 42.538 | 54.338 | 63.091 |
| Sampling Adequacy by KMO Measure | 0.885 | ||||
| Bartlett’s Test of Sphericity | p = 0.000 | ||||
References
- Jung, C.; Awad, J. The improvement of indoor air quality in residential buildings in Dubai, UAE. Buildings 2021, 11, 250. [Google Scholar] [CrossRef]
- Knoema. United Arab Emirates—Gross Domestic Product in Current Prices. 2021. Available online: https://knoema.com/atlas/United-Arab-Emirates/GDP (accessed on 2 July 2021).
- World Population Review. Dubai Population, 2021–2. 2021. Available online: https://worldpopulationreview.com/world-cities/dubai-population (accessed on 16 June 2021).
- Giuffrida, N.; Le Pira, M.; Inturri, G.; Ignaccolo, M.; Calabrò, G.; Cuius, B.; Pluchino, A. On-demand flexible transit in fast-growing cities: The case of Dubai. Sustainability 2020, 12, 4455. [Google Scholar] [CrossRef]
- Zaidan, E.; Kovacs, J.F. Resident attitudes towards tourists and tourism growth: A case study from the Middle East, Dubai in the United Arab Emirates. Eur. J. Sustain. Dev. 2017, 6, 291. [Google Scholar] [CrossRef]
- Ryan, C.; Ninov, I. Dimensions of destination images—The relationship between specific sites and overall perceptions of place: The example of Dubai Creek and “Greater Dubai”. J. Travel Tour. Mark. 2011, 28, 751–764. [Google Scholar] [CrossRef]
- Bodolica, V.; Spraggon, M.; Saleh, N. Innovative leadership in leisure and entertainment industry: The case of the UAE as a global tourism hub. Int. J. Islamic Middle East. Financ. Manag. 2020, 13, 323–337. [Google Scholar] [CrossRef]
- Jung, C.; Awad, J.; Sami Abdelaziz Mahmoud, N.S.A.; Salameh, M. An analysis of indoor environment evaluation for the Springs development in Dubai, UAE. Open House Int. 2021, 46, 651–667. [Google Scholar] [CrossRef]
- Khan, M.S.; Woo, M.; Nam, K.; Chathoth, P.K. Smart city and smart tourism: A case of Dubai. Sustainability 2017, 9, 2279. [Google Scholar] [CrossRef] [Green Version]
- Aram, F.; Solgi, E.; Garcia, E.H.; Mosavi, A. Urban heat resilience at the time of global warming: Evaluating the impact of the urban parks on outdoor thermal comfort. Environ. Sci. Eur. 2020, 32, 117. [Google Scholar] [CrossRef]
- Lin, B.B.; Fuller, R.A.; Bush, R.; Gaston, K.J.; Shanahan, D.F. Opportunity or orientation? Who uses urban parks and why? PLoS ONE 2014, 9, e87422. [Google Scholar] [CrossRef] [Green Version]
- Rigolon, A. A complex landscape of inequity in access to urban parks: A literature review. Landsc. Urban Plan. 2016, 153, 160–169. [Google Scholar] [CrossRef]
- Tempesta, T. Benefits and costs of urban parks: A review. Aestimum 2015, 67, 127–143. [Google Scholar]
- Larson, L.R.; Jennings, V.; Cloutier, S.A. Public parks and wellbeing in urban areas of the United States. PLoS ONE 2016, 11, e0153211. [Google Scholar] [CrossRef] [PubMed]
- Loughran, K. Urban parks and urban problems: An historical perspective on green space development as a cultural fix. Urban Stud. 2020, 57, 2321–2338. [Google Scholar] [CrossRef]
- Rigolon, A.; Browning, M.; Jennings, V. Inequities in the quality of urban park systems: An environmental justice investigation of cities in the United States. Landsc. Urban Plan. 2018, 178, 156–169. [Google Scholar] [CrossRef]
- Alawadi, K.; Benkraouda, O. The debate over neighborhood density in Dubai: Between theory and practicality. J. Plan. Educ. Res. 2019, 39, 18–34. [Google Scholar] [CrossRef]
- Awad, J.; Jung, C. Extracting the Planning Elements for Sustainable Urban Regeneration in Dubai with AHP (Analytic Hierarchy Process). Sustain. Cities Soc. 2022, 76, 103496. [Google Scholar] [CrossRef]
- Elsheshtawy, Y. Where the sidewalk ends: Informal Street corner encounters in Dubai. Cities 2013, 31, 382–393. [Google Scholar] [CrossRef]
- Denley, D. Reinventing the public Park- The block in Dubai. Landsc. Archit. Front. 2019, 7, 134–146. [Google Scholar] [CrossRef]
- Jang, K.M.; Kim, J.; Lee, H.Y.; Cho, H.; Kim, Y. Urban green accessibility index: A measure of pedestrian-centered accessibility to every Green Point in an urban area. ISPRS Int. J. Geoinf. 2020, 9, 586. [Google Scholar] [CrossRef]
- Alipour, S.M.H.; Galal Ahmed, K.G. Assessing the effect of urban form on social sustainability: A proposed “Integrated Measuring Tools Method” for urban neighborhoods in Dubai. City Territ. Archit. 2021, 8, 1. [Google Scholar] [CrossRef]
- Alawadi, K. Place attachment as a motivation for community preservation: The demise of an old, bustling, Dubai community. Urban Stud. 2017, 54, 2973–2997. [Google Scholar] [CrossRef]
- Cohen, D.A.; Han, B.; Nagel, C.J.; Harnik, P.; McKenzie, T.L.; Evenson, K.R.; Katta, S. The first national study of neighborhood parks: Implications for physical activity. Am. J. Prev. Med. 2016, 51, 419–426. [Google Scholar] [CrossRef] [PubMed] [Green Version]
- Moulay, A.; Ujang, N.; Said, I. Legibility of neighborhood parks as a predicator for enhanced social interaction towards social sustainability. Cities 2017, 61, 58–64. [Google Scholar] [CrossRef]
- Furlan, R.; Sinclair, B.R. Planning for a neighborhood and city-scale green network system in Qatar: The case of MIA Park. Environ. Dev. Sustain. 2021, 23, 14933–14957. [Google Scholar] [CrossRef]
- Park, Y.; Rogers, G.O. Neighborhood planning theory, Guidelines, and Research [Guidelines], and research: Can area, population, and boundary guide conceptual framing? J. Plan. Lit. 2015, 30, 18–36. [Google Scholar] [CrossRef]
- Park, K. Park and neighborhood attributes associated with park use: An observational study using unmanned aerial vehicles. Environ. Behav. 2020, 52, 518–543. [Google Scholar] [CrossRef]
- Miyake, K.K.; Maroko, A.R.; Grady, K.L.; Maantay, J.A.; Arno, P.S. Not just a walk in the park: Methodological improvements for determining environmental justice implications of park access in New York City for the promotion of physical activity. Cities Environ. 2010, 3, 1–17. [Google Scholar] [CrossRef] [PubMed]
- Xiao, Y.; Wang, Z.; Li, Z.; Tang, Z. An assessment of urban park access in Shanghai–Implications for the social equity in urban China. Landsc. Urban Plan. 2017, 157, 383–393. [Google Scholar] [CrossRef]
- Roberts, H.; Kellar, I.; Conner, M.; Gidlow, C.; Kelly, B.; Nieuwenhuijsen, M.; McEachan, R. Associations between park features, park satisfaction and park use in a multi-ethnic deprived urban area. Urban For. Urban Green. 2019, 46, 126485. [Google Scholar] [CrossRef] [Green Version]
- Zengel, R.; Dogrusoy, İ.T. The importance of sociocultural habits in park design, leisure behaviour and user satisfaction. A Comparative Study on Two Parks in İzmir, Turkey. J. Settl. Spat. Plan. 2014, 5, 107–117. [Google Scholar]
- Plunz, R.A.; Zhou, Y.; Carrasco Vintimilla, M.I.C.; Mckeown, K.; Yu, T.; Uguccioni, L.; Sutto, M.P. Twitter sentiment in New York City parks as measure of well-being. Landsc. Urban Plan. 2019, 189, 235–246. [Google Scholar] [CrossRef]
- Zhang, Y.; Moyle, B.D.; Jin, X. Fostering visitors’ pro-environmental behaviour in an urban park. Asia Pac. J. Tour. Res. 2018, 23, 691–702. [Google Scholar] [CrossRef]
- Chan, C.S.; Si, F.H.; Marafa, L.M. Indicator development for sustainable urban park management in Hong Kong. Urban For. Urban Green. 2018, 31, 1–14. [Google Scholar] [CrossRef]
- Neckel, A.; Da Silva, J.L.; Saraiva, P.P.; Kujawa, H.A.; Araldi, J.; Paladini, E.P. Estimation of the economic value of urban parks in Brazil, the case of the City of Passo Fundo. J. Clean. Prod. 2020, 264, 121369. [Google Scholar] [CrossRef]
- Gholipour, S.; MahdiNejad, J.E.D.; Saleh Sedghpour, B. Security and urban satisfaction: Developing a model based on safe urban park design components extracted from users’ preferences. Secur. J. 2021, 1–30. [Google Scholar] [CrossRef]
- Alawadi, K.; Khaleel, S.; Benkraouda, O. Design and planning for accessibility: Lessons from Abu Dhabi and Dubai’s neighborhoods. J. Hous. Built Environ. 2021, 36, 487–520. [Google Scholar] [CrossRef]
- Wang, D.; Brown, G.; Liu, Y. The physical and non-physical factors that influence perceived access to urban parks. Landsc. Urban Plan. 2015, 133, 53–66. [Google Scholar] [CrossRef]
- Zhai, Y.; Baran, P.K. Urban park pathway design characteristics and senior walking behavior. Urban For. Urban Green. 2017, 21, 60–73. [Google Scholar] [CrossRef]
- Ayala-Azcárraga, C.; Diaz, D.; Zambrano, L. Characteristics of urban parks and their relation to user well-being. Landsc. Urban Plan. 2019, 189, 27–35. [Google Scholar] [CrossRef]
- Anastasiou, E.; Manika, S. Perceptions, Determinants and Residential Satisfaction from Urban Open Spaces. Open J. Soc. Sci. 2020, 8, 1. [Google Scholar] [CrossRef]
- Liu, R.; Xiao, J. Factors affecting users’ satisfaction with urban parks through online comments data: Evidence from Shenzhen, China. Int. J. Environ. Res. Public Health 2021, 18, 253. [Google Scholar] [CrossRef] [PubMed]
- Russell, J.A.; Lanius, U.F. Adaptation level and the affective appraisal of environments. J. Environ. Psychol. 1984, 4, 119–135. [Google Scholar] [CrossRef]
- Rapoport, A. Human Aspects of Urban Form: Towards a Man—Environment Approach to Urban Form and Design; Elsevier: Amsterdam, The Netherlands, 2016; pp. 60–81. [Google Scholar]
- Almeida, C.M.V.B.; Mariano, M.V.; Agostinho, F.; Liu, G.Y.; Giannetti, B.F. Exploring the potential of urban park size for the provision of ecosystem services to urban centres: A case study in São Paulo, Brazil. Build. Environ. 2018, 144, 450–458. [Google Scholar] [CrossRef]
- Kim, H.S.; Lee, G.E.; Lee, J.S.; Choi, Y. Understanding the local impact of urban park plans and park typology on housing price: A case study of the Busan metropolitan region, Korea. Landsc. Urban Plan. 2019, 184, 1–11. [Google Scholar] [CrossRef]
- Zhai, Y.; Baran, P.K. Do configurational attributes matter in context of urban parks? Park pathway configurational attributes and senior walking. Landsc. Urban Plan. 2016, 148, 188–202. [Google Scholar] [CrossRef]
- Cho, G.H.; Rodriguez, D. Location or design? Associations between neighbourhood location, built environment and walking. Urban Stud. 2015, 52, 1434–1453. [Google Scholar] [CrossRef]
- Giles-Corti, B.; Bull, F.; Knuiman, M.; McCormack, G.; Van Niel, K.; Timperio, A.; Boruff, B. The influence of urban design on neighbourhood walking following residential relocation: Longitudinal results from the RESIDE study. Soc. Sci. Med. 2013, 77, 20–30. [Google Scholar] [CrossRef] [Green Version]
- Sarkar, C.; Webster, C.; Pryor, M.; Tang, D.; Melbourne, S.; Zhang, X.; Jianzheng, L. Exploring associations between urban green, street design and walking: Results from the Greater London boroughs. Landsc. Urban Plan. 2015, 143, 112–125. [Google Scholar] [CrossRef]
- Wang, D.; Brown, G.; Liu, Y.; Mateo-Babiano, I. A comparison of perceived and geographic access to predict urban park use. Cities 2015, 42, 85–96. [Google Scholar] [CrossRef]
- Tang, B.S.; Wong, K.K.; Tang, K.S.; Wai Wong, S. Walking accessibility to neighborhood open space in a multi-level urban environment of Hong Kong. Environ. Plan. B Urban Anal. City Sci. 2021, 48, 1340–1356. [Google Scholar] [CrossRef]
- Dubai Municipality. GIS Services. 2021. Available online: https://www.dm.gov.ae/municipality-business/planning-and-construction/geographic-information-systems/gis-services/%20Dubai%20Municipality (accessed on 16 June 2021).
- Dubai Travel Planner. 22 Beautiful Parks and Gardens in Dubai You Won’t Believe! 2021. Available online: https://www.dubaitravelplanner.com/best-parks-in-dubai/ (accessed on 14 May 2021).
- Time Out. 20 Family-Friendly Parks, Playgrounds and Picnic Spots in the UAE. 2020. Available online: https://www.timeoutdubai.com/kids/435378-20-family-friendly-parks-playgrounds-and-picnic-spots-in-the-uae (accessed on 18 July 2021).
- Sugiyama, T.; Francis, J.; Middleton, N.J.; Owen, N.; Giles-Corti, B. Associations between recreational walking and attractiveness, size, and proximity of neighborhood open spaces. Am. J. Public Health 2020, 100, 1752–1757. [Google Scholar] [CrossRef] [PubMed]
- Bayut. All about Al Ittihad Park in Palm Jumeirah. 2021. Available online: https://www.bayut.com/mybayut/al-ittihad-park-palm-jumeirah/ (accessed on 22 May 2021).
- Bay Avenue. About Bay Avenue. 2020. Available online: https://www.bayavenue.ae/about-us/ (accessed on 28 May 2021).
- Propsearch. Bay Avenue Mall and Park. 2021. Available online: https://propsearch.ae/dubai/bay-avenue-mall-park (accessed on 12 May 2021).
- Dubai Properties. Executive Tower Business Bay. 2021. Available online: https://www.dp.ae/our-portfolio/homes-to-buy/13/the-executive-towers/ (accessed on 21 June 2021).
- Nakheel. Al Ittihad Park: Nakheel. 2021. Available online: https://www.nakheel.com/our-development-al-ittihad-park.html (accessed on 8 April 2021).
- Bayut. All about the Bay Avenue Park. 2021. Available online: https://www.bayut.com/mybayut/bay-avenue-park-business-bay/ (accessed on 12 June 2021).
- DubaiCity. Golden Mile Galleria. 2021. Available online: https://www.dubaicity.com/golden-mile-galleria-in-palm-jumeirah/ (accessed on 16 April 2021).
- Lotfi, S.; Koohsari, M.J. Measuring objective accessibility to neighborhood facilities in the city (A case study: Zone 6 in Tehran, Iran). Cities 2009, 26, 133–140. [Google Scholar] [CrossRef]
- Dubai Municipality. Neighborhood Parks. 2021. Available online: https://www.dm.gov.ae/projects/neighborhood-parks/ (accessed on 2 July 2021).
- Brown, G.; Schebella, M.F.; Weber, D. Using participatory GIS to measure physical activity and urban park benefits. Landsc. Urban Plan. 2014, 121, 34–44. [Google Scholar] [CrossRef]
- Plunkett, D.; Fulthorp, K.; Paris, C.M. Examining the relationship between place attachment and behavioral loyalty in an urban park setting. J. Outdoor Recreat. Tour. 2019, 25, 36–44. [Google Scholar] [CrossRef]


| # | Name | Location | Area | Features |
|---|---|---|---|---|
| 1 | Al Barsha Pond Park | Al Barsha | 210,400 m2 |
|
| 2 | Al Ittihad Park * | Palm Jumeirah | 98,200 m2 |
|
| 3 | Al Khazzan Park | City Walk | 15,200 m2 |
|
| 4 | Al Sufouh Park | Al Sufouh | 14,000 m2 |
|
| 5 | Al Wasl Park | Jumeriah 1 | 14,800 m2 |
|
| 6 | Bay Avenue Park * | Business Bay | 35,000 m2 |
|
| 7 | Dubai Creek Park | Dubai Creek | 960,000 m2 |
|
| 8 | Dubai Hills Park | Dubai Hills | 180,000 m2 |
|
| 9 | Dubai Miracle Garden * | Al Barsha South | 72,000 m2 |
|
| 10 | JLT Park * | JLT | 35,000 m2 |
|
| 11 | Jumeirah Beach Park * | Umm Suqeim 2 | 35,100 m2 |
|
| 12 | Love Lake Dubai | Al Qudra Lake | 105,500 m2 |
|
| 13 | Mamzar Beach Park | Al Mamzar | 1,060,000 m2 |
|
| 14 | Mushrif Park | Al Khawaneej | 5,250,000 m2 |
|
| 15 | Nad Al Sheba Cycle Park * | Nad Al Sheba | 60,000 m2 |
|
| 16 | Quranic Park | Al Khawaneej | 600,000 m2 |
|
| 17 | Al Safa Park | Al Safa | 640,000 m2 |
|
| 18 | The Block | Dubai Creek | 25,500 m2 |
|
| 19 | Umm Suqeim Park | Umm Suqeim 1 | 28,000 m2 |
|
| 20 | Zabeel Park | Zabeel | 475,000 m2 |
|
| Main Categories | Questions | Evaluation | |
|---|---|---|---|
| Park User Behavior | 1. Frequency of Visit, 2. Duration of Visit, 3. Reason for Visit, 4. Transportation Mode | Multiple Choices Question | |
| 1. Visiting Time, 2. Walking/Driving Time to Access | Short Answers Question | ||
| Satisfaction Level | Park Environments | 1. The Size of the Park, 2. Green Area, 3. Shades, 4. Trail Length, 5. Trail Width, 6. Lightings, 7. Parking, 8. Resting Place, 9. Public Facility, 10. Children Facility, 11. Sports Facility, 12. Sports Court, 13. Safe Environment, 14. Attractions, 15. Scenery | 5-Point Likert Scale Question |
| Accessibility to the park | 1. Safe Environment, 2. Scenery, 3. Attractions, 4. Tree Shades, 5. Connectivity of Walkway, 6. Level of Slopes, 7. Pedestrian/Car Separation, 8. Lightings, 9. Car Speed, 10. Hindrance | 5-Point Likert Scale Question | |
| Surveyor Information | 1. Gender, 2. Age, 3. Occupation, 4. Monthly Income Range | Multiple Choices Question | |
| Category | Bay Avenue Park | Al Ittihad Park |
|---|---|---|
| Physical Environment | 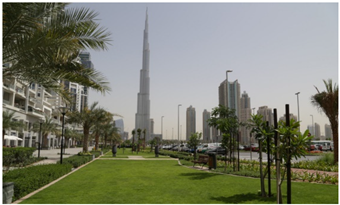 | 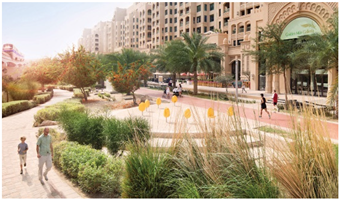 |
| Size | 35,000 m2 | 98,200 m2 |
| Resting Places | Coffee shops, 46 Benches, 6 Outdoor cafés | Coffee shops, 118 Benches, 8 Outdoor cafés |
| Sports Facility | 1.0 km jogging track, 2 Outdoor gyms, | 3.2 km jogging track |
| Parking | Parking lot (975), Bicycle racks | Parking lot (1346), Bicycle racks |
| Landscape | Lawn, Bushes, Dates palm trees (10 varieties of indigenous plants and trees) | Lawn, Bushes, Dates palm trees (60 types of indigenous plants and trees) |
| Children Facility | Skate parks, 2 Playgrounds, Dancing fountain | Playground with swings, slides, and other fun rides |
| Commercial Activity | Bay Avenue Mall | Golden Mile Galleria Mall |
| Sidewalk Area | 24,364 m2 | 19,496 m2 |
| Pedestrian Traffic Lights | 28 | 18 |
| Traffic Safety Signs | 84 | 68 |
| Number of Trees | 158 | 600 |
| Category | Bay Avenue Park | Al Ittihad Park | |||
|---|---|---|---|---|---|
| Number | Percentage | Number | Percentage | ||
| Gender | Male | 90 | 47.6 | 105 | 56.5 |
| Female | 99 | 52.4 | 81 | 43.5 | |
| Total | 189 | 100.0 | 186 | 100.0 | |
| Age Group | 10–19 | 14 | 7.4 | 15 | 8.1 |
| 20–29 | 18 | 9.5 | 33 | 17.7 | |
| 30–39 | 29 | 15.3 | 44 | 23.7 | |
| 40–49 | 41 | 21.7 | 53 | 28.5 | |
| 50–59 | 30 | 15.9 | 18 | 9.7 | |
| 60–69 | 34 | 18.0 | 14 | 7.5 | |
| Above 70 | 23 | 12.2 | 9 | 4.8 | |
| Total | 189 | 100.0 | 186 | 100.0 | |
| Occupations | Students | 30 | 15.9 | 23 | 12.4 |
| Housewives | 56 | 29.6 | 64 | 34.4 | |
| Office Workers | 46 | 24.3 | 55 | 29.6 | |
| Self-Employed | 21 | 11.1 | 33 | 17.7 | |
| Others | 36 | 19.1 | 11 | 5.9 | |
| Total | 189 | 100.0 | 186 | 100.0 | |
| Average Monthly Income (AED) | ≤10,000 | 19 | 10.2 | 13 | 7.0 |
| 10,000–20,000 | 76 | 40.6 | 90 | 48.1 | |
| 20,000–30,000 | 44 | 22.5 | 48 | 25.9 | |
| 30,000–40,000 | 33 | 17.6 | 26 | 14.1 | |
| ≥40,000 | 17 | 9.1 | 9 | 4.9 | |
| Total | 189 | 100.0 | 186 | 100.0 | |
| Category | Total | Bay Avenue Park | Al Ittihad Park | F Value | |||
|---|---|---|---|---|---|---|---|
| Mean | Standard Deviation | Mean | Standard Deviation | Mean | Standard Deviation | ||
| Shades | 3.52 | 0.870 | 3.50 | 0.866 | 3.53 | 2.876 | 0.008 |
| Green Area | 3.54 | 0.785 | 3.53 | 0.820 | 3.54 | 0.749 | 2.042 |
| The Size of the Park | 3.48 | 0.813 | 3.48 | 0.834 | 3.47 | 0.792 | 0.479 |
| Trail Width | 3.49 | 0.790 | 3.57 | 0.757 | 3.42 | 0.816 | 0.919 |
| Trail Length | 3.40 | 0.837 | 3.47 | 0.815 | 3.31 | 0.853 | 0.118 |
| Parking | 2.92 | 0.880 | 3.15 | 0.814 | 3.32 | 0.885 | 3.960 |
| Lightings | 3.19 | 0.906 | 3.47 | 0.872 | 2.69 | 0.852 | 3.089 |
| Resting Place | 3.15 | 0.981 | 3.33 | 0.962 | 2.89 | 0.969 | 1.895 |
| Public Facility | 2.98 | 1.032 | 3.34 | 0.894 | 2.97 | 1.031 | 6.163 |
| Children Facility | 2.56 | 0.883 | 2.68 | 0.881 | 2.60 | 0.867 | 0.006 |
| Sports Facility | 3.22 | 0.869 | 3.48 | 0.795 | 2.41 | 0.865 | 1.701 |
| Sports Court | 3.08 | 0.902 | 3.21 | 0.864 | 2.95 | 0.922 | 0.679 |
| Safe Environment | 3.49 | 0.796 | 3.72 | 0.782 | 3.25 | 0.739 | 0.554 |
| Attractions | 2.79 | 0.846 | 2.90 | 0.842 | 2.68 | 0.837 | 1.967 |
| Scenery | 3.31 | 0.894 | 3.40 | 0.879 | 3.21 | 0.902 | 0.315 |
| Category | Total | Bay Avenue Park | Al Ittihad Park | F Value | |||
|---|---|---|---|---|---|---|---|
| Mean | Standard Deviation | Mean | Standard Deviation | Mean | Standard Deviation | ||
| Level of Slopes | 3.78 | 0.888 | 3.92 | 0.933 | 3.64 | 0.819 | 0.153 |
| Safe Environment | 3.72 | 0.886 | 3.89 | 0.871 | 3.54 | 0.869 | 5.687 |
| Scenery | 3.53 | 0.896 | 3.73 | 0.857 | 3.33 | 0.893 | 0.391 |
| Attractions | 2.88 | 0.865 | 3.04 | 0.858 | 2.72 | 0.845 | 1.399 |
| Tree Shades | 3.44 | 0.934 | 3.46 | 0.913 | 3.43 | 0.957 | 0.356 |
| Connectivity of Walkway | 3.58 | 0.833 | 3.66 | 0.817 | 3.51 | 0.845 | 0.739 |
| Pedestrian/Car Separation | 3.63 | 0.868 | 3.76 | 0.890 | 3.50 | 0.826 | 0.151 |
| Lightings | 3.31 | 0.935 | 3.48 | 0.931 | 3.41 | 0.911 | 2.011 |
| Car Speed | 3.32 | 0.821 | 3.46 | 0.808 | 3.18 | 0.814 | 1.751 |
| Hindrance | 3.43 | 0.964 | 3.61 | 0.943 | 3.24 | 0.949 | 0.000 |
| Factors | Unstandardized Coefficients | Standardized Coefficients | t | R2 | F | |
|---|---|---|---|---|---|---|
| B | Standard Error | Beta | ||||
| Factor 1. Surrounding environment for access | 0.343 | 0.023 | 0.548 | 14.317 * | 0.723 | 99.564 * |
| Factor 2. Pedestrian Space | 0.243 | 0.023 | 0.356 | 9.308 * | ||
| Factor 3. Park Facility | 0.221 | 0.023 | 0.354 | 9.251 * | ||
| Factor 4. Convenience/Comfort of the Park | 0.214 | 0.023 | 0.342 | 8.927 * | ||
| Factor 5. Various Attractions & Activities | 0.154 | 0.023 | 0.244 | 6.391 * | ||
| Factors | Unstandardized Coefficients | Standardized Coefficients | t | R2 | F | |
|---|---|---|---|---|---|---|
| B | Standard Error | Beta | ||||
| Factor 3. Pedestrian Space | 0.248 | 0.026 | 0.413 | 9.122 * | 0.626 | 61.941 * |
| Factor 4. Green Landscape | 0.226 | 0.026 | 0.376 | 8.336 * | ||
| Factor 2. Surrounding environment for access | 0.222 | 0.026 | 0.369 | 8.166 * | ||
| Factor 1. Park Facilities | 0.210 | 0.026 | 0.349 | 7.736 * | ||
| Factor 5. Safe Access | 0.148 | 0.026 | 0.249 | 5.510 * | ||
Publisher’s Note: MDPI stays neutral with regard to jurisdictional claims in published maps and institutional affiliations. |
© 2022 by the authors. Licensee MDPI, Basel, Switzerland. This article is an open access article distributed under the terms and conditions of the Creative Commons Attribution (CC BY) license (https://creativecommons.org/licenses/by/4.0/).
Share and Cite
Jung, C.; Al Qassimi, N.; Arar, M.; Awad, J. The Improvement of User Satisfaction for Two Urban Parks in Dubai, UAE: Bay Avenue Park and Al Ittihad Park. Sustainability 2022, 14, 3460. https://doi.org/10.3390/su14063460
Jung C, Al Qassimi N, Arar M, Awad J. The Improvement of User Satisfaction for Two Urban Parks in Dubai, UAE: Bay Avenue Park and Al Ittihad Park. Sustainability. 2022; 14(6):3460. https://doi.org/10.3390/su14063460
Chicago/Turabian StyleJung, Chuloh, Nahla Al Qassimi, Mohammad Arar, and Jihad Awad. 2022. "The Improvement of User Satisfaction for Two Urban Parks in Dubai, UAE: Bay Avenue Park and Al Ittihad Park" Sustainability 14, no. 6: 3460. https://doi.org/10.3390/su14063460
APA StyleJung, C., Al Qassimi, N., Arar, M., & Awad, J. (2022). The Improvement of User Satisfaction for Two Urban Parks in Dubai, UAE: Bay Avenue Park and Al Ittihad Park. Sustainability, 14(6), 3460. https://doi.org/10.3390/su14063460