
Analysis of Taxi Travels during an Epidemic Period Using System Dynamics Method


 ,
,  ,
,
Abstract
:1. Introduction
2. Related Work
3. System Dynamics Model
3.1. System Boundaries and Model Factors
- (1)
- Taxi demand factors, representing taxi demand and basic characteristics of taxi operations, etc., includes:
- -
- The average distance travelled per taxi per day;
- -
- Taxi fares (total trip fares);
- -
- Total taxi demand.
- (2)
- Taxi supply factors, representing taxi supply and road infrastructure, etc., includes:
- -
- Number of taxis;
- -
- Average waiting time;
- -
- Average travel time.
- (3)
- Taxi policy factors, representing regulatory policies, taxation policies, etc., includes:
- -
- Taxi unit subsidy;
- -
- Limit on the number of taxis;
- -
- Taxi epidemic related policies.
3.2. Causality Diagram for Taxi Trips
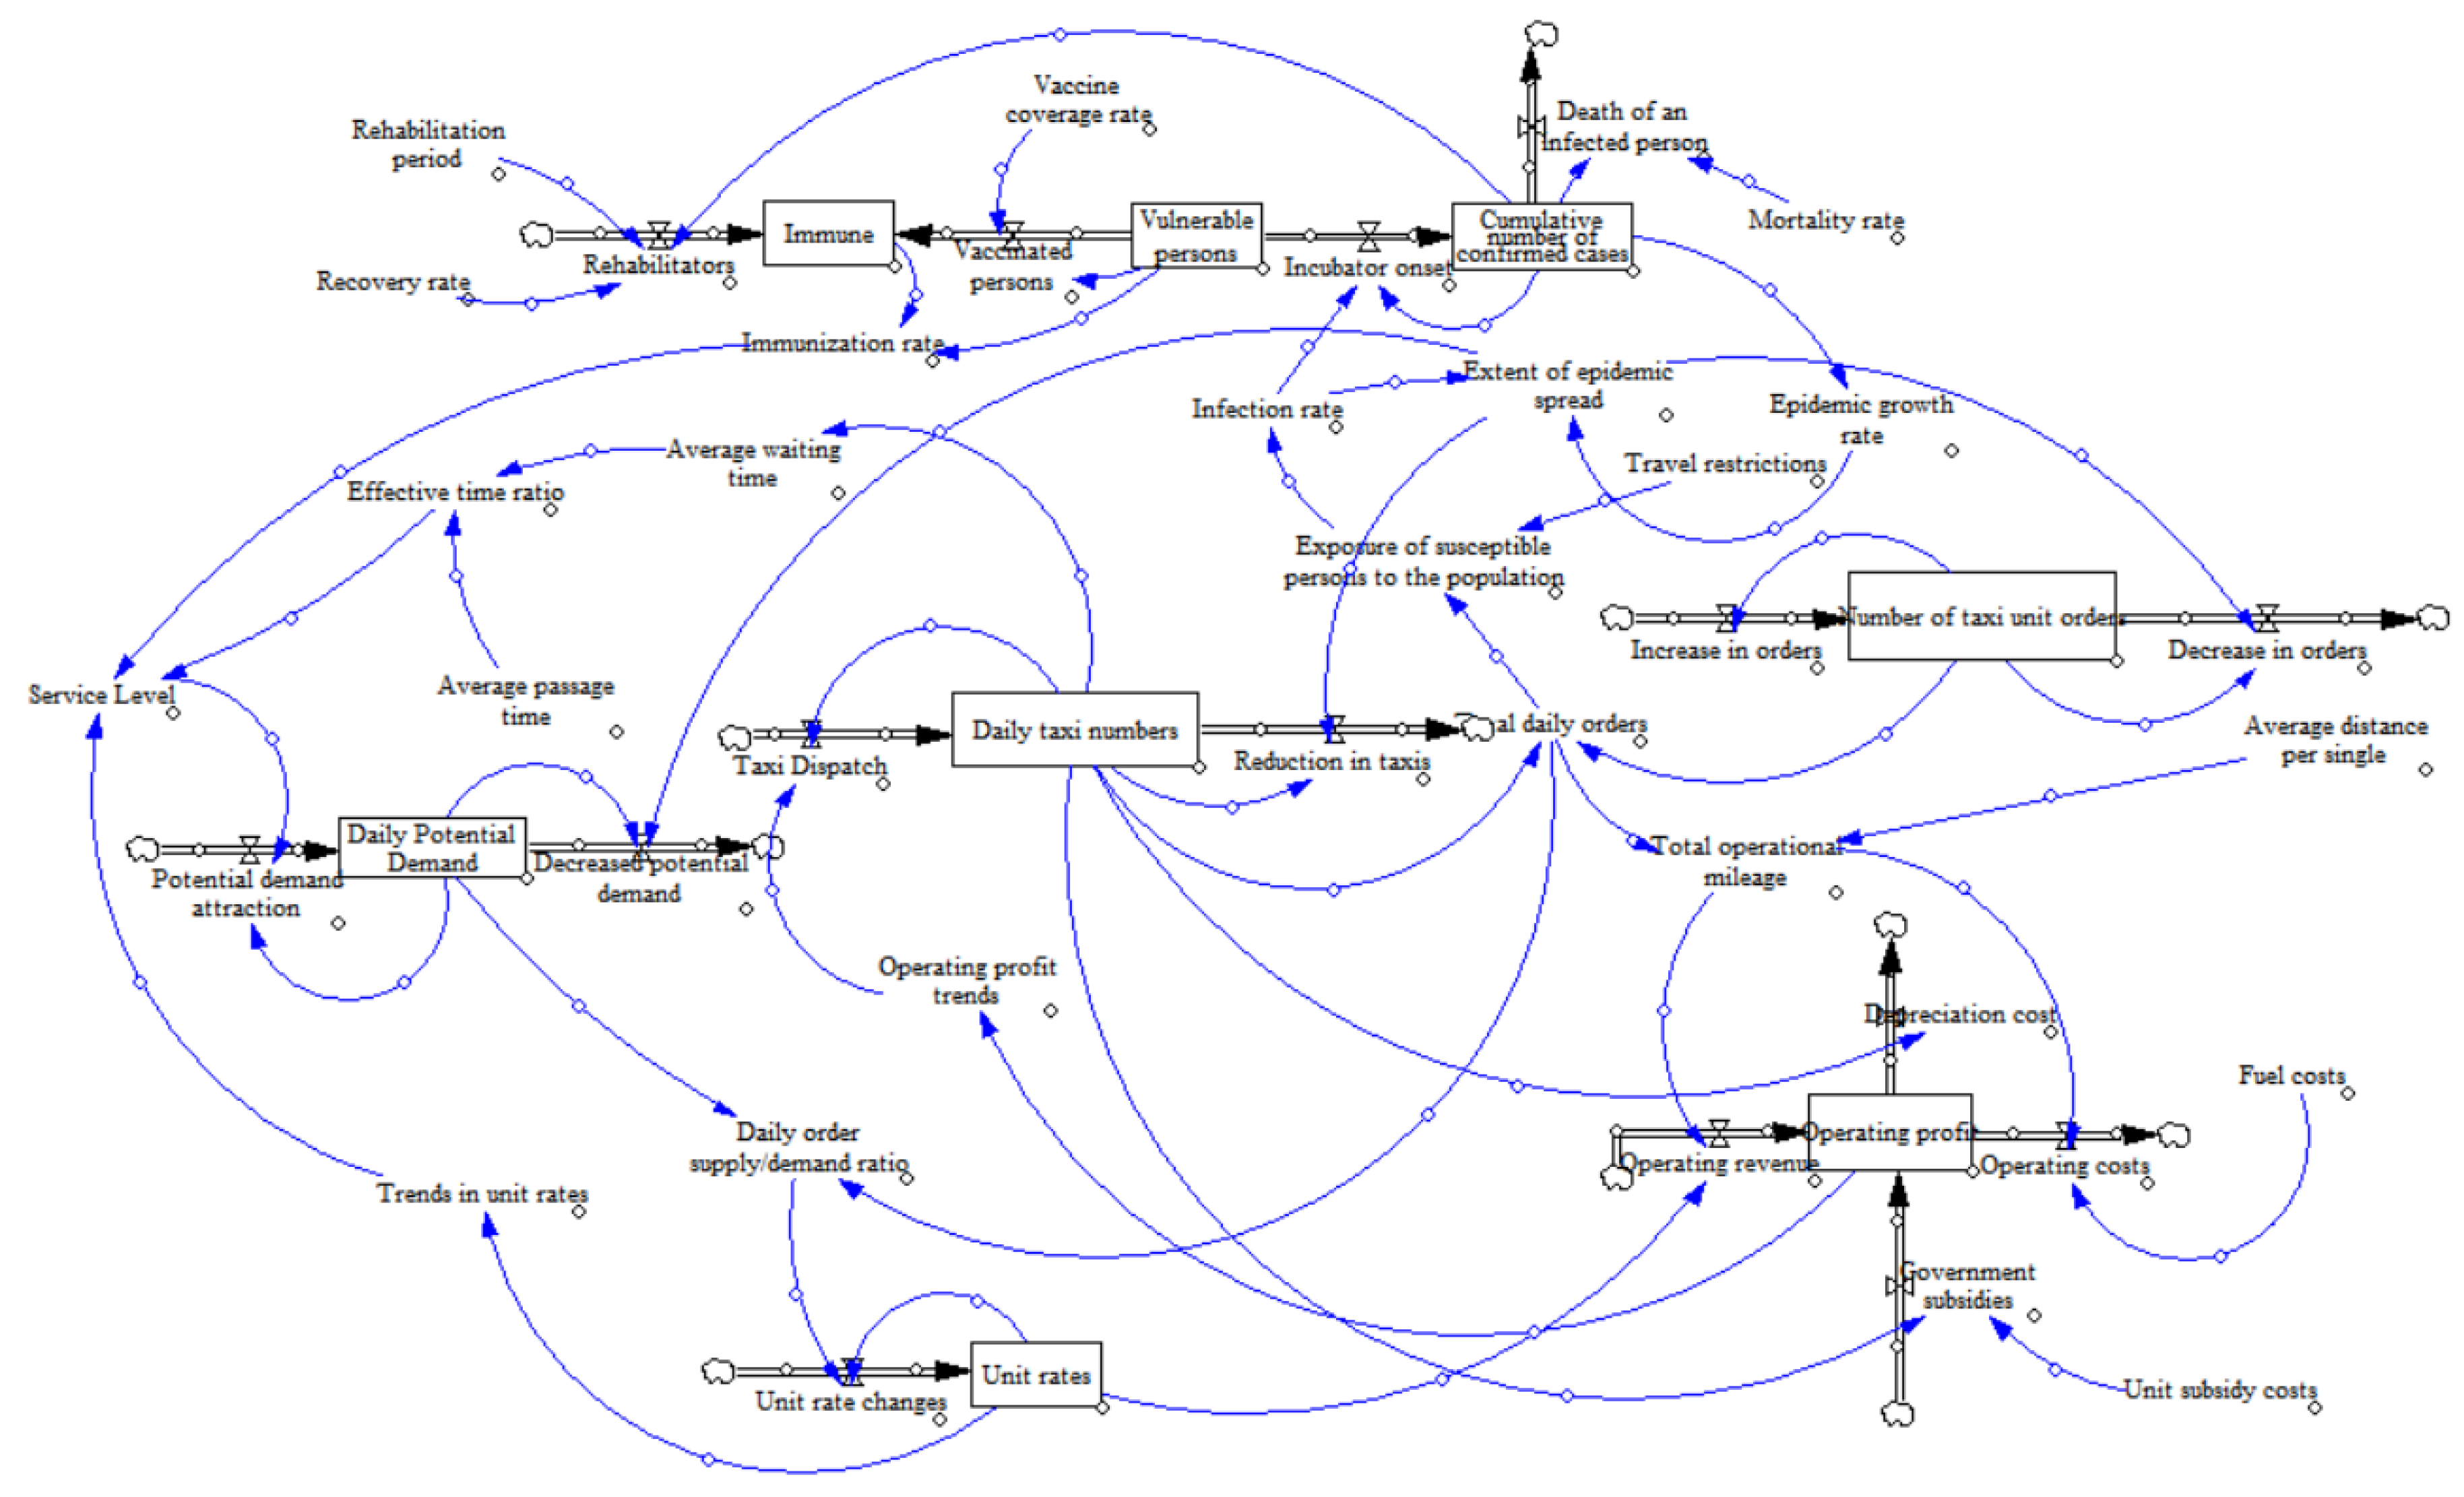
3.3. Flow Diagram of Taxi System Dynamics
4. Case Study of Taxi Operations in Ningbo
4.1. Sub-Models and Estimation of Parameters
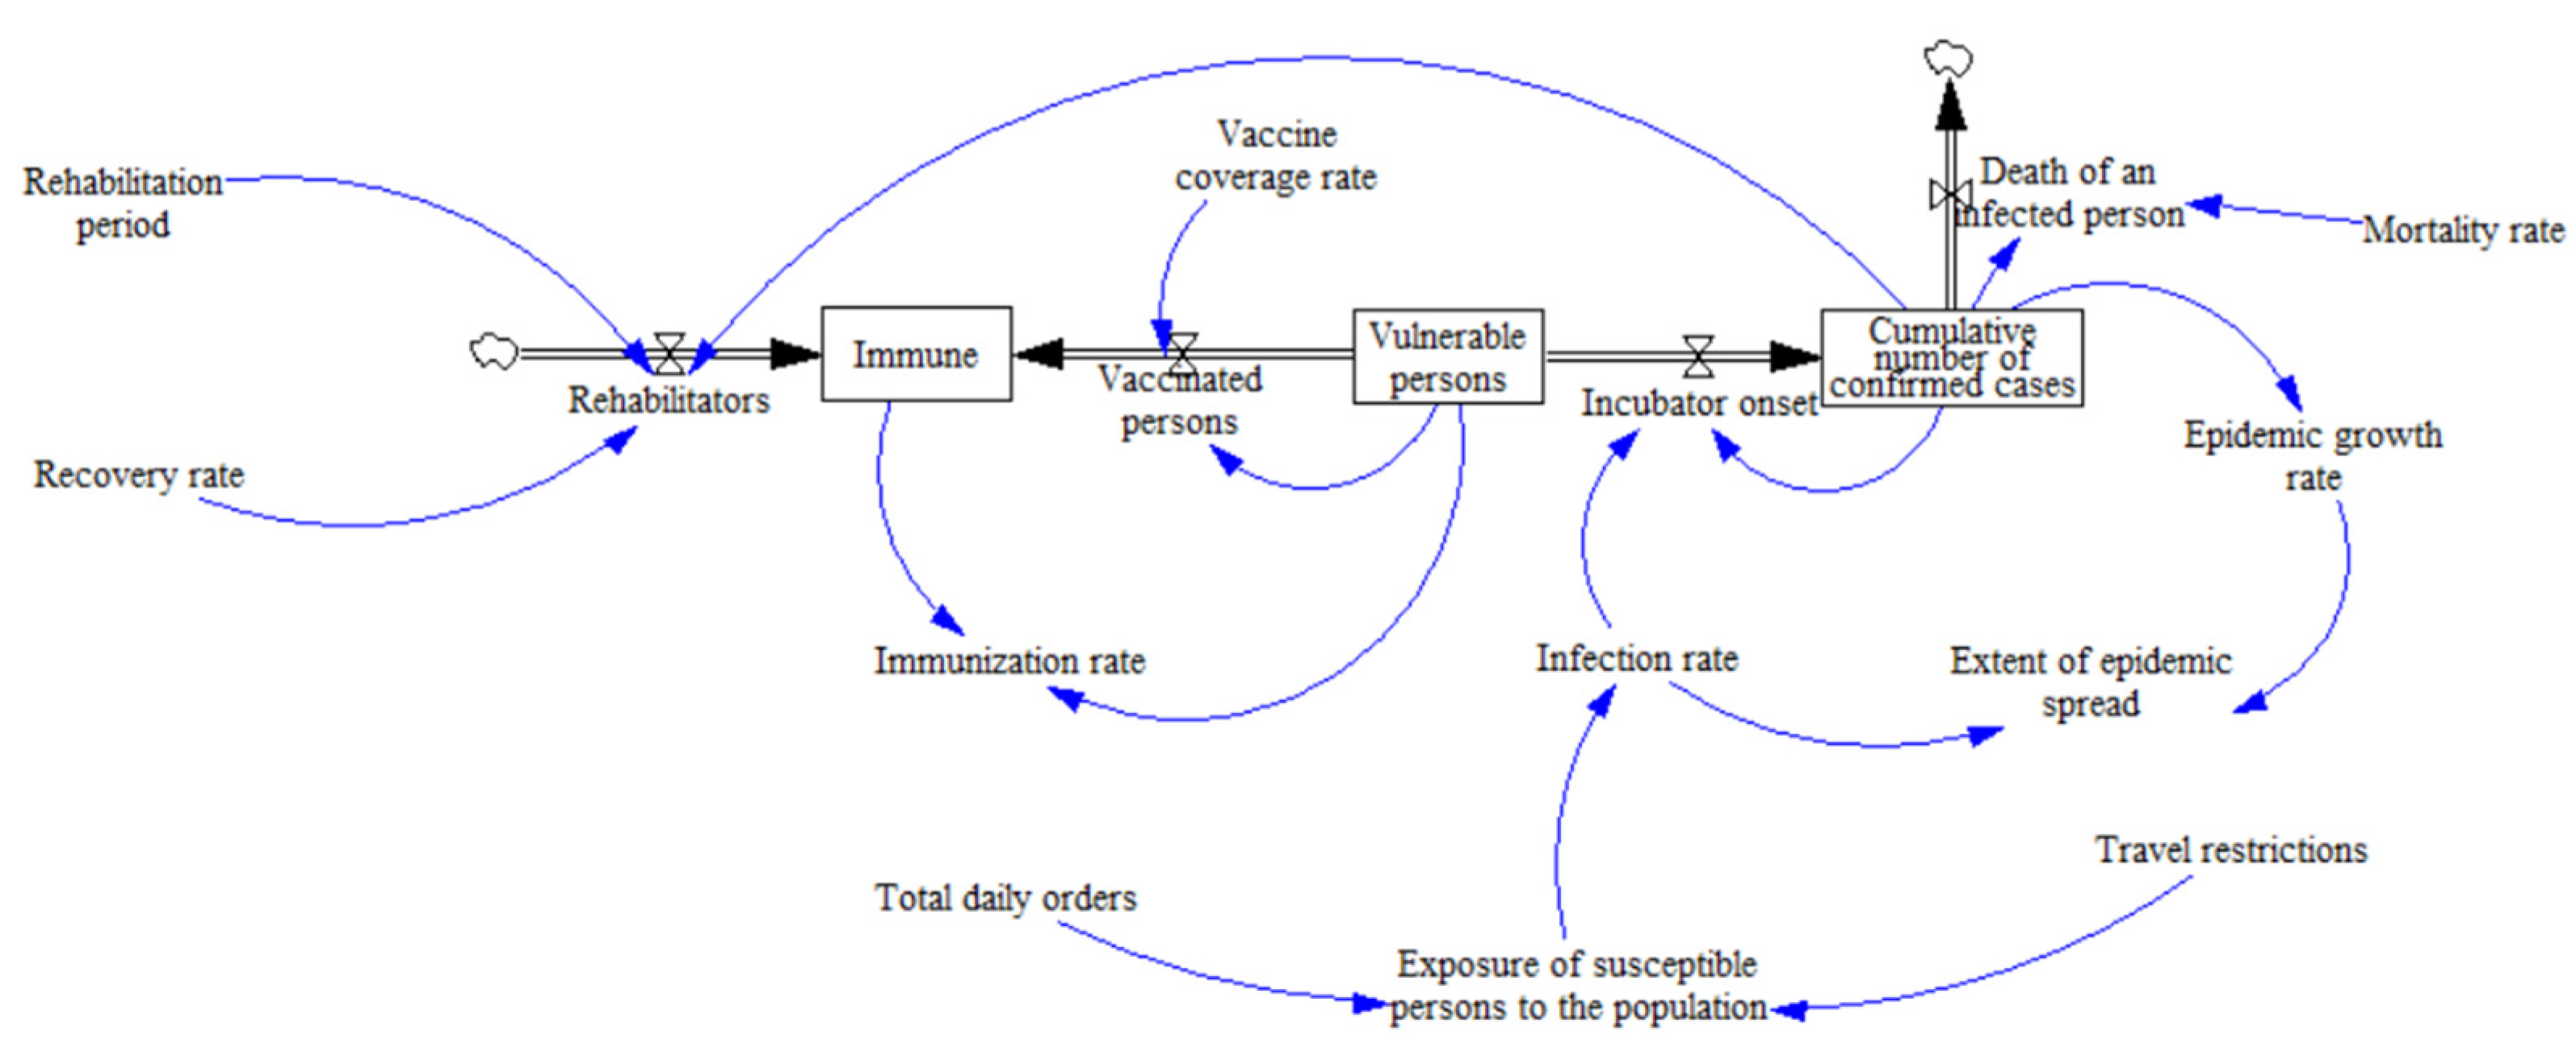
4.1.1. Epidemic Transmission Sub-Model
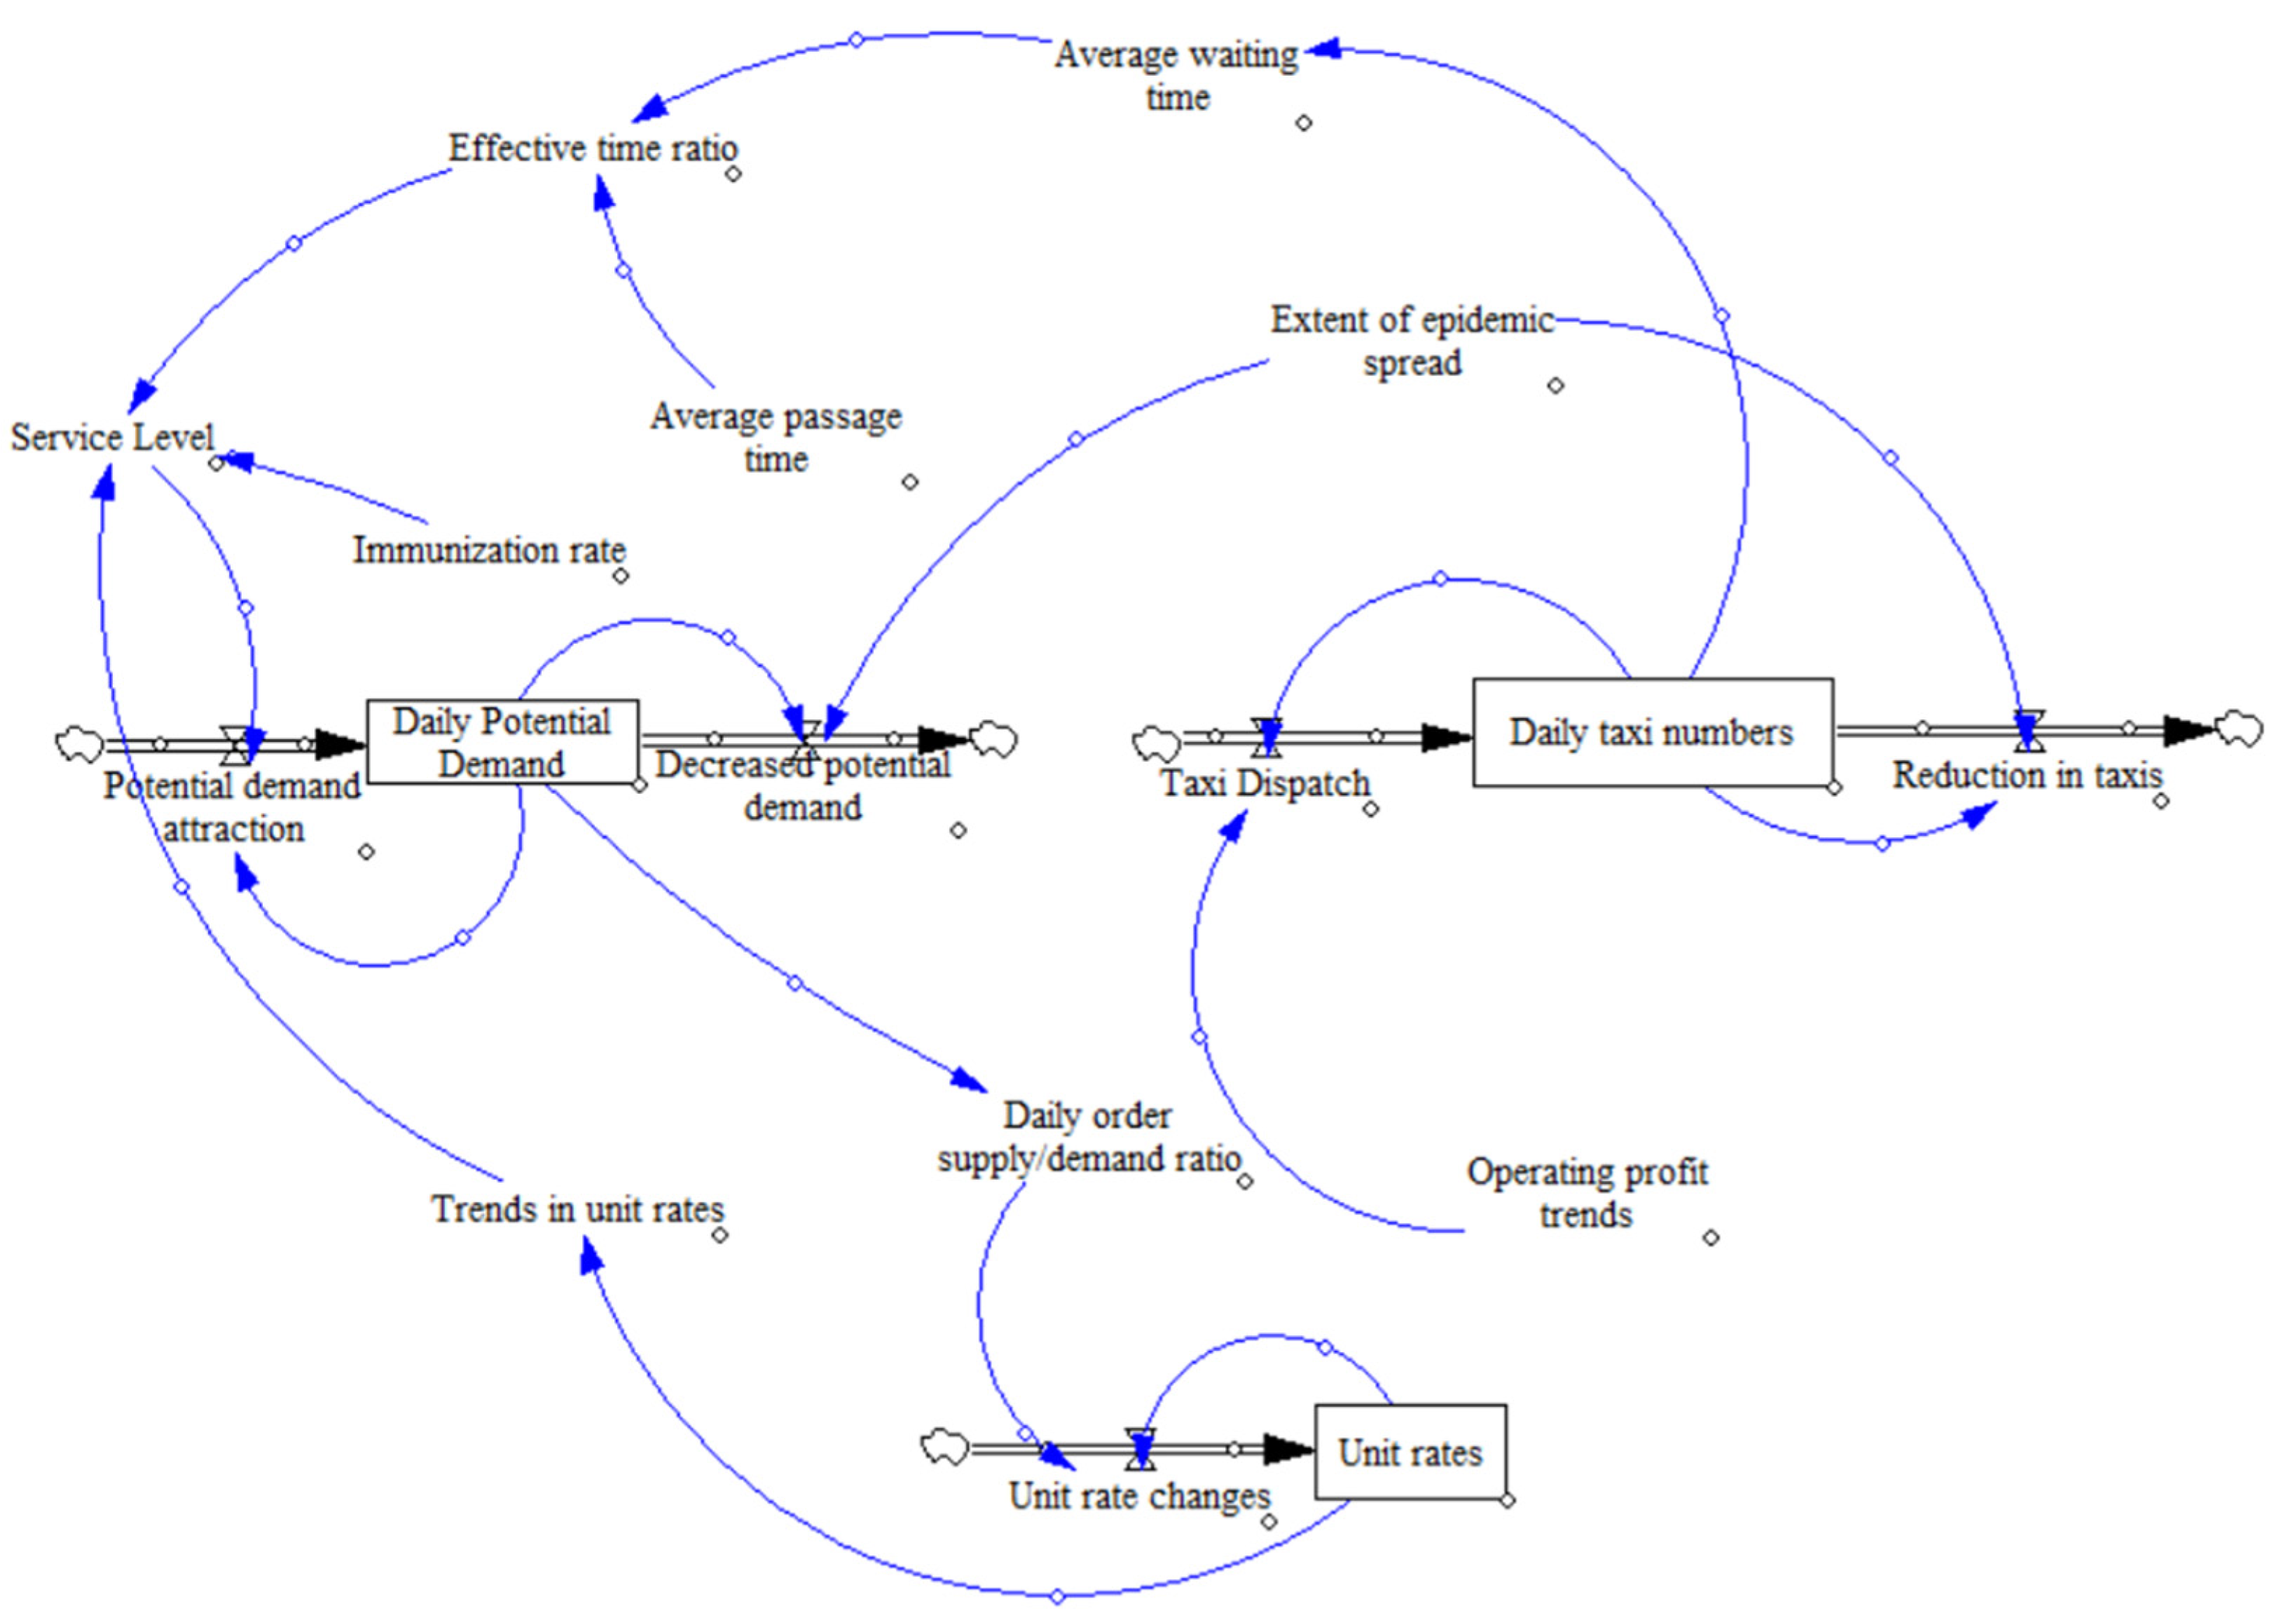
4.1.2. Travel Demand Sub-Model
4.1.3. Taxi Supply Sub-Model
4.2. Model Correction and Validity Analysis
4.2.1. Latitudinal Consistency Test
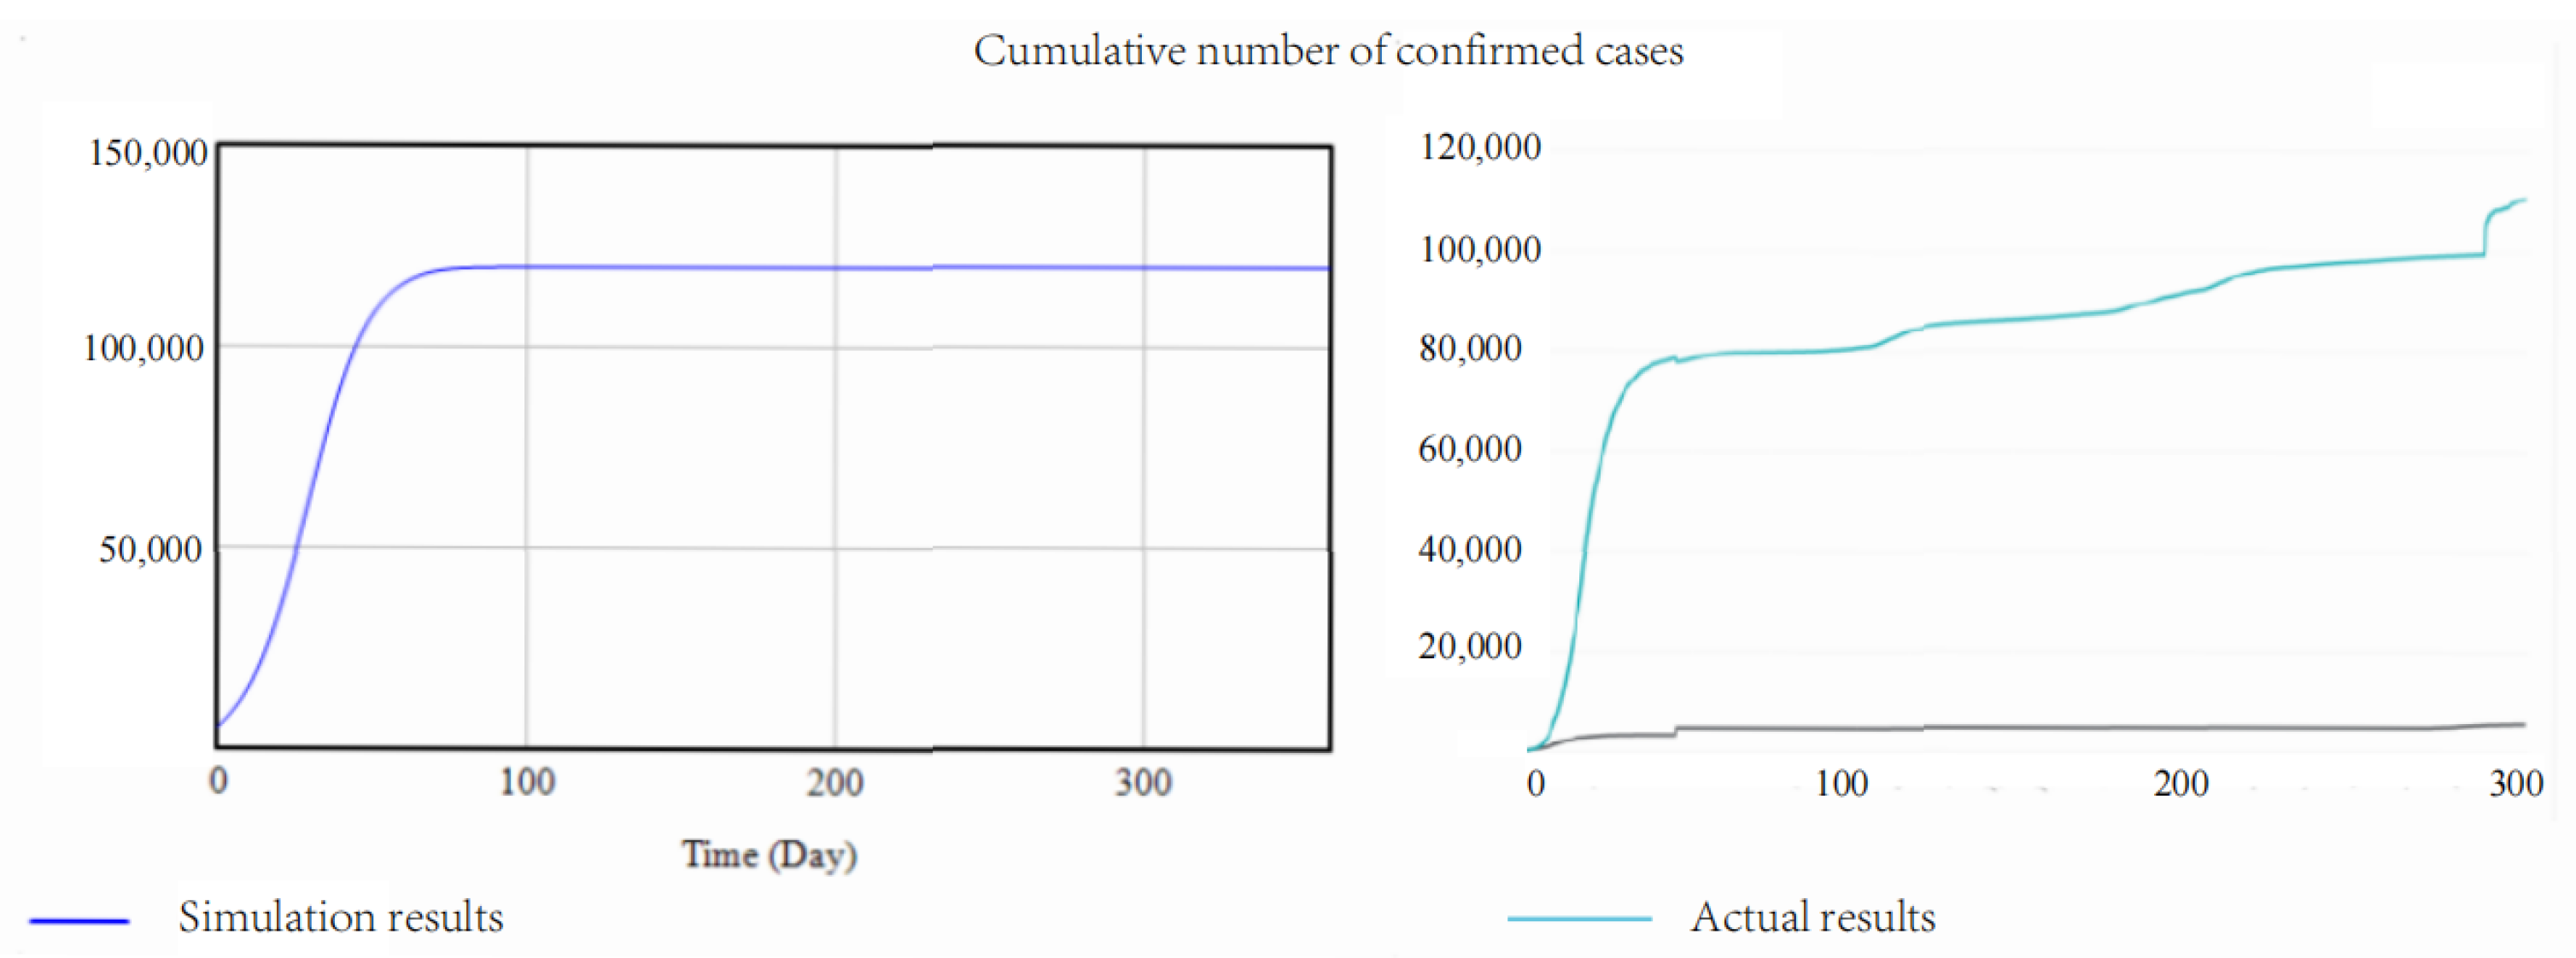
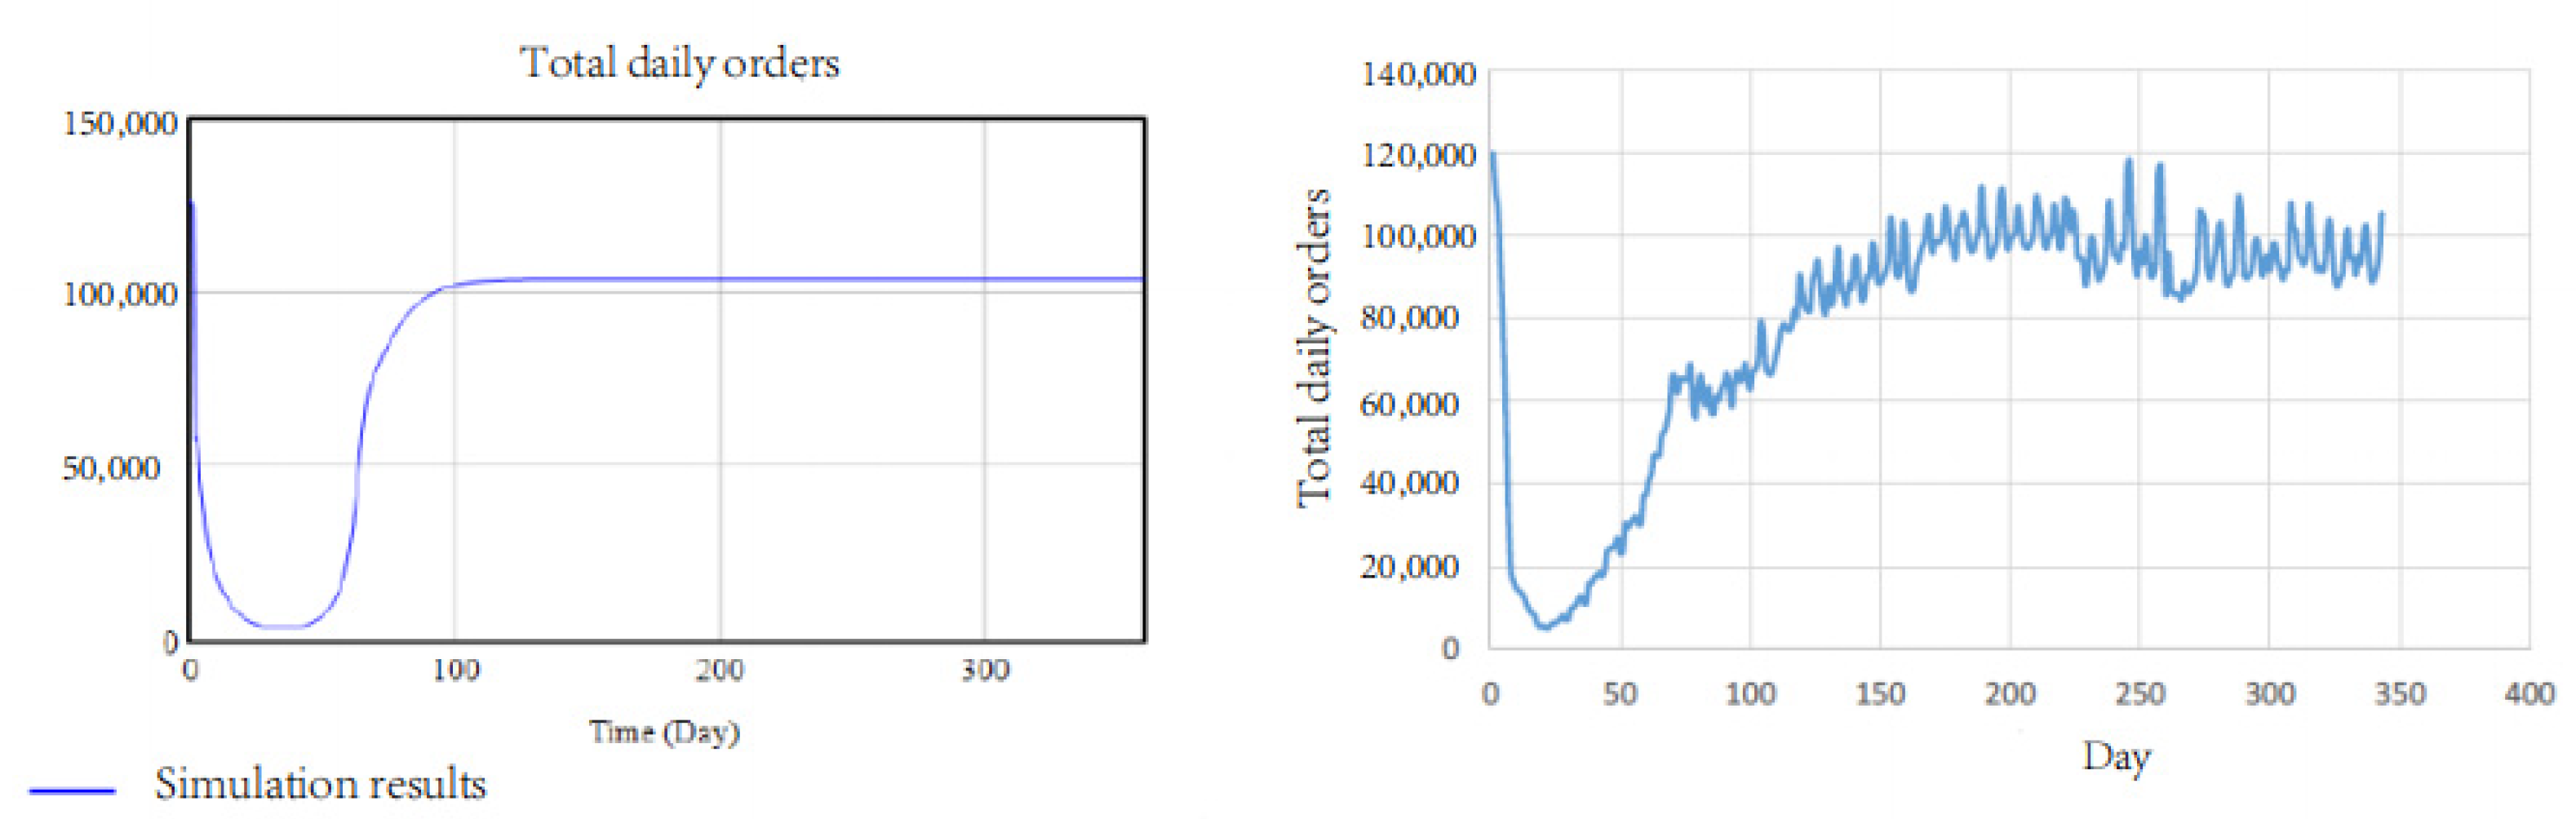
4.2.2. Goodness-of-Fit Tests
4.3. Ningbo Taxi Operation Scenario Simulation
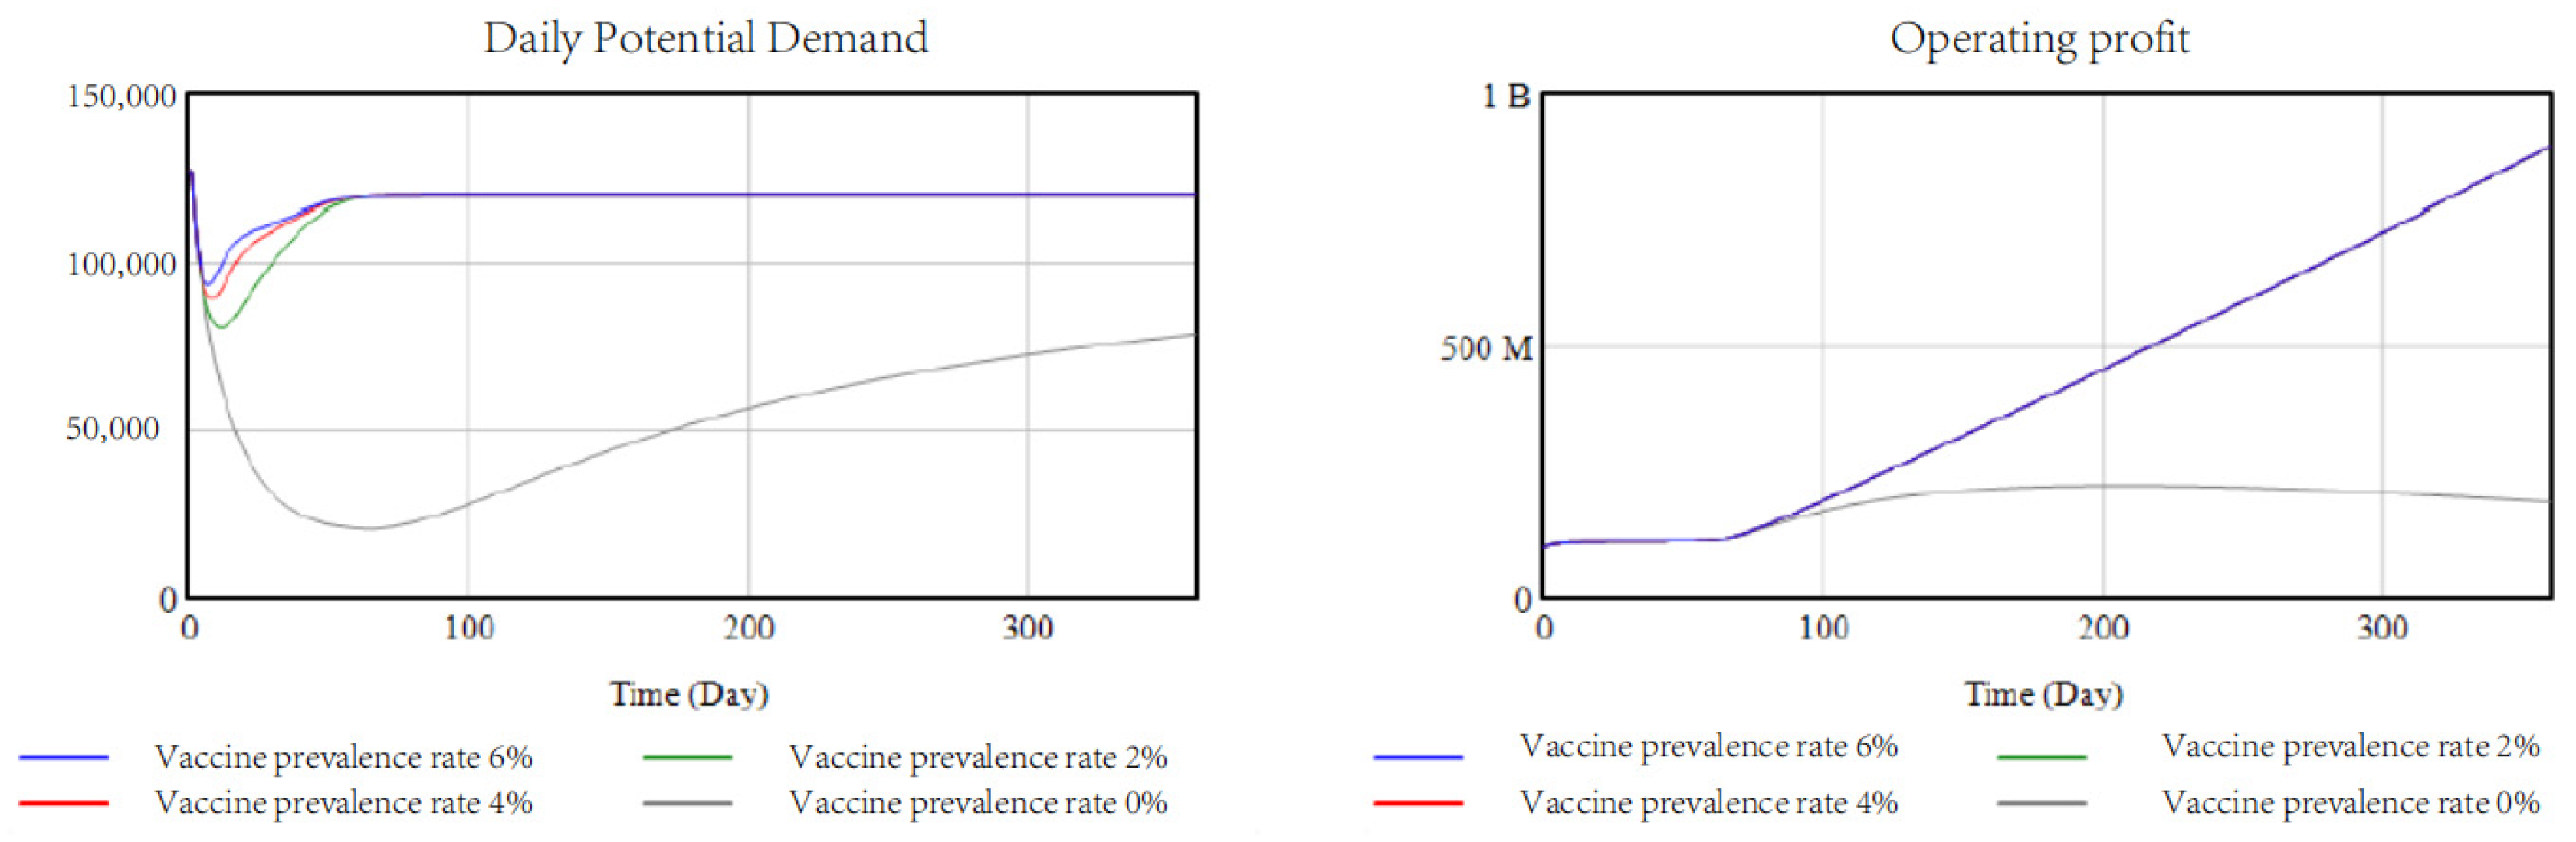
4.3.1. Vaccine Penetration Rate Analysis
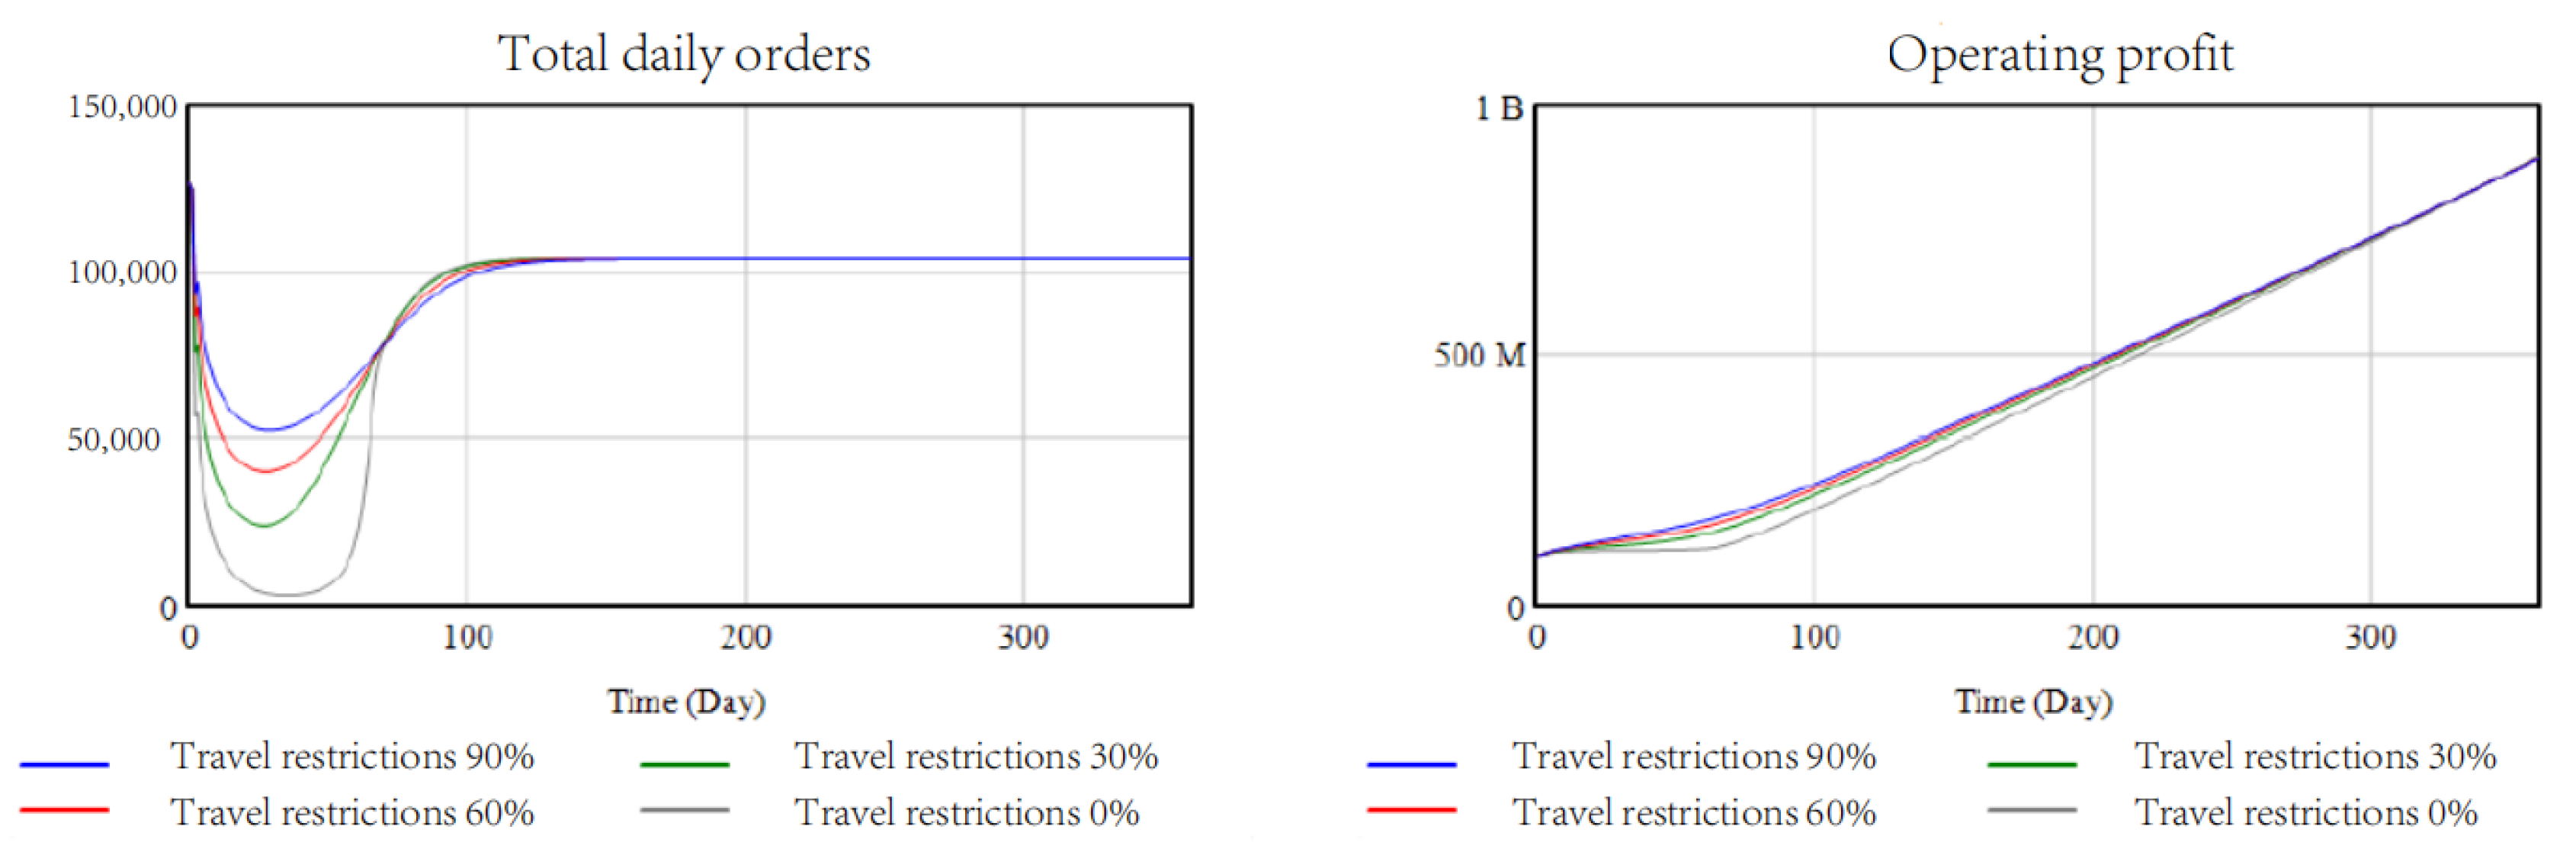
4.3.2. Travel Restriction Analysis
4.3.3. Analysis of Unit Subsidies
5. Discussion
6. Conclusions
Author Contributions
Funding
Institutional Review Board Statement
Informed Consent Statement
Data Availability Statement
Acknowledgments
Conflicts of Interest
References
- Anonymous. The General Office of the State Council issued the “Guiding Opinions on Deepening Reform and Promoting the Healthy Development of the Taxi Industry”. Urban Traffic 2016, 14, 2. [Google Scholar]
- Ulak, M.B.; Yazici, A.; Aljarrah, M. Value of convenience for taxi trips in New York City. Transp. Res. Part A Policy Prac. 2020, 142, 85–100. [Google Scholar] [CrossRef]
- Shepherd, S. A review of system dynamics models applied in transportation. Transp. B Transp. Dyn. 2014, 2, 83–105. [Google Scholar] [CrossRef] [Green Version]
- Arnott, R. Taxi Travel Should Be Subsidized. J. Urban Econ. 1996, 40, 316–333. [Google Scholar] [CrossRef]
- Lv, H. Research on Urban Passenger Taxi Pricing Based on System Dynamics; Harbin Institute of Technology: Harbin, China, 2011. [Google Scholar]
- Yue, Y. Research on Government Regulation in Nanjing Taxi Industry; Nanjing University of Aeronautics and Astronautics: Nanjing, China, 2007. [Google Scholar]
- Ji, B. Study on the Large City Taxi Demand Countermeasures and Management Mode; South China University of Technology: Guangzhou, China, 2014. [Google Scholar]
- Yang, J. The Analysis of China’s Urban Taxi Industry Characteristics and the Construction of Demand Forecast Model: The Case of Nanchang; Nanchang University: Nanchang, China, 2009. [Google Scholar]
- Beesley, G. Information for regulation: The case of taxi. Econ. J. 1983, 93, 594–615. [Google Scholar] [CrossRef]
- Abbas, K. The use of system dynamics in modeling transportation system with respect to new cities in Egypt. System 1990, 90, 17. [Google Scholar]
- Armah, F.; Yawson, D.; Pappoe, A. A systems dynamics approach to explore traffic congestion and air pollution link in the city of Accra, Ghana. Sustainability 2010, 2, 253–265. [Google Scholar] [CrossRef] [Green Version]
- Wang, Z.; Liu, X.; Zhao, Z.; Qin, Y. Passenger volume forecasting of subway stations based on system dynamics model. Logist. Technol. 2010, 219, 90–92. [Google Scholar]
- Qi, J. Research on the Evolution of Urban Traffic Mode Structure Based on System Dynamics; Southwest Jiaotong University: Chengdu, China, 2012. [Google Scholar]
- Zhang, J.; Lei, X.; Li, J. Research on building urban low-carbon transportation system based on system dynamics: Taking Zhengzhou as an example. Soft Sci. 2012, 26, 77–81. [Google Scholar]
- Sun, G.; Wang, J.; Hu, X. System dynamics model and simulation of integrated price strategies of urban public transport. J. Transp. Syst. Eng. Inf. Technol. 2010, 10, 123–127. [Google Scholar]
- Song, C.; Zhang, Y.; Jiang, L. Modeling and simulation for the development strategy of urban public transit system using system dynamics. J. Heilongjiang Inst. Technol. 2014, 28, 15–19. [Google Scholar]
- Yang, Y.; He, D.; Tong, H.; Qu, W. A system dynamic model of urban transportation for policy simulation: A case study of Beijing. Forum Sci. Technol. China 2013, 4, 28–34. [Google Scholar]
- Wang, J.; Lu, H.; Peng, H. System dynamics model of urban transportation system and its application. J. Transp. Syst. Eng. Inf. Technol. 2008, 8, 83–89. [Google Scholar] [CrossRef]
- Fan, J.; Yan, G. Simulation and control of amount of private cars in Beijing based on system dynamics. J. Highw. Transp. Res. Dev. 2009, 26, 120–125. [Google Scholar]
- Li, Z.; Hensher, D. Prospect Theoretic Contributions in Understanding Traveller Behaviour: A Review and Some Comments. Transp. Rev. 2011, 31, 97–115. [Google Scholar] [CrossRef]
- Gao, K.; Sun, L.; Yang, Y.; Meng, F.; Qu, X. Cumulative prospect theory coupled with multi-attribute decision making for modeling travel behavior. Transp. Res. Part A Policy Prac. 2021, 148, 1–21. [Google Scholar] [CrossRef]
- Brough, R.; Freedman, M.; Phillips, D. Understanding Socioeconomic Disparities in Travel Behavior during the COVID-19 Pandemic; Social Science Electronic Publishing: Rochester, NY, USA, 2021. [Google Scholar]


| Name | Causal Feedback Loop | Notes |
|---|---|---|
| B1 | Daily potential demand → daily order supply/demand ratio → unit freight change → service level → daily potential demand | the daily order supply/demand ratio can influence the demand side. The change in the daily order supply/demand ratio regulates the unit tariff and affects the service level, which feeds into the daily potential demand. |
| B2 | Daily order supply/demand ratio → unit freight change → taxi dispatch → total daily orders → daily order supply/demand ratio | The daily order supply/demand ratio can also influence the supply side; by changing the daily order supply/demand ratio, the unit freight change can be adjusted, affecting taxi operations and dispatching, thus changing the total number of daily orders. |
| B3 | Total daily orders → operating revenue → operating profit → taxi dispatching → total daily orders | The daily order supply/demand ratio also affects taxi operations and scheduling by affecting operating revenue, thus changing the total number of daily orders. |
| B4 | Total daily orders → number of people exposed to susceptible persons → infection rate → degree of spread of the epidemic → total daily orders | An increase in the total number of daily orders affects the increase in the infection rate of the epidemic, which reduces the number of taxis per day and feeds back into itself, thus changing the total number of daily orders. |
| B5 | Cumulative number of confirmed cases → Immunized → Immunization rate → Level of service → Potential daily demand → Supply and demand ratio of daily orders → Unit fare → Taxi dispatch → Total daily orders → Number of people exposed to susceptible → Transmission rate → Cumulative number of confirmed cases | by implementing a vaccine prevalence policy for the epidemic, it is possible to increase the rate of immunization of the population and the demand for travel, thus affecting the total number of daily orders, which in turn increases the number of transmissions of the epidemic, thus achieving negative feedback. |
| Variable Type | Variable Name | Value (Initial) | Formula |
|---|---|---|---|
| State variables | Immunized | 0 | = Recovered persons + vaccinated persons |
| Susceptible | 1,400,000,000 | = Total number of persons–vaccinated persons–latent persons become ill | |
| Cumulative confirmed number | 5000 | = The latent person becomes ill—the infected person recovers–the infected person dies | |
| Auxiliary variable | Recovered | - | = Cumulative number of confirmed cases × Recovery rate/Recovery period |
| Vaccinated | - | = Susceptible people × Vaccine penetration rate | |
| Latent person onset | - | = Infection rate × Cumulative number of confirmed cases × (1 − Cumulative number of confirmed cases/120,000) | |
| Degree of spread of the epidemic | - | = Contagion rate × Epidemic growth rate | |
| Number of people exposed to susceptible | - | = 10/(1 + travel restriction)/(1 + EXP(−10−5 × total number of daily orders)) | |
| Rate variable | Immunization rate | - | = Immune/(susceptible + immune) |
| Infection rate | - | = 0.1 × Number of people exposed to susceptible | |
| Epidemic growth rate | - |
= (Cumulative number of confirmed cases-DELAY1 (Cumulative number of confirmed cases, 1))/Cumulative number of confirmed cases DELAY1 = LV/delay time LV = INTEG (In-DELAY1, input×delay time) |
| Variable Type | Variable Name | Value (Initial) | Formula |
|---|---|---|---|
| Status variables | Daily potential demand | 129,600 (orders) | = Potential demand attraction − Decrease in potential demand |
| Number of taxis per day | 4300 (vehicles) | = Taxi dispatch − Reduction in taxis | |
| Unit rates | 3.6 (yuan/km) | = Unit rate changes | |
| Auxiliary variables | Potential demand attraction | - | = Daily potential demand × Service Level ×(1 − Daily potential demand/120,000) |
| Decrease in potential demand | - | = 10 × Extent of epidemic spread × Daily potential demand | |
| Taxi dispatch | - | = 70 × Trends in operating profit × Number of taxis per day × (1 − Number of taxis per day/4000) | |
| Reduction in taxis | - | = 26 × Extent of epidemic spread × Number of taxis per day | |
| Unit rate changes | - | = 0.01 × (1 − Daily order supply/demand ratio) × Unit rates × (1 − Unit rates/6) | |
| Service Level | - | = Immunization rate × Effective time ratio − Trends in unit rates | |
| Average waiting time | - | = 5 + 60 × EXP (−0.001 × Number of taxis per day) | |
| Effective time ratio | - | = Average travel time/(Average waiting time + Average travel time) | |
| Rate variables | Extent of epidemic spread | - | = Infection rate × Epidemic growth rate |
| Daily order supply/demand ratio | - | = Total daily orders/Daily potential demand | |
| Trends in operating profit | - | = (Operating profit − DELAY1 (Operating profit, 1))/Operating profit |
| Variable Type | Variable Name | Value (Initial) | Formula |
|---|---|---|---|
| Status variables | Number of taxi unit orders | 30 (orders) | = Change in unit orders |
| Operating profit | 108 (yuan) | = Operating income − depreciation costs − operating costs + government subsidies | |
| Unit freight change | 3.6 (yuan/km) | = Change in unit rates | |
| Auxiliary variables | Increase in orders | - | = 0.1 × Number of taxi unit orders × (1 − Number of taxi unit orders/26) |
| Decrease in orders | - | = 28 × Extent of spread of the epidemic × Number of taxi unit orders | |
| Operating revenue | - | = total miles operated × unit rate | |
| Operating costs | - | = total miles operated × fuel cost | |
| Depreciation cost | - | = number of taxis per day × 70 | |
| Government subsidies | - | = number of taxis per day × unit subsidy cost | |
| Total daily orders | - | = number of taxi unit orders × daily taxis | |
| Total operational mileage | - | = total number of daily orders × average distance per order |
Publisher’s Note: MDPI stays neutral with regard to jurisdictional claims in published maps and institutional affiliations. |
© 2022 by the authors. Licensee MDPI, Basel, Switzerland. This article is an open access article distributed under the terms and conditions of the Creative Commons Attribution (CC BY) license (https://creativecommons.org/licenses/by/4.0/).
Share and Cite
Yao, H.; Huang, Z.; Ye, X.; Grifoll, M.; Liu, G.; Zheng, P. Analysis of Taxi Travels during an Epidemic Period Using System Dynamics Method. Sustainability 2022, 14, 3457. https://doi.org/10.3390/su14063457
Yao H, Huang Z, Ye X, Grifoll M, Liu G, Zheng P. Analysis of Taxi Travels during an Epidemic Period Using System Dynamics Method. Sustainability. 2022; 14(6):3457. https://doi.org/10.3390/su14063457
Chicago/Turabian StyleYao, Hui, Zhengfeng Huang, Xiaofei Ye, Manel Grifoll, Guiyun Liu, and Pengjun Zheng. 2022. "Analysis of Taxi Travels during an Epidemic Period Using System Dynamics Method" Sustainability 14, no. 6: 3457. https://doi.org/10.3390/su14063457
APA StyleYao, H., Huang, Z., Ye, X., Grifoll, M., Liu, G., & Zheng, P. (2022). Analysis of Taxi Travels during an Epidemic Period Using System Dynamics Method. Sustainability, 14(6), 3457. https://doi.org/10.3390/su14063457