Article

Combined Small- and Large-Scale Geo-Spatial Analysis of the Ruhr Area for an Environmental Justice Assessment †

Geomatics Group, Faculty of Geosciences, Institute of Geography, Ruhr University Bochum, D-44870 Bochum, Germany
*
Author to whom correspondence should be addressed.
The content of this publication has not been approved by the United Nations and does not reflect the views of the United Nations or its officials or Member States.
Sustainability 2022, 14(6), 3447; https://doi.org/10.3390/su14063447
Submission received: 29 November 2021 / Revised: 7 March 2022 / Accepted: 10 March 2022 / Published: 15 March 2022

Abstract

:
This paper investigates spatial relationships regarding the accessibility of urban green space, the overall yearly vitality of the surrounding vegetation, and additional indicators such as air and noise pollution, in urban areas. The analysis uses socio-economic data sets derived from a sophisticated disaggregation approach. It results from applying a new tool that processes data from coarse and small-scale data sets to smaller spatial units in order to derive more fine-grained insights into the characteristics of the smallest suburb. The consequent data sets are then augmented by comprehensive raster-based accessibility network analysis and the incorporation of measured data on air and noise pollution. Gaining an overview over the whole area on the one hand, and looking at smaller city districts in detail on the other, unveils whether there is an imbalance regarding all combined indicators. After correlating two socio-economic indicators, a spatial comparison of the preliminary results determines whether this approach reveals neighborhoods wherein residents of a lower socio-economic status are exposed to multiple threats at once. As a result, the paper presents a workflow to obtain a broader and, at the same time, more small-scale overview of polycentric agglomeration. Simultaneously, it provides a large-scale insight into single sites, right down to the city block level. Consequently, this study provides a sophisticated approach that helps to assess the quality, quantity and characteristics of the specific spatial distribution of environmental justice in small- to large-scale urban areas at a glance. The results help to identify regions of inequalities and disadvantages. They allow for querying additional values assigned to large-scale spatial units. These versatile variables provide a means to reveal other noticeable indicators. Furthermore, this entails the opportunity to evaluate the distinct living conditions of locally affected demographic groups, and improve them with tailored approaches. Finally, the results can enhance the perception of these living conditions, and be used to promote the capacity for organizing the lives of the respective residents more sustainably, helping the neighborhood to grow accordingly.

1. Environmental Justice and Sustainability

The importance of environmental justice for the (e)quality of living conditions in specific urban areas has become increasingly evident over the past few years [1,2,3,4]. Discussions of factors such as gender, heritage, skin color, income gaps and their effects on the location of residential homes in a city, are as inevitable in our modern society as the broad discussions about climate change, energy consumption and sustainability [5,6,7,8]. Numerous studies have investigated the effectss of the factors mentioned above on the living conditions within the whole area of a certain city; for example, in Germany, Raddatz and Mennis [9] undertook such research in 2013 for the city of Hamburg, or (as one among many) Klimeczek [10], who in 2014 studied the city of Berlin. Others have also undertaken this research in many other cities around the world (e.g., [11,12,13,14]). The spatial subject of investigation in those studies almost always focused on the distinct distribution of different environmental factors in a city—the composition of common threats and opportunities, plus the socio-economic and socio-demographic structure of local inhabitation.
The primary goal of the studies mentioned above was to identify specific groups within the urban population that suffer from more threats than others, or whether they have better access to positively connoted areas (such as urban greenery) and whether there is a correlation to be identified. These studies aimed to depict patterns in areas of various sizes, depending on the spatial resolution, wherein disadvantages are primarily incurred by those people with a lower socio-economic status. By doing so, they mostly focus specifically on analyzing individual cities, and not on polycentric agglomerations such as the Ruhr area. The Ruhr area covers more than one big city. Hence, it also includes the transient and partly rural areas between cities. With this heterogenic appearance, it is a suitable subject for the study at hand.
It must be stated that this study is not the first to somehow assess the distribution of environmental justice in the Ruhr area. Yet, the other examinations—with the ZUKUR project [15] leading the way—focused on the overall prospects, and determined a huge variety of different means and their allocations, via an analytical approach. This study describes the situation of one particular area in a chosen quarter (e.g., Dortmund Marten [16]) or city (e.g., Bottrop [15]) within the Ruhr area (see also [17]), but does not necessarily build a model that covers the Ruhr area as a whole. As the Ruhr area tries to shift its reputation from a region that is composed of many solitary cities to a coherent urban matrix (henceforth referred to as “Metropole Ruhr”, in place of “the polycentric agglomeration of the Ruhr area”; see Figure 1 and see also [18]), it is becoming more and more feasible to undertake analyses—such as in this study—that do not try to focus on only one particular part of the Metropole Ruhr, but instead incorporate the whole of the region.
As expected, this approach can help to understand the relationships between particular areas within the Metropole Ruhr that are far away from each other, but still connected via the boundaries of the conurbation. This approach can be transferred to various other conurbations, such as the Guadalajara Metropolitan Area in Mexico, or the Tokaido corridor in Japan, which are two other research areas where we might implement the following workflow [22].
The link between environmental justice and sustainability issues has been proven in a huge variety of studies (e.g., [5,6,7,23,24,25]). All of them point out that the issue of environmental quality, and hence the presence of a sustainable maxim, is inextricably linked to human equality at all scales [26]. These findings are clearly visible when looking at countries with more equal income distributions, greater civil liberties and more political rights, which tend to have a significantly higher environmental quality [7,23,27,28]. This gives us reason to assume that improvements in human equality—especially in urban areas—can and will also improve the perception of environmental issues by residents, which will thus mean a more sustainable and climate-friendly approach to the development of particular city quarters in the future.
To date, in the Metropole Ruhr, several attempts have been made at the targeted promotion of urban development within the context of sustainability [29,30,31]. Nearly all of them very have clearly considered that one of the most important aspects is always the social one, along with the circumstances that distinguish one city block, district or quarter from another. This is because the sustainability of these resource-intensive cities is always subject to socio-economic and environmental changes [26].
Around the world, urban planning processes are increasingly being linked to the 17 Sustainable Development Goals (SDGs) (see Figure 2), all of which aspire towards environmental justice [32]. That said, some still view this rather critically [33]. For this paper, SDGs three (good health and well-being) and eleven (sustainable cities and communities) are the focus, and provide the topic for the evaluation of the results. This is accompanied by a visual comparison of different areas within the Metropole Ruhr, intended to emphasize the huge differences that still occur in its urban regions by also pointing out the areas at the center of huge gaps in terms of equitable living conditions. Beneficiaries of this could include urban planners, political decision-makers and promoters of further studies, who can align their results and objectives to the respective situations in each area, while also being able to adjust this preliminary data to their very own needs.
This study investigates the current situation in the Ruhr area regarding the place of residence of people with different socio-economic statuses, respective levels of accessibility to urban greener (and its vitality [35]), threats such as air and noise pollution, and resulting inequalities. This is conducted via two steps. First, an overall image of this complex and eclectic conurbation is drawn out, putting the environmental factors and threats mentioned above together into a multilayer dataset to highlight regions of accumulated disadvantages.
This is followed by a much more detailed analysis, which provides the opportunity to zoom in to the city block level and freely examine specific large-scale areas of a city, or spaces in between two cities, and inquire as to the respective values of an individual city block. If this dataset can be created while incorporating all those different factors, this study might help to establish a certain workflow that enables a far more detailed evaluation of certain areas than has been possible before. The spatial resolution of the dataset used in this study exceeds that of all others, and all the features yield individual values that can help to quantify and compare even the smallest city block.

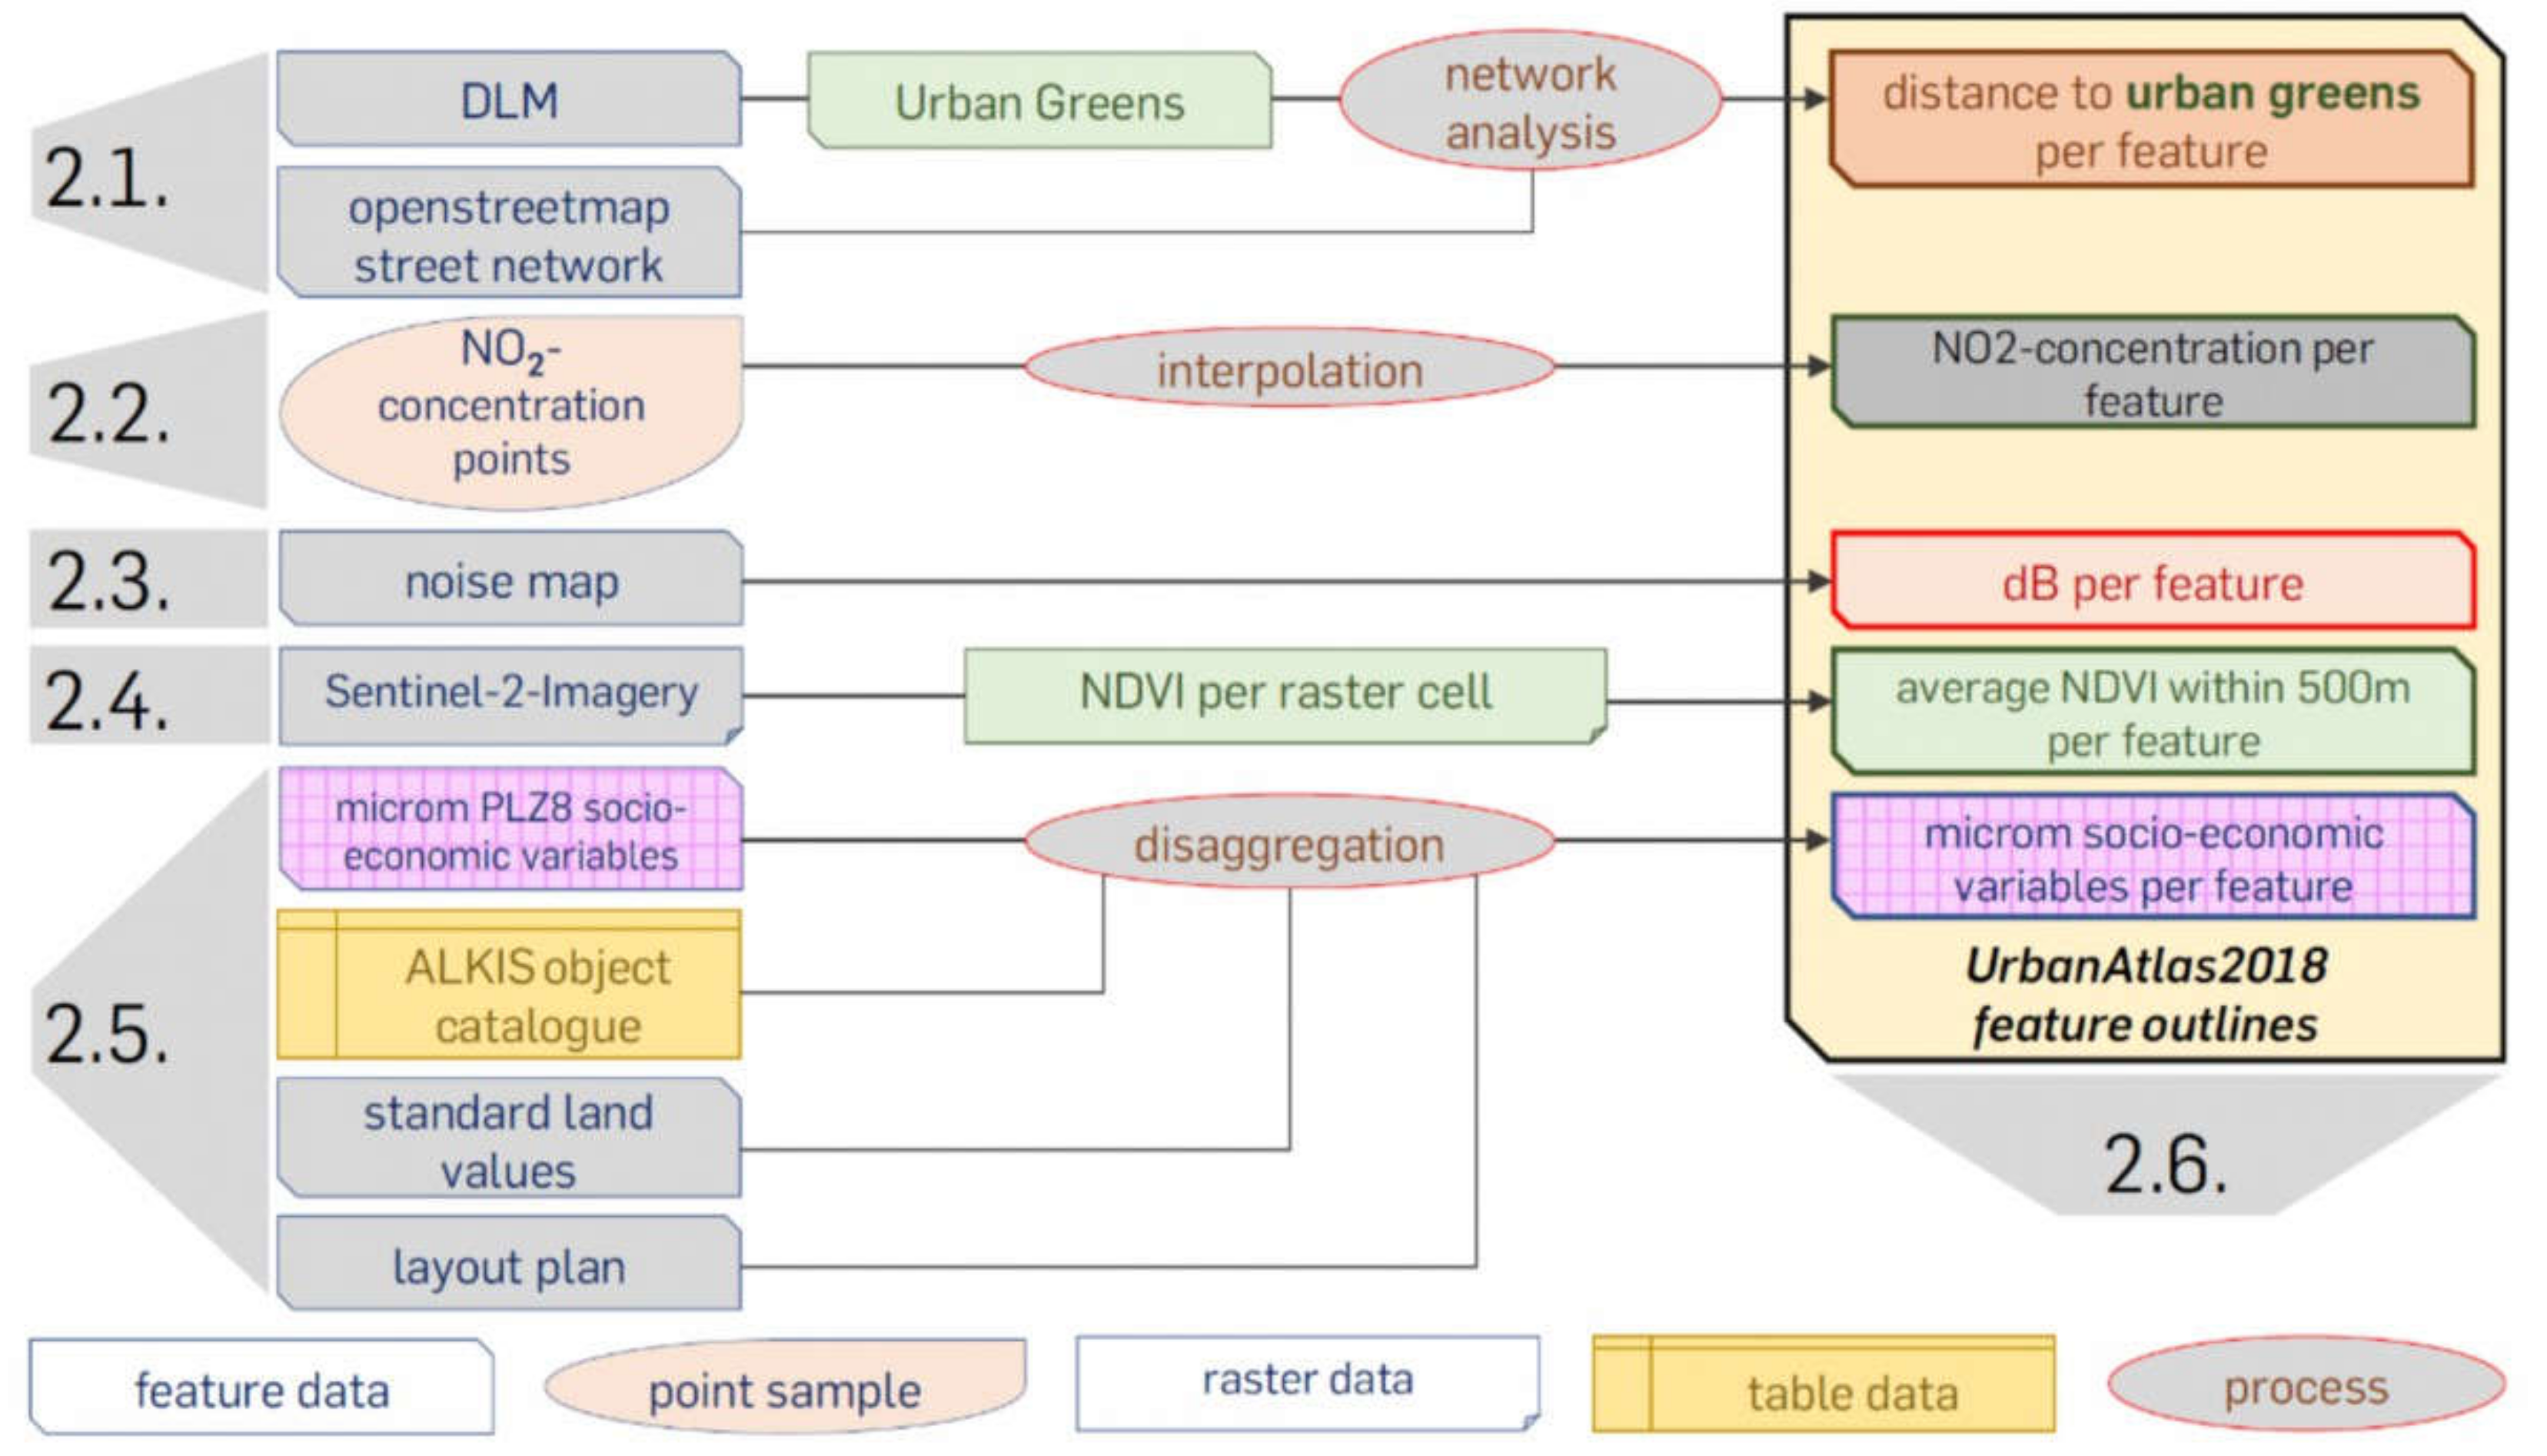
2. Materials and Methods

In the area of the Metropole Ruhr, the focus here is on the accessibility of urban greenery, the mean yearly concentration of nitrogen dioxide (NO2), the exposure to noise, and the average yearly vitality of the vegetation within a determined radius [15,36]. These factors are spatially matched with the socio-economic conditions in regions of accumulated disadvantages or imbalances. All the datasets that are required for the analyses conducted in this study are shown in Table 1.
After the processing of all required datasets via geo-spatial analyses using a geographic information system (GIS), they are combined into one general set. This comprehensive dataset includes all parameters and sums them up into one final index parameter. The latter allows us to reveal hot spots of inequality, where two or more threats are present in a single city block.
The class Urban Fabric of the UrbanAtlas2018 [42] is used as the main spatial reference to which all different attributes and respective values are related. It is the class representing the residential areas in city blocks (including mixed-use and hostels). After extracting these from the entire UrbanAtlas2018 dataset, they are validated using the footprints of houses within the digital landscape model (DLM, [43]). Here, all buildings inside a respective city block feature are attributed their actual type of use. Consequently, some urban fabric features containing houses that are officially not of residential use can be removed from the whole urban fabric class, as the DLM data in this case are official and thus more reliable. All resulting individual values for the chosen parameters in this analysis are stored in the final dataset of UrbanAtlas2018 city blocks to provide maximal comparability between all the features.
The socio-economic variables are delivered by PLZ8 polygons. They are based on postal code features, which have a significantly larger spatial extent than the city block features of the UrbanAtlas2018. To incorporate these numbers into the smaller city block features, they need to be disaggregated first. This is conducted as part of an automated process, facilitated by the tool built by Burian et al. 2021 [44]. In the end, all city block features obtain an individual value for each of the attributes of the PLZ8 dataset. This allows us to apply correlation to identify places of accumulated disadvantage for residents of certain socio-economic statuses on a large scale.

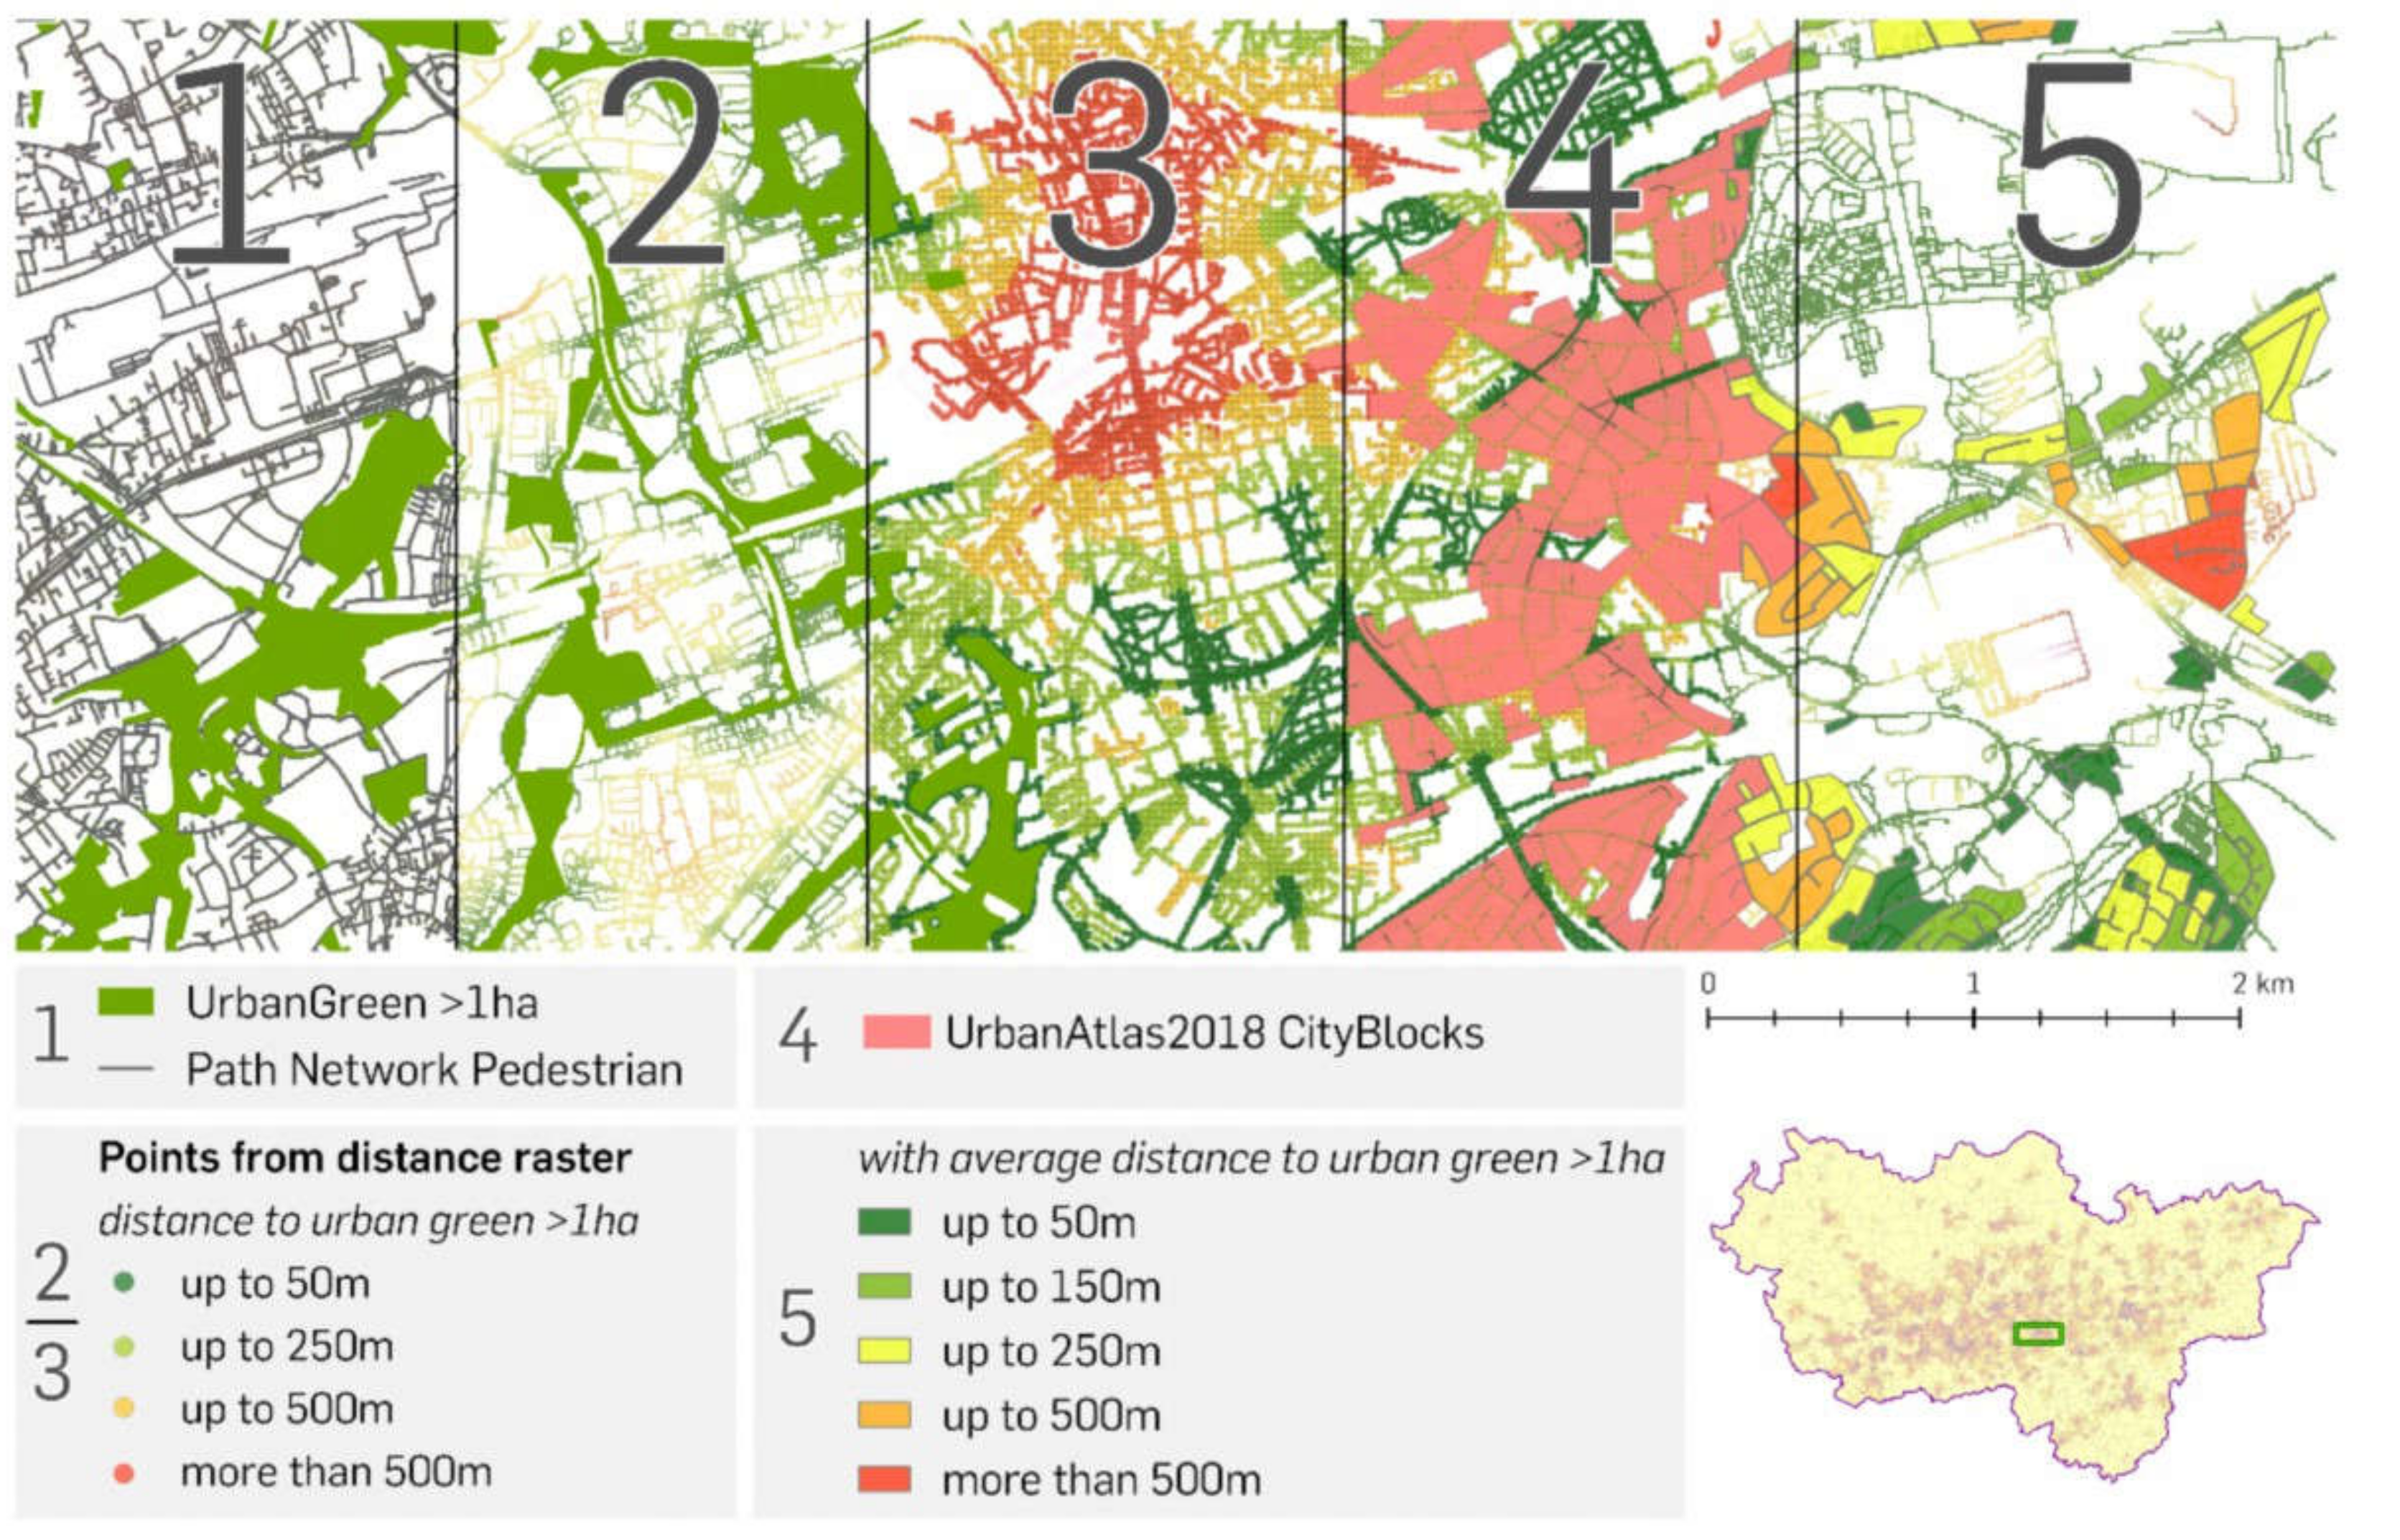
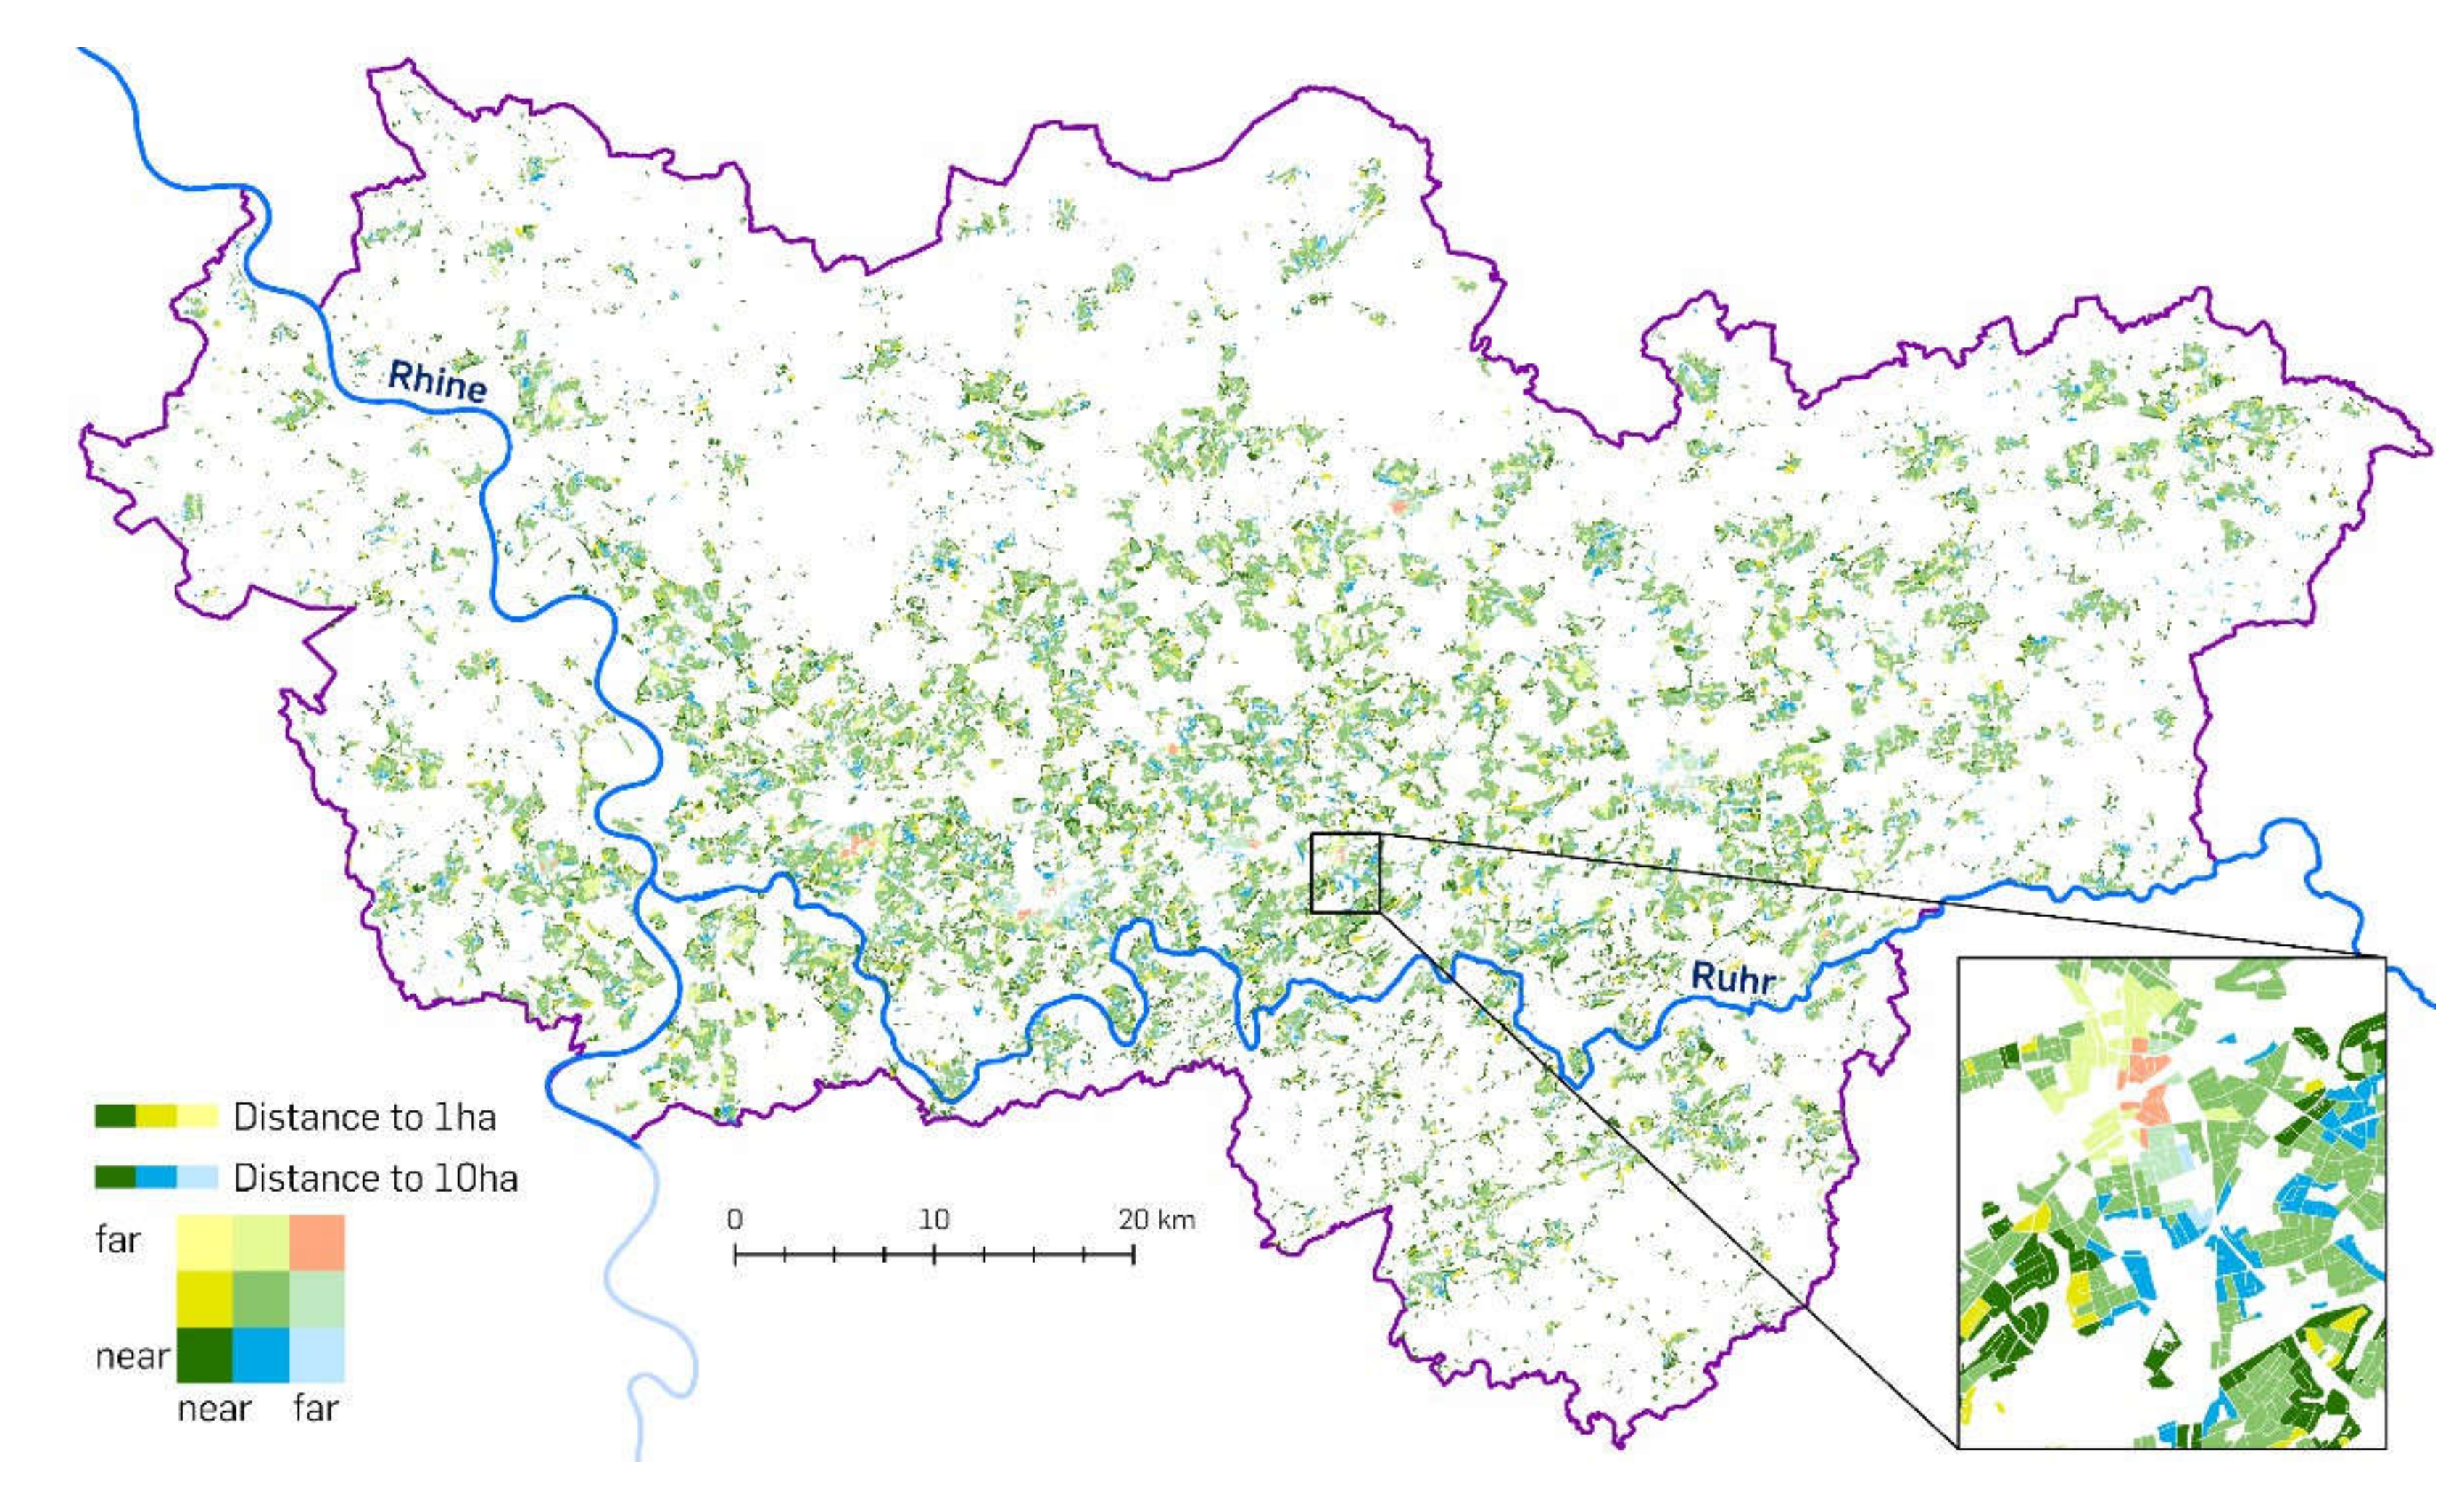
2.1. Urban Green Network Analysis Layer

Numerous studies have investigated the accessibility of urban greenery within different contexts (e.g., [45,46,47,48,49]), using different approaches to defining the minimum sizes of the target areas and the maximum distances between them. For the urban greenery analysis in this study, the limiting values have been taken from the requirements of the framework of the ZUKUR project [15], providing the possibility of embedding the results into further local studies. The values rely on the conclusions of several studies, such as the ones by Richter et al. in 2016 [50] and Grunewald et al. in 2017 [51]. Here, urban greenery is categorized as recreational areas (larger than 1 ha) or larger urban green spaces (exceeding 10 ha). To count as accessible, recreational areas must be within a distance of 300 m (Euclidean) or 500 m (actual walking distance in the network), while distances of 700 m (Euclidean) and 1000 m (actual walking distance) apply for the larger urban green spaces.
A raster-based path distance analysis is here conducted, taking into account a street network for pedestrians [37], using a filtered land use mapping dataset [52]. This is used to calculate the distance to the next urban green space for each pixel (see Figure 3; Section 1 and Section 2). In this case, the calculations are based on a raster surface that is defined by the street network dataset. Conversion into a raster dataset must be done first. Following this, for each raster cell in the network, the smallest cumulative cost distance from or to the nearest source polygon (urban greens) is calculated, along with horizontal, vertical and transversal cost factors through respective raster cells.
In the next step, all raster cells are converted to point features possessing distance values (Figure 3; Section 3). They are spatially joined to the city block features of the UrbanAtlas2018 dataset [39] as the central value store, using the mean values of all points intersecting within a polygon (Figure 3; Section 4 and Section 5). This calculation chain is repeated for the larger urban green spaces to eventually derive two new values for each city block feature, containing information about the walking distance to each of the two urban greenery types.
For the assessment of environmental justice, it is necessary to know whether urban green spaces are within walking distance (500 m/1000 m). Therefore, all city blocks are split into two groups by thresholding each value accordingly (see Figure 4, red for both urban green spaces beyond the threshold distance).

2.2. Areal Interpolation of Mean Annual NO2-Concentrations

The mean NO2 concentration is understood as one possible proxy for the local degree of air pollution. It is used as a second attribute (or threat), while data from the surveillance measuring network for air quality (LUQS, in accord with [53]) are used to calculate a suitable dataset for this study. There are several approaches, parameters and pollutants that may be used to assess the air pollution in a particular area (e.g., [54,55,56]). All of them have their pros and cons. However, since the acquisition of measurement values for this study area with enough samples is a challenge that can be satisfactorily met for the NO2 concentration, and since NO2 is one of the most common proxies (alongside fine particulate matter in PM2,5 to PM10 concentrations) for the estimation of air pollution [11,12,53], in this study, the NO2 concentration is used to judge air pollution.
An applied threshold of 30 µg/m3 is chosen to distinguish areas of acceptable concentrations below and unacceptable concentrations above this threshold. Many other studies use 40 µg/m3, since it is recommended in various places [12,54,57]. This study follows the recommendation of the WHO to adjust the threshold to 30 µg/m3 [58], as it is not ultimately evident that health issues do not also occur at lower NO2 concentrations.
The measured data have been obtained from opengeodata.nrw.de [38] (accessed on 30 April 2020), while the interpolation is conducted using the Inverse Distance Weight algorithm (IDW). This produces the best results in cases of unevenly distributed measurements, without using complex interpolation models [59,60,61]. After the interpolation, the raster values are split up again into two respective groups (see Figure 5). To incorporate the threshold values and groups into the city blocks that already possess information about the accessibility of urban greenery, the final step is to convert the raster into a point feature class and spatially join them with the city blocks.

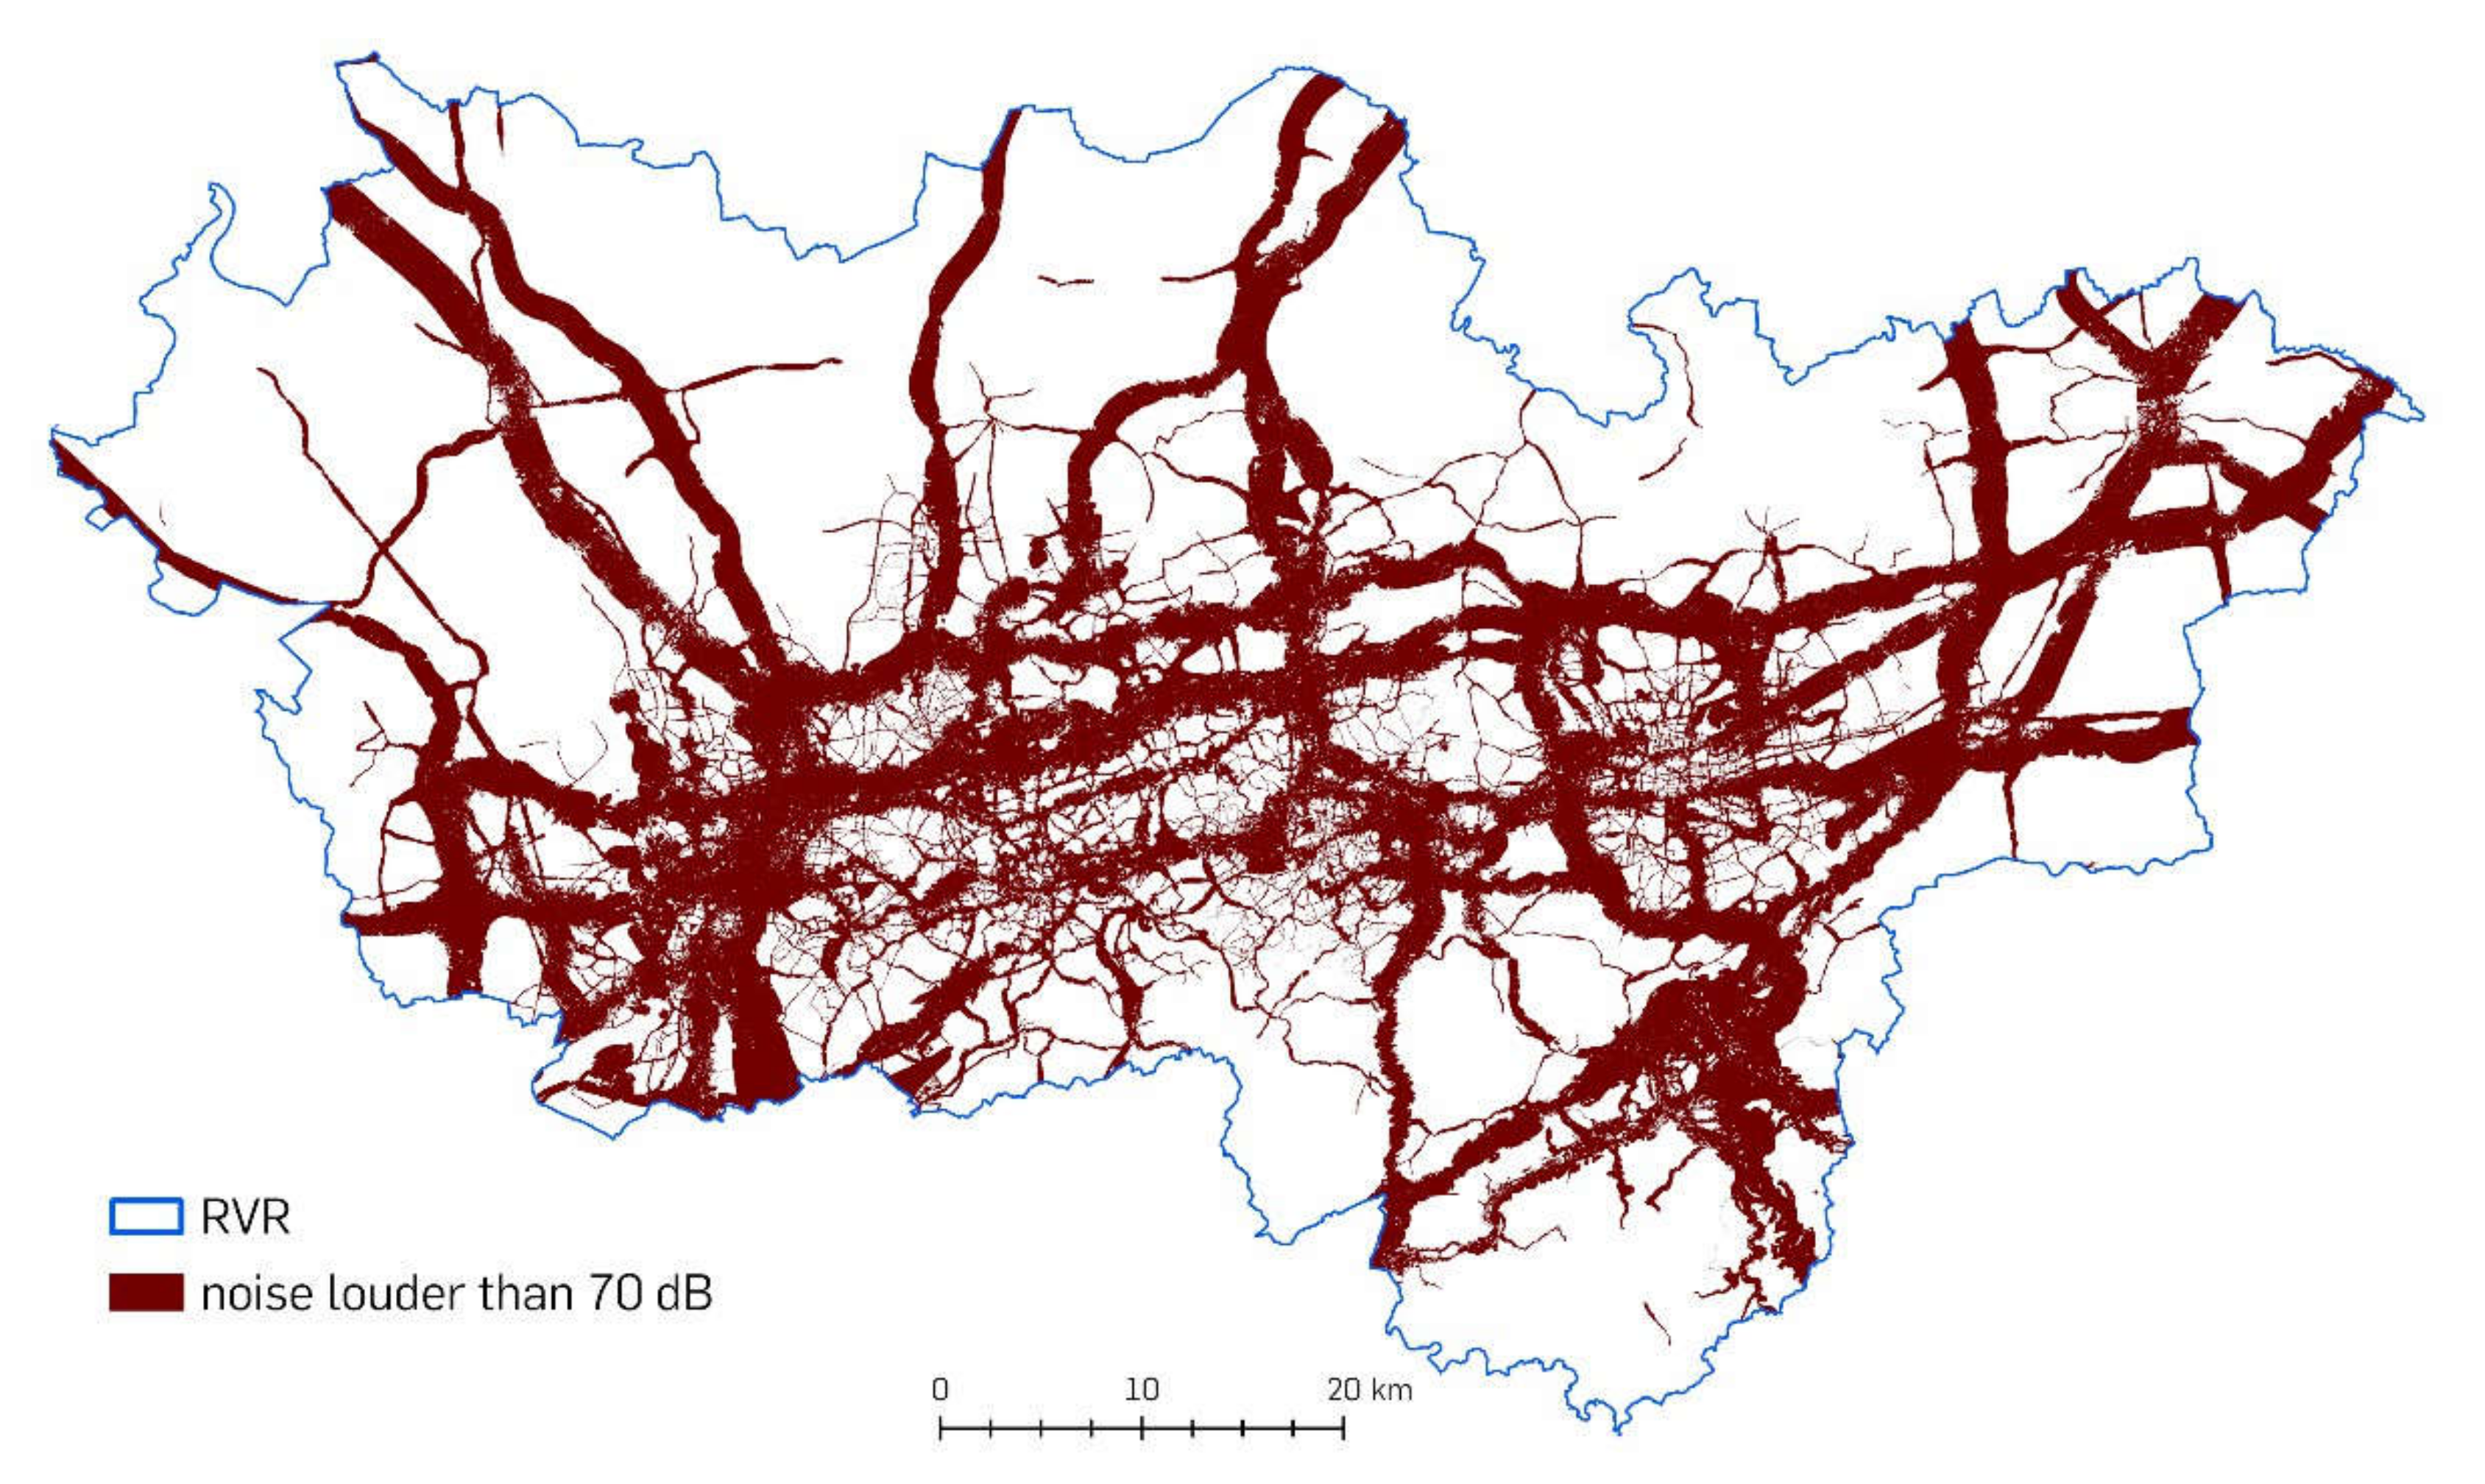
2.3. Noise Exposure Measurements

The third factor in this analysis is noise pollution. A lot of studies dealing with issues in the context of environmental justice state that the maximum noise that can still be considered below an environmental threat is 70 dB [15,62,63]. The German Ministry for Consumer Protection assesses the noise pollution [40] in Germany, while data from outside of city centers can be obtained from certain web portals that are maintained by the respective cites or municipalities. The acquisition of an overall dataset that also includes city centers can be crucial, as a lot of the cities and municipalities do not provide their data freely. As it is of major interest that all datasets be produced by the same monitoring technique, in order to have reliable, consistent and comparable values, for this study, noise data were requested from LANUV (State Agency for Nature, Environment and Consumer Protection).
The datasets distinguish between several different noise sources, such as roads, railroads, trams, airplanes, airports and industry. All the different noise sources are placed in separate datasets for day- and nighttime. For this analysis, all sources are consolidated into one common dataset and filtered to only cover areas where the maximum volume exceeds 70 dB (see Figure 6). This dataset is processed again into an area-wide raster dataset, and then spatially joined with the already existing city block features.

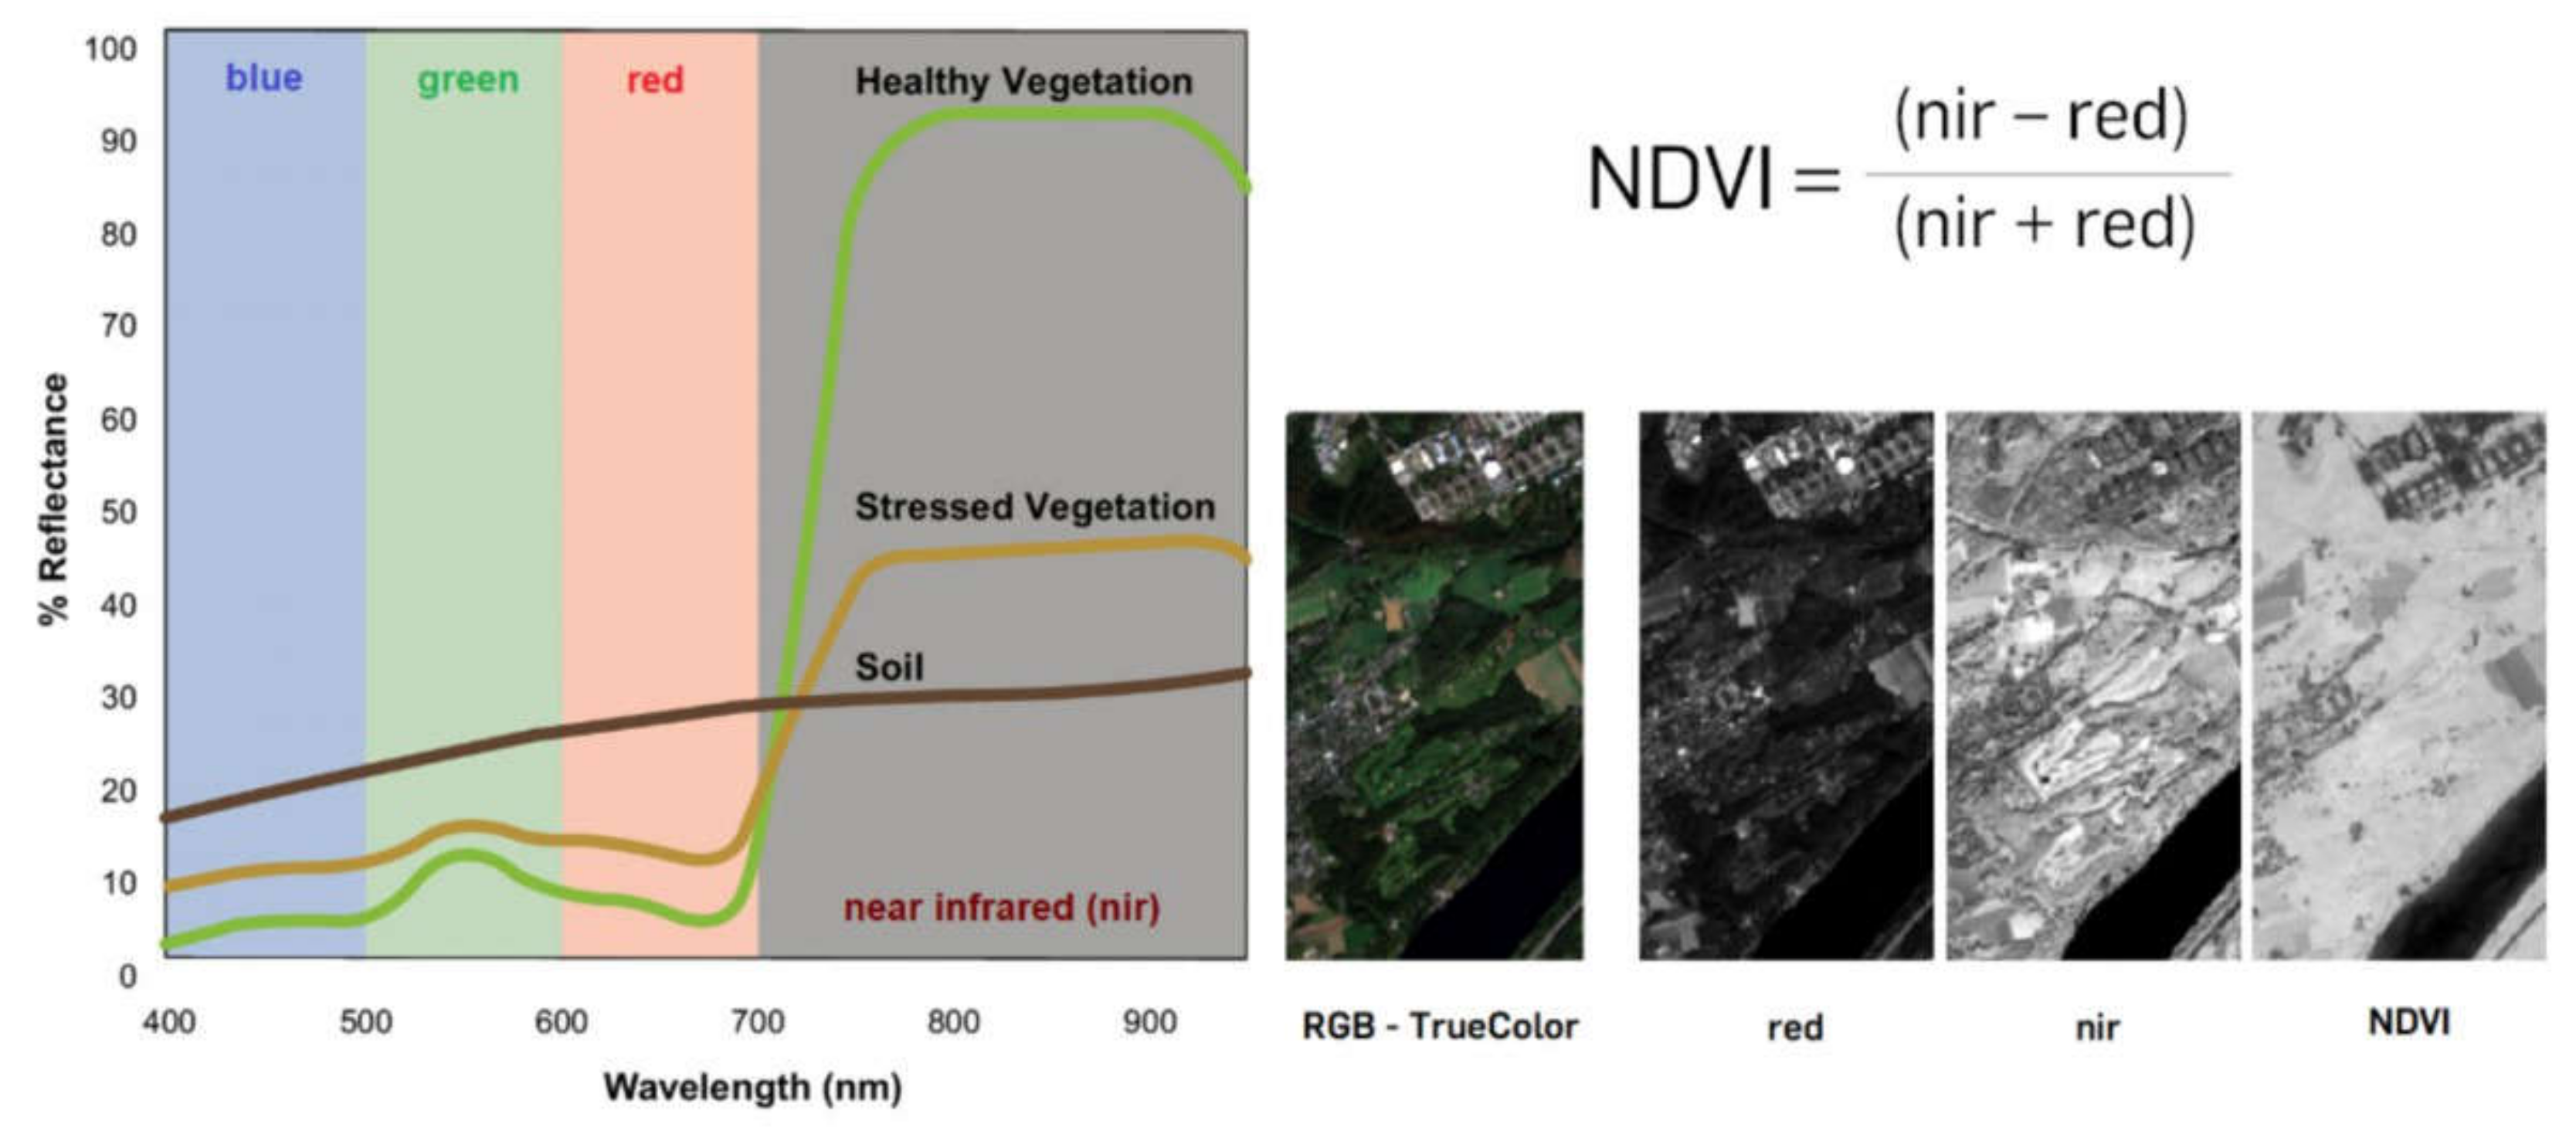
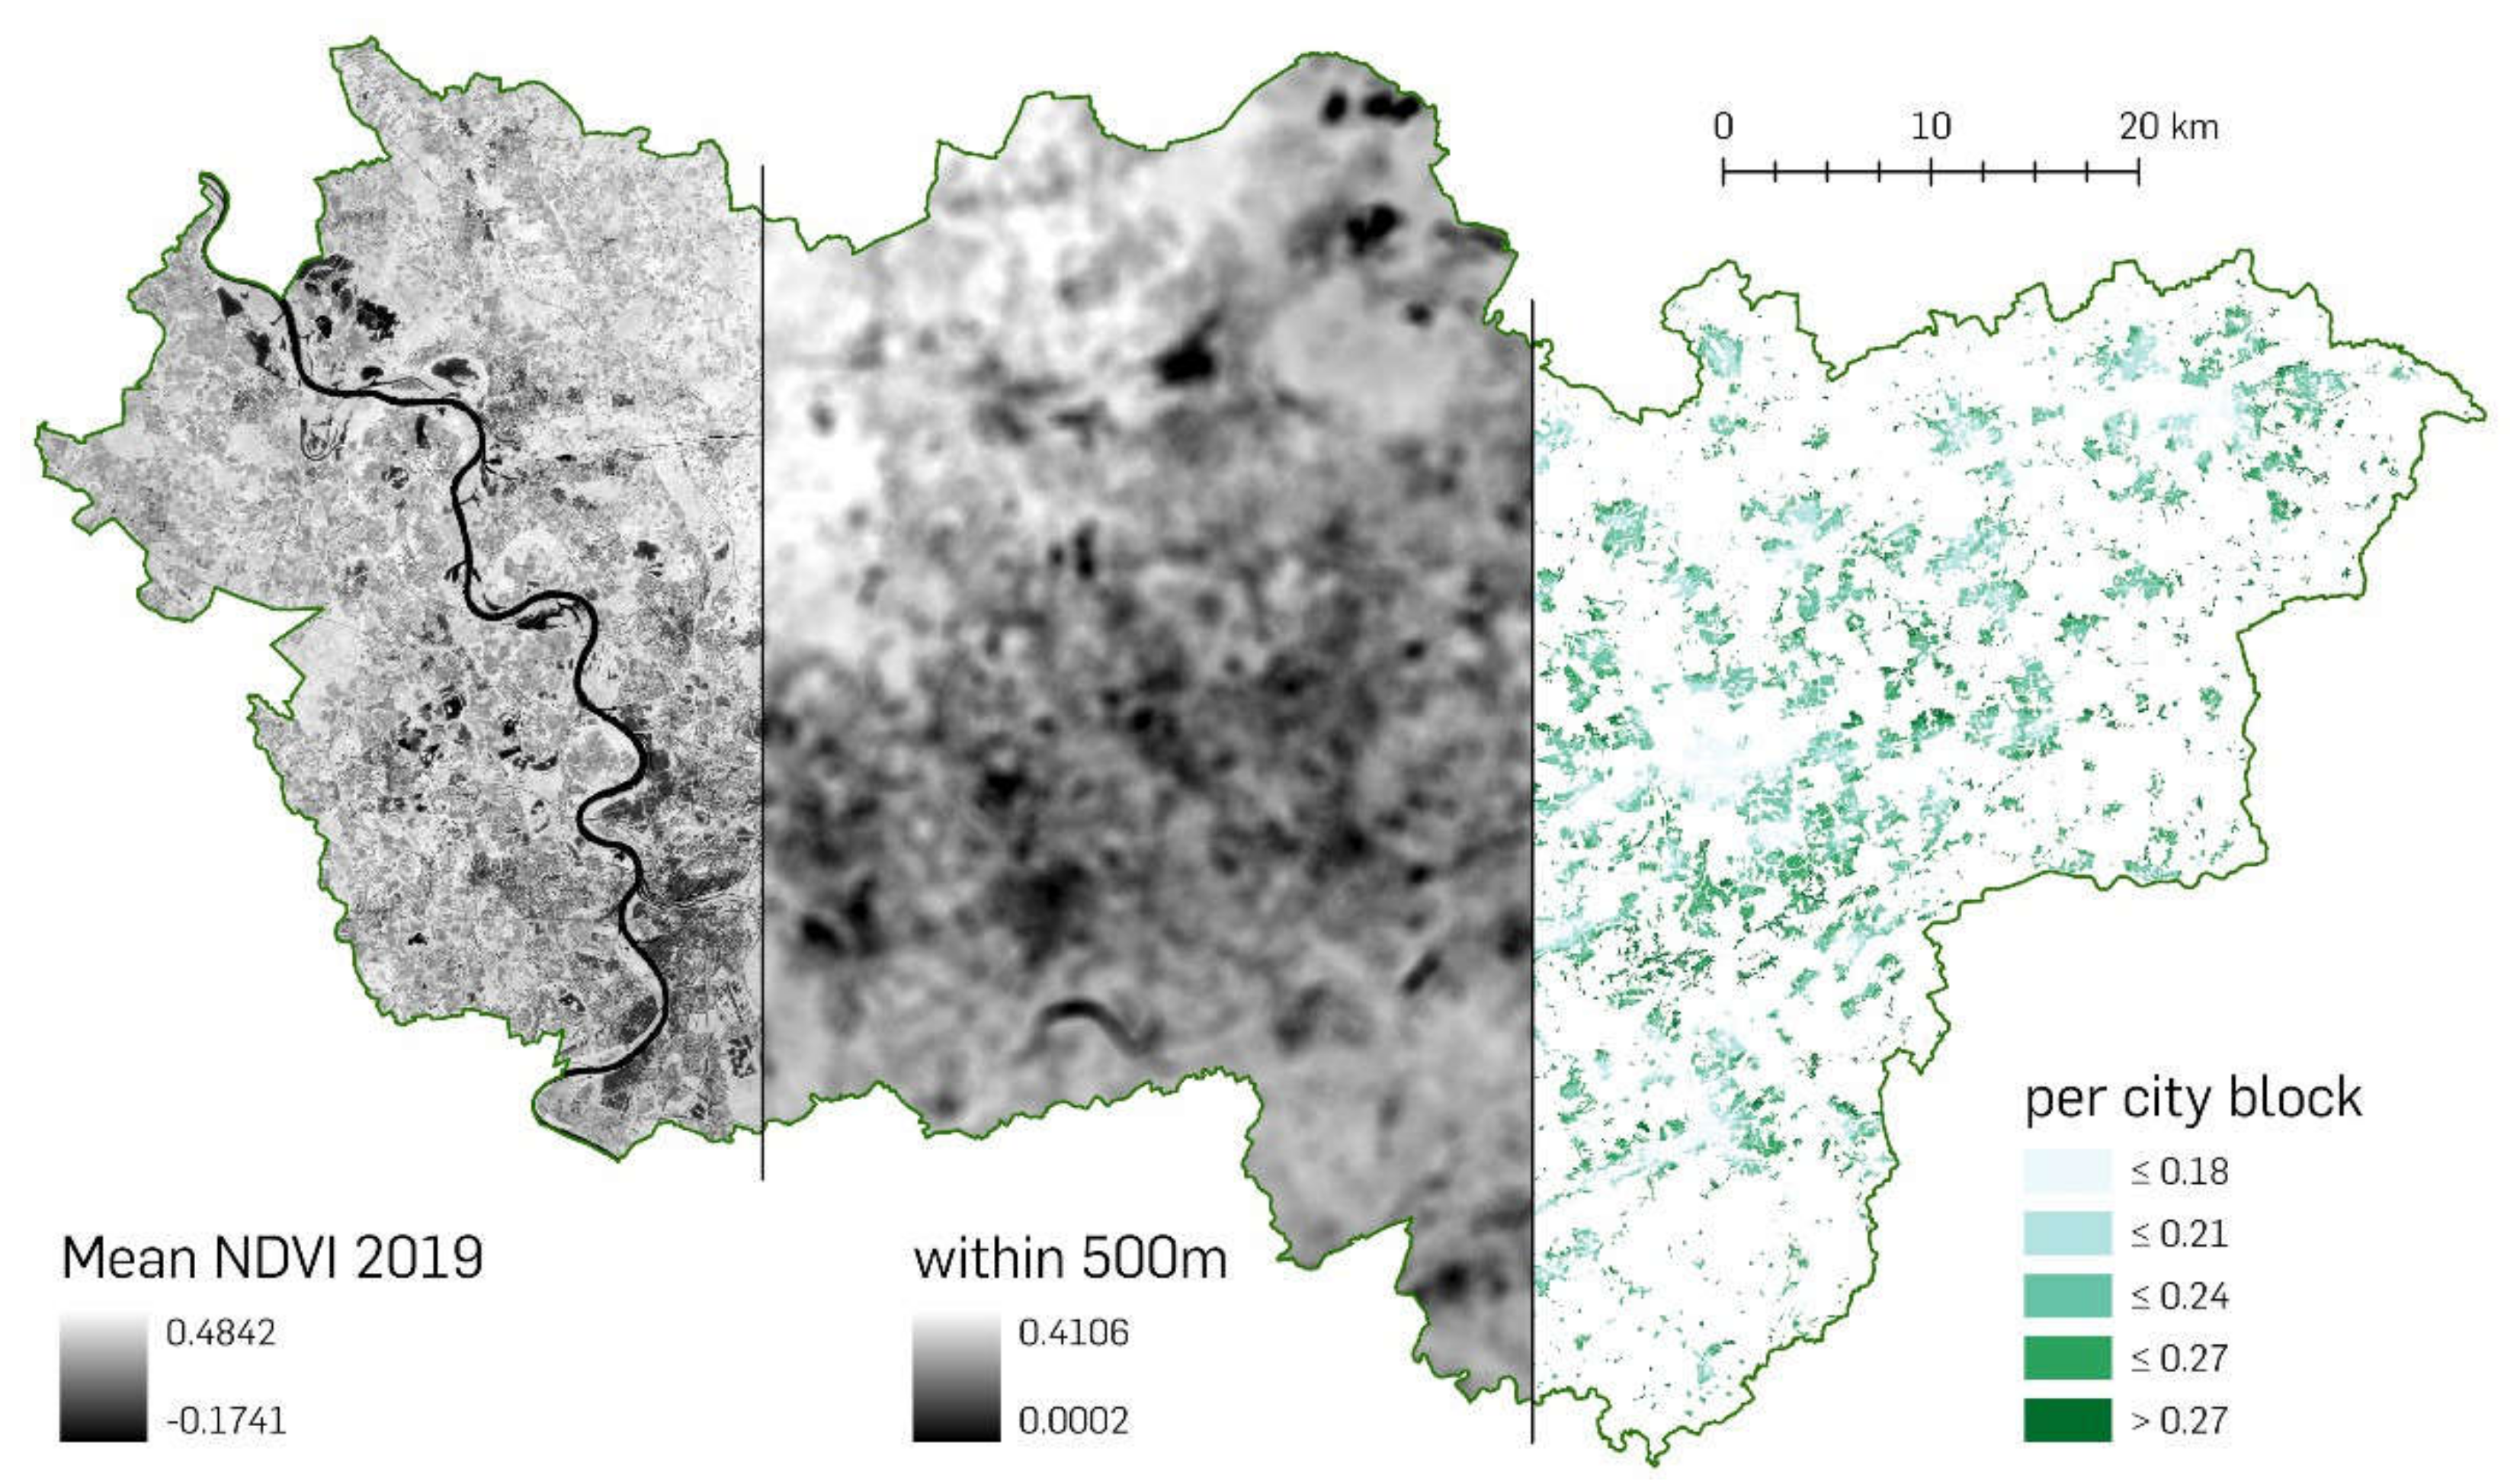
2.4. Average Annual NDVI within 500 m

As a dataset for the secondary evaluation, the average annual NDVI within 500 meters is calculated for every city block. This calculation is based upon two spectral bands, red and near infrared (nir), of a satellite image, and hence gives an index value for the vitality of the vegetation [35,64,65] (see Figure 7).
This can help us in rating the quality and vitality of the vegetation over, for example, a whole year. To obtain the respective data, the Google Earth Engine offers a shortcut solution, since here, more than 30 petabytes of data can be queried and processed at the backend via a JavaScript based code [67]. Using this, the whole collection of Sentinel-2 imagery is filtered and selected, clouds are masked, and an area-covering image for the study area is automatically mosaicked from hundreds of individual images.
For this study, the mean values for each cloud-free raster cell and for all spectral bands within the period of the whole of 2019 are calculated and processed into one final image. The resulting image can be used to calculate the NDVI via the mentioned formula (see Figure 7).
The resulting NDVI image is used to calculate zonal statistics for each output raster cell. Therefore, the values of surrounding raster cells within 500 m of each pixel are averaged and written onto the respective raster cell in the final image. This image again depicts NDVI values, but here, these values do not represent the location of the raster cell itself, but the mean value of the neighborhood within a 500-m distance.
In the final step, these values are incorporated into the city blocks of the UrbanAtlas2018 by converting the raster cells into points and spatially joining them with all respective features, using the local mean value (see Figure 8).

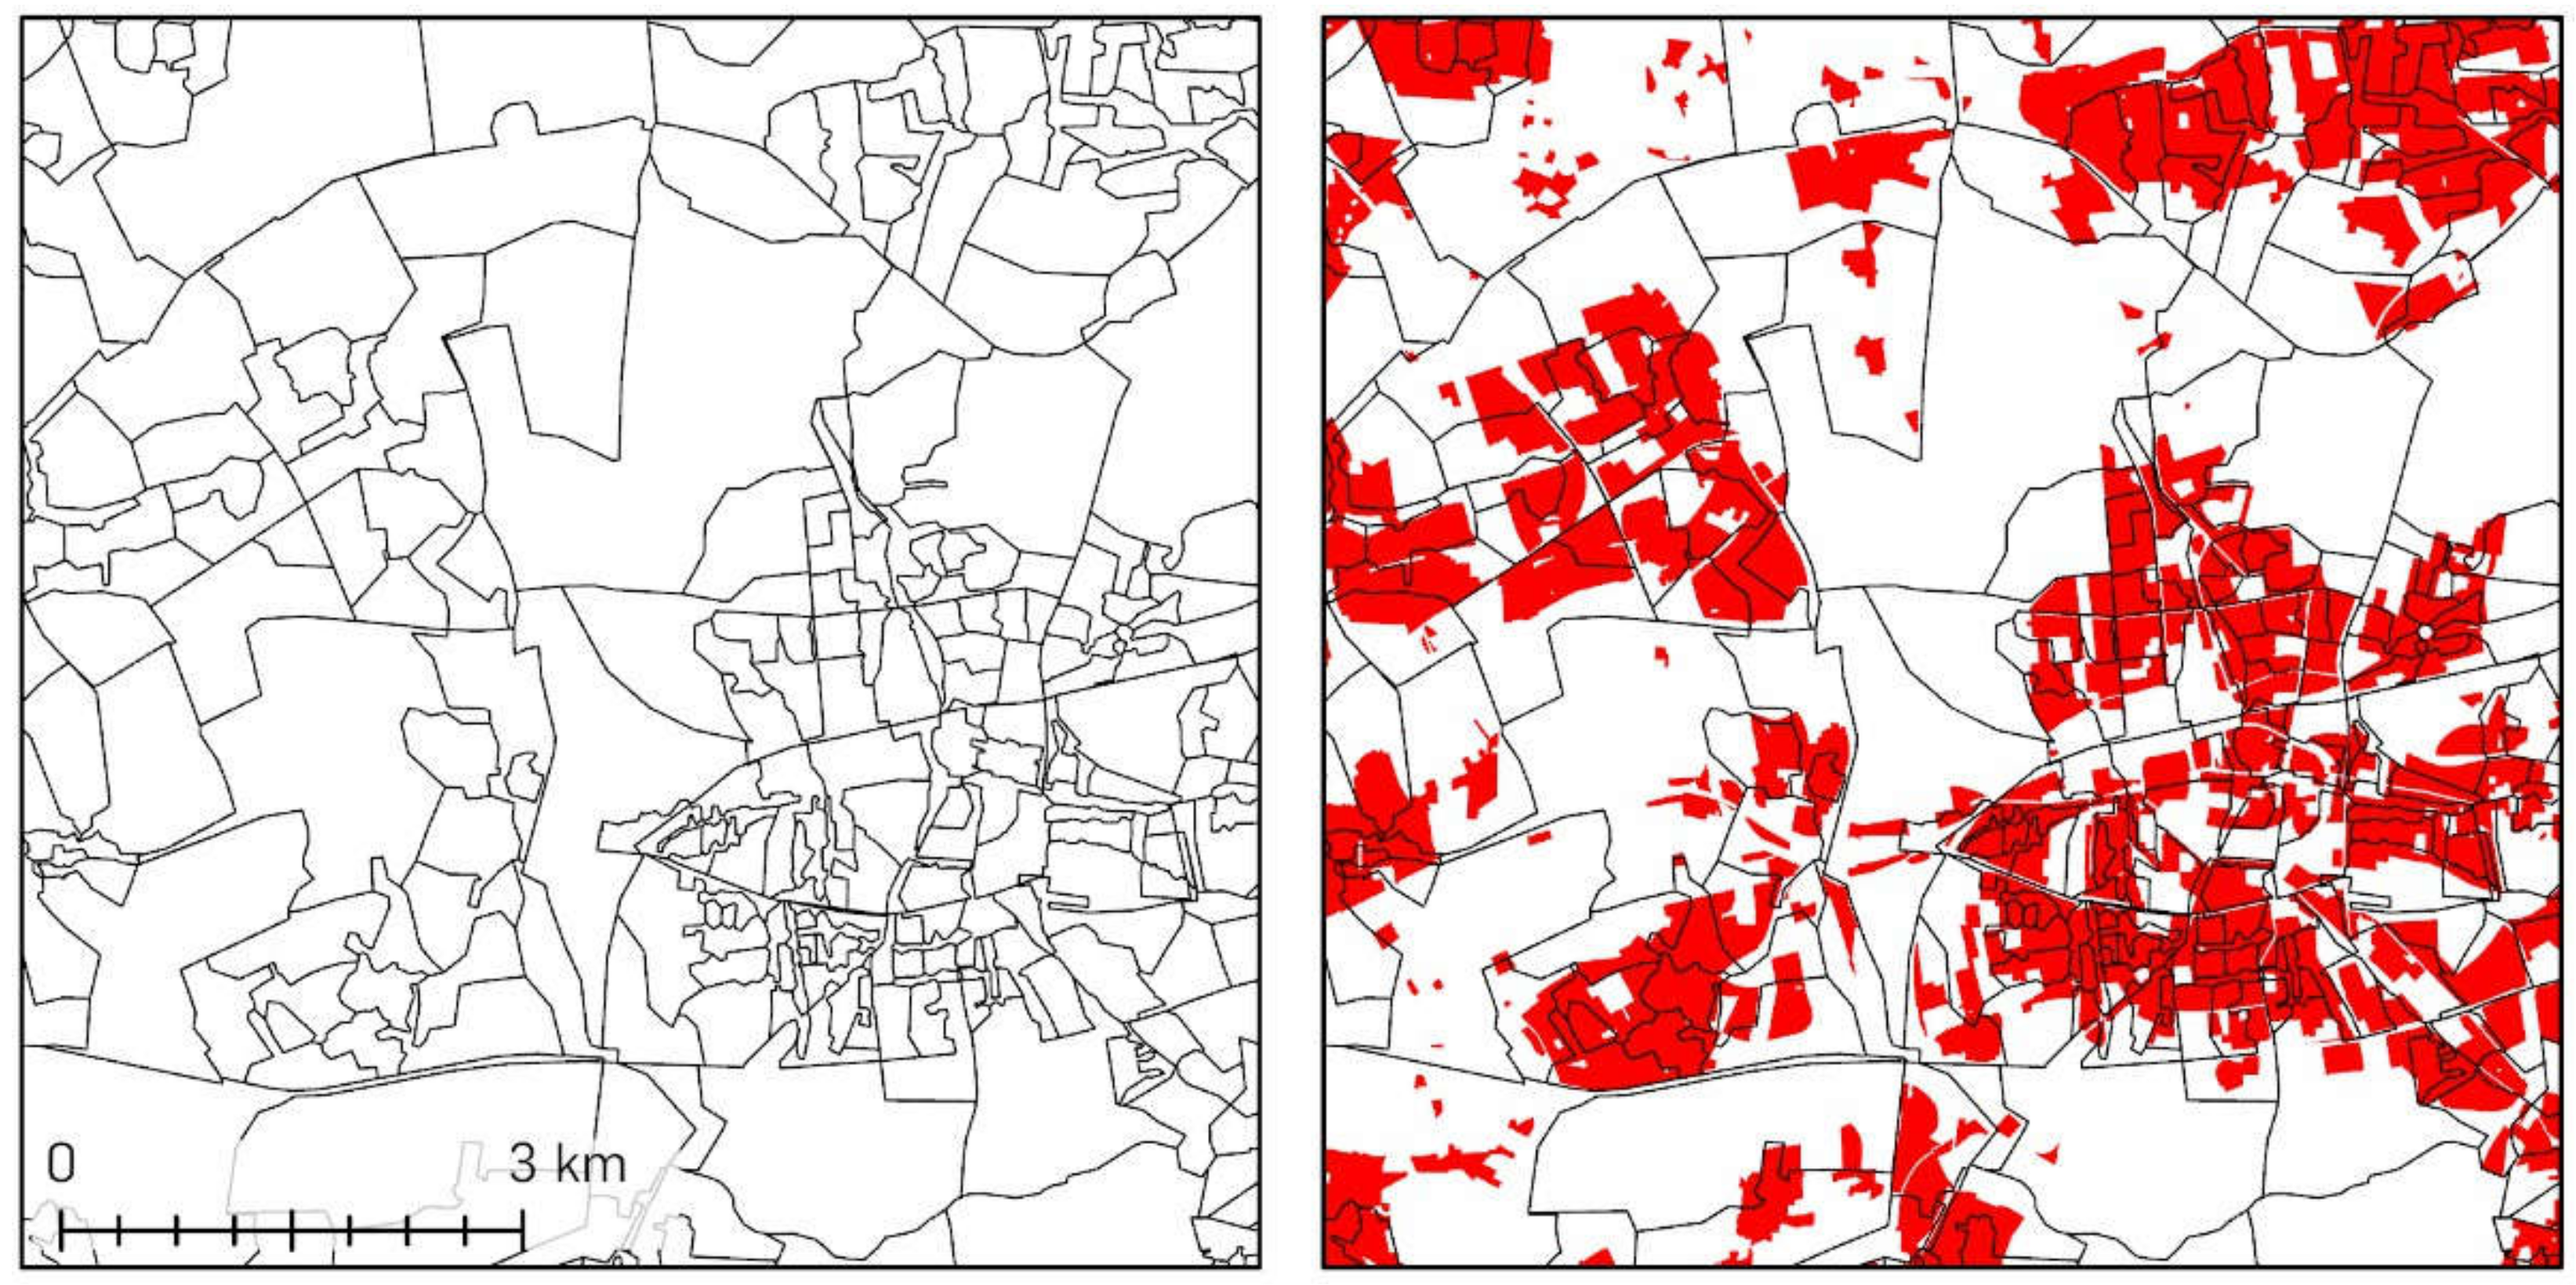
2.5. Disaggregator and Socio-Economic Variables

Another set of values that is incorporated into the city block features of UrbanAtlas2018 is the socio-economic variables from microm [20,68]. As these are individually stored in matching PLZ8-features, which are based on the sublevels of regular postal code areas [19] and hence are area-wide and gapless, these values need to be recalculated and transferred into smaller city blocks via spatial disaggregation. Depending on the approach used, spatial disaggregation can be a highly complex process, given the specific requirements of each technique that may be applied [8].
The whole workflow aims to distribute data from larger units (source zones) to smaller units (target zones), as shown in Figure 9.
There are many ways to do this, from a simple area-weighted solution to a three-class dasymetric mapping approach, which has turned out to be the most accurate in numerous studies (e.g., [69,70,71]). Usually, the dasymetric mapping approach is carried out manually in several different steps, of which the most crucial is the hierarchization of the target zones in order to parametrize the distribution from source zones. The more extensively a building is used as a residential home, and the more space it provides for this purpose, the higher its respective rank, and the greater the number of inhabitants that will be disaggregated into the overlaying target zone. Burian et al. developed and evaluated a disaggregation tool in 2021 [44] that was able to conduct all these other calculations in one procedure. To apply this disaggregation tool, only the hierarchy is required.
The hierarchization of city blocks as the target zones is performed via the method approved and evaluated in [8]. This involves categorizing all target zones according to their type of use and their potential living area to create a relative value that can distinguish all target zones from each other and put them into a certain order in a respective attribute field. After that, the microm datasets with PLZ8 features and the city blocks from UrbanAtlas 2018 (see Figure 9) are parametrized as target and source zone inputs in the disaggregator tool. The resulting output is a dataset with city block features and all socio-economic variables disaggregated on that level. These values can be spatially joined in the overall city block dataset, to collect the values for all the different parameters of this study in one dataset.

2.6. Combining All Data and Performing Correlation
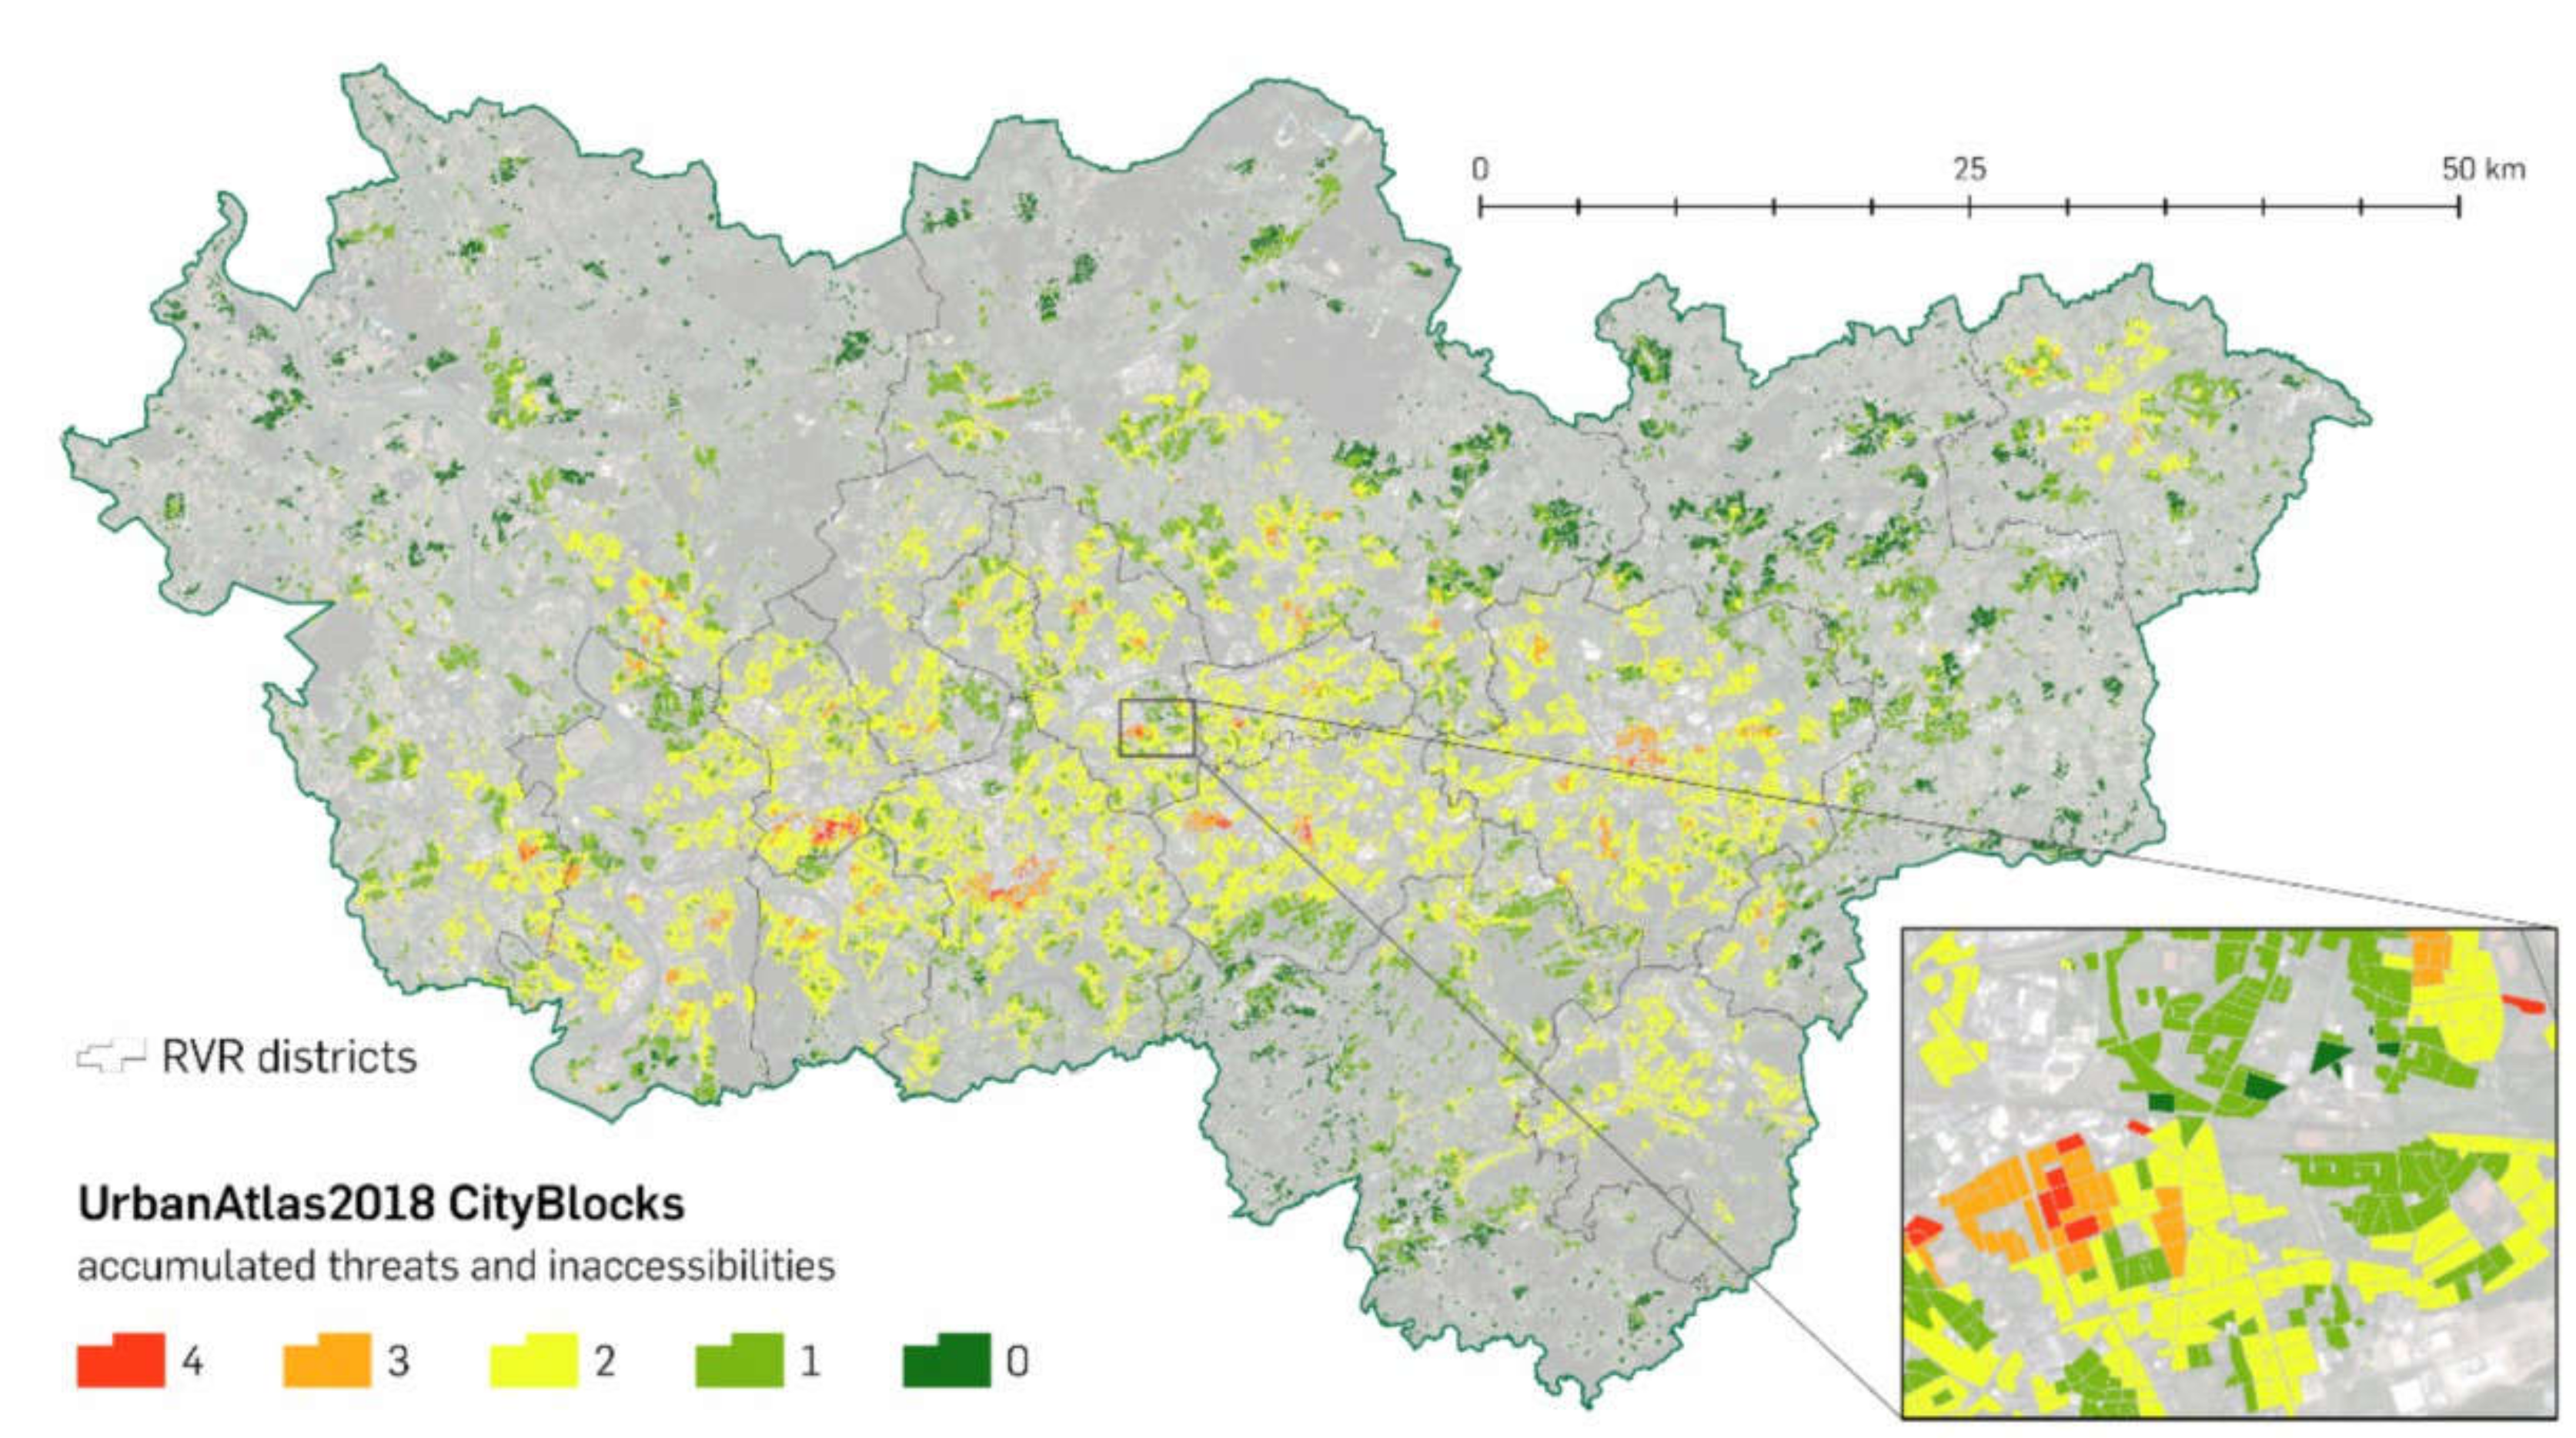
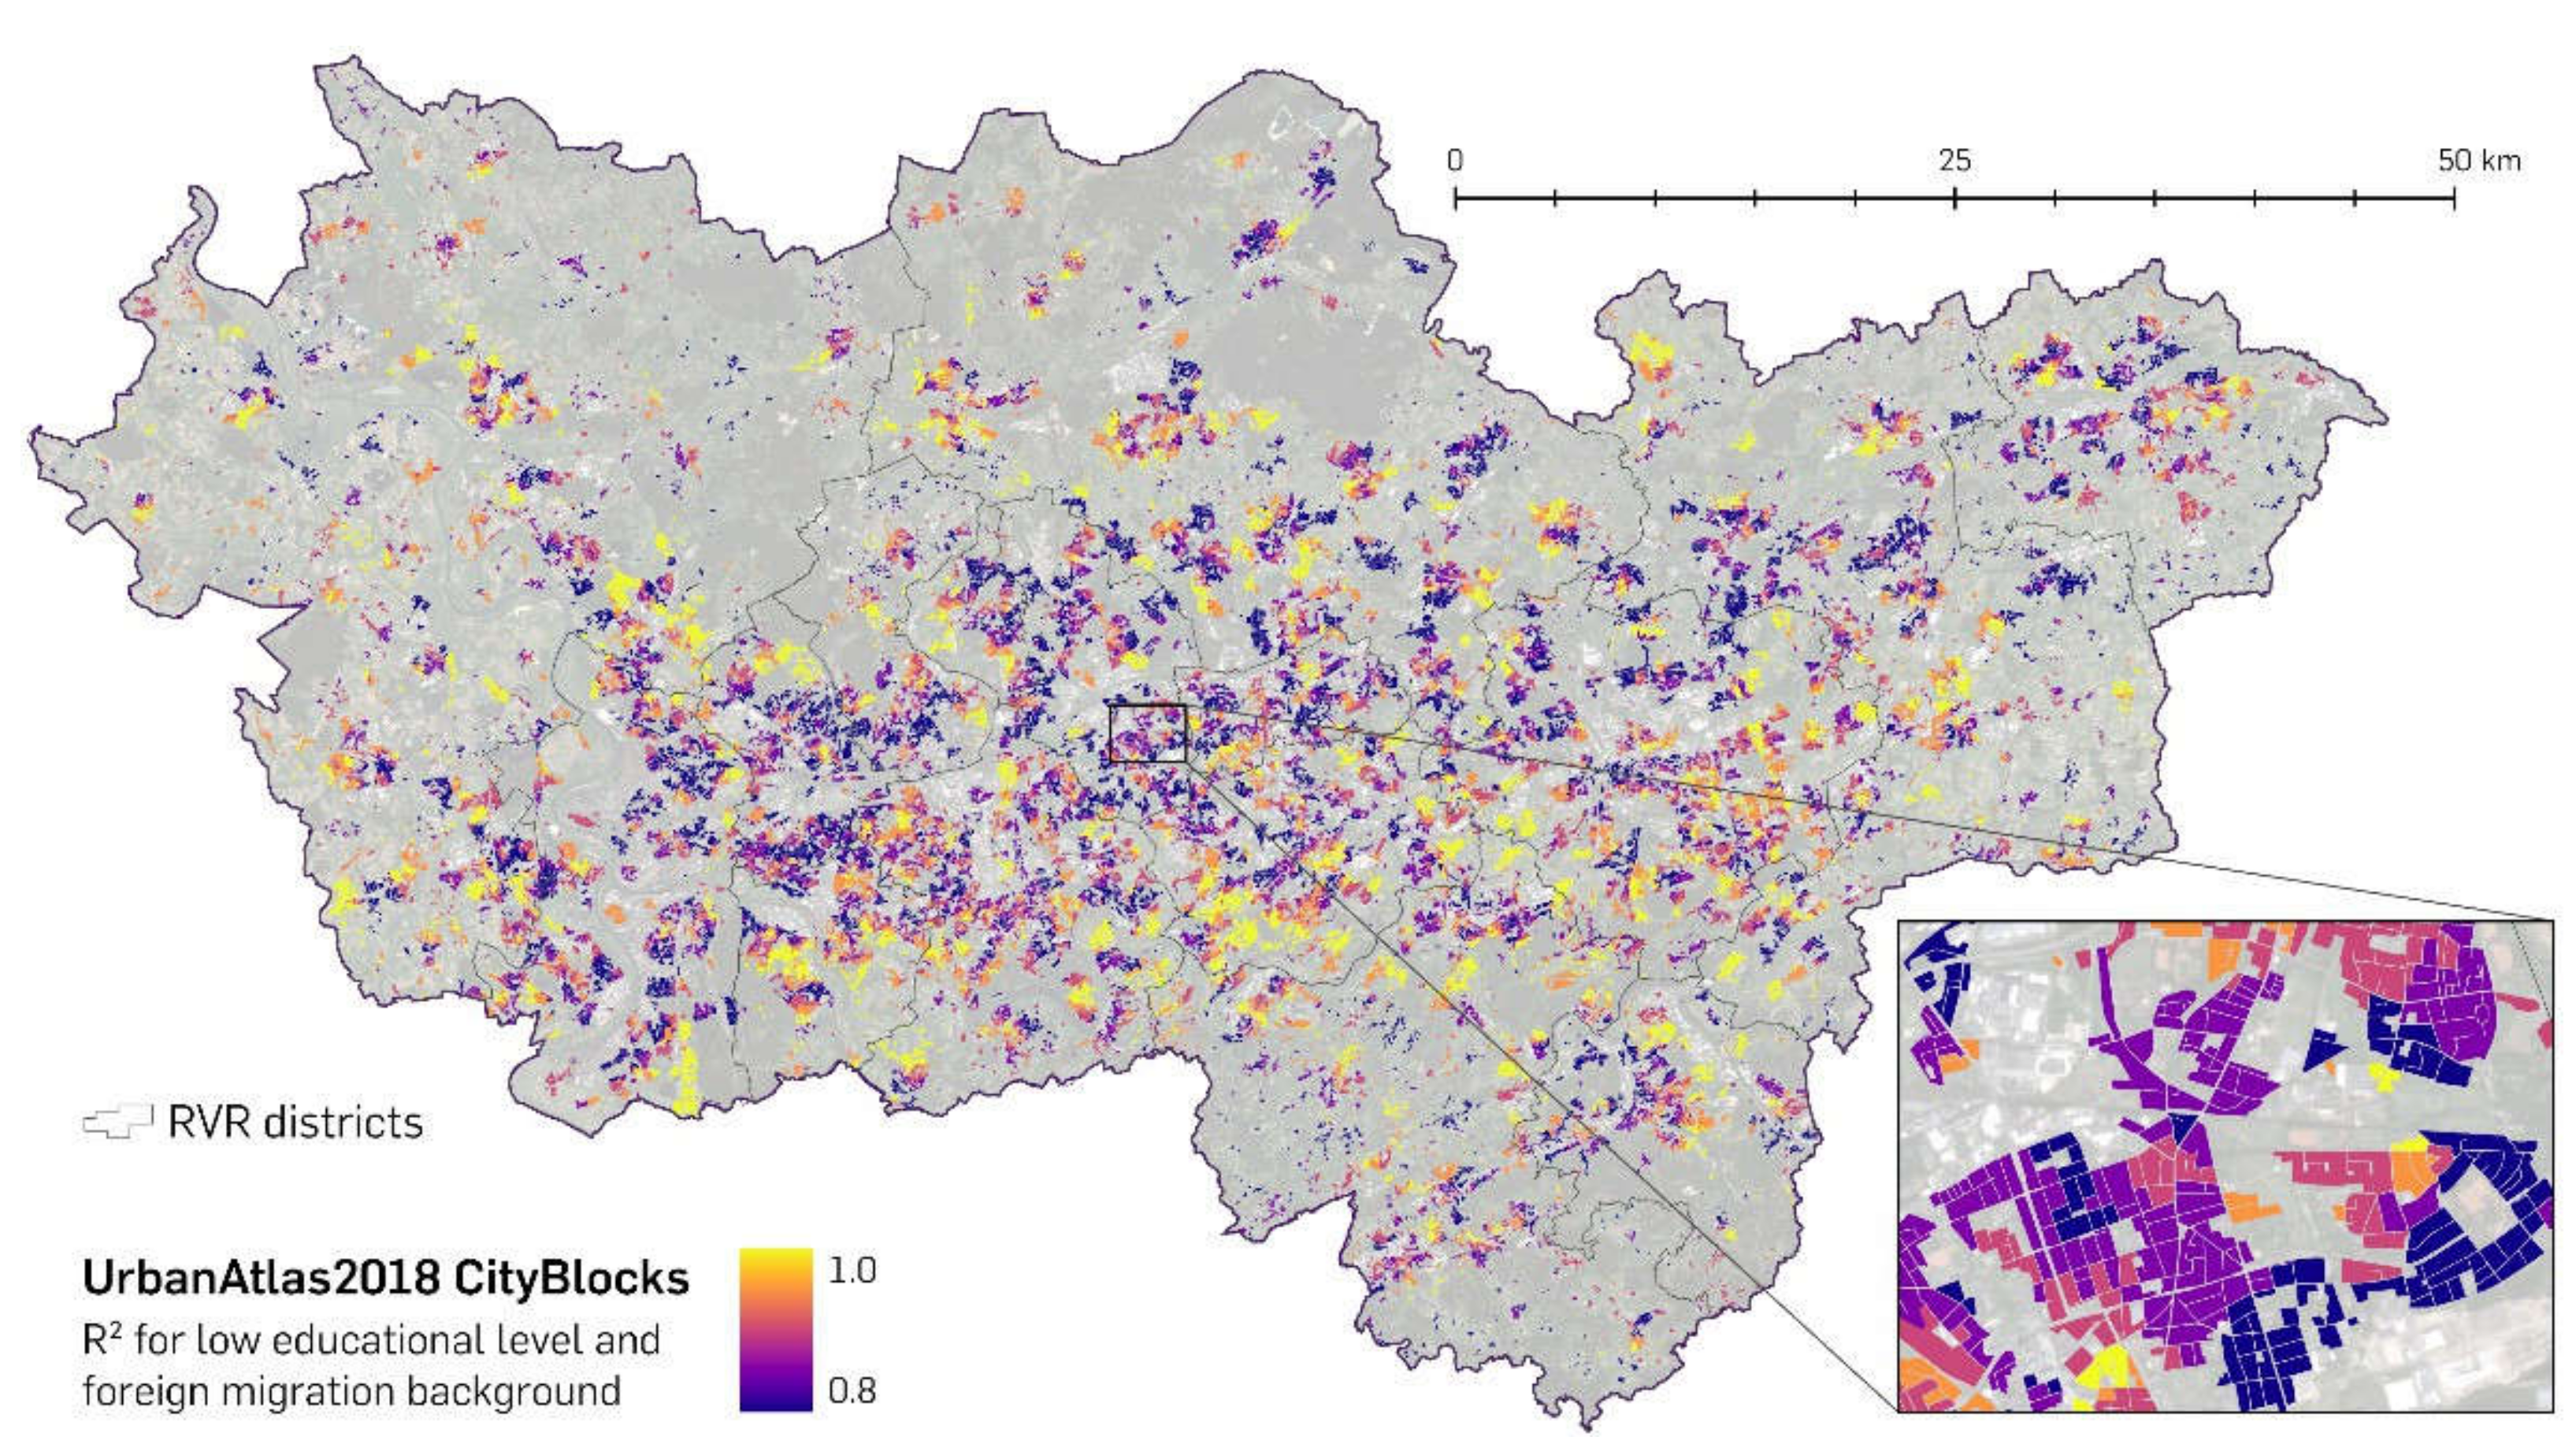
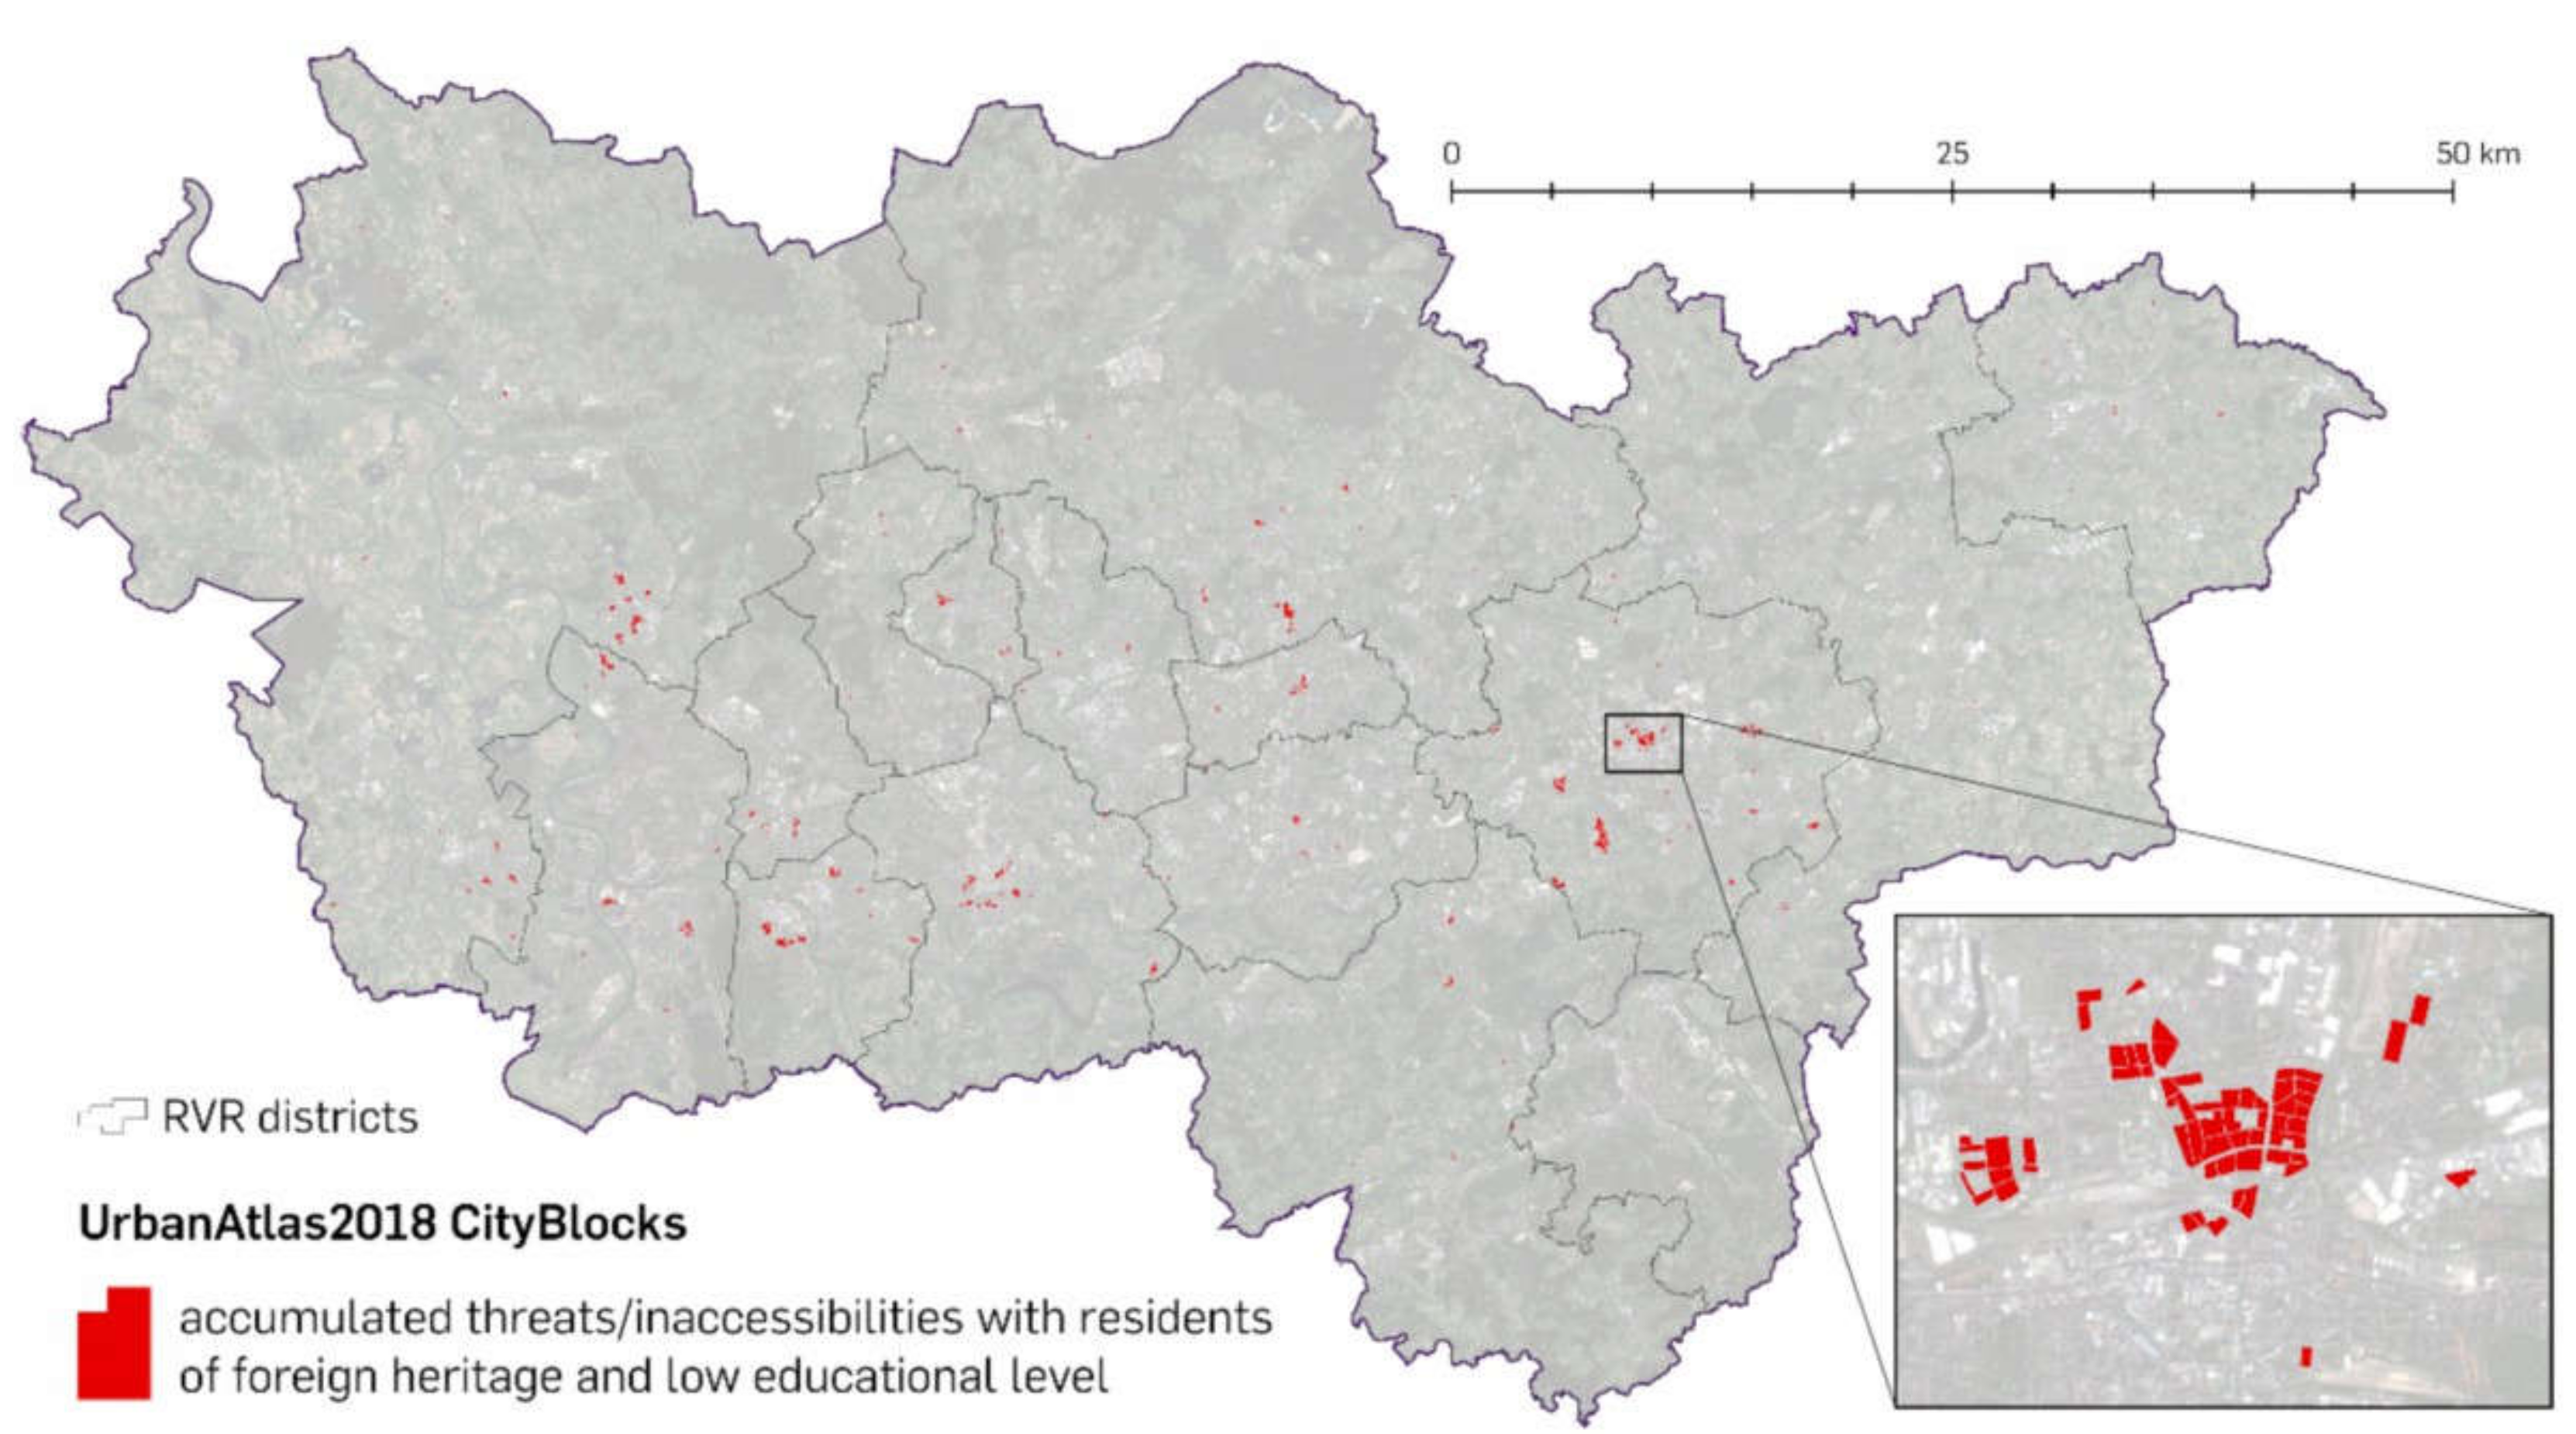
All values for the chosen threats and accessibilities, plus the socio-economic values, are stored within the city block dataset. The next step is to combine all threats into one quantitative value. With this value, it will be possible to identify larger regions as well as single city blocks where all threats are present at once, no matter how far the respective values are above the crucial threshold value. If a threat, according to its threshold, is present in a respective city block, it is attributed the value “0”—if there is no threat, it gets assigned the value “1”. For accessibility, this is process is conducted vice versa. Finally, all newly generated fields are summed up. This results in a final overall value, where zero marks city blocks with all threats are present and no urban greenery is accessible. Four marks the ones with no threats at all and accessibility to both types of urban greenery, and all other combinations are indicated between these values (see Table 2).
The next step is the calculation of correlations between certain socio-economic variables. The aim is to identify regions with a significant local bivariate relationship for the two variables of educational level and migration background. This is performed to compare those regions identified with regions of multiple threats, with the aim of unveiling regional hotspots of environmental injustice as a basis for further investigations.
Figure 10 depicts the developed workflow, showing the datasets used for each process in each subchapter.
The correlation is analyzed for two socio-economic variables. The first is heritage, representing the absolute number of inhabitants per city block that are not native Germans or who lack German ancestors. The second one is education, representing the absolute number of inhabitants per city block that have no high-school diploma, but this does not distinguish between gaining an inferior graduation and no graduation at all.

3. Results

Putting all the intermediate results of both threat analyses and the accessibility analysis together, as described in Section 2.6, the final result is a map that classifies the whole region into five distinct classes (see Figure 11).
The map reveals both an overall picture of the Metropole Ruhr, showing a characteristic gradient from rural areas to inner-city parts, as well as a very detailed view of each particular city block, each attributed with its respective sum of threats and inaccessibility. For more detailed information about a particular city block or region, all city blocks have been analyzed for the characteristics listed in Table 3.
This gives the option to aggregate certain city blocks into neighborhoods, districts or whole cities, while choosing whether to sum or to average the respective values.
As a second outcome of the analysis, a map that depicts the correlation of school degree with migration background is visualized (see Figure 12). The results show that, with 0.88 as the average R2 value, the correlation of the two characteristics is very high, which could be expected according to Wei et al. 2018 [72]. The regions of the highest correlations are colored yellow, showing areas where both attributes feature in their upper values ranges.
To perform the final step, which is the investigation of environmental justice for the Metropole Ruhr, both results are filtered to extract their respective lowest values. These classes are intersected in order to determine whether there are areas of accumulated threats and inaccessibility that are inhabited by people of low educational level with a foreign migration background (see Figure 13). The resulting city block features can now be queried concerning the values of their other attributes, as shown in Table 3.

4. Discussion

The results of this study can be used and interpreted in manifold ways. In this exemplary analysis, the focus is set on the number of residents per city block that have a foreign migration background and those who have a relatively low educational level. The map in Figure 13 shows several small regions where multiple threats are accumulated, and the regressions of both socio-economic variables are notably high. The northern part of the city of Dortmund—also sometimes called the “arrival district”—has always been a melting pot of immigrants with a lot of difficulties concerning their education and income, due to language barriers and a relatively high unemployment rate [73,74,75]. Here, it is clearly visible that the results reflect the reality quite well, and that this city district is one of the hotspots where environmental justice has to be improved significantly—for not only contemporary, but also long-term, reasons. In this borough, the pursuit of Sustainable Development Goals three and eleven has shown much room for improvement, since it is not only the socio-economic status that seems to be a serious issue here, but also the environmental threats that the residents are facing. These embody a dangerous health issue, especially for children and those exposed to them for a long period of time [76].
Based on this study, city blocks that are affected by an absence of healthy socio-economic infrastructure, as well as by the presence of environmental threats, can now be further examined. For instance, the attributes given in this study can provide crucial information about the absolute number of people living there, their ages, their living conditions and income, their education status, and further characteristics (see Table 3). All these variables offer the opportunity to evaluate a neighborhood not only as a whole, but with a degree of detail that reaches right down to the level of urban structure types. This is of great benefit, since former studies have mostly not provided results that reach below the spatial units of urban statistical districts, which contain from dozens to hundreds of individual city blocks.
By considering the connection between the general ability to think sustainably and the link between living conditions and environmental justice, we can improve the overall perception of environmental and sustainability issues in a city district. As a generic scenario, we might plan to install a new playground, a new area of urban greenery, a space for physical activity, or similar facilities. This can now be carried out with the ability to not only view the whole picture, but also to see each mosaic stone on its own. This gives rise to a much more differentiated and focused insight into the conditions of the neighborhood where the future recreation site will be built. Hence, it offers a lot more opportunities to adjust strategies directly to the people living there.
One further step could be to investigate the real-life situation in the city blocks shown in the results of Figure 13. More accurate measuring could be realized by installing sensors in the centers of affected areas to evaluate and find out how serious the threats really are. All the analyses in this study deal with real data from real sensors, but no interpolation method can reconstruct the real situation as precisely as local measurements [61]. The results of this study are no substitute for real field studies, but they can improve the detectability of areas where there is high potential for improvements in environmental justice. This can significantly help in accelerating further proceedings.
A crucial point for the developed workflow is the acquisition of the datasets that are necessary to an analysis that will produce results representing the real status of a place. There are certain datasets that can be substituted by, e.g., remote sensing data (NO2 concentration, land surface temperature, etc.), but the most reliable data normally originate from official or governmental sources, if not from terrestrial measurement. GoogleEarthEngine is a massive tool used to obtain such alternative datasets within minutes, though it still needs to be determined whether it really can replace official data, and if so, what are the drawbacks and consequences.
Another crucial point for this study was the disaggregation of the socio-economic variables. Usually, this takes a lot of time, since dasymetric mapping in three classes is a complex process that requires experience and skill. The disaggregator tool of Burian et al. [44] did a satisfactory job and saved a lot of time, although the preparation of the target zones as regards their hierarchy remains something that should be conducted manually, which costs some time and also requires some more additional datasets.
The chosen socio-economic variables can be changed to whatever the targeted result requires. If, for instance, there is a strong focus on children and their educational level, in combination with the unemployment rate of the people living around certain areas where the number of children is relatively high, these should be the variables of the correlation analysis. Additionally, analyses of threats can be extended to further factors, such as the proximity to dumping sites, or bio-climatic pressures due to high temperatures [15]. Future research could replace the commercial microm dataset with fresh census data. Due to the COVID-19 pandemic, the German Zensus2021 has been postponed to 2022. Unfortunately, the last German census before that was conducted in 2011. Since the temporal gap between these datasets would thus be too large, it was not considered an option in this study to use this latter dataset.

5. Conclusions

The datasets given by the approach in this paper provide new possibilities for assessing the living conditions of socio-economically disadvantaged residents in urban areas, with distinct sizes and shapes. In contrast to previous studies, this study’s focus is highly scalable. It allows a coarse overview over a variously populated conurbation that is characterized not only by urban, but also by rural regions. The accompanying opportunities in the context of environmental justice-related questions range from the general—or small-scale—and comprehensive rating of a heterogeneous area such as the Metropole Ruhr, to the large-scale rating of administrative units, such as city blocks. This helps in significantly improving the quality of life of the inhabitants, which is a crucial component when developing a sustainable and equitable strategy to raise the perception and attractiveness of a specific region for various applications [77,78].
The polycentric Metropole Ruhr turned out to be an appropriate testbed for this scalable approach. However, there might be limitations to the transferring of this workflow to other conurbations, e.g., the aforementioned Guadalajara Metropolitan Area in Mexico, or the Tokaido corridor in Japan. Both examples have a similar structure in terms of the spatial distribution of different urban and rural landscapes types. However, they might differ in their overall appearance regarding urban structure types, street networks, and many of the other factors that shape large urban agglomerations [79]. Still, the joint incorporation of environmental and socio-economic data into spatial units on a large scale via the presented approaches can help in identifying small areas where injustice is high, and gain a comprehensive overview of the whole area.
Regarding the verified link between environmental justice and sustainability (see Section 1), the results cannot only be used to detect areas of inequality in the context of an environmental justice assessment; they also offer insights into the specific factors that can be considered accountable for those inequalities. In addition to that, this is a useful dataset for conducting further analyses that, at best, can yield plans to provide better living conditions, and thus a better adapted sustainable development objective, for conurbations in various areas and of different sizes.

Author Contributions

Conceptualization, N.M., A.P.R. and C.J.; methodology, N.M., A.P.R. and C.J.; software, N.M.; validation, N.M., A.P.R. and C.J.; formal analysis, N.M.; investigation, C.J.; resources, A.P.R.; data curation, C.J.; writing—original draft preparation, N.M., A.P.R. and C.J.; writing—review and editing, N.M., A.P.R. and C.J.; visualization, N.M. and A.P.R.; supervision, C.J.; project administration, C.J.; funding acquisition, C.J. All authors have read and agreed to the published version of the manuscript.

Funding

The research was supported by project no. 2019-1-CZ01-KA203-061374 Spatial and economic science in higher education—addressing the playful potential of simulation games (SPATIONOMY 2.0) and by project no. 2020-1-CZ01-KA226-HE-094425 Transferring contact, technology- and field-based education to digital: methods and tools for geosciences training (DigiGeo), both projects funded by the European Union within the Erasmus+ program.

Institutional Review Board Statement

Not applicable.

Informed Consent Statement

Not applicable.

Data Availability Statement

Not applicable.

Conflicts of Interest

The authors declare no conflict of interest.

References

  1. Böhme, C.; Köckler, H. Umweltgerechtigkeit im städtischen Raum: Soziale Lage, Umweltqualität und Gesundheit zusammendenken. In Planung für Gesundheitsfördernde Städte; Baumgart, S., Köckler, H., Ritzinger, A., Rüdiger, A., Eds.; Akademie für Raumforschung und Landesplanung: Hannover, Germany, 2018; pp. 87–100. [Google Scholar]
  2. Bolte, G.; Bunge, C.; Hornberg, C.; Köckler, H.; Mielck, A.; Aufl, H.H. (Eds.) Umweltgerechtigkeit: Chancengleichheit bei Umwelt und Gesundheit; Konzepte, Datenlage und Handlungsperspektiven; Huber: Bern, Switzerland, 2012. [Google Scholar]
  3. Grafe, R. Umweltgerechtigkeit. In Umweltgerechtigkeit: Aktualität und Zukunftsvision; Grafe, R., Ed.; Springer Vieweg: Wiesbaden/Heidelberg, Germany, 2020; pp. 25–63. [Google Scholar]
  4. Flacke, J.; Schüle, S.A.; Köckler, H.; Bolte, G. Mapping Environmental Inequalities Relevant for Health for Informing Urban Planning Interventions—A Case Study in the City of Dortmund, Germany. Int. J. Environ. Res. Public Health 2016, 13, 711. [Google Scholar] [CrossRef] [PubMed] [Green Version]
  5. McCauley, D.; Heffron, R. Just transition: Integrating climate, energy and environmental justice. Energy Policy 2018, 119, 1–7. [Google Scholar] [CrossRef] [Green Version]
  6. Banzhaf, S.; Ma, L.; Timmins, C. Environmental Justice: The Economics of Race, Place, and Pollution. J. Econ. Perspect. 2019, 33, 185–208. [Google Scholar] [CrossRef] [PubMed] [Green Version]
  7. Boone, C.G. Environmental justice, sustainability and vulnerability. Int. J. Urban Sustain. Dev. 2010, 2, 135–140. [Google Scholar] [CrossRef]
  8. Moos, N. Soziogeomatik: Möglichkeiten und Grenzen der Verwendung von Erdbeobachtungsdaten und Geodaten Zusammen mit Soziodemographischen und Sozioökonomischen Daten. Ph.D. Thesis, Ruhr-University Bochum, Bochum, Germany, 2020. [Google Scholar]
  9. Raddatz, L.; Mennis, J. Environmental Justice in Hamburg, Germany. Prof. Geogr. 2013, 65, 495–511. [Google Scholar] [CrossRef]
  10. Klimeczek, H.J. Umweltgerechtigkeit im Land Berlin: Zur methodischen Entwicklung des zweistufigen Berliner Umweltgerechtigkeitsmonitoring. In UMID: Umwelt und Mensch–Informationsdienst; Umweltbundesamt: Berlin, Germany, 2014; pp. 16–22. [Google Scholar]
  11. Fisher, J.B.; Kelly, M.; Romm, J. Scales of environmental justice: Combining GIS and spatial analysis for air toxics in West Oakland, California. Health Place 2006, 12, 701–714. [Google Scholar] [CrossRef]
  12. Moreno-Jiménez, A.; Cañada-Torrecilla, R.; Vidal-Domínguez, M.J.; Palacios-García, A.; Martínez-Suárez, P. Assessing environmental justice through potential exposure to air pollution: A socio-spatial analysis in Madrid and Barcelona, Spain. Geoforum 2016, 69, 117–131. [Google Scholar] [CrossRef]
  13. Herreros-Cantis, P.; McPhearson, T. Mapping supply of and demand for ecosystem services to assess environmental justice in New York City. Ecol. Appl. 2021, 31, e02390. [Google Scholar] [CrossRef]
  14. Ortiz-Moya, F. Green growth strategies in a shrinking city: Tackling urban revitalization through environmental justice in Kitakyushu City, Japan. J. Urban Aff. 2020, 42, 312–332. [Google Scholar] [CrossRef]
  15. Nickelsen, J.; Hugot, C.; Bläser, D.; Welling, A.-C. Klimaresiliente Region Weiterdenken: Entwicklungen und Perspektiven für Die Stadtregion Ruhr; Praxispartnerbericht Verbundprojekt ZUKUR: Dortmund, Germany, 2020. [Google Scholar]
  16. Bramann, F.; Günther, T.; Hofmeister, K.; von der Decken, J. Verbesserung der Umweltgerechtigkeit am Beispiel Alt-Marten: Implementierung Multifunktionaler Grünräume; TU Dortmund University: Dortmund, Germany, 2019. [Google Scholar]
  17. Moos, N.; Juergens, C.; Redecker, A.P. Geo-Spatial Analysis of Population Density and Annual Income to Identify Large-Scale Socio-Demographic Disparities. ISPRS Int. J. Geo Inf. 2021, 10, 432. [Google Scholar] [CrossRef]
  18. Jeworutzki, S.; Knüttel, K.; Niemand, C.; Schmidt, B.-J.; Schräpler, J.-P.; Terpoorten, T. Wege zur Metropole Ruhr: Räumlich segregierte Bildungsteilhabe in NRW und im Ruhrgebiet–Zentrale Ergebnisse; Zentrum für interdisziplinäre Regionalforschung (ZEFIR), Ruhr-Universität Bochum: Bochum, Germany, 2017. [Google Scholar]
  19. microm GmbH. PLZ8: NRW Region. Available online: https://www.microm.de/xpert/daten/lage-und-standortdaten/plz8-raumtypologie (accessed on 22 November 2021).
  20. microm GmbH. Soziodemografische Variablen NRW. 2017. Available online: https://www.microm.de/fileadmin/microm_Datenhandbuch_2019.pdf (accessed on 22 November 2021).
  21. BKG. Verwaltungsgebiete 1:250,000 (VG250). Available online: https://gdz.bkg.bund.de/ (accessed on 24 November 2021).
  22. Cutini, V. Conurbations and resilience. When growth makes us fragile. 5–24 Paginazione/Tema. Methods, tools and best practices to increase the capacity of urban systems to adapt to natural and man-made changes. J. Land Use Mobil. Environ. 2017, 10, 5–24. [Google Scholar] [CrossRef]
  23. Agyeman, J.; Bullard, R.D.; Evans, B. Exploring the Nexus: Bringing Together Sustainability, Environmental Justice and Equity. Space Polity 2002, 6, 77–90. [Google Scholar] [CrossRef]
  24. Zhang, M.; Tan, F.; Lu, Z. Resource-based cities (RBC): A road to sustainability. Int. J. Sustain. Dev. World Ecol. 2014, 21, 465–470. [Google Scholar] [CrossRef]
  25. Jiang, H.; Sun, Z.; Guo, H.; Weng, Q.; Du, W.; Xing, Q.; Cai, G. An assessment of urbanization sustainability in China between 1990 and 2015 using land use efficiency indicators. NPJ Urban Sustain. 2021, 1, 34. [Google Scholar] [CrossRef]
  26. Rienow, A.; Kantakumar, L.N.; Ghazaryan, G.; Dröge-Rothaar, A.; Sticksel, S.; Trampnau, B.; Thonfeld, F. Modelling the spatial impact of regional planning and climate change prevention strategies on land consumption in the Rhine-Ruhr Metropolitan Area 2017–2030. Landsc. Urban Plan. 2022, 217, 104284. [Google Scholar] [CrossRef]
  27. Corvalán, C.F.; Kjellström, T.; Smith, K.R. Health, Environment and Sustainable Development. Epidemiology 1999, 10, 656. [Google Scholar] [CrossRef] [Green Version]
  28. Ozcevik, O.; Brebbia, C.A.; Sener, S.M.; Köckler, H. (Eds.) Sustainable Development and Planning VII. In Proceedings of the Sustainable Development and Planning 2015, Istanbul, Turkey, 19–21 May 2015; WIT Press: Southampton, UK, 2015. [Google Scholar]
  29. Köckler, H.; Sieber, R. Die Stadt als gesunder Lebensort?!: Stadtentwicklung als ein Politikfeld für Gesundheit. Bundesgesundheitsbl 2020, 63, 928–935. [Google Scholar] [CrossRef]
  30. Seltmann, G. Die IBA Emscher Park im Kontext der Stadtentwicklungspolitik für Nordrhein-Westfalen. In Zukunft Denken Verantworten; Springer: Wiesbaden, Germany, 2020; pp. 623–629. [Google Scholar]
  31. Henn, S.; Behling, M.; Schäfer, S. Lokale Ökonomie–Konzepte, Quartierskontexte und Interventionen. Lokale Ökonomie–Konzepte, Quartierskontexte und Interventionen, 1st ed.; Springer Spektrum: Berlin/Heidelberg, Germany, 2020. [Google Scholar]
  32. Menton, M.; Larrea, C.; Latorre, S.; Martinez-Alier, J.; Peck, M.; Temper, L.; Walter, M. Environmental justice and the SDGs: From synergies to gaps and contradictions. Sustain. Sci. 2020, 15, 1621–1636. [Google Scholar] [CrossRef] [Green Version]
  33. Eisenmenger, N.; Pichler, M.; Krenmayr, N.; Noll, D.; Plank, B.; Schalmann, E.; Wandl, M.-T.; Gingrich, S. The Sustainable Development Goals prioritize economic growth over sustainable resource use: A critical reflection on the SDGs from a socio-ecological perspective. Sustain. Sci. 2020, 15, 1101–1110. [Google Scholar] [CrossRef]
  34. United Nations Department of Economic and Social Affairs. The Sustainable Development Goals Report 2021; United Nations: New York, NY, USA, 2021. [Google Scholar]
  35. Juergens, C.; Meyer-Heß, M.F. Application of NDVI in Environmental Justice, Health and Inequality Studies—Potential and Limitations in Urban Environments; Preprints: Basel, Switzerland, 2020. [Google Scholar] [CrossRef]
  36. Böhme, C.; Preuß, T.; Bunzel, A.; Reimann, B. Umweltgerechtigkeit im Städtischen Raum–Entwicklung von Praxistauglichen Strategien und Maßnahmen zur Minderung Sozial Ungleich Verteilter Umweltbelastungen: Umweltbundesamt; Umweltbundesamt: Dessau-Roßlau, Germany , 2014. [Google Scholar]
  37. openstreetmap.org. OpenStreetMap Data Extracts. Available online: Openstreetmap.org/copyright (accessed on 22 November 2021).
  38. Land NRW. Open Data-Digitale Geobasisdaten NRW. Available online: https://www.bezreg-koeln.nrw.de/brk_internet/geobasis/opendata/index.html (accessed on 30 April 2020).
  39. European Commission; Copernicus. Urban Atlas. 2018. Available online: Land.copernicus.eu/local/urban-atlas/urban-atlas-2018 (accessed on 22 November 2021).
  40. Bundesanzeiger. Berechnungsmethode für den Umgebungslärm von Bodennahen Quellen. 2018. Available online: http://www.umgebungslaerm.nrw.de/materialien/gesetze_regelwerke/BAnz_AT_28_12_2018_B700–1_Berechnung_bodenQuellen_BUB.pdf (accessed on 18 November 2021).
  41. European Space Agency; Centre National d’Etudes Spatiales. Sentinel 2-Imagery. CNES, Paris, Sentinel-Hub. Available online: https://sentinels.copernicus.eu/web/sentinel/home (accessed on 22 November 2021).
  42. European Union. Mapping Guide for a European Urban Atlas; European Commission: Brussels, Belgium, 2016. [Google Scholar]
  43. Mau, R. . Erstellung und Aktualisierung der Digitalen Landschaftsmodelle DLM250 und DLM1000; IÖR Schriften 73, 95–102; Rhombos: Berlin, Germany, 2017. [Google Scholar]
  44. Burian, J.; Pászto, V.; Zapletal, L. Disaggregator—Tool for Aggregation and Disaggregation of Spatial Data; Springer: Berlin/Heidelberg, Germany, 2021. [Google Scholar] [CrossRef]
  45. Laatikainen, T.E.; Piiroinen, R.; Lehtinen, E.; Kyttä, M. PPGIS approach for defining multimodal travel thresholds: Accessibility of popular recreation environments by the water. Appl. Geogr. 2017, 79, 93–102. [Google Scholar] [CrossRef]
  46. Neuvonen, M.; Sievänen, T.; Tönnes, S.; Koskela, T. Access to green areas and the frequency of visits—A case study in Helsinki. Urban For. Urban Green. 2007, 6, 235–247. [Google Scholar] [CrossRef]
  47. Reyes, M.; Páez, A.; Morency, C. Walking accessibility to urban parks by children: A case study of Montreal. Landsc. Urban Plan. 2014, 125, 38–47. [Google Scholar] [CrossRef]
  48. Rossi, S.D.; Byrne, J.A.; Pickering, C.M. The role of distance in peri-urban national park use: Who visits them and how far do they travel? Appl. Geogr. 2015, 63, 77–88. [Google Scholar] [CrossRef] [Green Version]
  49. Jalkanen, J.; Fabritius, H.; Vierikko, K.; Moilanen, A.; Toivonen, T. Analyzing fair access to urban green areas using multimodal accessibility measures and spatial prioritization. Appl. Geogr. 2020, 124, 102320. [Google Scholar] [CrossRef]
  50. Richter, B.; Grunewald, K.; Meinel, G. Analyse von Wegedistanzen in Städten zur Verifizierung des Ökosystemleistungsindikators “Erreichbarkeit städtischer Grünflächen“; Wichmann: Berlin, Germany, 2016. [Google Scholar]
  51. Grunewald, K.; Richter, B.; Meinel, G.; Herold, H.; Syrbe, R.-U. Proposal of indicators regarding the provision and accessibility of green spaces for assessing the ecosystem service “recreation in the city” in Germany. Int. J. Biodivers. Sci. Ecosyst. Serv. Manag. 2017, 13, 26–39. [Google Scholar] [CrossRef] [Green Version]
  52. Meinel, G.; Schumacher, U.; Behnisch, M. Regionales kooperatives Flächenmonitoring im Ruhrgebiet: Genauere Daten-Informierte Akteure-Praktisches Handeln; IÖR Schriften, 60, 3-10; Rhombos: Berlin, Germany, 2012. [Google Scholar]
  53. EU Air Quality Guidelines, Guideline 2008/50/EG; European Parliament and Council: Strasbourg, France, 2008.
  54. Deligiorgi, D.; Philippopoulos, K. Spatial Interpolation Methodologies in Urban Air Pollution Modeling: Application for the Greater Area of Metropolitan Athens, Greece. In Advanced Air Pollution; Nejadkoorki, F., Ed.; InTechOpen: London, UK, 2011. [Google Scholar]
  55. Janssen, S.; Dumont, G.; Fierens, F.; Mensink, C. Spatial interpolation of air pollution measurements using CORINE land cover data. Atmos. Environ. 2008, 42, 4884–4903. [Google Scholar] [CrossRef]
  56. Wilson, J.G.; Kingham, S.; Pearce, J.; Sturman, A.P. A review of intraurban variations in particulate air pollution: Implications for epidemiological research. Atmos. Environ. 2005, 39, 6444–6462. [Google Scholar] [CrossRef]
  57. Nejadkoorki, F. (Ed.) Advanced Air Pollution; InTechOpen: London, UK, 2011. [Google Scholar]
  58. World Health Organisation. Health Risks of Air Pollution in Europe—HRAPIE Project: Recommendations for Concentration—Response Functions for Cost-Benefit Analysis of Particulate Matter, Ozone and Nitrogen Dioxide. 2013. Available online: https://www.euro.who.int/__data/assets/pdf_file/0006/238956/Health_risks_air_pollution_HRAPIE_project.pdf (accessed on 18 November 2021).
  59. Jumaah, H.J.; Ameen, M.H.; Kalantar, B.; Rizeei, H.M.; Jumaah, S.J. Air quality index prediction using IDW geostatistical technique and OLS-based GIS technique in Kuala Lumpur, Malaysia. Geomat. Nat. Hazards Risk 2019, 10, 2185–2199. [Google Scholar] [CrossRef]
  60. Sadahiro, Y. Accuracy of areal interpolation: A comparison of alternative methods. J. Geogr. Syst. 1999, 1, 323–346. [Google Scholar] [CrossRef]
  61. Wong, D.W.; Yuan, L.; Perlin, S.A. Comparison of spatial interpolation methods for the estimation of air quality data. J. Expo. Anal. Environ. Epidemiol. 2004, 14, 404–415. [Google Scholar] [CrossRef] [Green Version]
  62. Assessment and Management of Environmental Noise: Directive 2002/49/EC; European Parliament and Council: Strasbourg, France, 2002.
  63. Maier, W.; Mielck, A. „Environmental justice“ (Umweltgerechtigkeit). Prävention Gesundh. 2010, 5, 115–128. [Google Scholar] [CrossRef]
  64. Pettorelli, N.; Vik, J.O.; Mysterud, A.; Gaillard, J.-M.; Tucker, C.J.; Stenseth, N.C. Using the satellite-derived NDVI to assess ecological responses to environmental change. Trends Ecol. Evol. 2005, 20, 503–510. [Google Scholar] [CrossRef] [PubMed]
  65. Roy, D.P. Investigation of the maximum Normalized Difference Vegetation Index (NDVI) and the maximum surface temperature (Ts) AVHRR compositing procedures for the extraction of NDVI and Ts over forest. Int. J. Remote Sens. 1997, 18, 2383–2401. [Google Scholar] [CrossRef]
  66. Midopt-Midwest Optical Systems, Inc. NDVI/Agricultural Inspection. Available online: https://midopt.com/solutions/color-imaging/ndvi/ (accessed on 22 November 2021).
  67. Mutanga, O.; Kumar, L. Google Earth Engine Applications. Remote Sens. 2019, 11, 591. [Google Scholar] [CrossRef] [Green Version]
  68. microm GmbH. Das Datenhandbuch. 2019. Available online: https://www.microm.de/fileadmin/microm_Datenhandbuch_2019.pdf#c915 (accessed on 15 October 2020).
  69. Li, T.; Corcoran, J. Testing dasymetric techniques to spatially disaggregate the regional population forecasts for Southeast Queensland. J. Spat. Sci. 2011, 56, 203–221. [Google Scholar] [CrossRef]
  70. Li, T.; Pullar, D.; Corcoran, J.; Stimson, R. A Comparison of Spatial Disaggregation Techniques as Applied to Population Estimation for Southeast Queensland (SEQ); Monash University: Melbourne, Australia, 2007. [Google Scholar] [CrossRef]
  71. Mennis, J.; Hultgren, T. Dasymetric Mapping for Disaggregating Coarse Resolution Population Data; Temple University: Philadelphia, PA, USA, 2005. [Google Scholar]
  72. Wei, Y.D.; Xiao, W.; Simon, C.A.; Liu, B.; Ni, Y. Neighborhood, race and educational inequality. Cities 2018, 73, 1–13. [Google Scholar] [CrossRef]
  73. Gottschalk, I.; Tepeli, D.A. Etablierten-Außenseiter-Beziehungen im Ankunftsstadtteil Dortmunder Nordstadt. In Die Problematisierung sozialer Gruppen in Staat und Gesellschaft; Springer: Wiesbaden, Germany, 2019; pp. 63–81. [Google Scholar]
  74. Döring, H.; Kurtenbach, S. Dialog in der Dauerkrise. Einblicke in die Alltagsbewältigung armutsgeprägter Zuwanderung aus Rumänien und Bulgarien in die Dortmunder Nordstadt. In Gesellschaftlichen Zusammenhalt Gestalten; Springer: Wiesbaden, Germany, 2020; pp. 187–217. [Google Scholar]
  75. Kurtenbach, S. Neuzuwanderer in Städtischen Ankunftsgebieten. Rumänische und Bulgarische Zuwanderer in der Dortmunder Nordstadt; ZEFIR-Forschungsbericht Band 3; Ruhr-University Bochum: Bochum, Germany, 2013. [Google Scholar]
  76. European Environment Agency. Unequal Exposure and Unequal Impacts: Social Vulnerability to Air Pollution, Noise and Extreme Temperatures in Europe; Publications Office of the European Union: Luxembourg, 2018. [Google Scholar]
  77. Theofilou, P. Quality of Life: Definition and Measurement. EJOP 2013, 9, 150–162. [Google Scholar] [CrossRef]
  78. Winiarczyk-Raźniak, A.; Raźniak, P. Are Pueblos Mágicos Really Magic? Tourism Development Program in the Context of the Quality of Life of Town Residents. Land 2021, 10, 1342. [Google Scholar] [CrossRef]
  79. Glezer, O.B.; Kolosov, V.A.; Brade, I.; Coudroy de Lille, L.; Sluka, N.A. Integrated forms of urban settlement pattern in Russia, Europe, and worldwide. Reg. Res. Russ. 2014, 4, 80–89. [Google Scholar] [CrossRef]
Figure 1. Population density of Metropole Ruhr in 2017 (source data from [19,20,21]).
Sustainability 14 03447 g001
Figure 2. Sustainable Development Goals (SDGs) developed by the UN [34].
Sustainability 14 03447 g002
Figure 3. Network analysis for urban green (>1 ha) in five steps [21,37,39,52].
Sustainability 14 03447 g003
Figure 4. Preliminary results of the accessibility analysis of urban green spaces [21,39,52].
Sustainability 14 03447 g004
Figure 5. Intermediate results of IDW algorithm and threshold NO2 concentration [21,38].
Sustainability 14 03447 g005
Figure 6. Noise pollution over 70 dB for the area of RVR [21,38,40].
Sustainability 14 03447 g006
Figure 7. Reflectance curves of vegetation, NDVI formula and respective bands [41,65,66].
Sustainability 14 03447 g007
Figure 8. From NDVI raster to mean values for 500-m areas within city blocks [21,39,41].
Sustainability 14 03447 g008
Figure 9. Source zones PLZ8 (black outlines) and target zones city blocks (red areas) [19,39].
Sustainability 14 03447 g009
Figure 10. Flowchart of the methodology.
Sustainability 14 03447 g010
Figure 11. Accumulated threats and areas of inaccessibility in the Ruhr area/Metropole Ruhr [21,39,41].
Sustainability 14 03447 g011
Figure 12. Visualization of the correlation between education and migration [21,39,41].
Sustainability 14 03447 g012
Figure 13. Areas of accumulated threats for the socio-economically disadvantaged [21,39,41].
Sustainability 14 03447 g013
Table 1. Datasets and their sources used for this analysis [20,21,37,38,39,40,41].
Data SetSource
Digital Landscape Model (DLM)Federal Agency for Cartography and Geodesy
Urban Atlas 2018Copernicus|European Space Association (ESA)
Street Network (Pedestrian)openstreetmap.org
NO2—Concentrations from measuring sitesState of NRW
Noise mapState Agency for Nature, Environment and
Consumer Protection, NRW
Socio-economic variables in PLZ8 unitsmicrom Micromarketing-Systems and Consult GmbH
Sentinel-2-imageryCopernicus|European Space Association (ESA)
Table 2. Assignment of binary values for all attributes according to given thresholds.
AttributeThresholdTrueFalse
urban green > 1 haaccessible within 500 m by foot10
urban green > 10 haaccessible within 1000 m by foot10
NO2 concentrationunderneath 30 µg/m310
noise exposureunderneath 70 dB10
Table 3. Attributes stored in each city block after the analysis.
accumulated potential living area (m2)
population density (inh./km2)
absolute number of inhabitants
mean distance to urban green > 1 ha (m)
mean distance to urban green > 10 ha (m)
mean NDVI within 500-m radius (indexed)
mean volume level (dB)
mean NO2-concentration (µg/m3)
absolute number of inhabitants with a migration background
absolute number of unemployed inhabitants
absolute number of inhabitants with a school degree lower than high school
absolute number of kids (0 to 10 years)
absolute number of teenagers (11 to 18 years)
absolute number of young adults (19 to 35 years)
absolute number of adults (36 to 50 years)
absolute number of older adults (51 to 65 years)
absolute number of seniors (older than 65 years)
Publisher’s Note: MDPI stays neutral with regard to jurisdictional claims in published maps and institutional affiliations.

