Article

A Green Analytical Methodology for Detecting Adulteration in Automotive Urea-SCR Products Using Microfluidic-Paper Analytical Devices

by
Danielle da Silva Souza
1,
Gabriel Martins Fernandes
1,
Barbara Cristina Dias
1,
José Roberto Stefanelli Junior
2,
Rodrigo Sequinel
3 and
João Flávio da Silveira Petruci
1,*
1
Institute of Chemistry, Federal University of Uberlândia (UFU), Av. João Naves de Ávila 2121, Uberlândia 38408-902, MG, Brazil
2
Perícia Oficial e Identificação Técnica (POLITEC), Pontes e Lacerda 78250-000, MT, Brazil
3
Department of Exact Sciences and Engineering, Federal University of Paraná (UFPR), Palotina 85950-000, PR, Brazil
*
Author to whom correspondence should be addressed.
Sustainability 2022, 14(6), 3363; https://doi.org/10.3390/su14063363
Submission received: 20 February 2022 / Revised: 4 March 2022 / Accepted: 9 March 2022 / Published: 13 March 2022

Abstract

:
The application of urea-based selective catalytic reduction products (i.e., Urea-SCR) provides a reduction of NOx and, therefore, minimizes pollution emissions from vehicles fueled by diesel. Such products can be easily found in the market; however, they are often susceptible to adulteration, mainly in terms of the urea content and dilution with non-mineralized water. In this study, we propose a simple, low-cost, disposable, and straightforward paper-based microfluidic device for the quality-control of Urea-SCR products for the first time by quantifying urea and water hardness simultaneously via colorimetric reactions using a small volume of sample. 4-(dimethylamino)benzaldehyde and Eriochrome T were used as colorimetric indicators for urea and water hardness determination, respectively. Each reagent (1.5 µL) was combined with 6 µL of sample for analysis, contributing to an expressive reduction of waste generation. Digital images of the µPAD were obtained, and linear relations between color intensity and urea and Ca2+ and Mg2+ concentrations in the range of 0.2 to 1.0% and 0.1 to 3.5 mmol L−1 were obtained with a correlation coefficient higher than 0.99. Recovery experiments were employed to evaluate the accuracy of the methodology, revealing suitable values between 91.5 and 115%. Brazilian Urea-SCR samples were acquired from different distributors and submitted to the proposed procedure to evaluate its applicability. The application of microfluidic paper-based devices with colorimetric reactions enables the quality control of Urea-SCR products with high accuracy, portability, low consumption of reagents, and no generation of toxic residues; thereby contributing to the green analytical chemistry field.

1. Introduction

Urea-based selective catalytic reduction (Urea-SCR) solution is widely used to minimize NOx emission in compression-ignition vehicles and prevent harmful gases from being released into the atmosphere. The technology is based on the on-site urea-derived ammonia production that efficiently reacts with NOx compounds by reducing them to N2 and water into the exhaust gas stream of diesel vehicles [1]. The characteristics of commercial Urea-SCR aqueous solutions are well established by international standard ISO 22241-1:2006 [2]. It consists of a transparent odorless liquid containing 32.5% w/w of pure urea standard prepared in deionized water and can be easily found in the market as AdBlue® (Europe), BlueDEF from Old World Industries (Northbrook, IL, USA), and Arla32 (Brazil) [3].
Due to its high importance, quality control of Urea-SCR products is extensively performed in the industry to ensure its reliability. The commercial automotive Urea-SCR—also known as AUS32—has been susceptible to adulteration mainly via alterations in the urea content, therefore compromising the yield of the NOx reduction reaction [4]. Additionally, AUS32 tends to degrade within a few days when subjected to temperatures around 80 °C. For such reasons, analytical methods must be developed to monitor the concentration of urea in AUS 32 products ensuring quality control. ISO 22241-part 2 establishes two analytical methods developed for the determination of the urea content. The first option is a highly selective combustion method to measure total nitrogen content and requires an automated instrument operated at high temperatures. The second determination is performed by the refractive index method, which demands special attention to biuret interference and the sample thermal equilibrium at 20 ± 0.02 °C needed to take the measurements (ISO). Some alternative analytical methods have been reported for the determination of urea in AUS32 and other matrices [5]; however, they are based on traditional analytical techniques, such as electrochemical sensors [6], spectrophotometry UV-Vis [7], infrared spectroscopy (FTIR) [8,9], high-performance liquid chromatography (HPLC) [10], gas chromatography (GC) [11], and refractive index [12]. All mentioned methods provide suitable sensibility and selectivity; however, they are usually bulky, expensive, consume a high quantity of organic solvents, time-consuming, with high levels of waste generation—therefore not considered as green analytical methods—and not indicated for on-site determination.
Additionally, there is another common adulteration of AUS 32 based on the straight dilution of concentrated urea solution with non-mineralized water. This act may result in catalyst poisoning due to the presence of high concentration levels of some metal ions. Therefore, ISO 22241 part 1 gives the maximum allowable concentration for these elemental impurities, and part 2 describes ICP-OES as the official method of analysis to determine the ions concentration [13]. Again, the application of the official methods is excellent in terms of sensibility, selectivity, and accuracy; however, they are not suitable for screening and in situ applications. Alternatively, few portable analytical methods have been employed to determine total water hardness [13,14], a quality parameter defined as the sum of total calcium (II) and magnesium (II) concentration. These methods are very useful to achieve rapid forensic screening [13] and fast water quality control [14].
Colorimetric reactions performed on filter paper surfaces are an excellent alternative to identify chemical compounds that have been employed for several analytical applications [15,16]. Additionally, the color intensity analysis via the association of the colorimetric reaction with digital image treatment enables the development of quantitative methods with fast responses, minimum usage of reagents, low cost, high selectivity, and straightforward operation [17]. This approach is based on the color parameters extraction—according to the color model of each device (e.g., RGB)—and their relationship with the analyte concentration [18]. When portable devices are used to acquire digital images—such as smartphones—the possibility of on-site applications is facilitated; this has been demonstrated in many previous studies. The usage of paper-based materials to produce miniaturized devices to manipulate microvolumes of fluids has resulted in the production of the so-called microfluidic paper-analytical devices (µPADs) using different fabrication methods [19]. Filter paper is an excellent material due to its worldwide availability, easiness of use, inertness, disposability, and no need for pumps for fluidic manipulation due to the capillary effect present in cellulose papers. Therefore, the application of paper-based analytical devices using colorimetric methods is an excellent alternative as a green analytical method tailored for screening purposes with a very low volume of reagents employed, quantification using a simple smartphone, and no need for a power supply.
Among the colorimetric reagents tested for the quali- or quantitative detection of urea, 4-Dimethylaminobenzaldehyde (p-DMAB) has been previously employed in paper-based spot tests with high selectivity and sensitivity towards urea identification [20]. Moreover, an indirect methodology can be employed to detect non-mineralized water by the determination of the water hardness. This analysis can be performed via the determination of Ca2+ and Mg2+ ions in water samples using colorimetric reagents and has also been adapted for paper-based analytical devices with suitable results [14].
Therefore, we report the development and validation of a paper-based analytical device tailored for the simultaneous quantification of urea and water hardness using a simple analytical procedure and using a low volume of samples and reagents. With the aid of a smartphone, digital images of the device were taken, and the data obtained were used to evaluate the quality of Urea-SCR products on-site.

2. Materials and Methods

2.1. Reagents Preparation

4-dimethylaminobenzaldehyde 99.0% (Sigma Aldrich, Darmstadt, Germany), urea 99.5% (Vetec, Duque de Caxias, Brazil), ethyl alcohol 95.0% (Alphatec, Brazil), and hydrochloric acid 37.0% (Dinamica, Macaé, Brazil) were employed in this study. Calcium chloride dihydrate (CaCl2·2H2O), magnesium chloride hexahydrate (MgCl2·6H2O), Eriochrome Black T (C20H12N3O7SNa), sodium hydroxide (NaOH), boric acid (H3BO3), and ethanol with HPLC grade were purchased from Sigma-Aldrich (St. Louis, MO, USA).
Urea solutions with different concentrations were prepared by diluting appropriate amounts of an aqueous stock solution of urea with a concentration of 32.0% (w/v). Stock solutions of 25 mM of CaCl2·2H2O and MgCl2·6H2O were prepared by weighing an adequate mass of each salt in deionized water previously purified using a Mili-Q system (Millipore, Bedford, MA, USA). Fifty milliliters of buffer solution were prepared by adding NaOH with a concentration of 0.5 M into a 0.5 M H3BO3 solution until reaching the desired pH at 10.2 mM. Eriochrome Black T solution was prepared, weighing an adequate mass of the salt in 50 mL of anhydrous ethanol (≥99.5%).

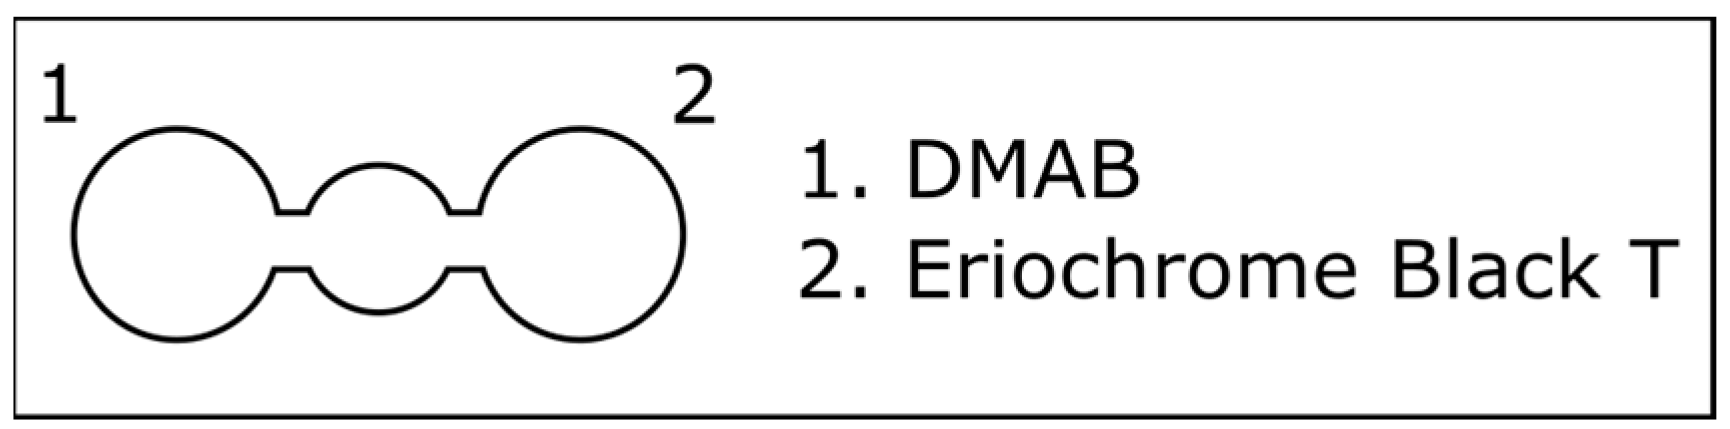
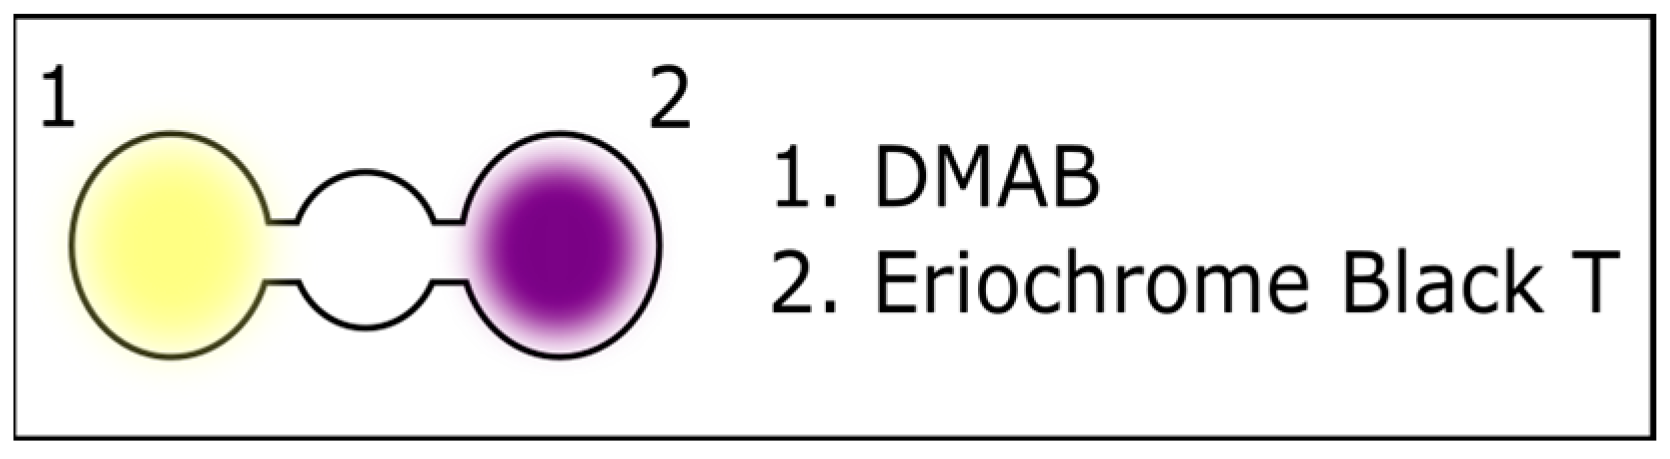
2.2. Design and Fabrication Method of the µPAD

The paper-based analytical device was designed using the Inkscape software (version 4.0 for Mac) and printed onto the surface of a filter paper (Whatman 1, Whatman, Millipore, USA) using a wax printer (ColorQube 8580, Xerox, New York, NY, USA). The device was then heated at 200 °C until complete wax penetration to create the hydrophobic barriers for fluidic manipulation [21]. The µPAD layout was designed to contain two detection zones (3.0 cm diameter each) interconnected to a central zone (1.0 cm diameter) for sample injection. Figure 1 illustrates the developed paper-based analytical device. Prior to the analysis, 1.5 µL of each reagent was pipetted onto the corresponding spot.
To perform the assay for urea determination, a solution of DMAB with a concentration of 1.6% w/v was prepared by adding an appropriate mass of DMAB in ethyl alcohol containing 10% (v/v) of concentrated hydrochloric acid. Both reactions were optimized using spot tests prior to the application in the paper-based analytical device. For this, urea detection was accomplished by adding 4 µL of the DMAB reagent and 4 µL of urea solution.
For the optimization of water hardness determination, 4 µL of the buffer solution was added to the µPAD and left to dry. After this, it was added to 4 µL of Eriochrome Black T solution and held for 10 min. Finally, 4 µL of the sample was added to the µPAD, enabling the reaction of Ca2+ and Mg2+ ions with EBT.

2.3. Analysis Procedure and Data Acquisition

Arla 32 (i.e., Brazilian Urea-SCR) samples were acquired from local gas stations. Prior to the analysis, 150 µL of each sample was diluted to 10 mL with deionized water, and then 6 µL of the diluted solution was injected into the central zone of the µPAD, reaching the detection zones after 3 min. A digital image of the device was obtained using a smartphone with an iOS operational system and transferred to a laptop. The color information was extracted as Red, Green, and Blue (RGB) or HSV parameters using ImageJ®. All RGB data were exported and processed by the 2016 Microsoft Excel® program. All measurements were performed in triplicate.

3. Results

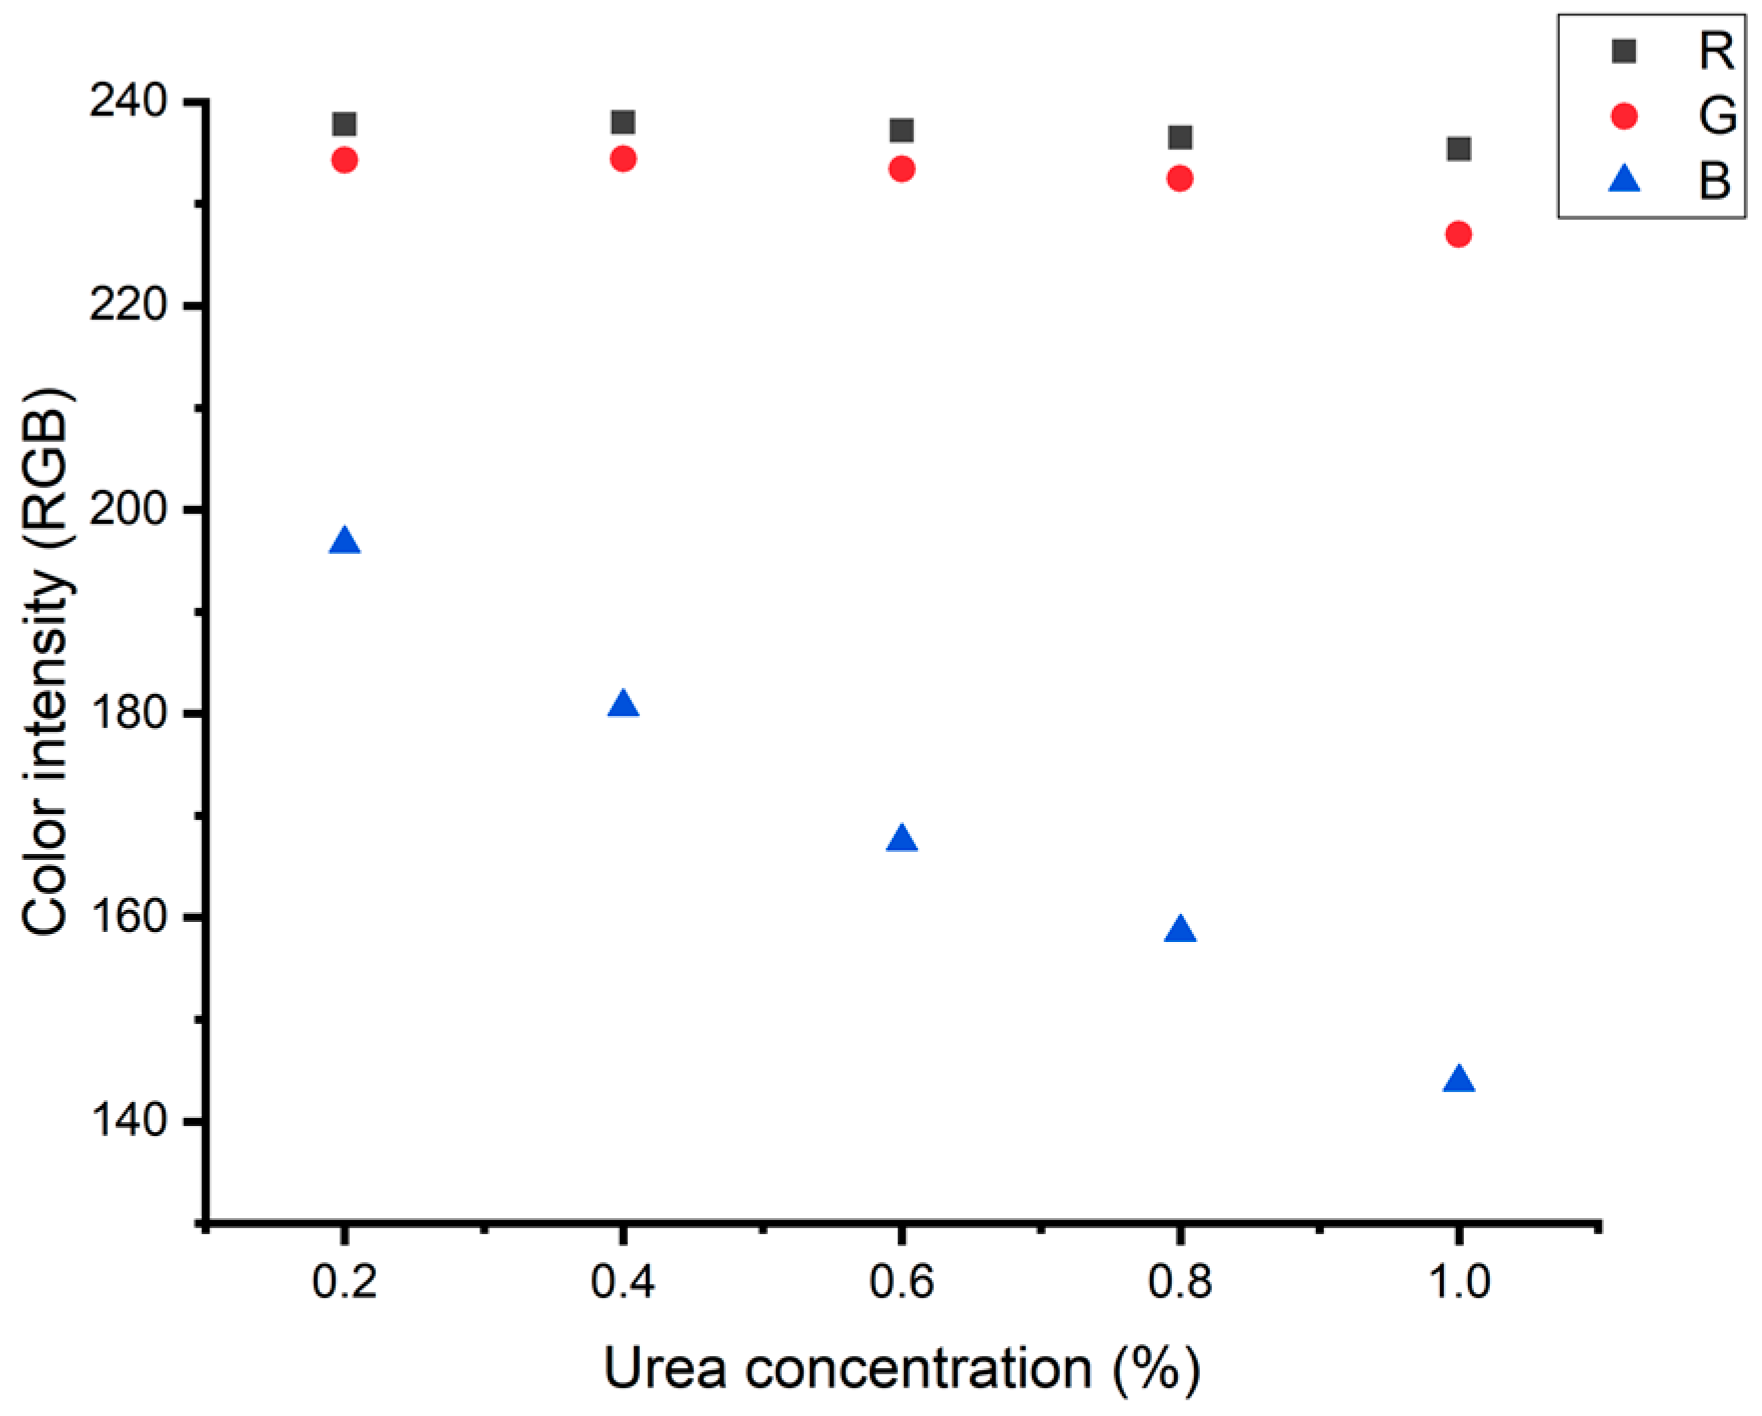
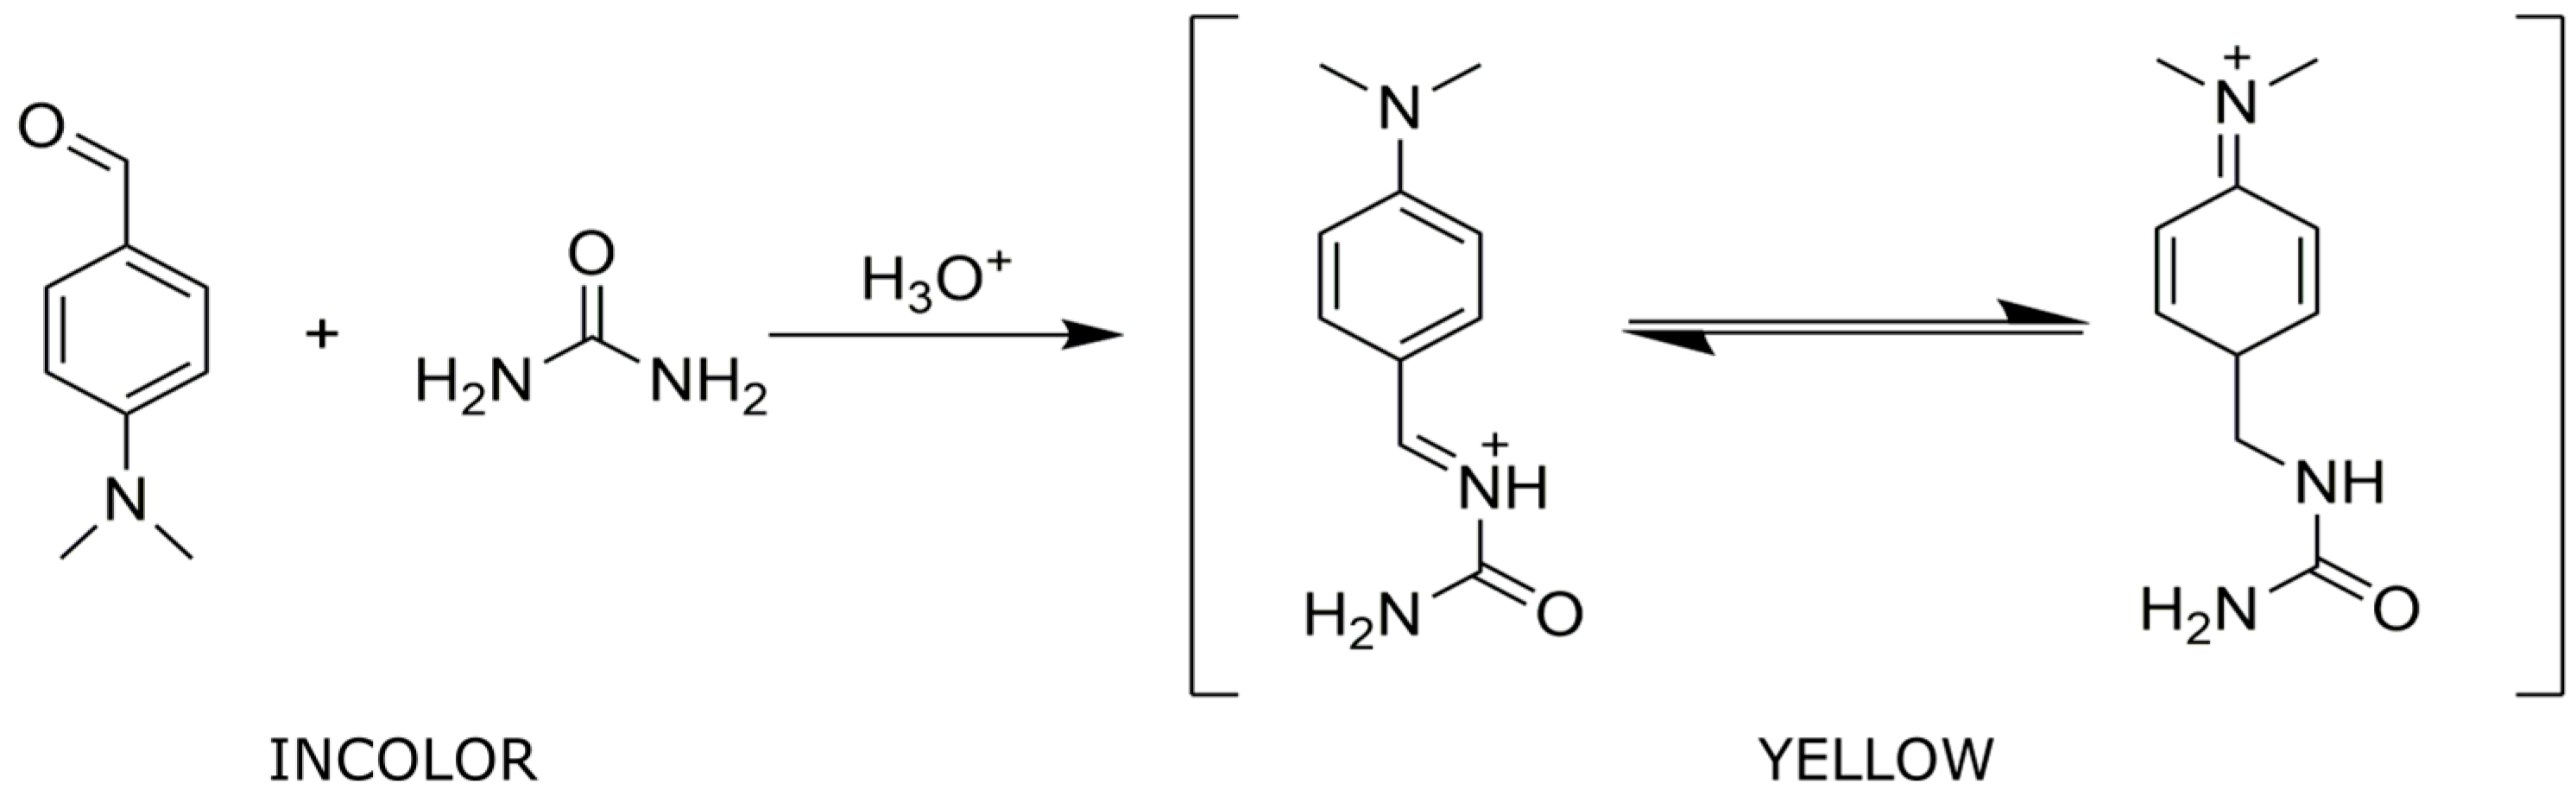
3.1. Optimization of the Spot Test Reaction for Urea Detection

The evaluation of the colorimetric reaction was performed using a paper-based spot test with a 5 mm diameter to achieve the optimum conditions. Initially, 4 µL of DMAB 1.6% solution was added to each filter paper spot followed by 4 µL of urea with concentrations ranging from 0.2 to 1.0%. A yellow product was instantaneously formed. The paper was left to dry for 3 min, and digital images were acquired using a flatbed scanner (HP Scanjet G4050). A flatbed scanner was used in the optimization step to acquire one digital image of multiple spot tests with one single scan. The color parameters were extracted as red (R), green (G), and blue (B) color model and—as can be seen in Figure 2—channel B resulted in the most appropriate linear relation between color intensity and urea concentration. This fact can be explained due to the absorption signature of the product with a maximum absorbance peak at 420 nm, which is related to the blue color. Moreover, suitable linearity was obtained in the concentration range of 0.2 to 1.0% of urea.

3.2. Optimization of the Spot Test Reaction for Water Hardness Detection

The interaction between Eriochrome Black T and Ca2+ and Mg2+ ions was selected to evaluate whether the urea solution was prepared by non-demineralized water, which is not indicated for diesel engines. Initially, 4 µL of the buffer at pH of 10 was added to the spot test followed by 4 µL of EBT. Then, 4 µL of the sample containing the metal ions was inserted. Digital images were acquired using a flatbed scanner, and RGB parameters were extracted and converted to HSV color space. This conversion is usually employed in digital-image-based methods and can contribute to achieving suitable linearity. A linear relation between Ca2+ and Mg2+ concentration and channel V was obtained in the range of 0.1 to 3.5 mM of the ions.

3.3. Analytical Parameters Using the Paper-Based Analytical Device

To act as a screening tool for on-site quality control of Urea-SCR samples, a paper-based analytical device was fabricated to enable both analytical tests to be performed simultaneously. The device was designed with one central zone related to the sample application linked to two detection zones containing each colorimetric reagent. After the injection, the sample reached both detection zones in less than 1 min, enabling the colorimetric reaction. A digital image was obtained using a smartphone and followed by color information extraction using appropriate software. All the analytical parameters were calculated using the color information extracted from the µPAD to evaluate its performance for each determination. Before each use, 1.5 µL of DMAB was added to the first detection zone, and 1.5 µL of ammonium buffer followed by 1.5 µL of EBT was added to the second detection zone. Six microliters of sample were added to the sample injection zone. The digital images were obtained by a smartphone, and RGB and HSV parameters were extracted using Image J. A calibration curve was obtained in the range of 0.2 to 1.0% of urea and 0.1 to 3.5 mmol L−1 of Ca2+ and Mg2+. Each concentration was evaluated in triplicate. The analytical parameters and performance for each determination using the paper-based analytical device are summarized in Table 1.

3.4. Accuracy Evaluation and Sample Analysis

The accuracy of the analytical determination was evaluated by calculating the recovery percentage of spiked solutions with different concentrations of urea and the metal ions, as demonstrated in Equation (1). As shown in Table 2, the recovery values were within the range of 91.5 to 115%, indicating that the analytical device has suitable accuracy for both assays, according to the international validation guidelines [22]. Therefore, the analytical performance of the proposed methodology is suitable for the determination of urea and water hardness in Urea-SCR samples.
R e c o v e r y   ( % ) = [ u r e a ] F o u n d × 100 [ u r e a ] A d d e d
Next, three samples of Urea-SCR products were evaluated using the described procedure. All the samples were acquired in local gas stations; the labels stated that the content of urea was 32%, and the product was prepared in demineralized water. One hundred and fifty microliters of each sample were diluted in 10 mL with deionized water; 6 µL of solution was added to the µPAD containing both reagents. The procedure was applied as described in the experimental section. The results are described in Table 3. It can be seen that all products meet the requirements in terms of urea concentration and demineralized water composition. Figure 3 shows a paper-based analytical device representing both assays employed for quality control of Urea-SCR products.

4. Discussion

The colorimetric determination of urea in AUS 32 samples was based on the selective reaction between urea and 4-dimethylaminobenzaldehyde. The reaction resulted from a nucleophilic attack of the nitrogen group of urea to an acid solution of DMAB and led to the formation of a yellow color Schiff base that absorbs light at 420 nm (see Figure 4). The selectivity of the methodology is reached by the fact that only urea can react with DMAB.
Additionally, the water hardness parameter was evaluated by determining the concentration of Mg2+ and Ca2+ ions after reaction with the Eriochrome Black T indicator (EBT). The EBT rapidly changes its color from blue to purple when complexed with these metal ions, as illustrated in Figure 5.
As demonstrated in Section 3.3 and Section 3.4, the analytical parameters obtained from the validation of the proposed methodology indicate that the quantification of urea and water hardness in Arla 32 samples can be performed with analytical reliability. Repeatability of both tests using standard solutions with RSD lower than 2% indicates that the method is precise and can be compared to instrumental techniques such as spectrometry or HPLC [5]. Recovery results were between 91.5 and 115%, indicating that some matrix effect should be present; however, a variation of ± 20% is accepted for quantitative analyses. The obtained sensitivities were suitable for the concentration range found in such products and, when compared to other techniques, the sample treatment is similar or simpler, considering that for HPLC analysis, the sample must be diluted with a mixture of water and acetonitrile [5,9]. The major improvement of our system is the possibility to perform both tests on the same device.

5. Conclusions

Urea-SCR products are highly important for mitigating air pollution effects related to NOx emission from vehicles fueled by diesel. In order to ensure the reliability of such products, continuous quality control monitoring must be performed in the industry and in the market. In this scenario, the development of portable, low-cost, miniaturized, and sensitive analytical devices is an essential demand. In this work, a green analytical method for the simultaneous quantification of urea and water hardness as quality control parameters of Urea-SCR products is presented for the first time. The analytical device was fabricated using filter paper with microfluidic channels to manipulate small volumes of the sample. Two colorimetric assays were adapted to produce colored products after interaction with urea and Ca2+ and Mg2+ ions. Only 1.6 µL of each reagent and 6 µL of the sample were employed in the assay, contributing to the green analytical chemistry field. It is important to note that the amount of 4-dimethylaminobenzaldehyde used in each analysis was very low (24 µg), and the filter paper was disposable; however, it should not be released directly into the environment. We suggest filter paper disposal be in a suitable container following local waste regulations to ensure complete and accurate classification. With the aid of a dedicated smartphone app, the methodology can be easily applied for on-site monitoring of Urea-SCR products, therefore being useful for screening routine quality-control tests and preventing adulteration events.

Author Contributions

Conceptualization, R.S., J.R.S.J. and J.F.d.S.P.; methodology, D.d.S.S., G.M.F., B.C.D. and J.F.d.S.P.; validation, D.d.S.S., G.M.F., B.C.D.; resources, R.S. and J.F.d.S.P.; writing—original draft preparation, D.d.S.S., G.M.F., B.C.D., R.S. and J.F.d.S.P.; writing—review and editing, R.S., J.R.S.J. and J.F.d.S.P.; supervision, J.F.d.S.P.; project administration, R.S. and J.F.d.S.P.; funding acquisition, R.S. and J.F.d.S.P. All authors have read and agreed to the published version of the manuscript.

Funding

The authors are grateful for the financial support provided by the Brazilian National Council for Scientific and Technological Development—CNPq (J.F.S.P. Proc. 428094/2018-0; R.S. 409971/2018-9).

Data Availability Statement

Not applicable.

Conflicts of Interest

The authors declare that they have no known competing financial interests or personal relationships that could have appeared to influence the work reported in this paper.

References

  1. Sorrels, J.L.; Randall, D.D.; Schaffner, K.S.; Fry, C.R. Selective Catalytic Reduction: Chapter 2, Section 4. In Air Pollution Control Cost Manual; EPA: Durham, NC, USA, 2019. Available online: https://www.epa.gov/economic-and-cost-analysis-air-pollution-regulations/cost-reports-and-guidance-air-pollution (accessed on 11 January 2022).
  2. ABNT (Brazilian Association of Technical Standards). Diesel Engines—NOx Reduction Agent AUS 32 Part 1: Quality Requirements; ABNT: Rio de Janeiro, Brazil, 2011; NBR ISO 22241-1. [Google Scholar]
  3. DE Verband der Automobilindustrie. Adblue Brand List and Licenses List. January 2022. Available online: https://en.vda.de/en/topics/innovation-and-technology/ad-blue/AdBlue-brand-list-and-licensees-list.html (accessed on 13 January 2022).
  4. Sorrels, J.L.; Randall, D.D.; Schaffner, K.S.; Fry, C.R. Chapter 2—Selective Catalytic Reduction. In Econ. Cost Anal. Air Pollut. Regul.; 2016. Available online: https://www.epa.gov/economic-and-cost-analysis-air-pollution-regulations/chapter-2-selective-catalytic-reduction (accessed on 11 January 2022).
  5. Fojtíková, P.; Kahoun, D.; Boček, J.; Burian, M.; Kupka, R.; Schwarz, J. Tracking AdBlue properties during tests of selective catalytic reduction (SCR) systems—The suitability of various analytical methods for urea content determination. Int. J. Energy Res. 2020, 44, 2549–2559. [Google Scholar] [CrossRef]
  6. Gurusamy, P.; Gandhi, U.; Mangalanathan, U.; Marx, K.L.R. Electrical Conductivity Based Quality Measurement of Diesel Exhaust Fluid. J. Anal. Chem. 2018, 73, 1128–1135. [Google Scholar] [CrossRef]
  7. Gurusamy, P.; Gandhi, U.; Mangalanathan, U. A study on optical characteristics and quality monitoring of diesel exhaust fluid. Optik 2018, 155, 31–35. [Google Scholar] [CrossRef]
  8. Pan, R.; Jeffries, J.B.; Dreier, T.; Schulz, C. Measurements of liquid film thickness, concentration, and temperature of aqueous urea solution by NIR absorption spectroscopy. Appl. Phys. B 2016, 122, 2–10. [Google Scholar] [CrossRef]
  9. França, H.H.; Silva, N.C.; Honorato, F.A. Evaluation of diesel exhaust fluid (DEF) using near-infrared spectroscopy and multivariate calibration. Microchem. J. 2019, 150, 1–5. [Google Scholar] [CrossRef]
  10. Yassine, M.M.; Dabek-Zlotorzynska, E.; Celo, V. Development of a hydrophilic interaction liquid chromatography-mass spectrometry method for detection and quantification of urea thermal decomposition by-products in emission from diesel engine employing selective catalytic reduction technology. J. Chromatogr. A 2012, 1229, 208–215. [Google Scholar] [CrossRef] [PubMed]
  11. Xie, W.Q.; Yu, K.X.; Gong, Y.X. Rapid and quantitative determination of urea in milk by reaction headspace gas chromatography. Microchem. J. 2019, 147, 838–841. [Google Scholar] [CrossRef]
  12. Polcar, A.; Cupera, J.; Kumbár, V.; Dostál, P.; Votava, J. Influence of urea concentration of refractive index of adblue fluid evaluated by regression analysis. Acta Agric. Silvic. Mendelianae Brun 2016, 64, 509–515. [Google Scholar] [CrossRef] [Green Version]
  13. Paula, W.F.; Demarchi, P.H.; Teste, A. Blucher Engineering Proceedings. In Proceedings of the XXIV Simpósio International de Engenharia Automotiva—SIMEA, São Paulo, Brazil, 5–6 September 2016; Blucher: São Paulo, Brazil, 2016; Volume 3, pp. 742–759. [Google Scholar]
  14. da Silva, V.A.O.P.; de Freitas, R.C.; de Oliveira, P.R.; Moreira, R.C.; Marcolino-Júnior, L.H.; Bergamini, M.F.; Coltro, W.K.T.; Janegitz, B.C. Microfluidic paper-based device integrated with smartphone for point-of-use colorimetric monitoring of water quality index. Meas. J. Int. Meas. Confed. 2020, 164, 108085. [Google Scholar] [CrossRef]
  15. Petruci, J.F.S.; Cardoso, A.A. Sensitive luminescent paper-based sensor for the determination of gaseous hydrogen sulfide. Anal. Methods 2015, 7, 2687–2692. [Google Scholar] [CrossRef]
  16. Fernandes, G.M.; Sousa, J.; Petruci, J.F.S.; Batista, A.D. Paper-based analytical device for colorimetric detection of Cu2+ in Brazilian sugarcane spirits by digital image treatment. Microchem. J. 2020, 159, 105463. [Google Scholar] [CrossRef]
  17. Capitán-Vallvey, L.F.; López-Ruiz, N.; Martínez-Olmos, A.; Erenas, M.M.; Palma, A.J. Recent developments in computer vision-based analytical chemistry: A tutorial review. Anal. Chim. Acta 2015, 899, 23–56. [Google Scholar] [CrossRef] [PubMed]
  18. Fernandes, G.M.; Silva, W.R.; Barreto, D.N.; Lamarca, R.S.; Lima Gomes, P.C.F.; Petruci, J.F.d.S.; Batista, A.D. Novel approaches for colorimetric measurements in analytical chemistry—A review. Anal. Chim. Acta 2020, 1135, 187–203. [Google Scholar] [CrossRef] [PubMed]
  19. Martinez, A.W.; Phillips, S.T.; Whitesides, G.M. Diagnostics for the Developing World: Microfluidic Paper-Based Analytical Devices. Anal. Chem. 2010, 82, 3–10. [Google Scholar] [CrossRef] [PubMed]
  20. Giraldo, J.D.; Rivas, B.L. Determination of urea using p-N,N-dimethylaminobenzaldehyde: Solvent effect and interference of chitosan. J. Chil. Chem. Soc. 2017, 62, 3538–3542. [Google Scholar] [CrossRef] [Green Version]
  21. Carrilho, E.; Martinez, A.W.; Whitesides, G.M. Understanding wax printing: A simple micropatterning process for paper-based microfluidics. Anal. Chem. 2009, 81, 7091–7095. [Google Scholar] [CrossRef] [PubMed]
  22. ICH. Harmonised Tripartite Guidelines. Validation of Analytical Procedures: Text and Methodology Q2(R1). 2005. Available online: https://database.ich.org/sites/default/files/Q2%28R1%29%20Guideline.pdf (accessed on 11 January 2022).
Figure 1. Illustrative design of the paper-based microfluidic device (μPAD) tailored for the determination of urea (1) and water hardness (2).
Sustainability 14 03363 g001
Figure 2. Relation between RGB color space and urea concentration after the colorimetric reaction with 4-dimethylaminobenzaldehyde.
Sustainability 14 03363 g002
Figure 3. Illustrative representation of the paper-based analytical device for adulteration inspection and quality control of Urea-SCR products.
Sustainability 14 03363 g003
Figure 4. Reaction between 4-dimethylaminobenzaldehyde and urea generating a yellow color product, performed on the paper surface.
Sustainability 14 03363 g004
Figure 5. Reaction between Eriochrome Black T and calcium (II) and magnesium (II) ions; performed on the paper surface.
Sustainability 14 03363 g005
Table 1. Analytical parameters for the determination of urea and water hardness using the paper-based analytical device.
UreaWater Hardness
Linear range0.2–1.0%0.1–3.5 mM
Color channelChannel B (RGB)Channel V (HSV)
Calibration curvey = −63.8x + 207.8y = 0.035x + 0.611
R20.9920.993
Repeatability (RSD) (n = 9)1.5% (0.2% urea)1.7% (2.5 mM)
Limit of Detection0.2%0.02 mM
Table 2. Recovery experiments for the determination of urea and water hardness to evaluate the accuracy of the developed method.
UreaWater Hardness
Added (% m/v)Found (% m/v)Recovery (%)Added (mM)Found (mM)Recovery (%)
Sample 10.20.19 ± 0.0295.1 ± 8.60.1 0.122122.2 ± 1.6
Sample 20.50.58 ± 0.03115.3 ± 5.12.52.7107.9 ± 6.5
Sample 31.01.09 ± 0.03109.4 ± 2.73.53.291.5 ± 2.1
Table 3. Determination of urea and water hardness in Brazilian Urea-SCR products acquired in the local market.
UreaWater Hardness
Sample 130.1 ± 0.5%Not detected
Sample 232.6 ± 2.0%Not detected
Sample 333.3 ± 1.5%Not detected
Publisher’s Note: MDPI stays neutral with regard to jurisdictional claims in published maps and institutional affiliations.

