
Modified Harmony Search Algorithm-Based Optimization for Eco-Friendly Reinforced Concrete Frames


Abstract
1. Introduction
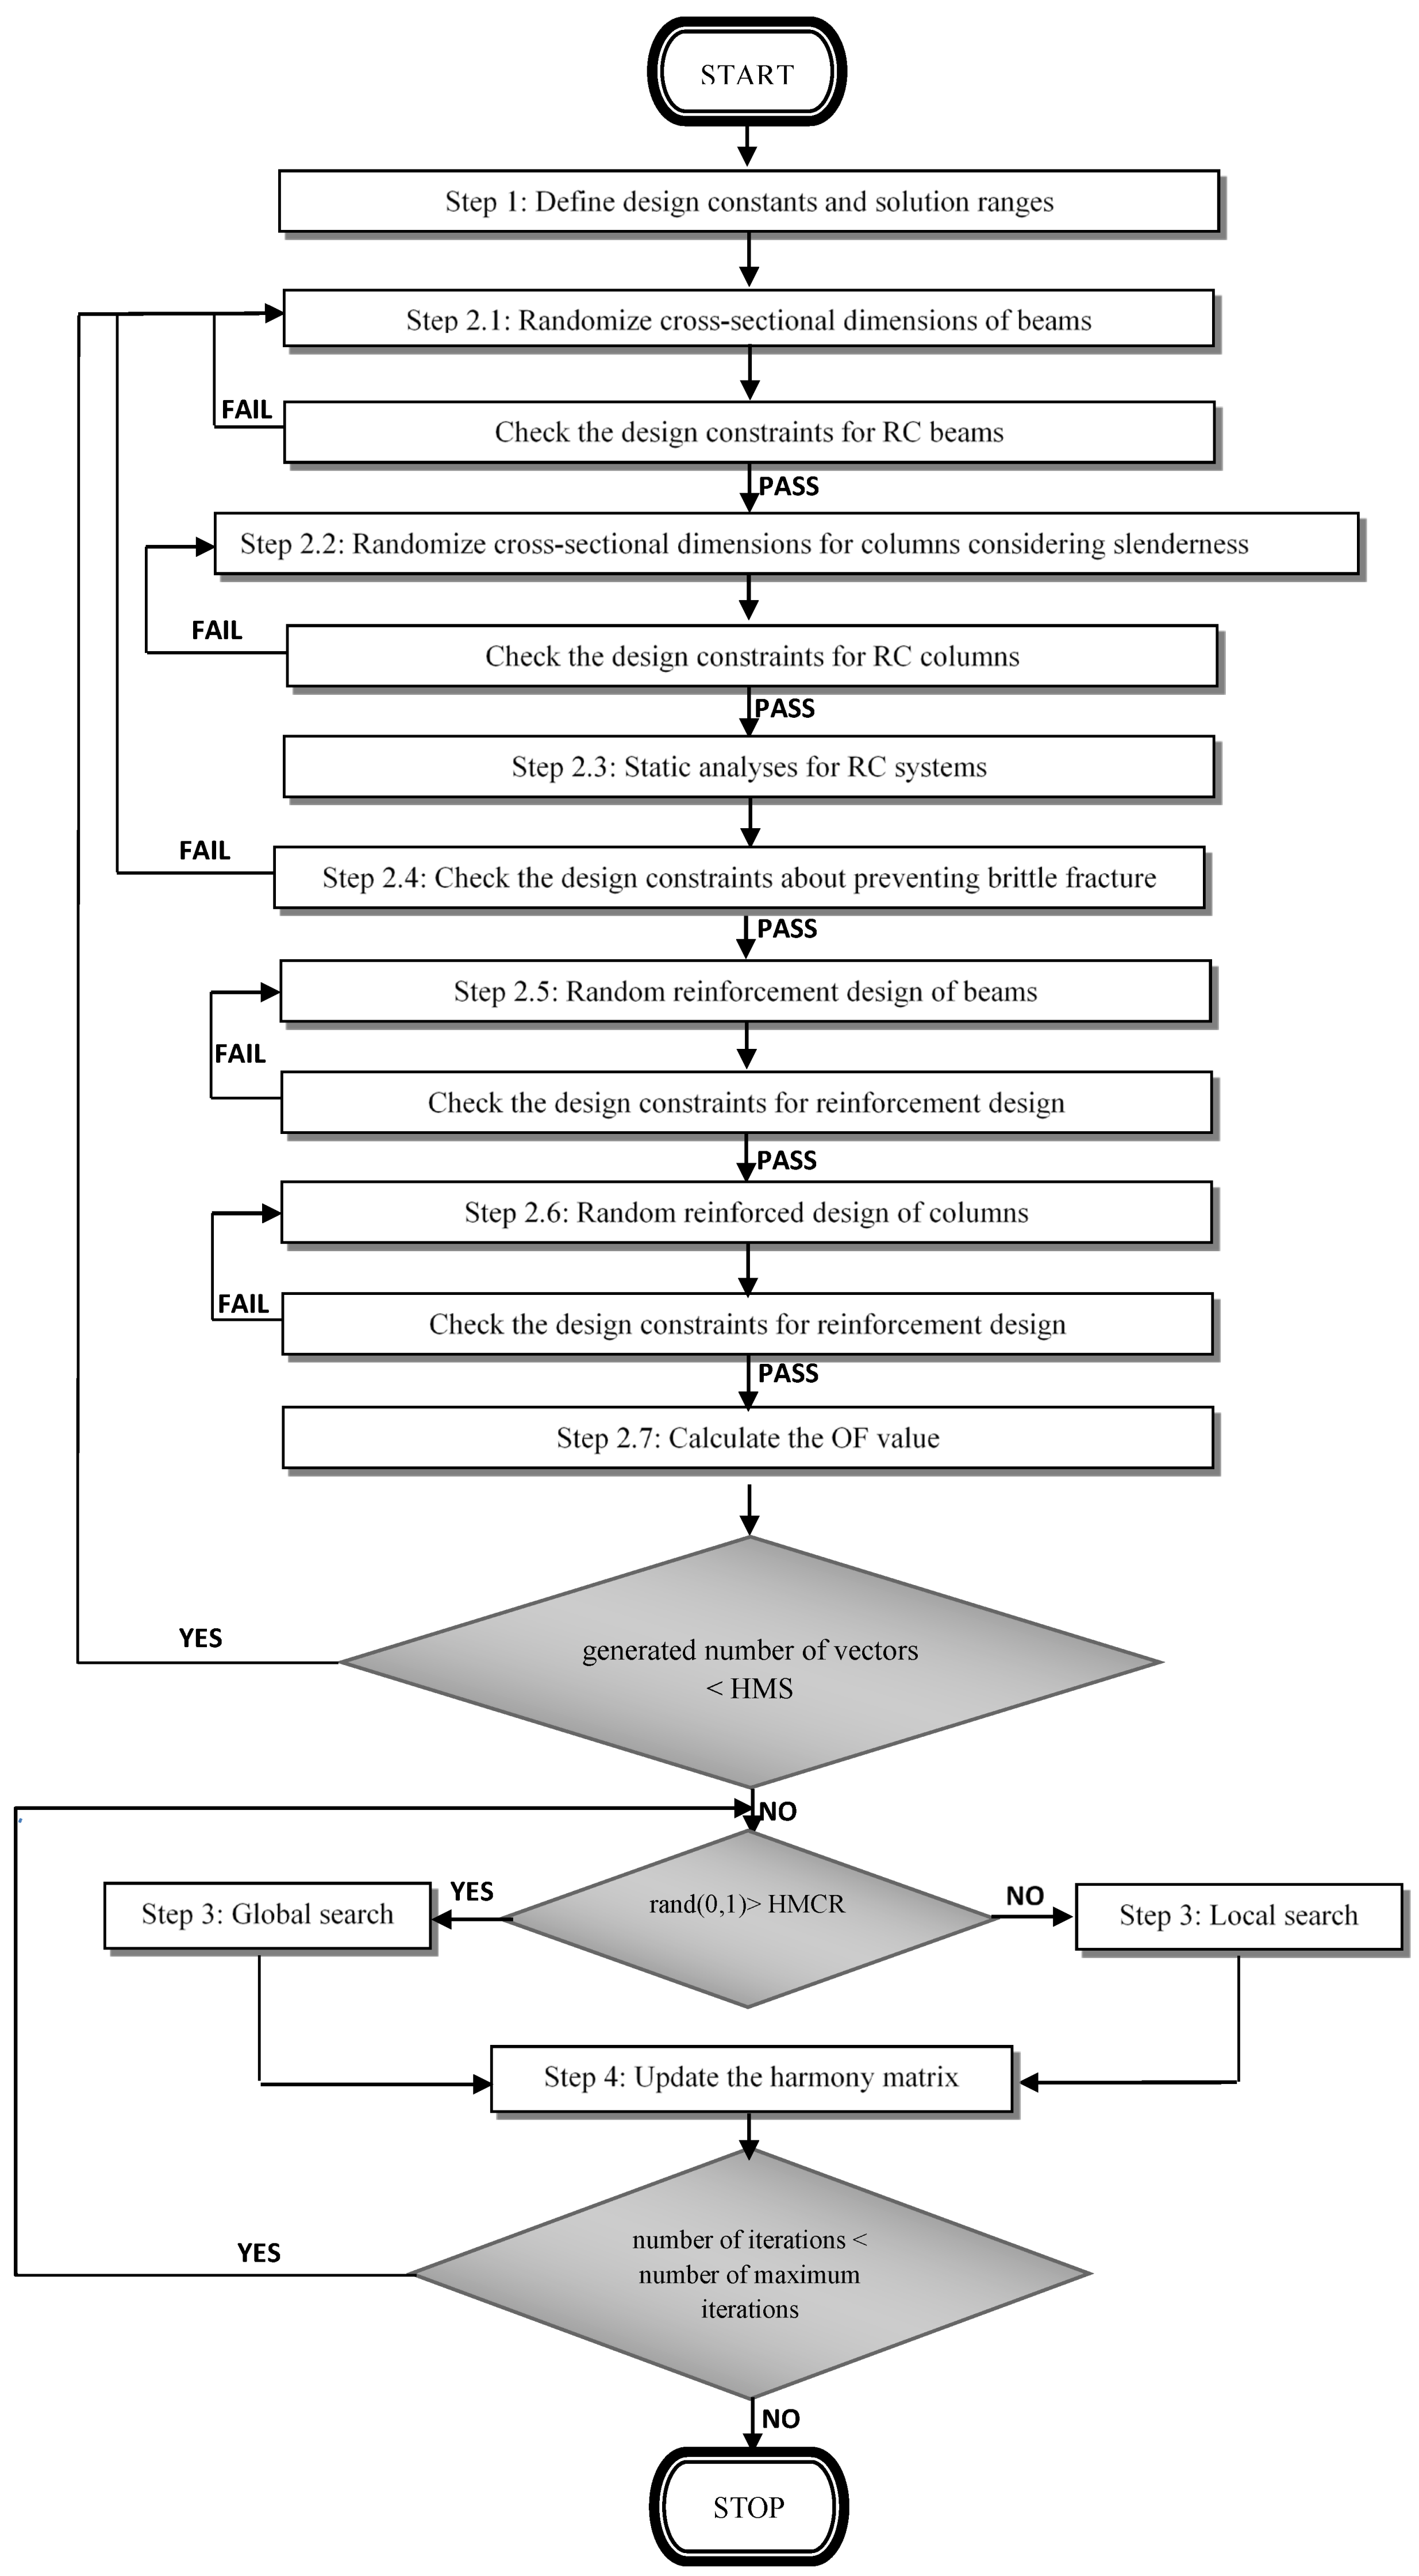
2. Methods
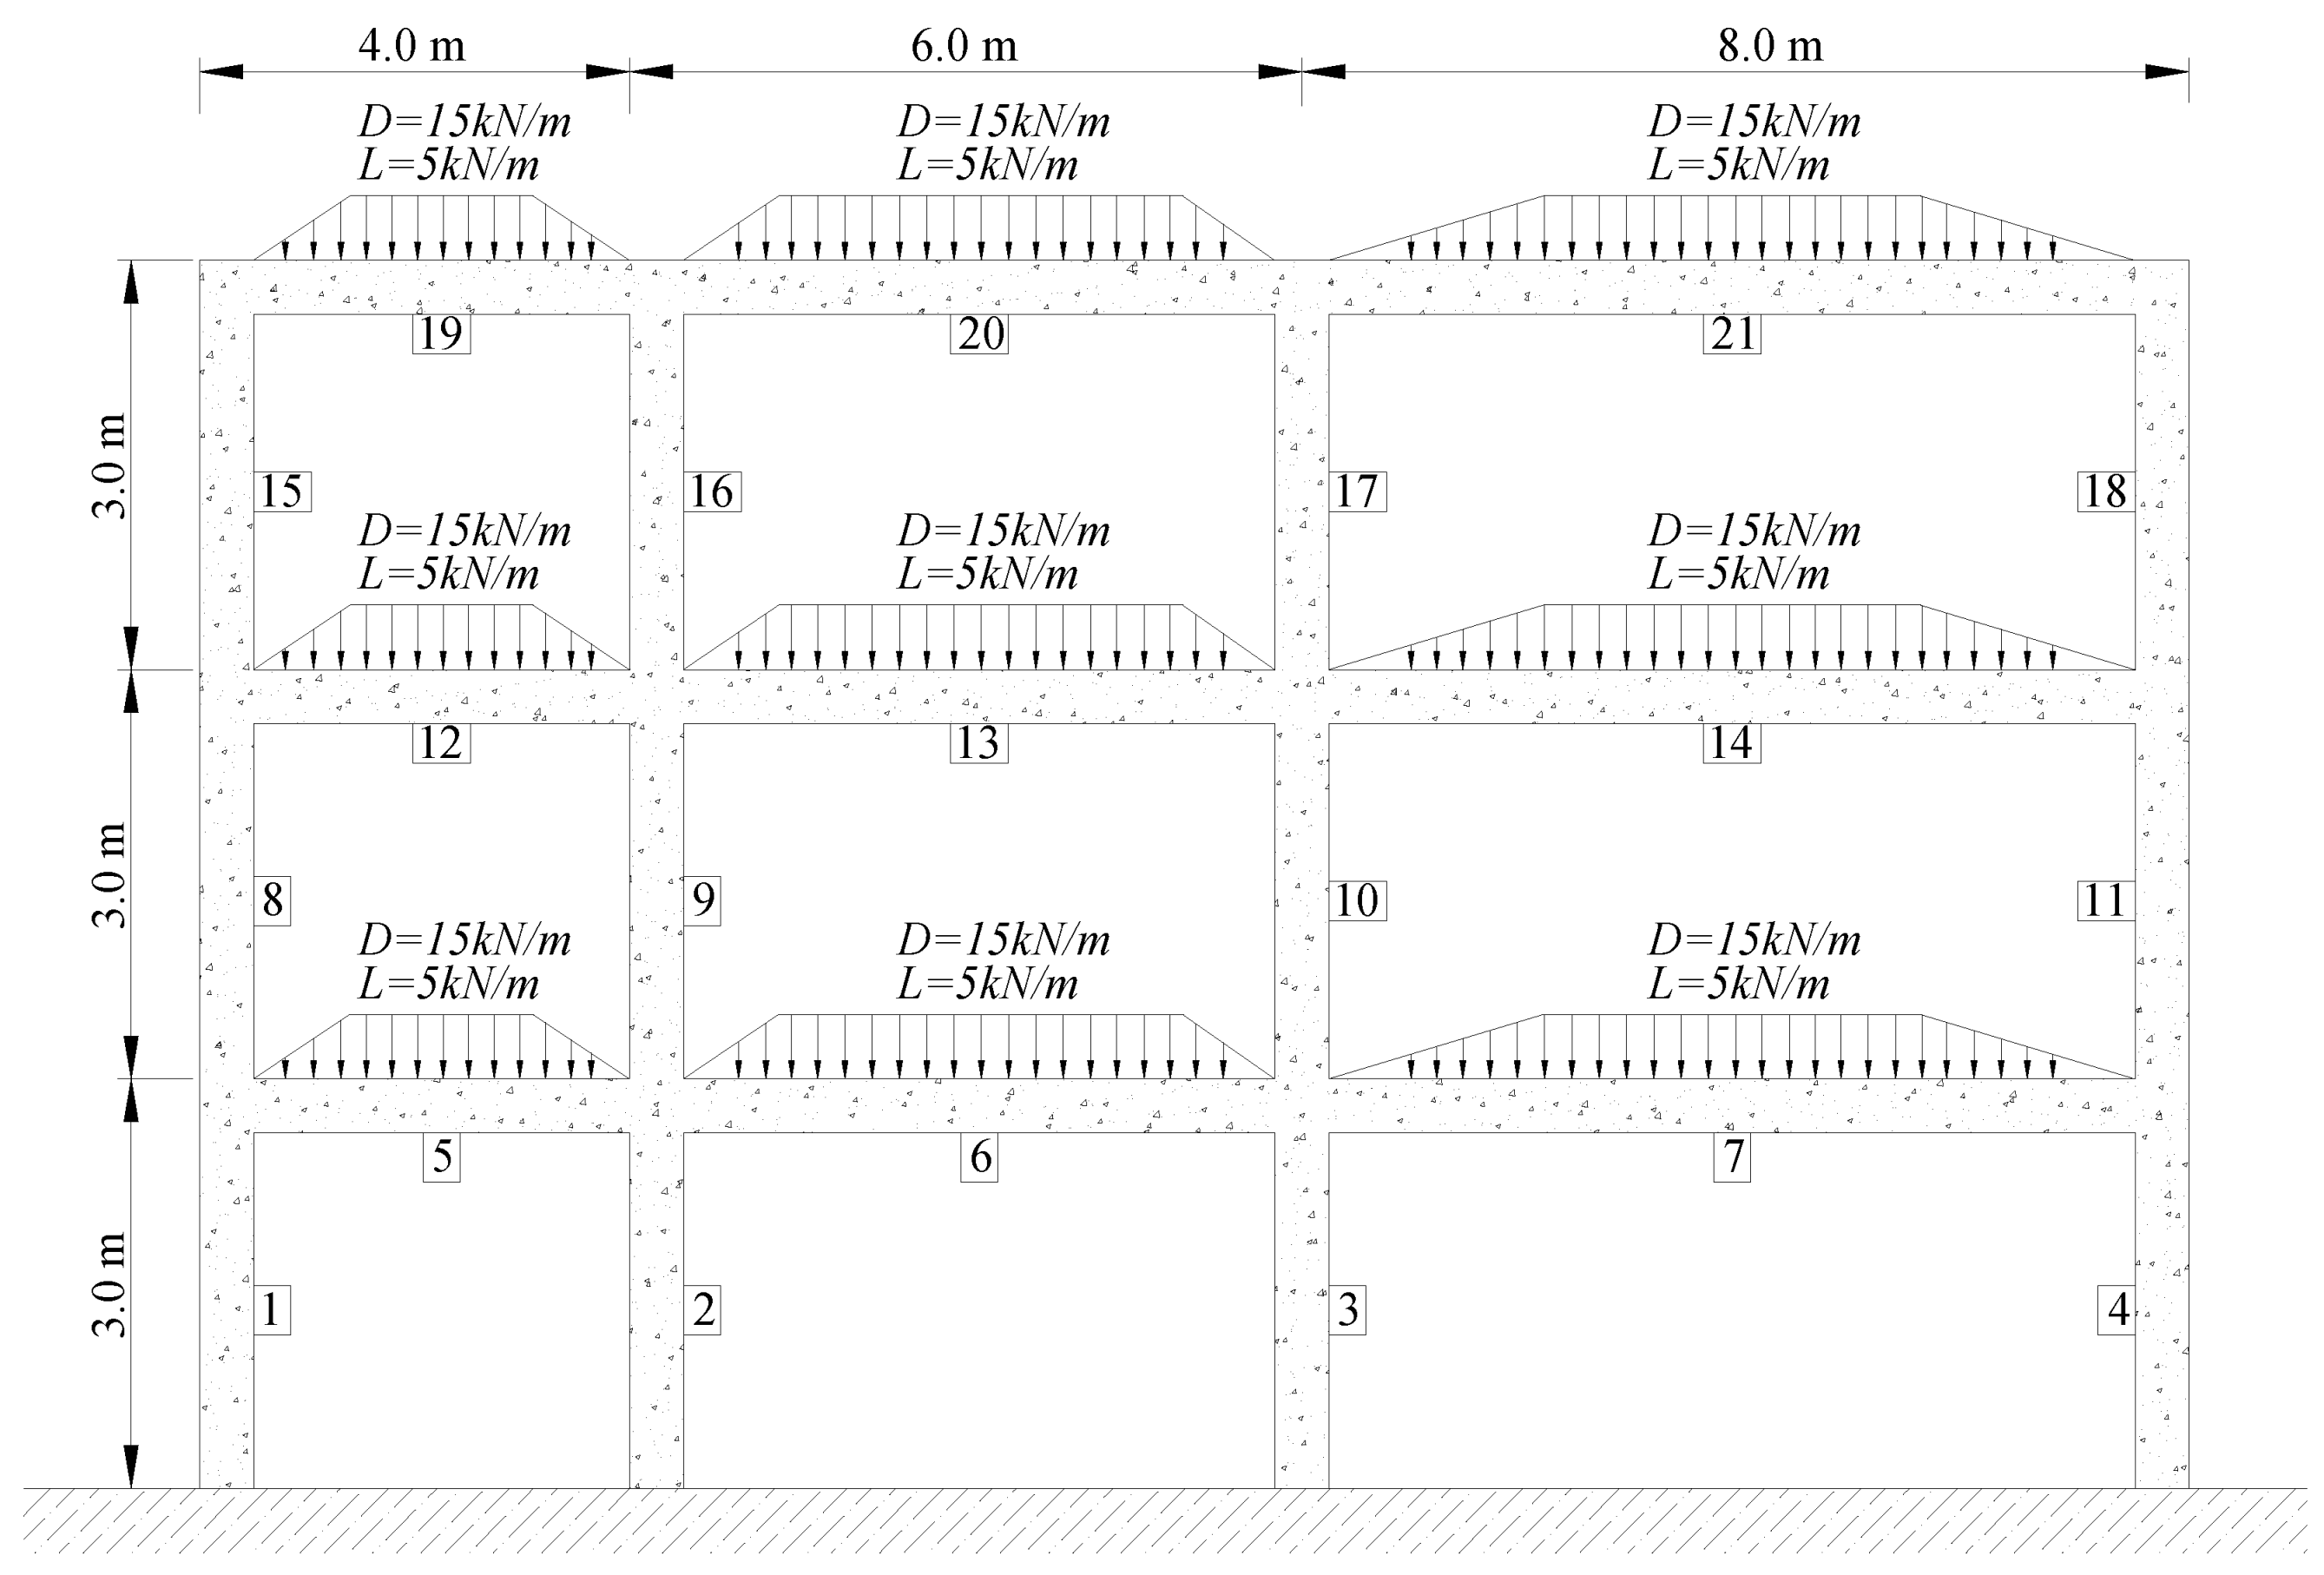
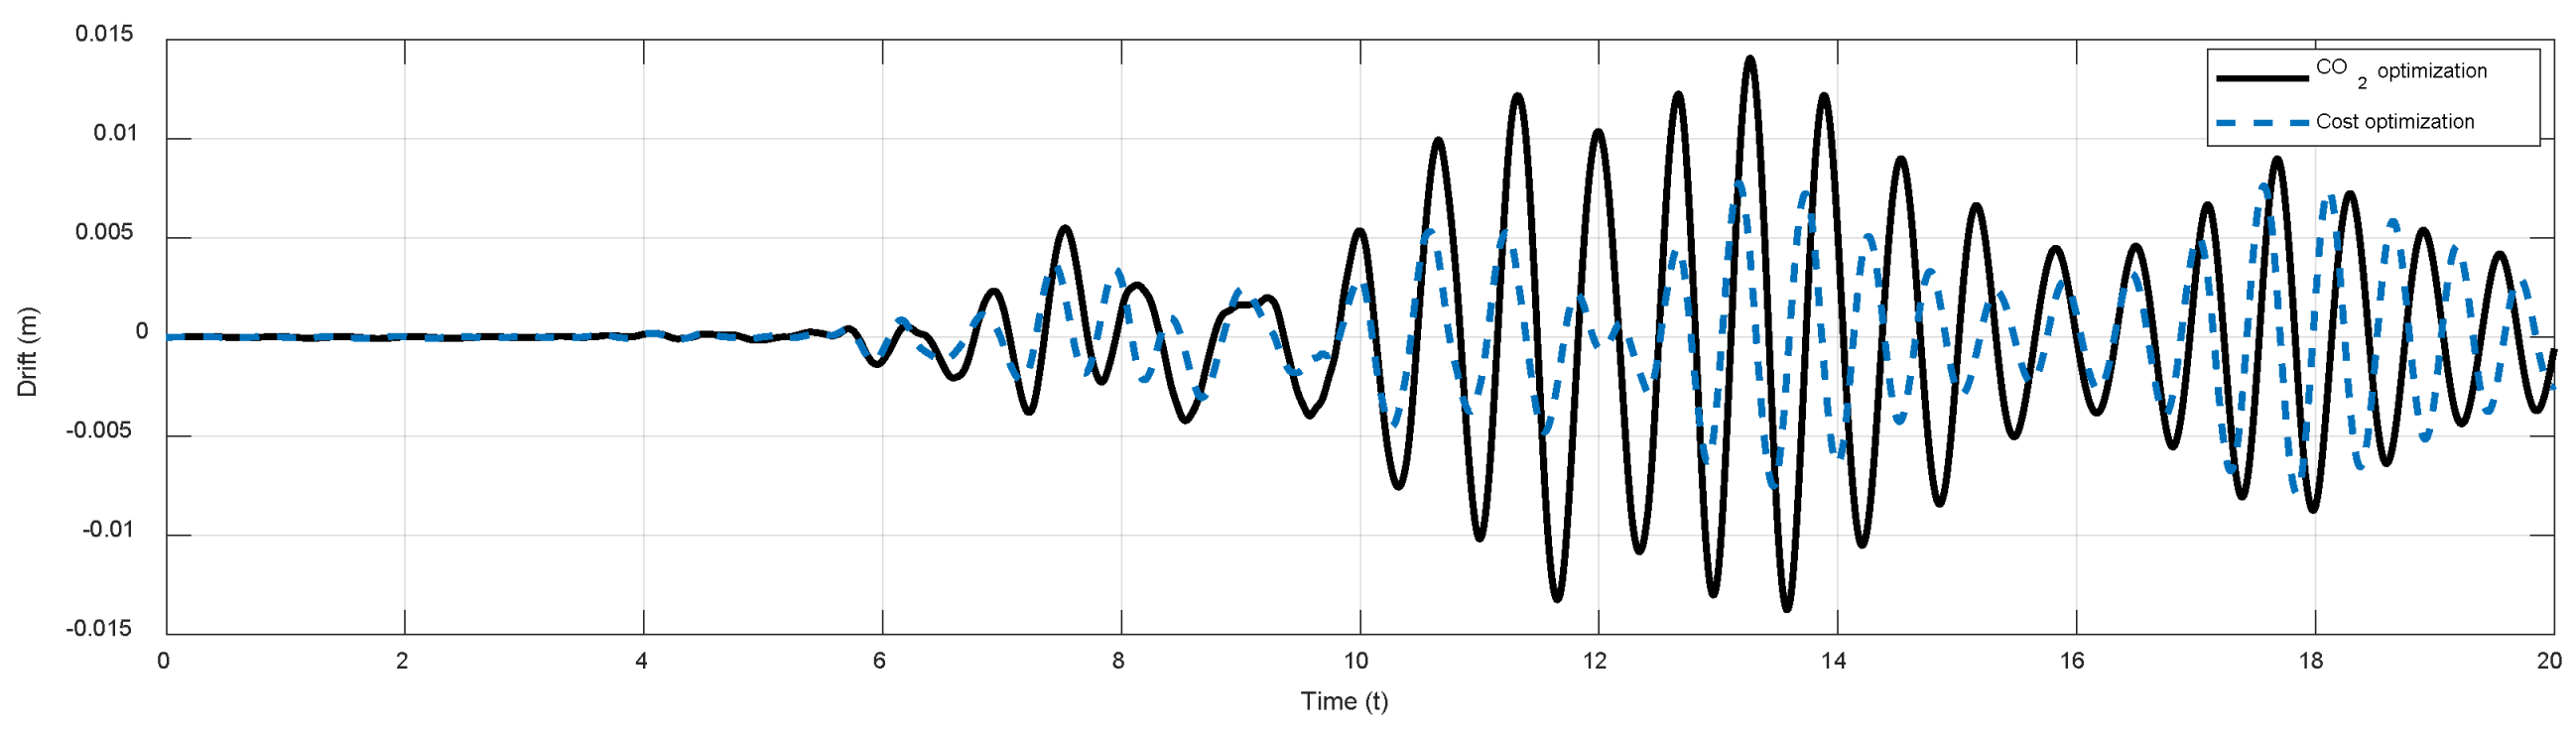
3. Results
4. Conclusions
Author Contributions
Funding
Institutional Review Board Statement
Informed Consent Statement
Data Availability Statement
Conflicts of Interest
References
- Kayabekir, A.E.; Bekdaş, G.; Nigdeli, S.M. Metaheuristic Approaches for Optimum Design of Reinforced Concrete Structures: Emerging Research and Opportunities; IGI Global: Hershey, PA, USA, 2020. [Google Scholar] [CrossRef]
- Adeli, H.; Sarma, K. Cost Optimization of Structures—Fuzzy Logic, Genetic Algorithms, and Parallel Computing; John Wiley and Sons: West Sussex, UK, 2006. [Google Scholar]
- Coello, C.C.; Hernandez, F.S.; Farrera, F.A. Optimal Design of Reinforced Concrete Beams Using Genetic Algorithms. Expert Syst. Appl. 1997, 12, 101–108. [Google Scholar] [CrossRef]
- Rafiq, M.Y.; Southcombe, C. Genetic algorithms in optimal design and detailing of reinforced concrete biaxial columns supported by a declarative approach for capacity checking. Comput. Struct. 1998, 69, 443–457. [Google Scholar] [CrossRef]
- Koumousis, V.K.; Arsenis, S.J. Genetic Algorithms in Optimal Detailed Design of Reinforced Concrete Members. Comput.-Aided Civ. Inf. Eng. 1998, 13, 43–52. [Google Scholar] [CrossRef]
- Rajeev, S.; Krishnamoorthy, C.S. Genetic Algorithm–Based Methodology for Design Optimization of Reinforced Concrete Frames. Comput.-Aided Civ. Inf. Eng. 1998, 13, 63–74. [Google Scholar] [CrossRef]
- Rath, D.P.; Ahlawat, A.S.; Ramaswamy, A. Shape Optimization of RC Flexural Members. J. Struct. Eng.-ASCE 1999, 125, 1439–1446. [Google Scholar] [CrossRef]
- Camp, C.V.; Pezeshk, S.; Hansson, H. Flexural Design of Reinforced Concrete Frames Using a Genetic Algorithm. J. Struct. Eng.-ASCE 2003, 129, 105–111. [Google Scholar] [CrossRef]
- Leps, M.; Sejnoha, M. New approach to optimization of reinforced concrete beams. Comput. Struct. 2003, 81, 1957–1966. [Google Scholar] [CrossRef]
- Lee, C.; Ahn, J. Flexural Design of Reinforced Concrete Frames by Genetic Algorithm. J. Struct. Eng.-ASCE 2003, 129, 762–774. [Google Scholar] [CrossRef]
- Govindaraj, V.; Ramasamy, J.V. Optimum detailed design of reinforced concrete continuous beams using Genetic Algorithms. Comput. Struct. 2005, 84, 34–48. [Google Scholar] [CrossRef]
- Sahab, M.G.; Ashour, A.F.; Toropov, V.V. Cost optimization of reinforced concrete flat slab buildings. Eng. Struct. 2005, 27, 313–322. [Google Scholar] [CrossRef]
- Govindaraj, V.; Ramasamy, J.V. Optimum detailed design of reinforced concrete frames using genetic algorithms. Eng. Optimiz. 2007, 39, 471–494. [Google Scholar] [CrossRef]
- Park, H.S.; Kwon, B.; Shin, Y.; Kim, Y.; Hong, T.; Choi, S.W. Cost and CO2 emission optimization of steel reinforced concrete columns in high-rise buildings. Energies 2013, 6, 5609–5624. [Google Scholar] [CrossRef]
- Lee, M.S.; Hong, K.; Choi, S.W. Genetic Algorithm Based Optimal Structural Design Method for Cost and CO2 Emissions of Reinforced Concrete Frames. J. Comput. Struct. Eng. Inst. Korea 2016, 29, 429–436. [Google Scholar] [CrossRef]
- Mergos, P.E. Seismic design of reinforced concrete frames for minimum embodied CO2 emissions. Energy Build. 2018, 162, 177–186. [Google Scholar] [CrossRef]
- Akin, A.; Saka, M.P. Harmony search algorithm based optimum detailed design of reinforced concrete plane frames subject to ACI 318-05 provisions. Comput. Struct. 2015, 147, 79–95. [Google Scholar] [CrossRef]
- American Concrete Institute Committee. ACI 318-14, Building Code Requirements for Structural Concrete and Commentary; American Concrete Institute: Farmington Hills, MI, USA, 2014. [Google Scholar]
- Nigdeli, S.M.; Bekdas, G.; Kim, S.; Geem, Z.W. A novel harmony search based optimization of reinforced concrete biaxially loaded columns. Struct. Eng. Mech. Int. J. 2015, 54, 1097–1109. [Google Scholar] [CrossRef]
- Bekdaş, G. Harmony search algorithm approach for optimum design of post-tensioned axially symmetric cylindrical reinforced concrete walls. J. Optim. Theory Appl. 2015, 164, 342–358. [Google Scholar] [CrossRef]
- García-Segura, T.; Yepes, V.; Alcalá, J.; Pérez-López, E. Hybrid harmony search for sustainable design of post-tensioned concrete box-girder pedestrian bridges. Eng. Struct. 2015, 92, 112–122. [Google Scholar] [CrossRef]
- Bekdaş, G.; Nigdeli, S.M. Modified harmony search for optimization of reinforced concrete frames. In Proceedings of the 3rd International Conference on the Harmony Search Algorithm, Bilbao, Spain, 22–24 February 2017; Springer: Singapore, 2017; pp. 213–221. [Google Scholar]
- Medeiros, G.F.; Kripka, M. Modified harmony search and its application to cost minimization of RC columns. Adv. Comput. Des. 2017, 2, 1–13. [Google Scholar] [CrossRef]
- Shaqfa, M.; Orbán, Z. Modified parameter-setting-free harmony search (PSFHS) algorithm for optimizing the design of reinforced concrete beams. Struct. Multidiscip. Optim. 2019, 60, 999–1019. [Google Scholar] [CrossRef]
- Kayabekir, A.E.; Arama, Z.A.; Bekdaş, G.; Nigdeli, S.M.; Geem, Z.W. Eco-friendly design of reinforced concrete retaining walls: Multi-objective optimization with harmony search applications. Sustainability 2020, 12, 6087. [Google Scholar] [CrossRef]
- Yücel, M.; Kayabekir, A.E.; Bekdaş, G.; Nigdeli, S.M.; Kim, S.; Geem, Z.W. Adaptive-Hybrid Harmony Search Algorithm for Multi-Constrained Optimum Eco-Design of Reinforced Concrete Retaining Walls. Sustainability 2021, 13, 1639. [Google Scholar] [CrossRef]
- Bekdaş, G.; Arama, Z.A.; Kayabekir, A.E.; Geem, Z.W. Optimal design of cantilever soldier pile retaining walls embedded in frictional soils with harmony search algorithm. Appl. Sci. 2020, 10, 3232. [Google Scholar] [CrossRef]
- Arama, Z.A.; Kayabekir, A.E.; Bekdaş, G.; Geem, Z.W. CO2 and cost optimization of reinforced concrete cantilever soldier piles: A parametric study with harmony search algorithm. Sustainability 2020, 12, 5906. [Google Scholar] [CrossRef]
- Kayabekir, A.E.; Nigdeli, S.M.; Bekdaş, G. Adaptive Harmony Search for Cost Optimization of Reinforced Concrete Columns. In Proceedings of the International Conference on Intelligent Computing & Optimization, Hua Lin, Thailand, 30–31 December 2021; Springer: Cham, Switzerland, 2021; pp. 35–44. [Google Scholar]
- Nigdeli, S.M.; Bekdaş, G.; Yang, X.S. Metaheuristic optimization of reinforced concrete footings. KSCE J. Civ. Eng. 2018, 22, 4555–4563. [Google Scholar] [CrossRef]
- Esfandiari, M.J.; Urgessa, G.S.; Sheikholarefin, S.; Manshadi, S.D. Optimization of reinforced concrete frames subjected to historical time-history loadings using DMPSO algorithm. Struct. Multidiscip. Optim. 2018, 58, 2119–2134. [Google Scholar] [CrossRef]
- Afshari, H.; Hare, W.; Tesfamariam, S. Constrained multi-objective optimization algorithms: Review and comparison with application in reinforced concrete structures. Appl. Soft Comput. 2019, 83, 105631. [Google Scholar] [CrossRef]
- Mergos, P.E.; Mantoglou, F. Optimum design of reinforced concrete retaining walls with the flower pollination algorithm. Struct. Multidiscip. Optim. 2020, 61, 575–585. [Google Scholar] [CrossRef]
- Esra, U.R.A.Y.; Çarbaş, S. Dynamic Loads and Different Soil Characteristics Examination on Optimum Design of Cantilever Retaining Walls Utilizing Harmony Search Algorithm. Int. J. Eng. Appl. Sci. 2021, 13, 140–154. [Google Scholar]
- Sánchez-Olivares, G.; Tomás, A. Optimization of Reinforced Concrete Sections under Compression and Biaxial Bending by Using a Parallel Firefly Algorithm. Appl. Sci. 2021, 11, 2076. [Google Scholar] [CrossRef]
- Camp, C.V.; Assadollahi, A. CO2 and cost optimization of reinforced concrete footings using a hybrid big bang-big crunch algorithm. Struct. Multidiscip. Optim. 2013, 48, 411–426. [Google Scholar] [CrossRef]
- Paya-Zaforteza, I.; Yepes, V.; Hospitaler, A.; Gonzalez-Vidosa, F. CO2-optimization of reinforced concrete frames by simulated annealing. Eng. Struct. 2009, 31, 1501–1508. [Google Scholar] [CrossRef]
- Camp, C.V.; Huq, F. CO2 and cost optimization of reinforced concrete frames using a big bang-big crunch algorithm. Eng. Struct. 2013, 48, 363–372. [Google Scholar] [CrossRef]
- Geem, Z.W.; Kim, J.H.; Loganathan, G.V. Harmony search optimization: Application to pipe network design. Int. J. Model. Simul. 2002, 22, 125–133. [Google Scholar] [CrossRef]
- Mathworks, MATLAB R2010a; The MathWorks Inc.: Natick, MA, USA, 2010.
- PEER. Pacific Earthquake Engineering Resource Center: NGA Database. University of California, Berkeley. 2005. Available online: http://peer.berkeley.edu/nga (accessed on 10 November 2011).
- Yeo, D.H.; Potra, F.A. Sustainable design of reinforced concrete structures through CO2 emission optimization. J. Struct. Eng. 2015, 141, 3. [Google Scholar] [CrossRef]


| Earthquake | Date | Station | Component | PGA(g) |
|---|---|---|---|---|
| Imperial Valley | 1940 | 117 El Centro | I-ELC180 | 0.313 |
| Northridge | 1994 | 24514 Sylmar | SYL360 | 0.843 |
| Loma Prieta | 1989 | 16 LGPC | LGP000 | 0.563 |
| Definition | Symbol | Unit | Value |
|---|---|---|---|
| Range of web width | bw | mm | 250–400 |
| Range of height | h | mm | 300–600 |
| Clear cover | cc | mm | 30 |
| Range of reinforcement | ϕ | mm | 16–30 |
| Range of shear reinforcement | ϕv | mm | 8–14 |
| Max. aggregate diameter | Dmax | mm | 16 |
| Yield strength of steel | fy | MPa | 420 |
| Comp. strength of concrete | MPa | 30 | |
| Elasticity modulus of steel | Es | MPa | 200,000 |
| Specific gravity of steel | γs | t/m3 | 7.86 |
| Specific gravity of concrete | γc | t/m3 | 2.5 |
| Elastic response parameter | R | - | 8.5 |
| Cost of concrete per m3 | Cc | $ | 50 |
| Cost of steel per ton | Cs | $ | 750 |
| CO2 emissions of concrete per m3 | Cc,co2 | kg | 376 |
| CO2 emissions of steel per ton | Cs,co2 | kg | 352 |
| Cost Optimization | CO2 Optimization | |||
|---|---|---|---|---|
| Element Number | bw (mm) | h (mm) | bw (mm) | h (mm) |
| 1 | 0.25 | 0.40 | 0.25 | 0.30 |
| 2 | 0.25 | 0.40 | 0.25 | 0.35 |
| 3 | 0.25 | 0.40 | 0.25 | 0.35 |
| 4 | 0.25 | 0.40 | 0.25 | 0.30 |
| 5 | 0.25 | 0.30 | 0.25 | 0.30 |
| 6 | 0.25 | 0.30 | 0.25 | 0.30 |
| 7 | 0.25 | 0.35 | 0.25 | 0.35 |
| 8 | 0.25 | 0.40 | 0.25 | 0.30 |
| 9 | 0.25 | 0.40 | 0.25 | 0.30 |
| 10 | 0.25 | 0.40 | 0.25 | 0.30 |
| 11 | 0.25 | 0.40 | 0.25 | 0.30 |
| 12 | 0.25 | 0.35 | 0.25 | 0.35 |
| 13 | 0.25 | 0.40 | 0.25 | 0.40 |
| 14 | 0.25 | 0.40 | 0.25 | 0.40 |
| 15 | 0.25 | 0.40 | 0.25 | 0.30 |
| 16 | 0.25 | 0.40 | 0.25 | 0.30 |
| 17 | 0.25 | 0.40 | 0.25 | 0.30 |
| 18 | 0.25 | 0.40 | 0.25 | 0.30 |
| 19 | 0.25 | 0.40 | 0.25 | 0.40 |
| 20 | 0.25 | 0.40 | 0.25 | 0.40 |
| 21 | 0.25 | 0.40 | 0.25 | 0.40 |
| CO2 (kg/m3) | 3597.24 | 3308.09 | ||
| Cost (USD) | 1241.62 | 1260.43 | ||
Publisher’s Note: MDPI stays neutral with regard to jurisdictional claims in published maps and institutional affiliations. |
© 2022 by the authors. Licensee MDPI, Basel, Switzerland. This article is an open access article distributed under the terms and conditions of the Creative Commons Attribution (CC BY) license (https://creativecommons.org/licenses/by/4.0/).
Share and Cite
Bekdaş, G.; Nigdeli, S.M.; Kim, S.; Geem, Z.W. Modified Harmony Search Algorithm-Based Optimization for Eco-Friendly Reinforced Concrete Frames. Sustainability 2022, 14, 3361. https://doi.org/10.3390/su14063361
Bekdaş G, Nigdeli SM, Kim S, Geem ZW. Modified Harmony Search Algorithm-Based Optimization for Eco-Friendly Reinforced Concrete Frames. Sustainability. 2022; 14(6):3361. https://doi.org/10.3390/su14063361
Chicago/Turabian StyleBekdaş, Gebrail, Sinan Melih Nigdeli, Sanghun Kim, and Zong Woo Geem. 2022. "Modified Harmony Search Algorithm-Based Optimization for Eco-Friendly Reinforced Concrete Frames" Sustainability 14, no. 6: 3361. https://doi.org/10.3390/su14063361
APA StyleBekdaş, G., Nigdeli, S. M., Kim, S., & Geem, Z. W. (2022). Modified Harmony Search Algorithm-Based Optimization for Eco-Friendly Reinforced Concrete Frames. Sustainability, 14(6), 3361. https://doi.org/10.3390/su14063361