Article

The Skills of Medium-Range Precipitation Forecasts in the Senegal River Basin

1
Department of Civil and Environmental Engineering, University of California, Los Angeles, CA 90095, USA
2
Center of Excellence in Hydroinformatics and Faculty of Civil Engineering, University of Tabriz, 29 Bahman Ave., Tabriz 5166616471, Iran
3
Faculty of Civil and Environmental Engineering, Near East University, Near East Boulevard, Via Mersin 10, Nicosia 99138, Turkey
4
National Aeronautics and Space Administration/Goddard Space Flight Center (NASA/GSFC), Morgan State University, Mail Code: 618, Greenbelt, MD 20771, USA
*
Author to whom correspondence should be addressed.
Sustainability 2022, 14(6), 3349; https://doi.org/10.3390/su14063349
Submission received: 13 February 2022 / Revised: 28 February 2022 / Accepted: 2 March 2022 / Published: 12 March 2022
(This article belongs to the Special Issue Hydrological Management Adopted to Climate Change)

Abstract

:
Reliable information on medium-range (1–15 day) precipitation forecasts is useful in reservoir operation, among many other applications. Such forecasts are increasingly becoming available from global models. The skills of medium-range precipitation forecasts derived from Global Forecast System (GFS) are assessed in the Senegal River Basin, focusing on the watershed its major hydropower dams: Manantali (located in relatively wet, Southern Sudan climate and mountainous region), Foum Gleita (relatively dry, Sahel climate and low-elevation), and Diama (a large watershed covering almost the entire basin, dominated by Sahel climate). IMERG Final, a satellite product involving rain gauge data for bias correction, is used as reference. GFS has the ability capture the overall spatial and monthly pattern of rainfall in the region. However, GFS tends to overestimate rainfall in the wet parts of the region, and slightly underestimate in the dry part. The skill of daily GFS forecast is low over Manantali (Kling-Gupta Efficiency, KGE of 0.29), but slightly higher over Foum Gleita (KGE of 0.53) and Diama (KGE of 0.59). For 15-day accumulation, GFS forecast shows higher skill over Manantali (KGE of 0.60) and Diama (KGE of 0.79) but does not change much over Foul Gleita (KGE of 0.51) compared to daily rainfall forecasts. IMERG Early, a satellite-only product available at near-real time, has better performance than GFS. This study suggests the need for further improving the accuracy of GFS forecasts, and identifies IMERG Early as a potential source of data that can help in this effort.

1. Introduction

Precipitation forecasts are crucial in a number of applications [1,2,3]. Such forecasts are available at global or regional scales [4,5,6,7]. Depending on the length of lead time, the forecasts can be grouped into short-range, medium-range, and seasonal. While seasonal forecasting is useful for planning purposes, medium-range and short-range are useful for operational decisions. As water managers consider the use of precipitation forecasts, there is a need for more detailed information on the accuracy of these forecasts. Such information is also important to provide guidance for improvements in the forecasting process. However, validation studies of such forecasts, particularly for short- and medium-range forecasts, are rare in Africa. Yue et al. [8] evaluated the accuracy of Global Forecast System (GFS) medium-range precipitation forecasts in the Niger River Basin, focusing on the watersheds of eight major dams. They used IMERG Final (satellite-gauge merged product) as reference for evaluation. They found that at the daily timescale, the GFS forecasts have good skills over large watersheds (Kainji dam with a watershed area of 1,464,092 km2 and Markala dam with a watershed area of 102,882 km2), but poor skills over smaller watersheds (area under 50,000 km2; Slingue, Goronyo, Bakolori, Jebba, Dadin Kowa, and Lagdo dams). They also reported that aggregating the forecasts from daily to multi-day periods leads to improvements in forecast accuracy, and results in good skills for all watersheds at the 15-day accumulation timescales.
A number of studies have evaluated the performance of IMERG Final in West Africa. Dezfuli et al. [9,10] reported that IMERG Final is capable of capturing the diurnal cycle of rainfall as well as the propagation of large Mesoscale Convective Systems. Gossett et al. [11] showed that among satellite-only (i.e., no rain gauges) products, IMERG Early has better performance. Satgé et al. [12] reported that CHIRPS and TMPA (the predecessor to IMERG) provided reliable estimates at both daily and monthly timescales, while other satellite products considered (CMORPH, PERSIANN, GSMaP, ARC, and TAMSAT) and all atmospheric reanalysis products considered (MERRA and JRA) were deemed unreliable. Maranan et al. [13] showed that IMERG Final products are able to capture monthly rainfall with a correlation coefficient close to unity.
In this study, we aim to understand the accuracy of GFS forecasts in the Senegal River Basin using IMERG Final as reference. The Senegal River basin (Figure 1), located in West Africa with a drainage area of 340,000 km2, is shared by four countries: Guinea (accounting for 7% of the basin’s area), Mali (35%), Mauritania (50%), and Senegal (8%) [14]. Most of the basin has a sub-Saharan desert climate [15]. The basin has three distinct topgraphic zones: the mountainous, the valley, and the delta. We specifically focus on the watersheds of three major dams in the basin (Table 1): the Manantali Dam in Mali (reservoir capacity at 11,270 million m3; drainage area at 29,000 km2), the Foum Gleita Dam in Mauritania (500 million m3; 9500 km2), and the Diama Dam in Senegal (250 million m3; 431,000 km2). Manantali, located in the mountainous and southern part of the watershed, is a multi-usage dam with a storage capacity of 11 billion m3 of water, an energy production of 800 GWh/year and an irrigation capacity of 255,000 ha. The Foum Gleita Dam, located further north with relatively low elevation, at a drainage area of about 9500 km2, is primarily irrigation dam. The main functions of the Diama dam, located at the outlet of the Senegal river basin, are to improve irrigation in the valley and delta and to facilitate water supply.
In the following sections, we aim to address the following questions surrounding the accuracy of GFS over the watersheds of three major dams located in the Senegal River Basin?
(1)
What is the skill of the 1-day lead, daily, GFS forecasts?
(2)
How does the skill vary with lead time and temporal aggregation scale?
(3)
How does the performance of a near-real time satellite-only product, IMERG Early, compare with the performance of GFS?

2. Data and Methodology

2.1. Data

The GFS is a global numerical weather prediction system run by the U.S. National Weather Service (NWS), and its forecast products have a resolution of 0.25° by 0.25°. We use the version-15 GFS forecasts which are available since June 12, 2009, following a major upgrade of the GFS model. As a reference to evaluate the GFS forecasts, we use the IMERG Final (version 06B) satellite-gauge merged products [16,17]. IMERG Final is available every 30-min at a spatial resolution of 0.10°, with a data latency of about 3.5 months. We acknowledge that IMERG Final has its own limitation, and therefore we conduct additional assessment evaluating the performance of GFS using another satellite-gauge product known as CHIRPS as reference. CHIRPS is available daily at a spatial resolution of 0.05°, with a data latency of about 3 weeks [18]. Finally, we also assess how the performance of GFS compares with the performance of a satellite-only (i.e., no rain gauge) product, known as IMERG Early, which is available at near-real time. The motivation for considering IMERG Early is its potential use for post-processing of GFS forecasts given its timely availability.

2.2. Methodology

IMERG Final satellite rainfall products are used as reference to evaluate the performance of GFS precipitation forecasts. The comparison period is 15 June 2019 to 15 June 2020 to match the period for which the version-15 of GFS model forecasts are available. The spatial resolutions of the forecast and satellite products are different. Our comparison is mostly based on sub-basin (i.e., watershed for each dam) average values, in which case, we average all the datasets to the sub-basin spatial scale. In cases, where we compare the spatial patterns of rainfall, we resample both IMERG products and CHIRPS to 0.25° using the bilinear interpolation technique to match the spatial resolution of GFS.
Our evaluation includes comparison of spatio-temporal maps and the modified Kling-Gupta Efficiency KGE [19,20] as evaluation metric:
KGE = 1 ( R 1 ) 2 + ( BR 1 ) 2 + ( γ 1 ) 2 ,
where R is the linear correlation coefficient between the forecast and reference precipitation, BR is the bias ratio between the forecast and observation, and γ is the ration of coefficient of variations between the forecast and reference. The range of KGE is from −∞ to 1. Towner et al. [21] suggested the following classifications: “Good” (KGE ≥ 0.75), “Intermediate” (0.75 ≥ KGE ≥ 0.5), “Poor” (0.5 ≥ KGE > 0), and “Very poor” (KGE ≤ 0). Similar performance statistics have been used in evaluating rainfall products [22].

3. Results and Discussion

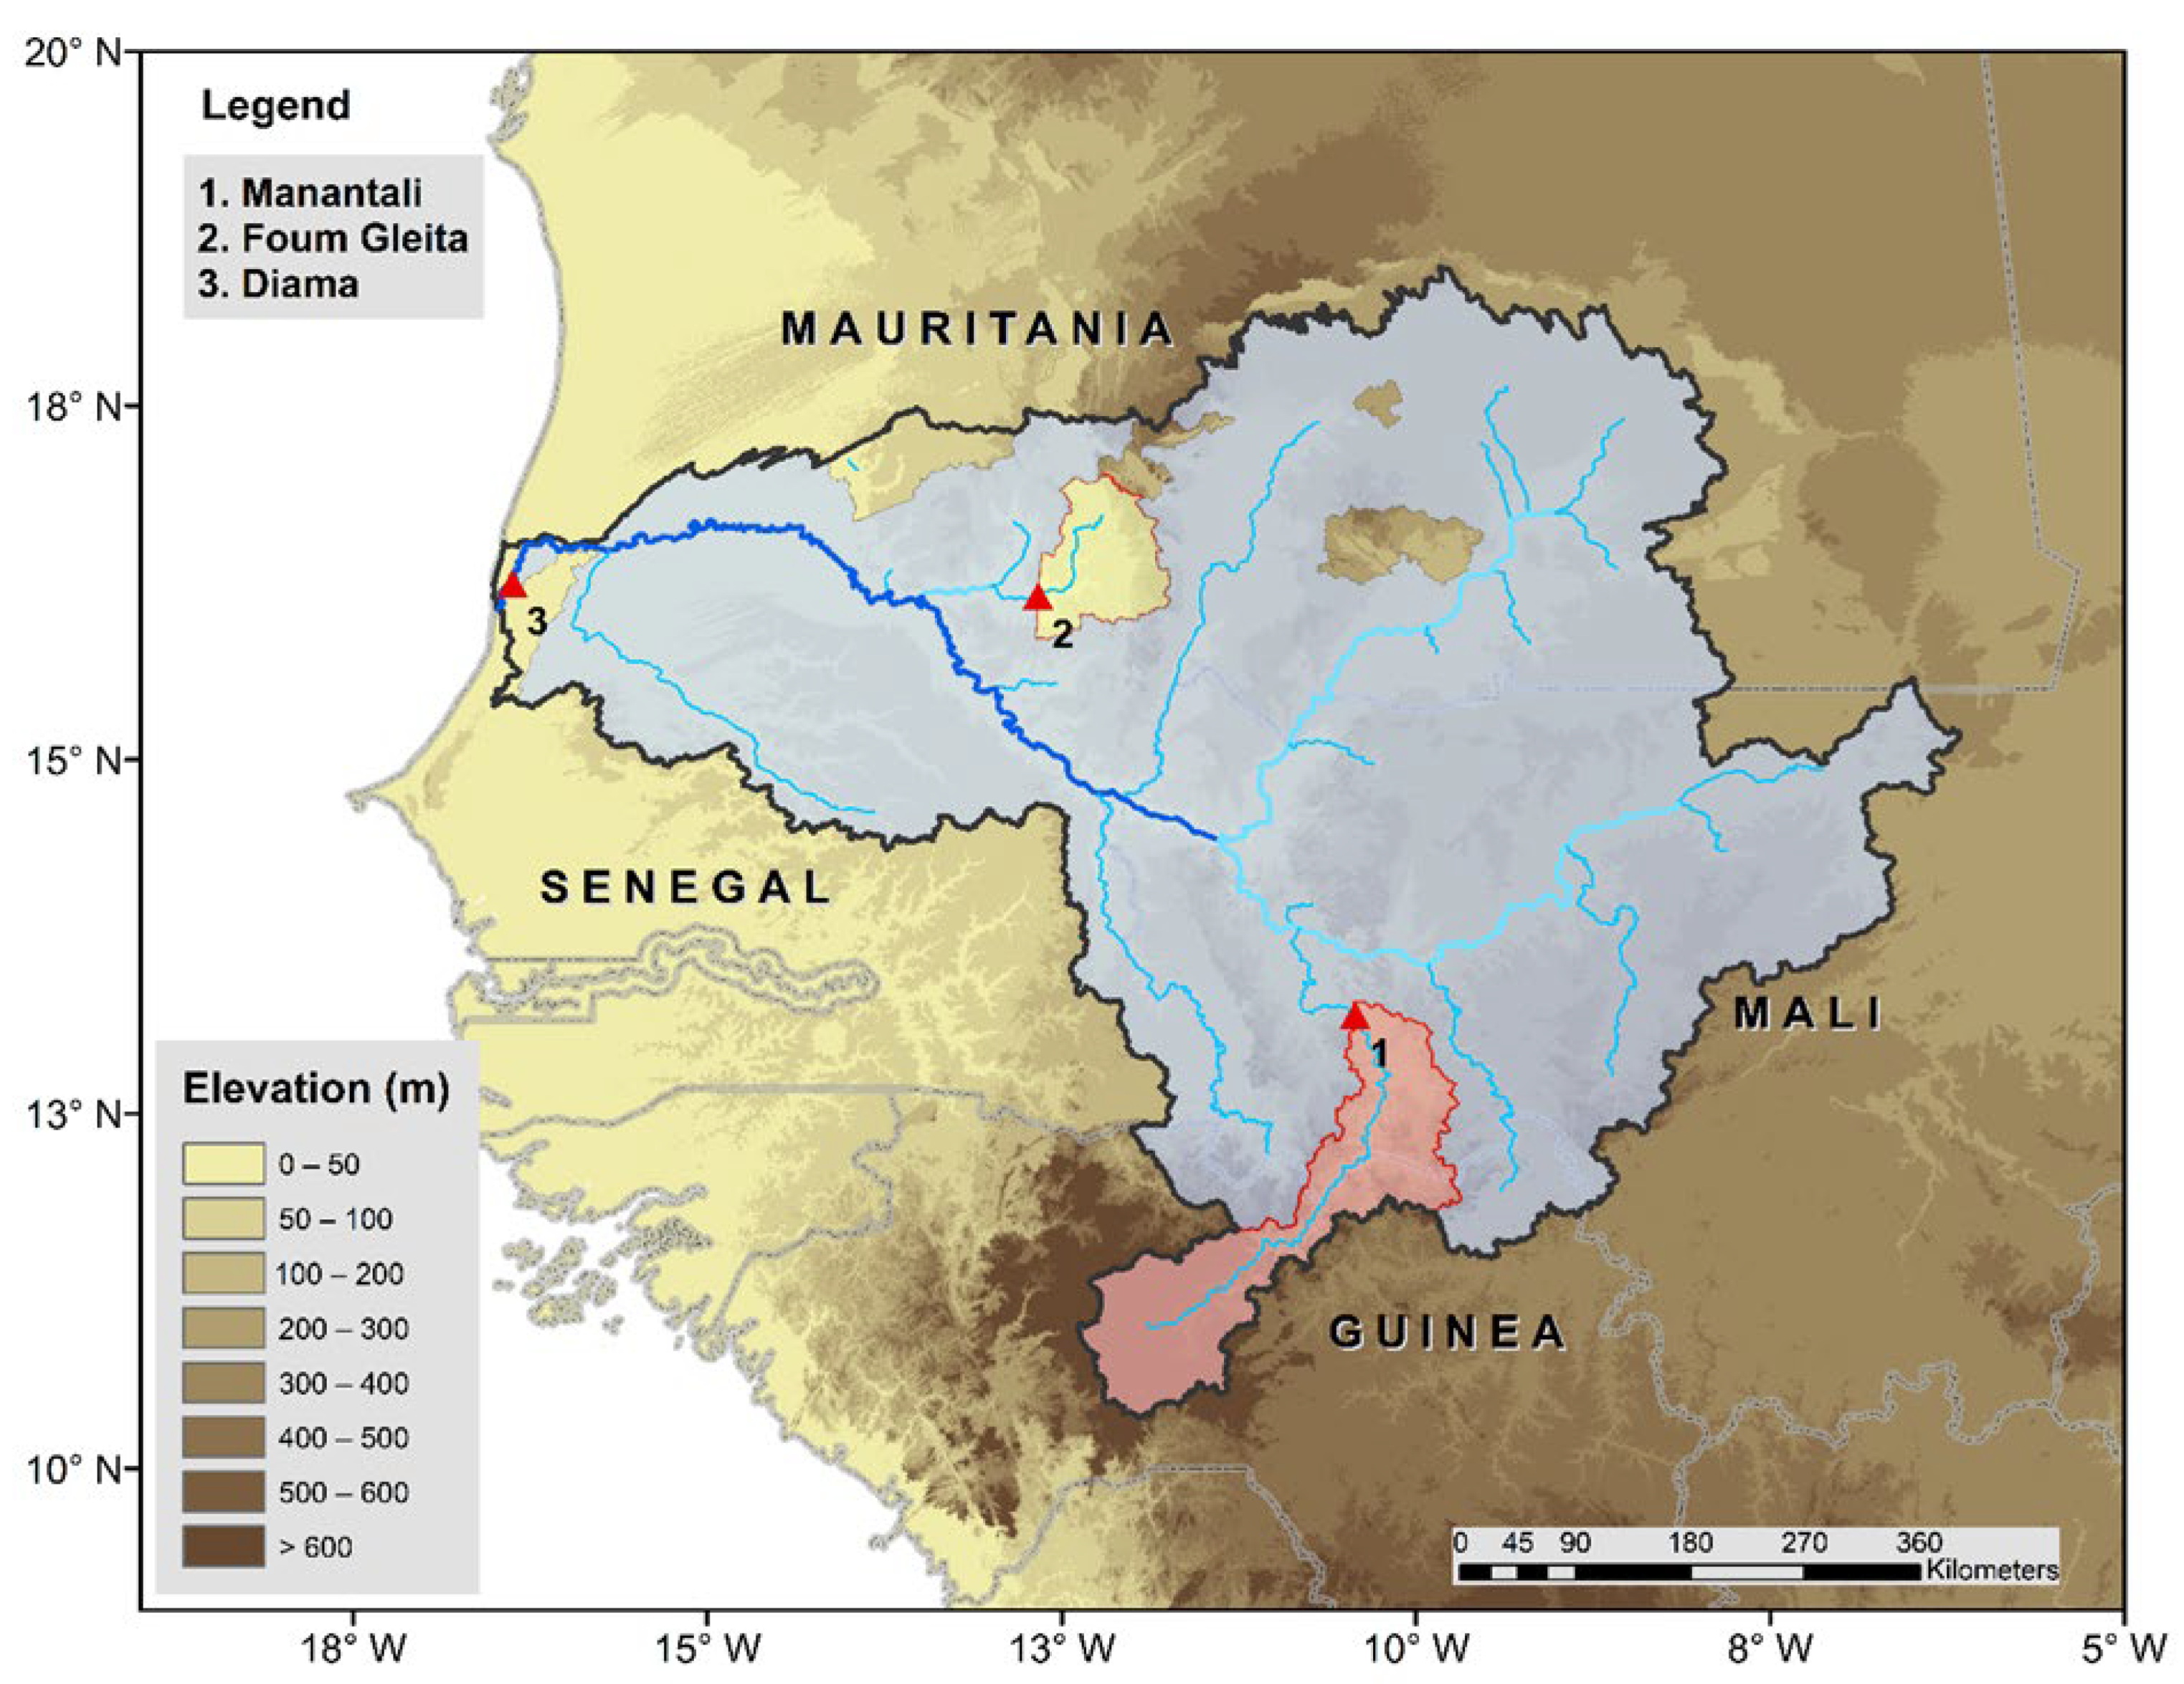
3.1. Annual Spatial Variability of Rainfall

Figure 2 presents the spatial map of annual (15 June 2019 to 15 June 2020) rainfall derived from the 1-day lead GFS forecast and satellite products. According to the reference IMERG Final, the annual rainfall shows a distinct south-north gradient, varying from more than 1500 mm in the southern part (Savannah climate, and mountainous) to under 250 mm in the northern part (Sahel climate, and low-elevation). Validated against IMERG Final, the 1-day lead GFS captures well the spatial pattern of rainfall. The correlation between the spatial distribution of annual rainfall derived from the 1-day lead GFS and IMERG Final is 0.94.

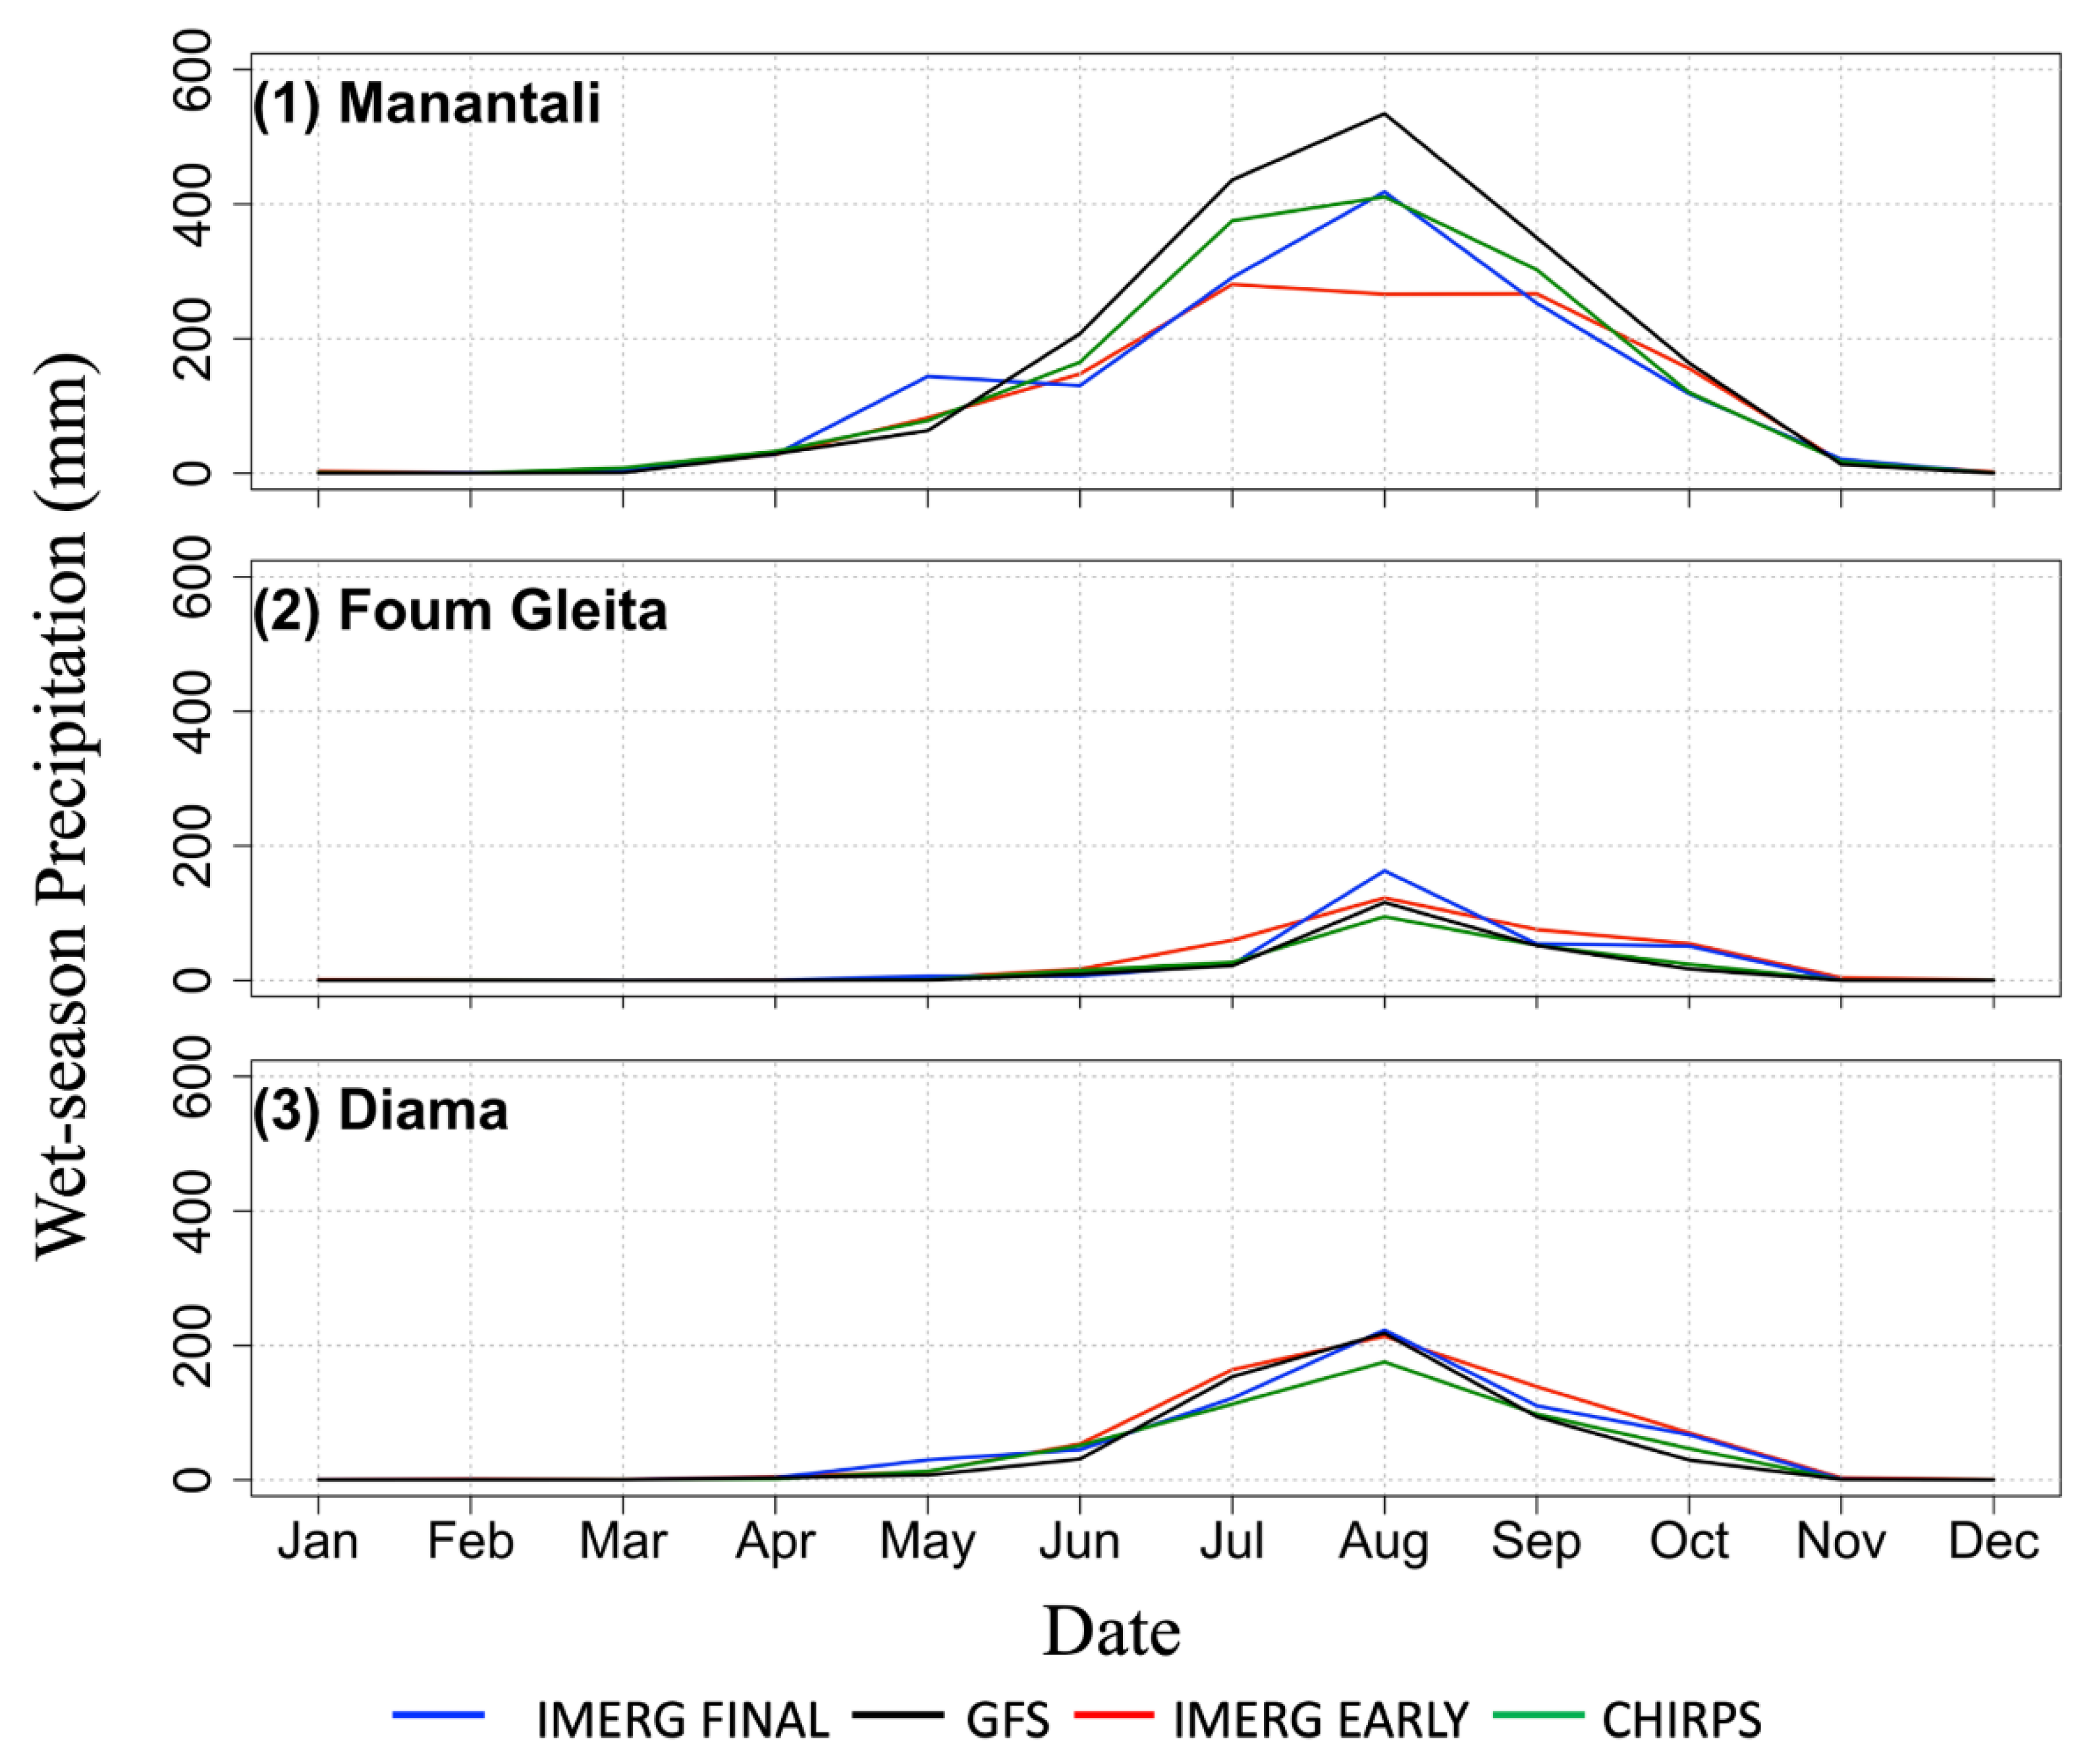
3.2. Monthly Cycle of Rainfall

Figure 3 presents the time series of monthly rainfall derived from the 1-day lead GFS and satellite precipitation products, at each of the dam watersheds. According to IMERG Final, rainfall in the region has one rainy season with a peak in August in all three watershed cases. The main mechanism for this precipitation is the northward migration of the Inter Tropical Convergence Zone (ITCZ) during summer. The rainy season in the Foum Gleita watershed (dry Sahel climate) is of short period (July through October), with an amplitude of 100 mm month−1, whereas the rainy season over the Manantali watershed (wet Savannah climate) is of longer period (May through October) with an amplitude of around 400 mm month−1. The 1-day lead GFS captures well the seasonal cycle of rainfall in all three watershed cases but tends to overestimate the monthly rainfall over Manantali, slightly underestimate over Foum Gleita, and is almost unbiased over the larger Diama watershed, which integrates both the wet and dry parts of the watershed.

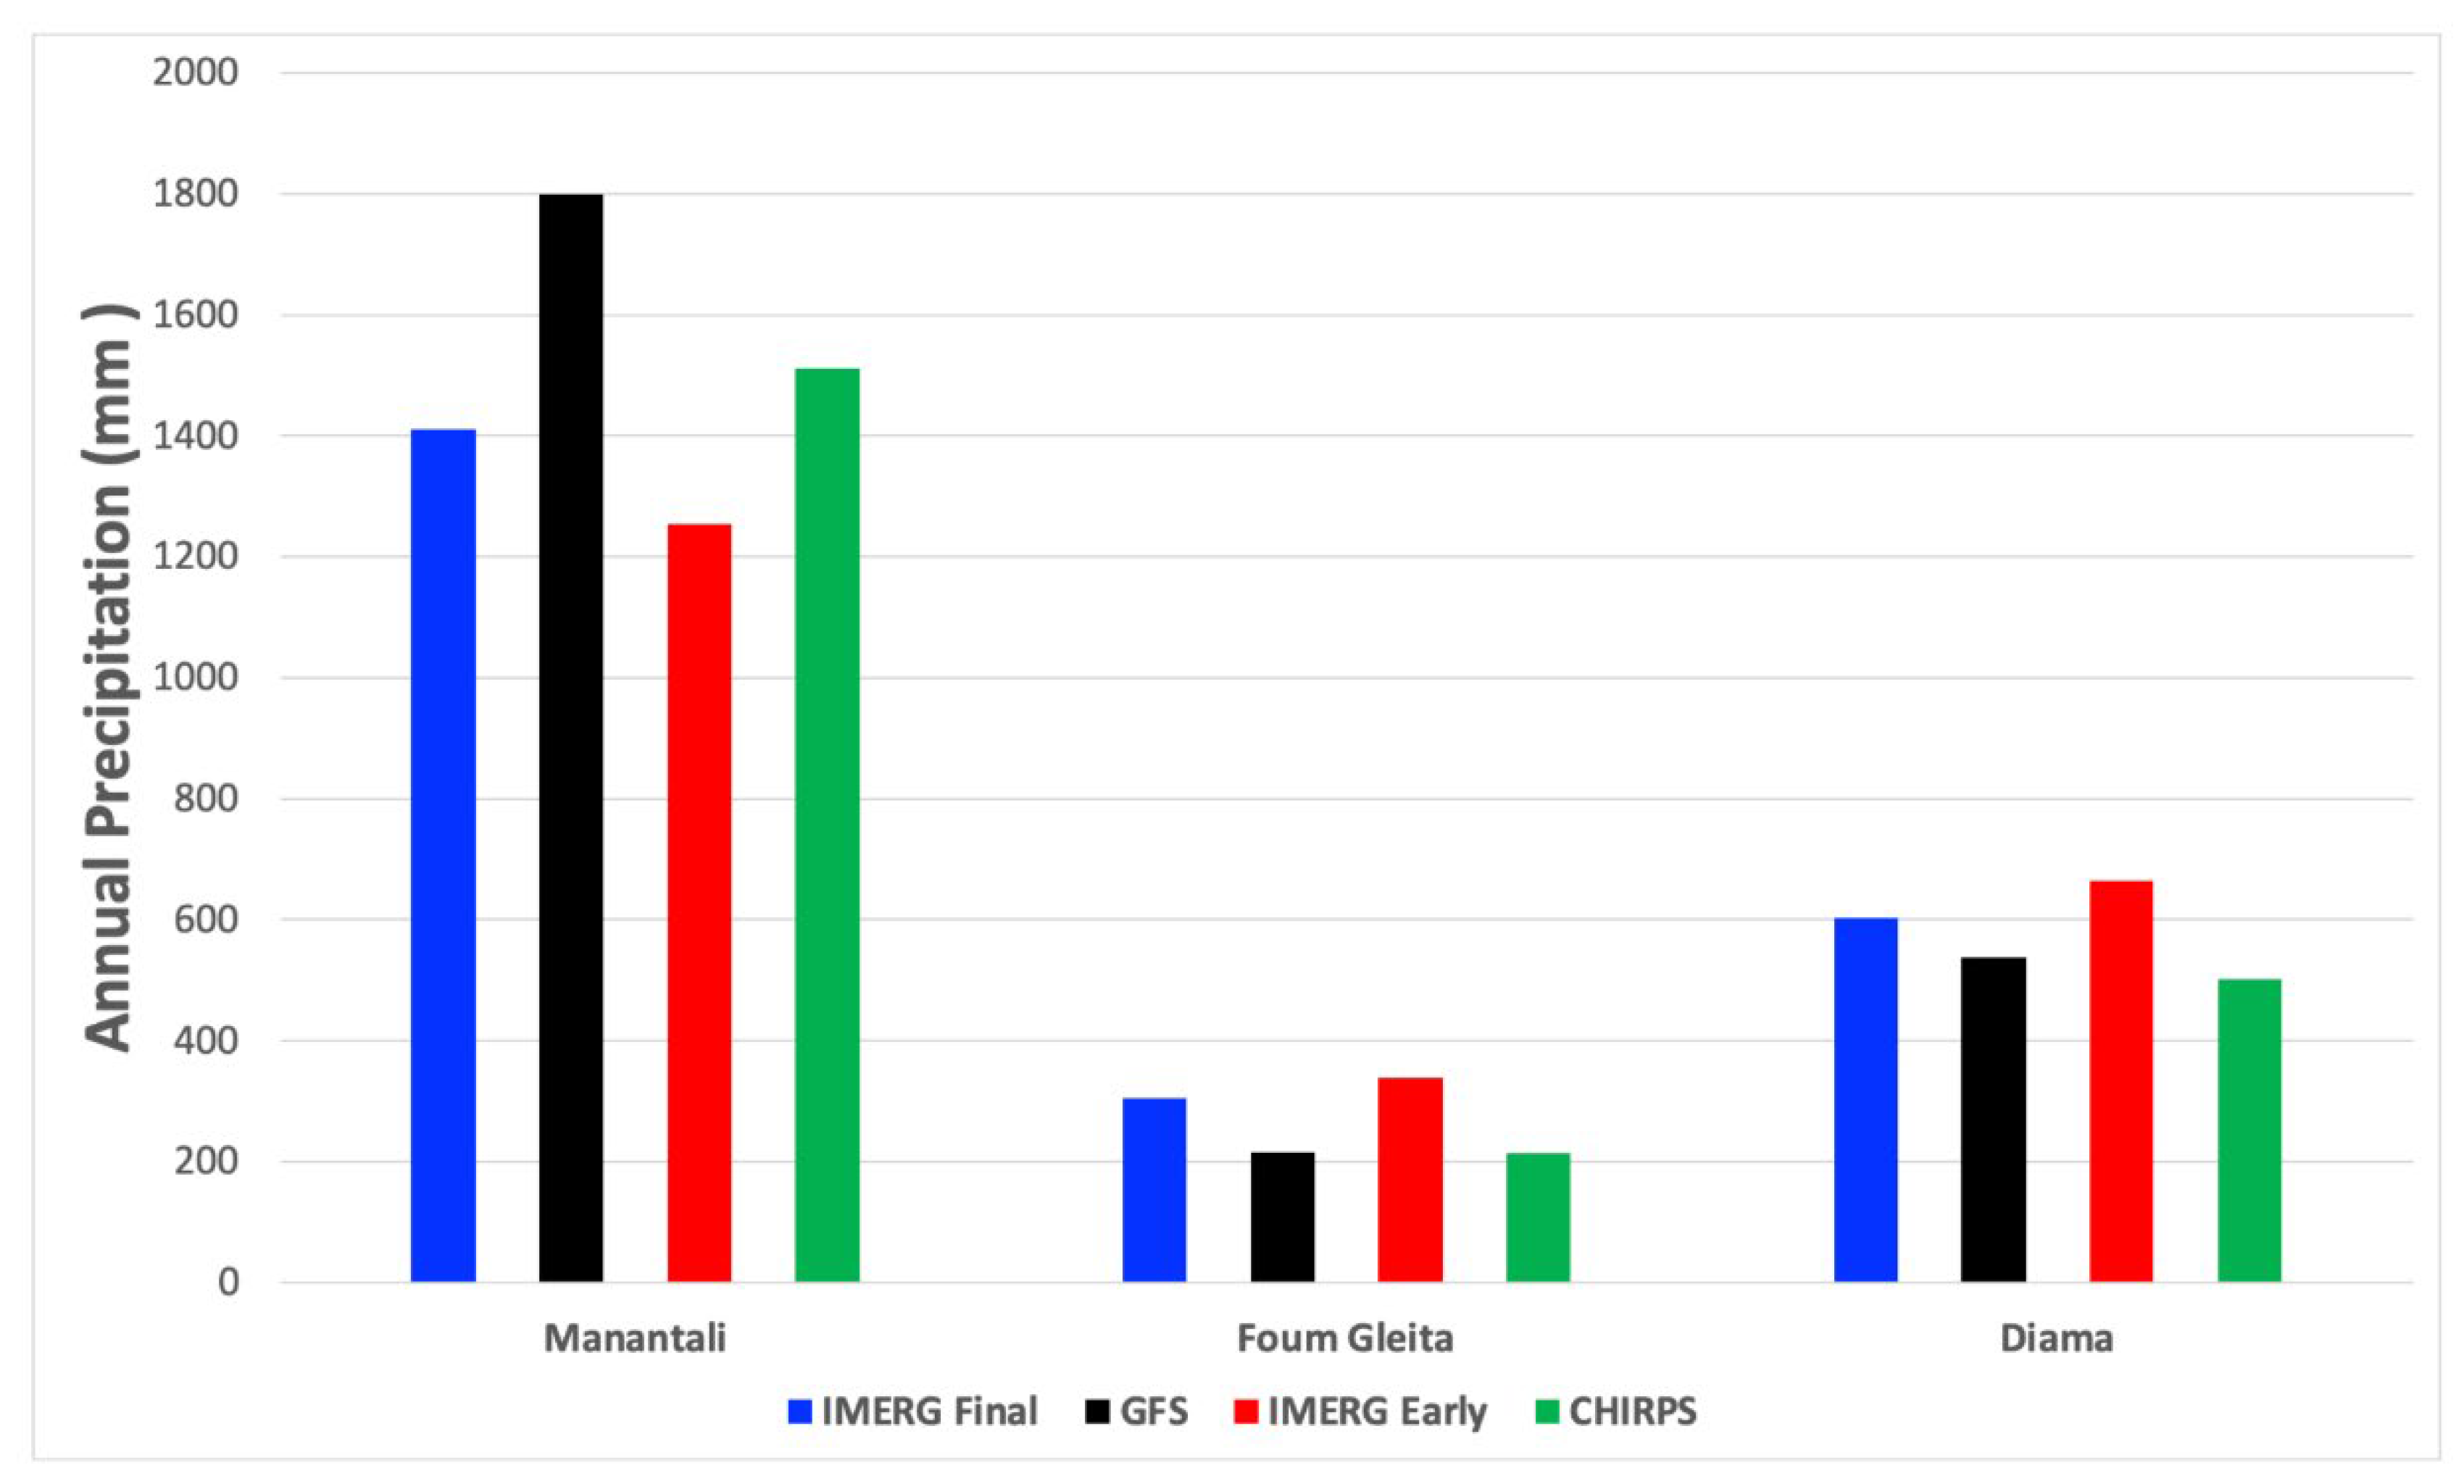
3.3. Annual Rainfall

Here, we aggregate the 1-day lead GFS forecasts to annual time scale and compare the results against corresponding annual precipitation estimates from IMERG Final (Figure 4). According to IMERG Final, the annual watershed-average rainfall over the dam watersheds is: 300 mm (Foum Gleita), 600 mm (Diama), and 1400 mm (Manantali). The daily GFS gives annual rainfall values of 215 mm (Foum Gleita), 538 mm (Diama), and 1,798 mm (Manantali). Therefore, GFS overestimates rainfall by 28% over the Manantali watershed (wet climate) but underestimates it in the Foum Gleita watershed by 30% (dry climate), while at the large watershed (Diama) that encompasses both climates the GFS slightly underestimate rainfall by 11%.

3.4. Daily Time Series
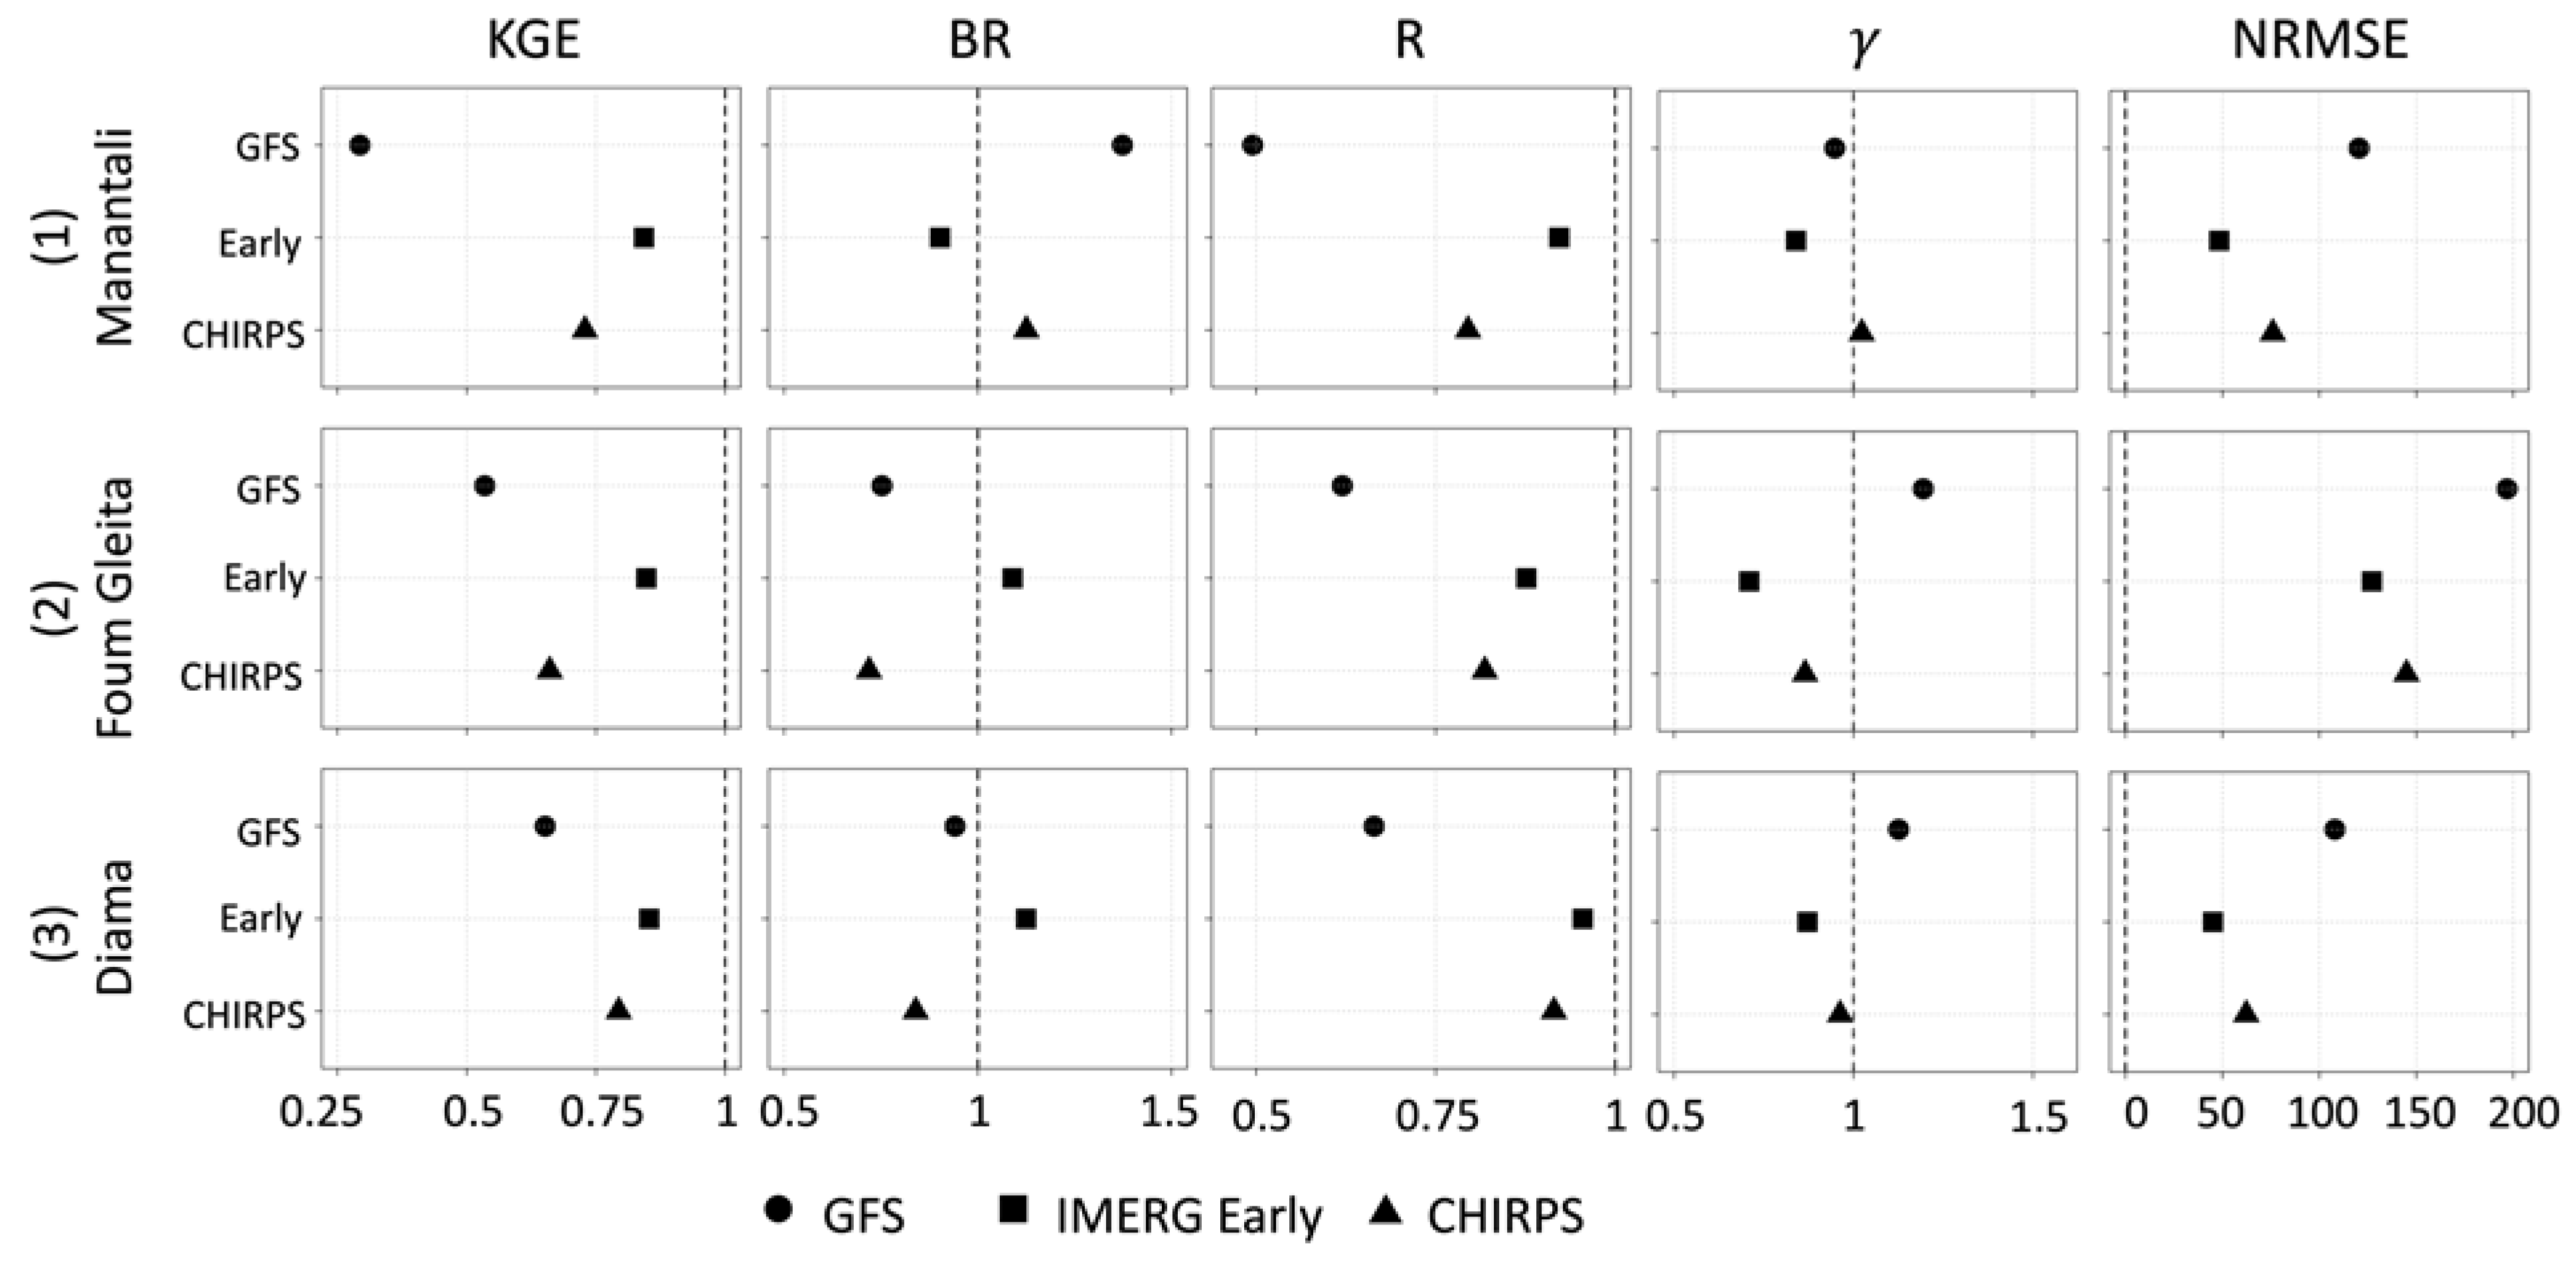
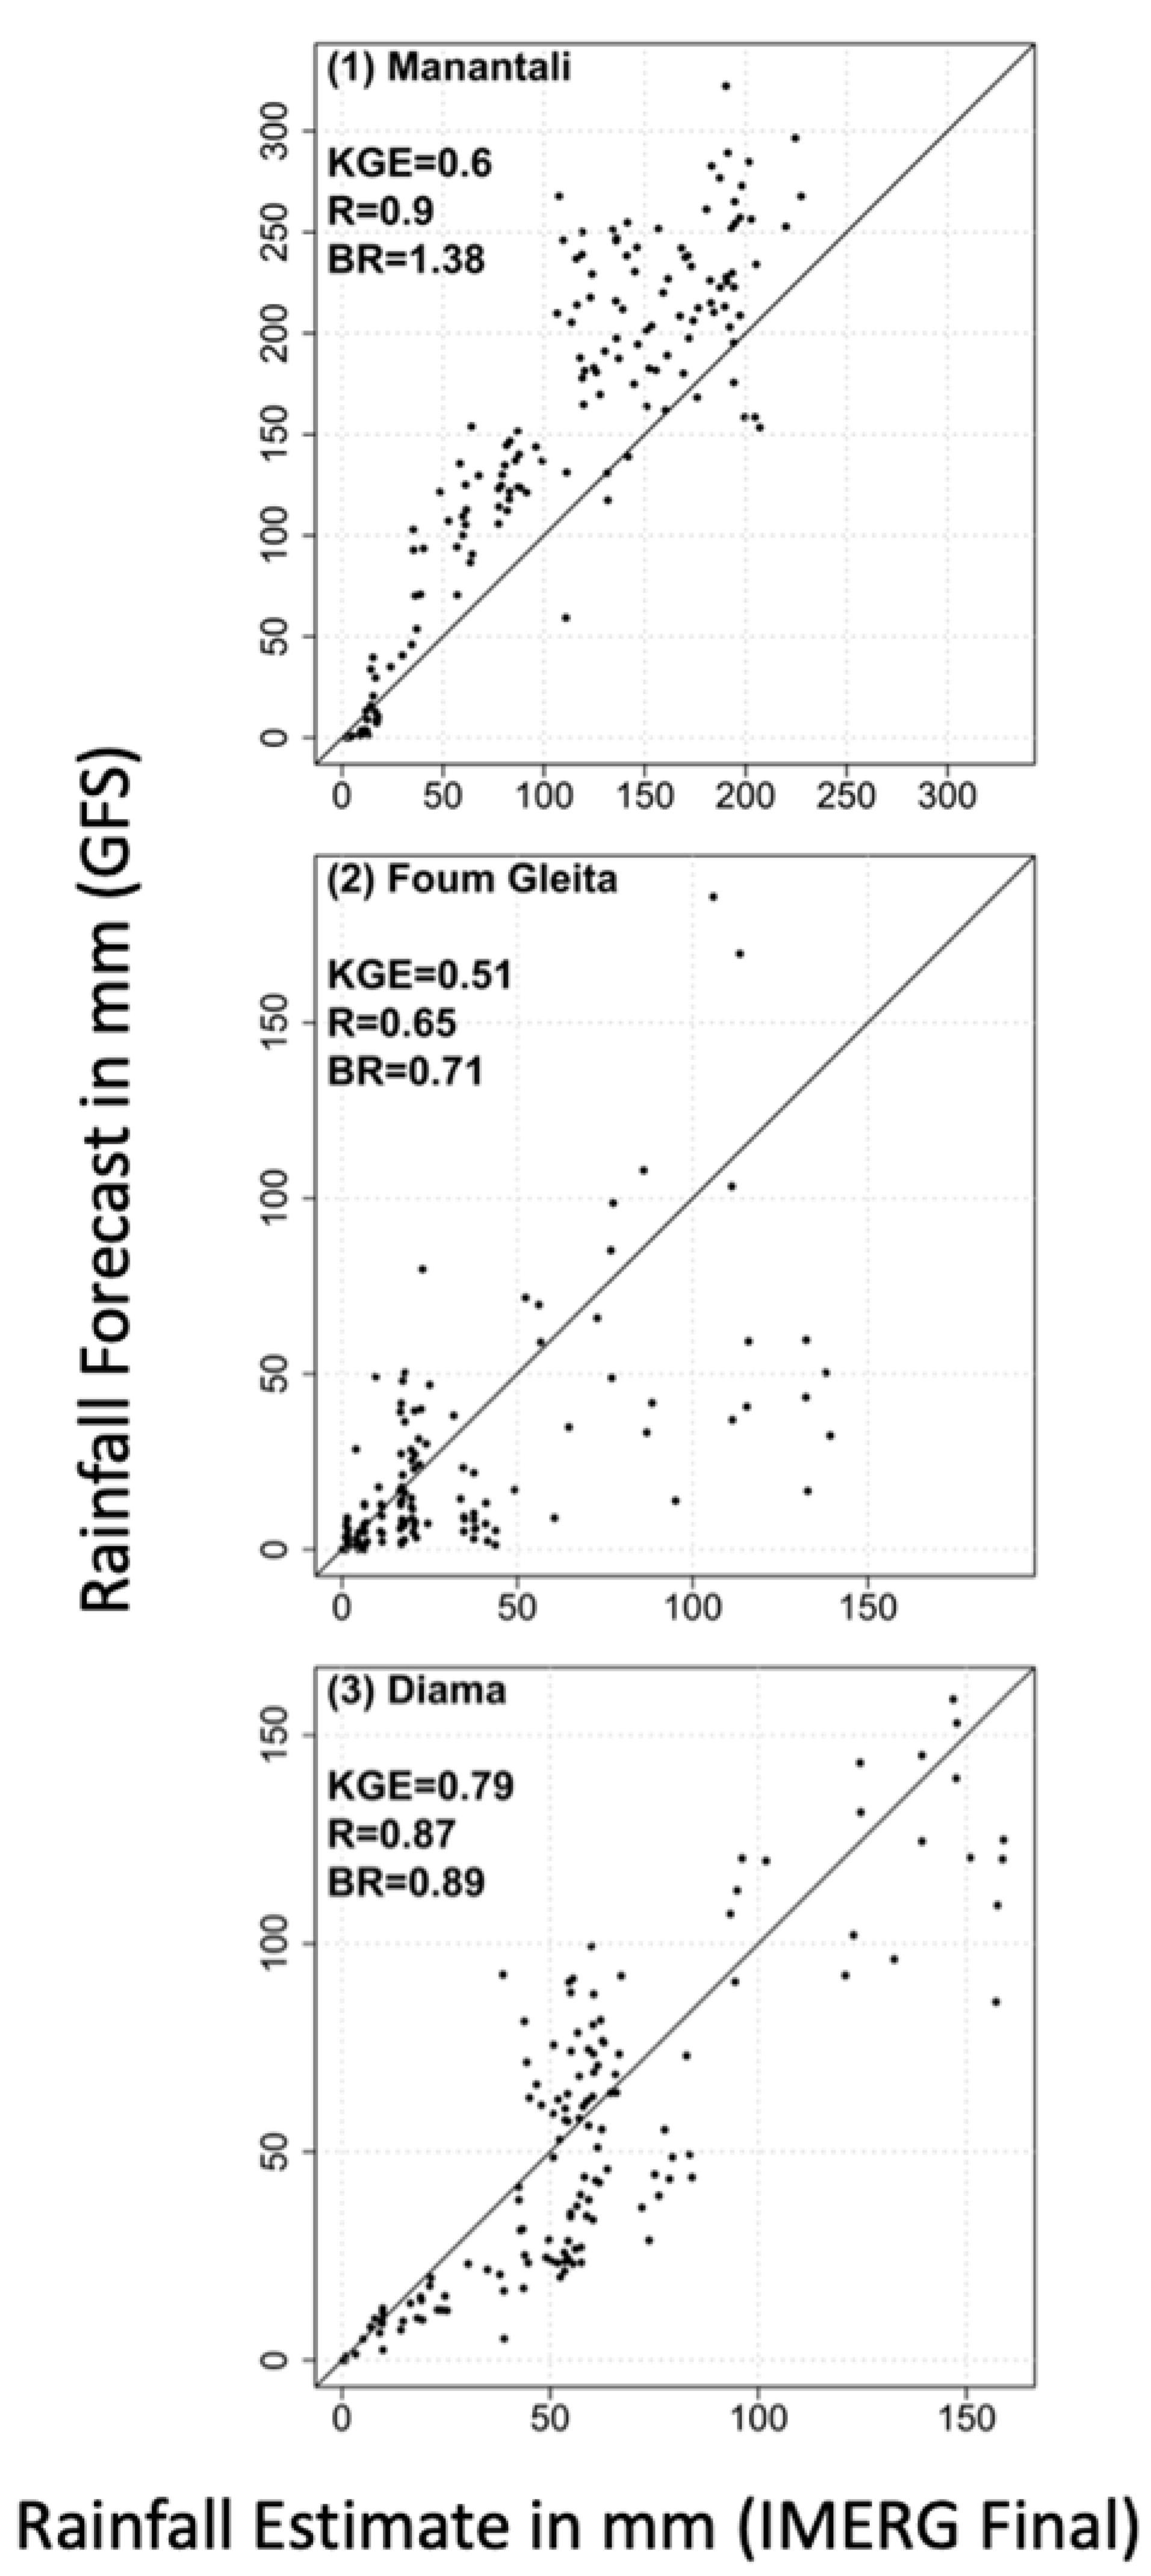
Figure 5 presents the daily time series of watershed-averaged rainfall, derived from 1-day lead GFS and satellite products. According to IMERG Final, the time series of daily rainfall at the Manantali watershed is different from the Foum Gleita and Diama watersheds. The Manantali watershed experiences frequent heavy rains during the rainy season with a coefficient of variation (CV) of 1.18, while both the Foum Gleita and Diama watersheds experience less-frequent and moderate rains with a CV of 2.41 and 1.39, respectively. The GFS captures well the time series with comparable CV, however, it shows some mismatches in the peak rain rates.

3.5. KGE Statistics

Figure 6 presents the performance statistics of various precipitation products (with respect to IMERG Final), in terms of Kling-Gupta Efficiency (KGE), Bias Ratio (BR), correlation (R), variability ratio (γ), and root mean square error normalized by reference precipitation mean (NRMSE). The KGE of the 1-day lead, daily, GFS forecast is 0.29 (Manantali), 0.53 (Foum Gleita), and 0.65 (Diama). The GFS skill is therefore “poor” over the mountainous and wet watershed (Manantali), while it is “intermediate” over the dry watershed (Foum Gleita) and over the large watershed (Diama). The low KGE for the Manantali watershed can be attributed to low performances in all components of KGE: high bias (BR = 1.37), low correlation (R = 0.50), and low variability ratio (γ = 0.68), indicating that the GFS over the wet and mountainous part of the watershed is characterized by large systematic and random error. For the Foum Gleita watershed, the KGE value (0.53) is mainly affected by both bias (BR = 0.75) and low correlation (R = 0.62). For the Diama watershed, the KGE value (0.65) is mainly affected by the low correlation (R = 0.66). The root-mean-square-error of the GFS is high at 196% of the mean rainfall at the Foum Gleita watershed, whereas it is relatively low at 120% and 108% at the Manantali and Diama watersheds, respectively.

3.6. Dependence of Forecast Performance on Precipitation Rate

Figure 7 presents the scatterplot of 1-day lead GFS forecasts against daily IMERG Final rain rates. At all sites, the GFS tends to overestimate light rains and underestimate heavy rains.

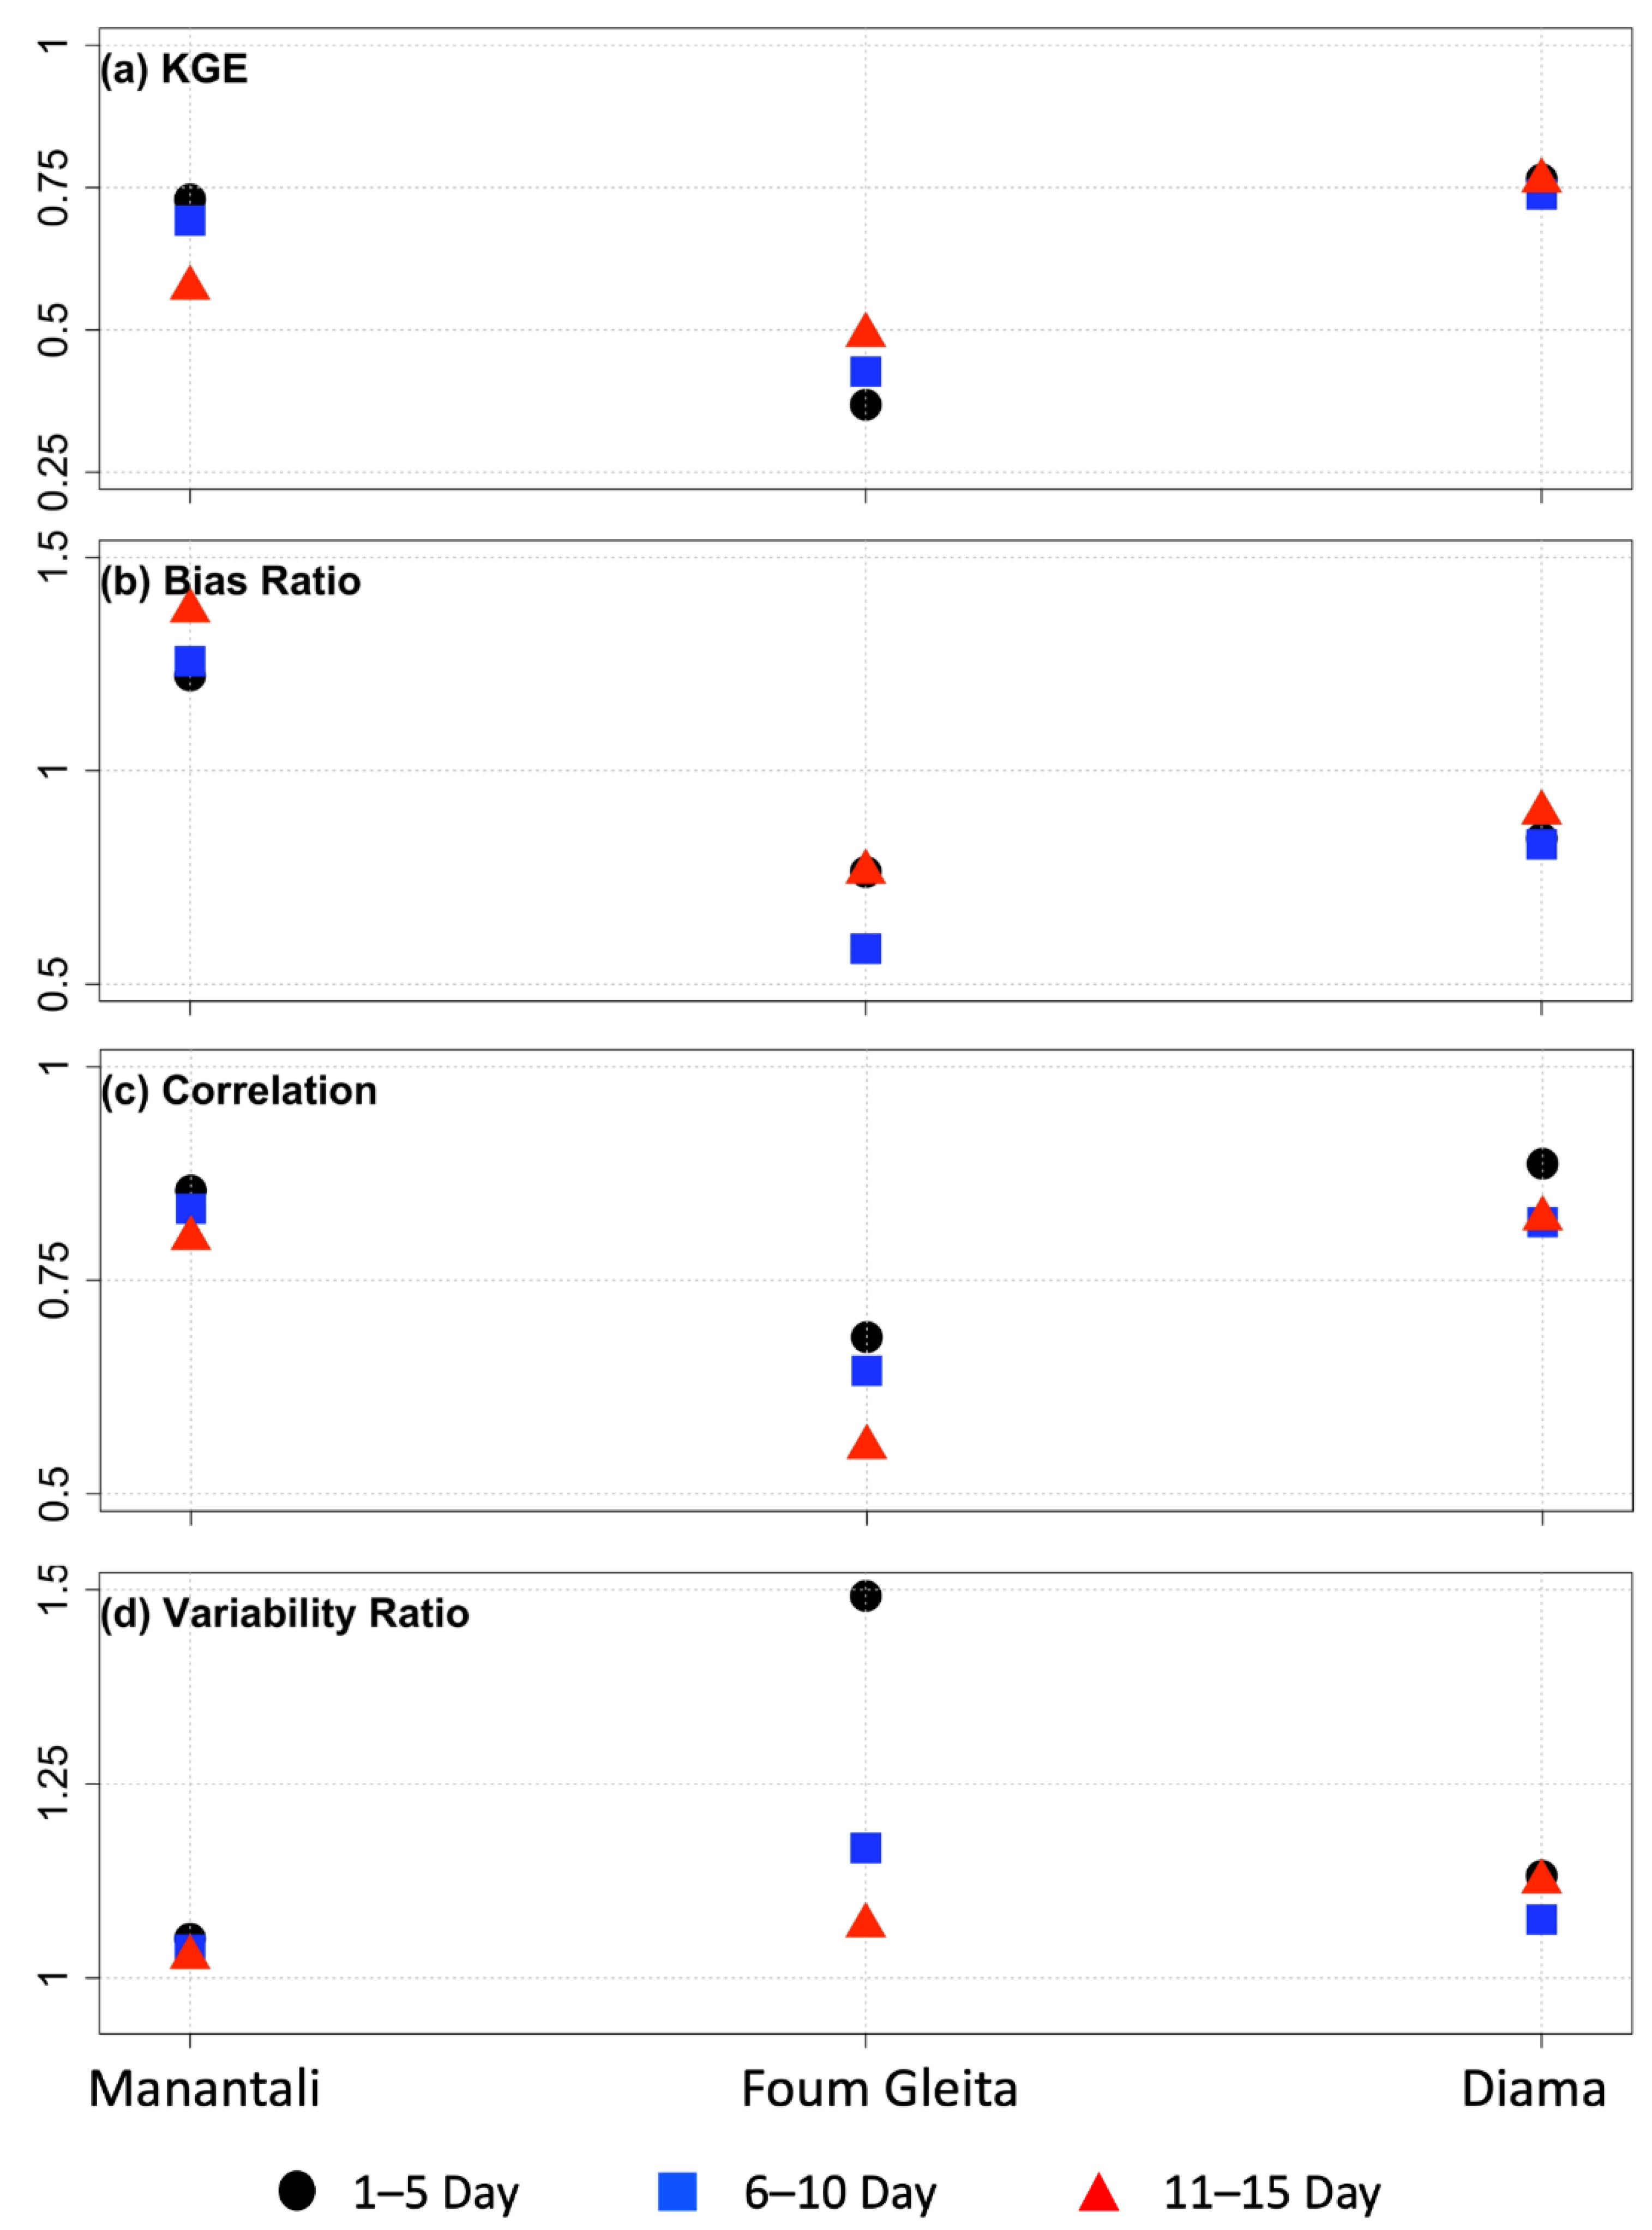
3.7. Effect of Lead Time on Forecast Performance

Figure 8 presents the KGE and its components for 5-day total rainfall forecast of GFS for three different lengths of lead time: 1–5 day, 6–10 day, and 10–15 day. The effect of lead time on forecast skill is mixed. At the wet and mountainous watershed of Manantali, the forecast skill decreases with increasing lead time. Whereas, at the dry watershed of Foum Gleita, the forecast skill increases slightly with increasing lead time. At the large Diama watershed, the forecast skill remains the same across all lead times. We note (see Section 3.4) that daily rainfall has larger fluctuation at Foum Gleita watershed (CV of 2.66) than at Manantali watershed (CV of 1.18), suggesting that the effect of lead time on forecast skill may depend on the temporal variability of rainfall.

3.8. Effect of Temporal Aggregation Scale on Forecast Performance

Figure 9 presents the performance of 15-day accumulated GFS forecasts. We obtained the 15-day accumulated forecast by summing up the daily forecasts at various lead times, starting from 1-day lead all the way to 15-day lead. Aggregating the forecasts from daily forecasts to 15-day accumulated forecasts has improved the performance of GFS for the wet Manantali watershed and the larger Diama watershed, whereas there is not much improvement for the dry watershed, Foum Gleita. Over Manantali watershed, the 15-day accumulated forecast has shown increases in KGE (0.60 compared to 0.29 at daily timescale) and correlation (0.90 compared to 0.50 at daily), but no change in bias ratio (BR = 1.38). Over the Diama watershed, the 15-day accumulated rainfall has similarly shown increases in KGE (0.79 compared to 0.65 at daily) and correlation (0.87 compared to 0.66 at daily). Therefore, increasing the temporal aggregation has mixed effect on the skill of the forecast: it increases the skills over some watersheds but does not changes the skills over some other watersheds.
We point out that the effect of temporal aggregation scale on forecast skill depends on the relative magnitude of two error sources with different error characteristics. Increasing temporal aggregation scale involves including forecasts with longer lead times. Forecasts at longer lead times may have larger errors (e.g., Manantali) or smaller errors (e.g., Foum Gleita) compared to those short-lead times (see Section 3.7). On the other hand, averaging the forecasts at larger temporal scales results in averaging out some of the random errors. Our results indicate that at the wet Manantali watershed, the effect of averaging outweighs the effect of lead time, as the 15-day accumulated GFS has much better skill (KGE of 0.60) compared to that the daily forecast (KGE of 0.29). However, at the Foum Gleita watershed, the effect of averaging balances out the effect of lead time, resulting in a similar KGE at both timescales. At the large Diama watershed (which covers diverse climate), the KGE shows modest increase in KGE at larger temporal aggregation timescale.

3.9. Comparison of the Performances of IMERG Early and GFS

As discussed in the preceding sections, the skills of 1-day lead, daily, GFS forecasts are poor for Manantali but medium for Foum Gleita and Diama Dams, indicating the need for further improving the accuracy of GFS forecasts. One method to improve GFS forecast skill is through post-processing of GFS using rainfall estimates that have relatively better accuracy and are available in near-real time. Satellite-only products, such as IMERG Early, are viable options as they are available in near-real time. We assessed how the performance of IMERG Early compare to the performance of GFS. In terms of capturing the spatial and monthly variability of rainfall, IMERG Early has comparable performance with GFS (see Figure 2 and Figure 3). However, there are differences between the two in terms of performance statistics. As shown in Figure 4, IMERG Early underestimates rainfall by 11% over the wet and mountainous Manantali watershed (where GFS overestimates by 37%), estimates rainfall with almost no bias over Foum Gleita (where GFS underestimates by 30%), and overestimates rainfall by 10% over the larger Diama watershed (where GFS underestimates by 11%). The KGE of IMERG Early is above 0.75 (i.e., “good skill”) and is higher than that of GFS at all three watersheds (Figure 6). IMERG Early outperforms GFS in all components of KGE, that is, bias, correlation, and variability ratio. Therefore, our analysis indicates that IMERG Early has better capabilities than GFS, and is therefore worthy of consideration as input into post-processing techniques aimed at improving the accuracy of GFS forecasts.

3.10. Performance of GFS If the Reference Product Is Changed from IMERG Final to CHIRPS

We acknowledge that the reference dataset used in our evaluation (i.e., IMERG Final) has its own estimation errors. We conducted additional assessment to evaluate the performance of GFS using CHIRPS rainfall products as reference. Table 2 shows the performance statistics of GFS for different lead times, using IMERG FINAL and CHIRPS, separately, as reference. The overall magnitude of GFS performance (as well as the variability of the performance across watersheds) is similar when either rainfall product is used as a reference. Therefore, our results show that the overall performance of GFS remains the same if the reference product were to be changed from IMERG Final to CHIRPS, indicating the robustness of IMERG Final as reference product.

4. Conclusions

In this study, we assessed the accuracy of medium-range (1-day to 15-day lead time) forecasts available from the Global Forecast System (GFS) over the watersheds of three dams (Manantali, Foum Gleita, and Diama) in the Senegal River Basin. The watershed of Manantali dam is mountainous and located in a wet climate, with annual rainfall of 1400 mm during the study period. Foum Gleita, on the other hand is located in the dry Sahel, with annual rainfall of 300 mm during the study period, and has a low-elevation terrain. Diama is a very large watershed that covers almost the entire basin, with annual rainfall of 600 mm during the study period. We used IMERG Final, a satellite-gauge merged product, as reference for evaluation.
The skill of the 1-day lead, daily, GFS forecast is low in the Manantali (Kling-Gupta Efficiency KGE of 0.29) and relatively high in the Foum Gleita and Diama (KGE of 0.53) and Diama watersheds (KGE of 0.59). The lower KGE over Manantali is due to the high overestimation bias (overestimation by 37%) in the GFS forecasts and low correlation coefficient (R = 0.50) between the daily time series of 1-day lead GFS forecast and IMERG Final.
Increasing the lead time has mixed effect on the daily GFS forecast skill, depending on watershed. With increasing lead time, the forecast skill decreases (Manantali), or slightly increases (Foum Gleita), or remains unaffected (Diama). Aggregating the forecasts from daily to 15-day accumulation also has similar mixed effect: it increases the performance of the GFS forecasts at the Manantali (KGE of 0.60) and Diama (KGE of 0.79) watersheds, but does not change it at the Foum Gleita (KGE of 0.51).
We conclude that there is a need for improving the accuracy of GFS forecasts, especially at short temporal scales (such as daily) and particularly over the mountainous and wet parts of the river basin. One possible method worthy of investigation is the use of post-processing techniques based on IMERG Early, as this study has shown that IMERG Early has better performance compared to GFS in terms of a suite of different performance metrics.

Author Contributions

Manuscript writing and conceptual design, M.G.; data processing and analysis, H.Y.; methodology, V.N.; contribution to manuscript text, R.D. All authors have read and agreed to the published version of the manuscript.

Funding

This research was funded by from NASA Precipitation Measurement Mission, grant number 80NSSC19K0688.

Data Availability Statement

We acknowledge the National Center for Atmospheric Research (NCAR) for providing public access to the GFS rainfall forecast data products (https://rda.ucar.edu/datasets/ds084.1/ (accessed on 11 March 2022)), NASA for providing public access to IMERG Final and IMERG Early rainfall data products (https://disc.gsfc.nasa.gov (accessed on 11 March 2022)), and the University of California Santa Barbara’s (UCSB) Climate Hazard’s group for providing public access to CHIRPS rainfall data (https://www.chc.ucsb.edu/data (accessed on 11 March 2022).

Conflicts of Interest

The authors declare that they have no conflict of interest.

References

  1. Pandya, R.; Hodgson, A.; Hayden, M.H.; Akweongo, P.; Hopson, T.; Forgor, A.A.; Yoksas, T.; Dalaba, M.A.; Dukic, V.; Mera, R.; et al. Using weather forecasts to help manage meningitis in the West African Sahel. Bull. Am. Meteorol. Soc. 2015, 96, 103–115. [Google Scholar] [CrossRef]
  2. Koppa, A.; Gebremichael, M.; Zambon, R.C.; Yeh, W.W.G.; Hopson, T.M. Seasonal Hydropower Planning for Data-Scarce Regions Using Multimodel Ensemble Forecasts, Remote Sensing Data, and Stochastic Programming. Water Resour. Res. 2019, 55, 8583–8607. [Google Scholar] [CrossRef]
  3. Alexander, S.; Yang, G.; Addisu, G.; Block, P. Forecast-informed reservoir operations to guide hydropower and agriculture allocations in the Blue Nile basin, Ethiopia. Int. J. Water Resour. Dev. 2021, 37, 208–233. [Google Scholar] [CrossRef]
  4. National Centers for Environmental Prediction/National Weather Service/NOAA/U.S. Department of Commerce. NCEP GFS 0.25 Degree Global Forecast Grids Historical Archive. Research Data Archive at the National Center for Atmospheric Research, Computational and Information Systems Laboratory. 2015. Available online: https://rda.ucar.edu/datasets/ds084.1/ (accessed on 11 March 2022).
  5. Saha, S.; Moorthi, S.; Wu, X.; Wang, J.; Nadiga, S.; Tripp, P.; Behringer, D.; Hou, Y.-T.; Chuang, H.-Y.; Iredell, M.; et al. The NCEP climate forecast system version 2. J. Clim. 2014, 27, 2185–2208. [Google Scholar] [CrossRef]
  6. Dutra, E.; Diamantakis, M.; Tsonevsky, I.; Zsoter, E.; Wetterhall, F.; Stockdale, T.; Richardson, D.; Pappenberger, F. The extreme forecast index at the seasonal scale. Atmosph. Sci. Lett. 2013, 14, 256–262. [Google Scholar] [CrossRef]
  7. JMA. Outline of the Operational Numerical Weather Prediction at the Japan Meteorological Agency (Appendix to WMO Numerical Weather Prediction Progress Report). Japan Meteorological Agency, 47p. 2019. Available online: https://www.jma.go.jp/jma/jma-eng/jma-center/nwp/outline2019-nwp/index.htm (accessed on 11 March 2022).
  8. Yue, H.; Gebremichael, M.; Nourani, V. Performance of the global forecast system’s medium-range precipitation forecasts in the Niger River Basin. Hydrol. Earth Syst. Sci. 2021, 2021, 1–31. [Google Scholar] [CrossRef]
  9. Dezfuli, A.K.; Ichoku, C.M.; Huffman, G.J.; Mohr, K.I.; Selker, J.S.; Van De Giesen, N.; Hochreutener, R.; Annor, F.O. Validation of IMERG precipitation in Africa. J. Hydrometeorol. 2017, 18, 2817–2825. [Google Scholar] [CrossRef] [PubMed]
  10. Dezfuli, A.K.; Ichoku, C.M.; Mohr, K.I.; Huffman, G.J. Precipitation characteristics in West and East Africa from satellite and in situ observations. J. Hydrometeorol. 2017, 18, 1799–1805. [Google Scholar] [CrossRef]
  11. Gossett, M.; Alcoba, M.; Roca, R.; Cloche, S.; Urbani, G. Evaluation of TAPEER daily estimates and other GPM-era products against dense gauge networks in West Africa, analysing ground reference uncertainty. Q. J. R. Meteorol. Soc. 2018, 144, 255–269. [Google Scholar] [CrossRef] [Green Version]
  12. Satgé, F.; Defrance, D.; Sultan, B.; Bonnet, M.P.; Seyler, F.; Rouché, N.; Paturel, J.E. Evaluation of 23 gridded precipitation datasets across West Africa. J. Hydrol. 2020, 581, 124412. [Google Scholar] [CrossRef] [Green Version]
  13. Maranan, M.; Fink, A.H.; Knippertz, P.; Amekudzi, L.K.; Atiah, W.A.; Stengel, M. A process-based validation of GPM IMERG and its sources using a mesoscale rain gauge network in the West African forest zone. J. Hydrometeorol. 2020, 21, 729–749. [Google Scholar] [CrossRef]
  14. Gaye, C.B.; Diaw, M.; Malou, R. Assessing the impacts of climate change on water resources of a West African trans-boundary river basin and its environmental consequences (Senegal River Basin). Sci. Cold Arid. Reg. 2013, 5, 0140–0156. [Google Scholar] [CrossRef]
  15. Djaman, K.; Balde, A.B.; Rudnick, D.R.; Ndiaye, O.; Irmak, S. Long-term trend analysis in climate variables and agricultural adaptation strategies to climate change in the Senegal River Basin. Int. J. Clim. 2017, 37, 2873–2888. [Google Scholar] [CrossRef]
  16. Huffman, G.J.; Stocker, E.F.; Bolvin, D.T.; Nelkin, E.J.; Jackson, J. GPM IMERG Final Precipitation L3 1 Day 0.1 Degree x 0.1 Degree V06; Savtchenko, A., Ed.; Goddard Earth Sciences Data and Information Services Center (GES DISC): Greenbelt, MD, USA, 2019. [CrossRef]
  17. Huffman, G.J.; Stocker, E.F.; Bolvin, D.T.; Nelkin, E.J.; Jackson, J. GPM IMERG Early Precipitation L3 1 Day 0.1 Degree x 0.1 Degree V06; Savtchenko, A., Ed.; Goddard Earth Sciences Data and Information Services Center (GES DISC): Greenbelt, MD, USA, 2019. [CrossRef]
  18. Funk, C.; Peterson, P.; Landsfeld, M.; Pedreros, D.; Verdin, J.; Shukla, S.; Husak, G.; Rowland, J.; Harrison, L.; Hoell, A.; et al. The climate hazards infrared precipitation with stations—A new environmental record for monitoring extremes. Sci. Data 2015, 2, 150066. [Google Scholar] [CrossRef] [PubMed] [Green Version]
  19. Gupta, H.V.; Kling, H.; Yilmaz, K.K.; Martinez, G.F. Decomposition of the mean squared error and NSE performance criteria: Implications for improving hydrological modelling. J. Hydrol. 2009, 377, 80–91. [Google Scholar] [CrossRef] [Green Version]
  20. Kling, H.; Fuchs, M.; Paulin, M. Runoff conditions in the upper Danube basin under an ensemble of climate change scenarios. J. Hydrol. 2012, 424, 264–277. [Google Scholar] [CrossRef]
  21. Towner, J.; Cloke, H.I.; Zsoter, E.; Flamig, Z.; Hoch, J.M.; Bazo, J.; de Perez, E.C.; Stephens, E.M. Assessing the performance of global hydrological models for capturing peak river flows in the Amazon basin. Hydrol. Earth Syst. Sci. 2019, 23, 3057–3080. [Google Scholar] [CrossRef] [Green Version]
  22. Shahid, M.; Rahman, K.U.; Haider, S.; Gabriel, H.F.; Khan, A.K.; Pham, Q.B.; Mohammadi, B.; Linh, N.T.T.; Anh, D.T. Assessing the potential and hydrological usefulness of the CHIRPS precipitation dataset over a complex topography in Pakistan. Hydrol. Sci. J. 2021, 66, 1664–1684. [Google Scholar] [CrossRef]
Figure 1. Map of Senegal River Basin, with the location of selected dams/reservoirs: (1) Manantali, (2) Foum Gleita, and (3) Diama, and the drainage basins defined by the dam locations.
Sustainability 14 03349 g001
Figure 2. Spatial map of annual rainfall (in mm), for the period 15 June 2019 to 15 June 2020, across the Senegal River Basin. (b) GFS (1-day lead time).
Sustainability 14 03349 g002
Figure 3. Monthly time series of sub-basin averaged precipitation (mm), for the period 15 June 2019 to 15 June 2020, derived from IMERG Final, GFS (1-day lead time), IMERG Early, and CHIRPS, for watersheds of three dams in the Senegal River Basin: (1) Manantali, (2) Foum Gleita, and (3) Diama.
Sustainability 14 03349 g003
Figure 4. Watershed-averaged annual precipitation (mm) for the period, 15 June 2019 to 15 June 2020, for each of the Senegal River Basin’s major dams, derived from the 1-day lead GFS forecast and different satellite precipitation products.
Sustainability 14 03349 g004
Figure 5. Daily time series of watershed-averaged precipitation total (mm) for the wet period, derived from various precipitation products, for four dam watersheds in the Senegal River Basin. The Figure also shows the coefficient of variation (CV) as a measure of temporal variation.
Sustainability 14 03349 g005
Figure 6. Summary of performance statistics (Kling-Gupta Efficiency KGE, Bias Ratio BR, correlation R, variability ratio γ, and root mean square error normalized by reference precipitation mean NRMSE) of 1-day lead GFS forecasts and different satellite products, for different dam watersheds in the Senegal River Basin.
Sustainability 14 03349 g006
Figure 7. Scatterplot of watershed-averaged daily precipitation forecast obtained from 1-day lead GFS forecasts against corresponding values from IMERG Final, over each dam watershed in the Senegal River Basin.
Sustainability 14 03349 g007
Figure 8. Kling-Gupta Efficiency (KGE) and its components for 5-day total rainfall forecast of GFS for three different lead time periods, 1–5 day, 5–10 day, and 10–15 day, and over the selected dam watersheds of the Senegal River Basin.
Sustainability 14 03349 g008
Figure 9. Same as for Figure 7 but for 15-day accumulation.
Sustainability 14 03349 g009
Table 1. Major reservoir dams in the Senegal river basin.
DamsCountryOperational SinceCapacity (Million m3)Power (MW)PurposeArea of Drainage Basin (km2)Elevation of Drainage Basin (m)
IrrigationHydroelectricity
ManantaliMali198811,270104xx29,340560
Foum GleitaMauritania1988500 x 9513128
DiamaSenegal1986250 x 43,1603199
Table 2. Performance statistics of daily GFS forecast for various lead times (1-day, 5-day, 10-day, and 15-day) using IMERG Final (CHIRPS) rainfall products as reference, in terms of correlation, bias ratio, and NRMSE.
Lead Time of GFS ForecastCorrelationBias RatioKGENRMSE (%)
Manantali
1-day0.50 (0.56)1.37 (1.22)0.29 (0.46)120 (96)
5-day0.43 (0.44)1.22 (1.09)0.31 (0.39)119 (102)
10-day0.23 (0.41)1.39 (1.24)0.07 (0.31)145 (111)
15-day0.09 (0.20)1.61 (1.44)-0.13 (0.07)184 (150)
Foum Gleita
1-day0.62 (0.58)0.75 (1.05)0.53 (0.55)197 (234)
5-day0.34 (0.44)0.67 (0.93)0.06 (0.12)287 (327)
10-day0.22 (0.29)0.78 (1.08)0.19 (0.28)273 (295)
15-day0.42 (0.30)0.70 (0.97)0.33 (0.27)238 (293)
Diama
1-day0.66 (0.68)0.94 (1.12)0.65 (0.66)108 (109)
5-day0.60 (0.67)0.81 (0.96)0.55 (0.65)116 (105)
10-day0.36 (0.44)0.94 (1.12)0.34 (0.42)144 (137)
15-day0.31 (0.30)0.93 (1.10)0.30 (0.29)148 (153)
Publisher’s Note: MDPI stays neutral with regard to jurisdictional claims in published maps and institutional affiliations.

