Article

Effects of Warming and Precipitation on Soil CO2 Flux and Its Stable Carbon Isotope Composition in the Temperate Desert Steppe

1
College of Grassland, Resources and Environmental, Inner Mongolia Agricultural University, Hohhot 010019, China
2
College of Science, Inner Mongolia Agricultural University, Hohhot 010019, China
3
School of Natural Resources, Faculty of Geographical Science, Beijing Normal University, Beijing 100875, China
4
Inner Mongolia Academy of Agricultural & Animal Husbandry Science, Hohhot 010031, China
*
Author to whom correspondence should be addressed.
These authors contributed equally to this work.
Sustainability 2022, 14(6), 3351; https://doi.org/10.3390/su14063351
Submission received: 18 February 2022 / Revised: 7 March 2022 / Accepted: 10 March 2022 / Published: 12 March 2022

Abstract

:
The stable carbon (C) isotope of soil CO2 efflux (δ13CO2e) is closely associated with soil C dynamics, which have a complex feedback relationship with climate. Three levels of warming (T0: ambient temperature (15.7 °C); T1: T0 + 2 °C; T2: T0 + 4 °C) were combined with three levels of increased precipitation (W0: ambient precipitation (245.2 mm); W1: W0 + 25%; W2: W0 + 50%) in order to quantify soil CO2 flux and its δ13CO2e values under nine treatment conditions (T0W0, T0W1, T0W2, T1W0, T1W1, T1W2, T2W0, T2W1, and T2W2) in desert steppe in an experimental beginning in 2015. A non-steady state chamber system relying on Keeling plots was used to estimate δ13CO2e. The temperature (ST) and moisture (SM) of soil as well as soil organic carbon content (SOC) and δ13C values (δ13Csoil) were tested in order to interpret variations in soil CO2 efflux and δ13CO2e. Sampling was carried out during the growing season in 2018 and 2019. During the experiment, the ST and SM correspondingly increased due to warming and increased precipitation. CO2 flux ranged from 37 to 1103 mg m−2·h−1, and emissions peaked in early August in the desert steppe. Warming of 2 °C to 4 °C stimulated a 14% to 30.9% increase in soil CO2 efflux and a 0.4‰ to 1.8‰ enrichment in δ13CO2e, respectively. Increased precipitation raised soil CO2 efflux by 14% to 19.3%, and decreased δ13CO2e by 0.5‰ to 0.9‰. There was a positive correlation between soil CO2 efflux and ST and SOC indicating that ST affected soil CO2 efflux by changing SOC content. Although the δ13CO2e was positively correlated with ST, it was negatively correlated to SM. The decline of δ13CO2e with soil moisture was predominantly due to intensified and increased diffusive fractionation. The mean δ13CO2e value (−20.2‰) was higher than that of the soil carbon isotope signature at 0–20 cm (δ13Csoil = −22.7‰). The difference between δ13CO2e and δ13Csoile-s) could be used to evaluate the likelihood of substrate utilization. 13C enriched stable C pools were more likely to be utilized below 20 cm under warming of 2 °C in the desert steppe. Moreover, the interaction of T × W neither altered the CO2 emitted by soil nor the δ13CO2e or Δe-s, indicating that warming combined with precipitation may alleviate the SOC oxidation of soil enriched in 13C in the desert steppe.

1. Introduction

According to recent model predictions, the concentration of greenhouse gases (GHG) will keep rising for centuries beyond 2100 [1]. Soil, as a vital store pool of carbon (C), is a crucial source of GHG and sensitive factor in climate change [2,3]. The accumulation of soil C depends on the input of aboveground vegetation and the release of soil respiration [4]. Thus, estimating soil CO2 flux (CO2 released from soil to atmosphere by subterranean biotic metabolism) is important for quantifying terrestrial C budgets and ultimately for determining whether the soil will become a net C source or sink when accounting for climatic changes [5,6]. The CO2 released from soil is an environment-dependent process which varies with the respiratory metabolic capacity and diffusion conditions of soil [7]. Higher soil temperatures (ST) can increase soil CO2 flux to the atmosphere [2,8]. A previous study demonstrated that soil heterotrophic respiration was limited by soil moisture (SM) in a dry grassland [9]. However, little attention has been paid to attempting to quantify soil CO2 changes with the precise magnitude of warming and precipitation increase [10,11]. Hence, accurately quantifying the response of soil CO2 flux to simulated climatic changes and related mechanisms is a promising approach for predicting future changes in atmospheric CO2 concentration [2].
The carbon isotope of soil respiration (δ13CO2s), an integrated indicator, plays an important role in distinguishing the temperature sensitivities between “old soil carbon” and “young soil carbon” [12] (or carbon source research [13] in recent years). Grassland-derived carbon represents “old” carbon, which is a more stable carbon pool, while vegetation input represents labile “young” carbon. Nevertheless, δ13CO2s is not measured directly; rather, it is reported that the stable carbon isotope composition of soil CO2 efflux (δ13CO2e) is a good proxy for the stable carbon isotope of soil respiration (δ13CO2s) [14] and a good predictor of belowground C dynamic, though there are divergences between δ13CO2e and δ13CO2s due to the disequilibrium effect [15]. Gamnitzer et al. [15] discussed four factors affecting the disequilibrium effect, namely, diffusion, advection and dissolution of CO2 in soil, and belowground and aboveground respiration of both 12CO2 and 13CO2 isotopologues.
Grasslands are sensitive to climate change, and can act as either a biological C sink or a source depending on conditions [16,17]. Measuring soil respiration is arguably the best method to quantify the release of C from soil organic carbon content (SOC) [18]. The exchange process of CO2 between soil and atmosphere is complex and not well understood [19]. Fortunately, δ13C has been used to investigate soil CO2 changes in different environments. For instance, greater depletion in the δ13C values of CO2 respired with temperature have been reported due to preferential consumption of 13C-depleted substrates by arctic microbes at higher temperatures in a tundra ecosystem [20]; the δ13C of soil respiration was 4.7% more enriched in the low-moisture treatment [21]. Previous studies have investigated seasonal variations in δ13CO2e in subalpine grassland [16], alpine meadow ecosystems [22], and deciduous, evergreen and, beech forests [23,24], and were found to reach a peak in the summer. From the above, it can be seen that the δ13C of soil CO2 efflux is mainly dependent on ST and SM, due to diffusion conditions [5]. However, particularly in desert steppe, it is unclear how the soil environment affects microbial use of carbon [25]; indeed, uncertainty exists as to the variation of δ13CO2e under climate change disturbances. Here, we carried out an investigation of variations in soil CO2 flux and the potential substrate sources of CO2 efflux using the δ13CO2e and δ13C of soil (δ13Csoil) after four to five years of climate manipulation in a desert steppe environment in China. The objectives were: (1) to estimate the short-term consequences of the single-factor and interactive effects of warming and increased precipitation on CO2 flux and δ13C values during the growing season; (2) to provide sample parameters of δ13CO2e values in desert steppe; and (3) to estimate substrate preferences for soil respiration using δ13C values (e.g., gas and soil) under non-incubator conditions.
Closed (non-steady state), open (steady state), and dynamic chamber systems are the primary means used to measure δ13CO2e, and each has its own advantages and disadvantages. For instance, while closed chambers are convenient to operate, they rely on Keeling plots to predict δ13CO2e, which are very sensitive to an individual point and may not be linear within a chamber. Additionally, while both open and dynamic systems can provide simultaneous rate measurements, these systems require field power and take at least 1 h to establish steady state measurements [4]. In our study, using a closed chamber based on the Keeling plots approach to estimate δ13CO2e had the advantage of reducing bias by shortening the measurement time and increasing the sampling frequency [5]. This study focused on how the values of δ13CO2e responding to warming and precipitation; therefore, the inherent deviation under the same measurement method was neglected. The Keeling plot method of calculating the flux, δ13C, described a linear relationship between δ13C and the inverse of the CO2 concentrations [26]. The intercept of the linear regression represents the δ13C value of the released CO2.
Warming has been found to increase the ratio of C4 species in desert steppe [27]. C4 plants are more highly enriched in 13C. Furthermore, up to 40% of photosynthates are exudated by roots are rapidly respired or invested in biomass by rhizosphere microorganisms [28]. Hence, the respiration substrates of enrichment in 13C will have a positive effect on the δ13CO2e value. Based on the above findings, we hypothesized that: (1) soil respiration substrates would be more enriched in 13C under warming, leading to an enriched δ13CO2e value [29]; (2) the values of δ13CO2e would decrease with increasing precipitation because gas diffusion is inhibited by soil moisture [5]; (3) the relationship between the δ13CO2e and δ13C values of soil could be used to indicate discrimination between substrates based on SOC decomposition under different treatments.

2. Materials and Methods

2.1. Study Area

The study was conducted on a desert steppe experimental site located at the Inner Mongolia Academy of Agriculture and Animal Husbandry Research Station (41°47′17″ N, 111°53′46″ E). The site has an elevation of 1456 m and is characterized by a temperate continental climate. The average air temperature at the research station (1961 to 2019) is 3.7 °C, and the mean annual precipitation is 261.3 mm, of which nearly 75% occurs between June and September. The vegetation of the desert steppe is generally sparse, dominated by perennials and xerophytes with an average height of 8 cm [30]. The experiment area was dominated by Stipa breviflora Griseb., Artemisia frigida Willd., and Cleistogenes songorica (Roshev.) Ohwi accompanied by Allium mongolicum (Rege.) Lson., Allium tenuissimum L., Convolvulus ammannii Desr., and Neopallasia petinata (Pall.) Poljak. The main soil type is Kastanozems (FAO soil classification), with a loamy sand texture [31]. The soil is relatively barren, with an SOC content of 14 g/kg. Before the trial started in 2015, four plots were randomly chosen to measure SOC content. The average SOC content was 14.8 g/kg at 0–10 cm and 12.2 g/kg at 10–20 cm.

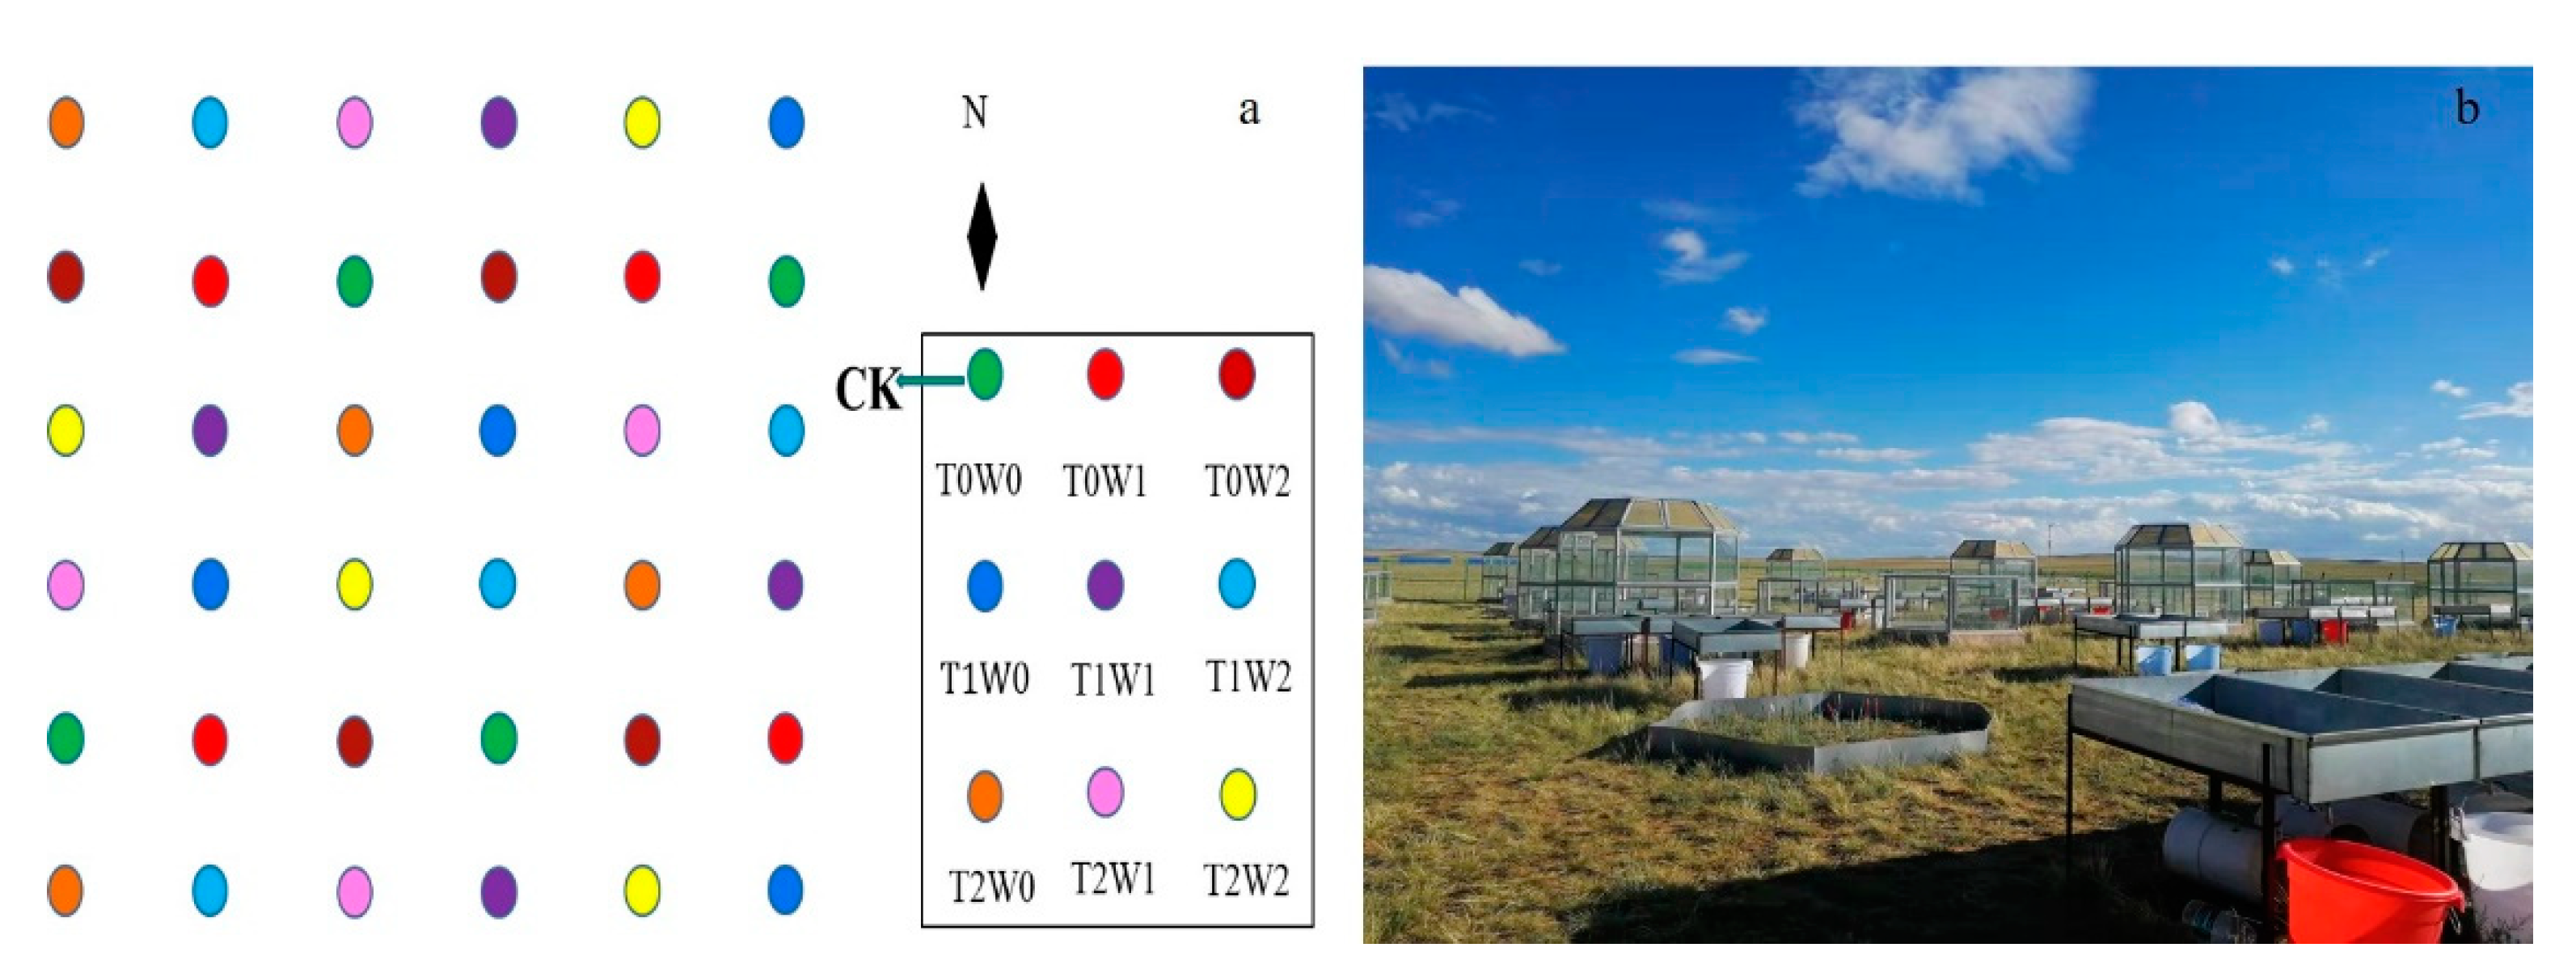
2.2. Experiment Design

Experimental manipulations were started in 2015 in order to simulate the effect of warming (T) and precipitation (W). A fence enclosed a portion of flat terrain 40 × 40 m2 with a relatively uniform composition of the plant community in the desert grassland. Samples were collected from June to September in the years 2018 and 2019. Reports indicate that by 2100 the increase in global annual mean temperature will exceed 4 °C, and western and northern China and China show a ~15–21% increasing trend in annual precipitation [2]. Depending on variations in climate, the study simulated three temperature levels (T0: ambient temperature (15.7 °C), T1: T0 + 2 °C and T2: T0 + 4 °C) and three precipitation levels (W0: ambient precipitation (245.2 mm), W1: W0 + 25% and W2: W0 + 50%) (Figure 1a). The trial adopted a two-factor, three-level, and completely random design. Horizontal combinations (treatments) were obtained by cross-grouping, for a total of nine treatments (T0W0, T0W1, T0W2, T1W0, T1W1, T1W2, T2W0, T2W1, and T2W2). Each treatment was replicated in four blocks (5.85 m2) with a distance of 2.5 m between adjacent blocks. Warming treatments (2 °C to 4 °C) were achieved by establishing open-top chambers (OTCs) of different heights (Figure 1b). An OTC is a hexagonal open-top device with a single side length of 1.5 m, a bottom area of 5.85 m2, and two heights: 1 m (fully open, without closing treatment) and 2.3 m (top, with an oblique 45° closing treatment). A ventilation fan was reserved on the side of the main body, along with a door for personnel access. In the test, the increased precipitation treatments (W1 and W2) were realized through self-built precipitation collector devices (Figure 1). The areas of the two water collection devices were 25% and 50% of the OTC base area. After rain, the water collected by the precipitation collector was poured into the OTC evenly over time in order to achieve the effect of increased precipitation.

2.3. Measurements of CO2 and Soil Parameters

During the growing season, gas samples were taken at intervals of approximately two weeks from June to September in 2018 and 2019 (2018: 20 June, 5 July, 20 July, 5 August, 19 August, 8 September and 20 September; 2019: 20 June, 5 July, 20 July, 3 August, 20 August, 5 September and 20 September). White plastic circular tubes (30 cm inner diameter and 50 cm high) were installed with sampling ports and pressure compensation apertures to reduce solar radiative heating of chamber air [32]. Based on investigation of diurnal gas flux variation, gas samples were collected from 09:00 to 11:00 a.m., representing one-day average flux [33]. In the study, gas samples (500 mL) were taken by an automatic timed air pump. The device had four air intakes able to be taken in turn at 0, 10, 20, and 30 min, and dimensions of 20 × 15 × 10 cm3, voltage 3 V, flow 1.5 L/min. Then, the samples were brought back to the laboratory and analyzed with an isotopic analyzer (PicarroG2201-i CO2/CH4/H2O, USA). The 13CO2 and 12CO2 concentration and δ13C values were obtained with the G2201-i, and the G2201-i was matched with a 32-port automatic sampling system which was automatically programmed for sample analysis. In this study, each bag of gas and standard gas was analyzed for 10 min at a flow rate of 70 mL/min. The average value of the last 2 min (12CO2 + 13CO2) of each 10 min was used to calculate the CO2 concentration, and the standard deviation was less than 0.03 ppm. The standard gas (CO2) was provided by the National Standards Center, and had a volumetric concentration of CO2 of 396.9 ppm certified stable carbon isotope value of CO2; a standard of −18.98‰ was used for calibration.
GHG flux was calculated according to the following equation:
F = ρ × (V/A) × ΔC/ΔT
where F is the flux (CO2: mg m−2 h−1) of gas; ρ is the density of gas; ΔC/ΔT is the slope of the linear regression of the gas concentration gradient over time (30 min), with negative values indicating gas uptake; and V and A are the volume (m3) and hood base area (m2), respectively [31].
Soil temperature (5 cm depth) and moisture (0–5 cm) were measured by WET-2 (Soil Moisture, Temperature and Electrical Conductivity Quick Detector) at the same time gas was collected.
Soil samples were taken from each plot at a depth of 0–20 cm in August of 2018 and 2019. Soil samples were processed by sieving, grinding, and removal of carbonate, then and wrapped in tin cups for analysis [34]. The stable carbon isotope value (δ13C), SOC, and carbon–nitrogen ratio (C/N) of soil was analyzed using an element analyzer (Elementar Vario MACRO CUBE, Langenselbold, Germany) coupled to an isotope ratio mass spectrometer (Isoprime 100, Langenselbold, Germany) in the Isotope Analysis Laboratory of Inner Mongolia Agricultural University.

2.4. Isotopic Signature of Soil CO2 Efflux Analysis and Calculation

Stable isotope ratios were expressed in delta notation (δ13C) in ‰ (parts per thousand) relative to the international standard (Pee Dee Belemnite (PDB) for C) [35], following Equation (2):
δ13C = (Rsample/Rstandard − 1) × 1000
where Rsample and Rstandard are the 13C/12C ratios of the sample and the standard, respectively.
The Keeling plot approach was used to assess the stable carbon isotope ratio of CO2 from soil (δ13CO2e). The basis of the Keeling curve is the conservation of mass before and after gas exchange in the ecosystem; that is, the atmospheric concentration of a gas (Ca) in the canopy and the adjacent boundary layer is the sum of the background atmospheric concentration (Cb) and the variable amounts of that gas (Cs) added from sources in the ecosystem. Given conservation of mass,
Ca = Cb + Cs
δ13Ca × Ca13Cb × Cb + δ13Cs × Cs
where δ13C represents the carbon isotope ratio of each CO2 component. Combining Equations (3) and (4) thus results in
δ13Ca = Cb × (δ13Cb − δ13Cs) × (1/Ca) + δ13Cs
Regressions of δ13Ca versus (1/Ca) were performed and the intercept (δ13Cs: integrated value of the CO2 sources) of the regression line was taken as δ13CO2e, as illustrated in detail by Pataki et al. [36]; δ13CO2e represents the integrated isotope ratio of the CO2 concentration after diffusion fractionation by soil respiration.

2.5. Statistical Analyses

Factorial analysis of variance was carried out using a General Linear Model (GLM) procedure in SAS (14.5) to determine the effects of warming (Ti: T0, T1 and T2), precipitation increase (Wj: W0, W1 and W2), year (Yk: 2018 to 2019), date (Dl: days in June, July, August, and September), and the interaction between warming and precipitation increase (Ti × Wj) using the following model:
Y = μ + Ti + Wj + Yk + Dl + (T × W) ij + εijkl
where μ is the overall mean and εijk is the random experimental error. When gas was analyzed over the entire experimental period, the factor Dl in the model was omitted. Pearson correlation analysis was performed between CO2 flux and δ13C values and the soil temperature and moisture.
All statistical analyses were conducted using SAS software Version 14.5 [37] (SAS Institute Inc., Cary, NC, USA). All figures were drawn using Origin software (version: 2021b; OriginLab Corporation, Northampton, MA, USA).

3. Results

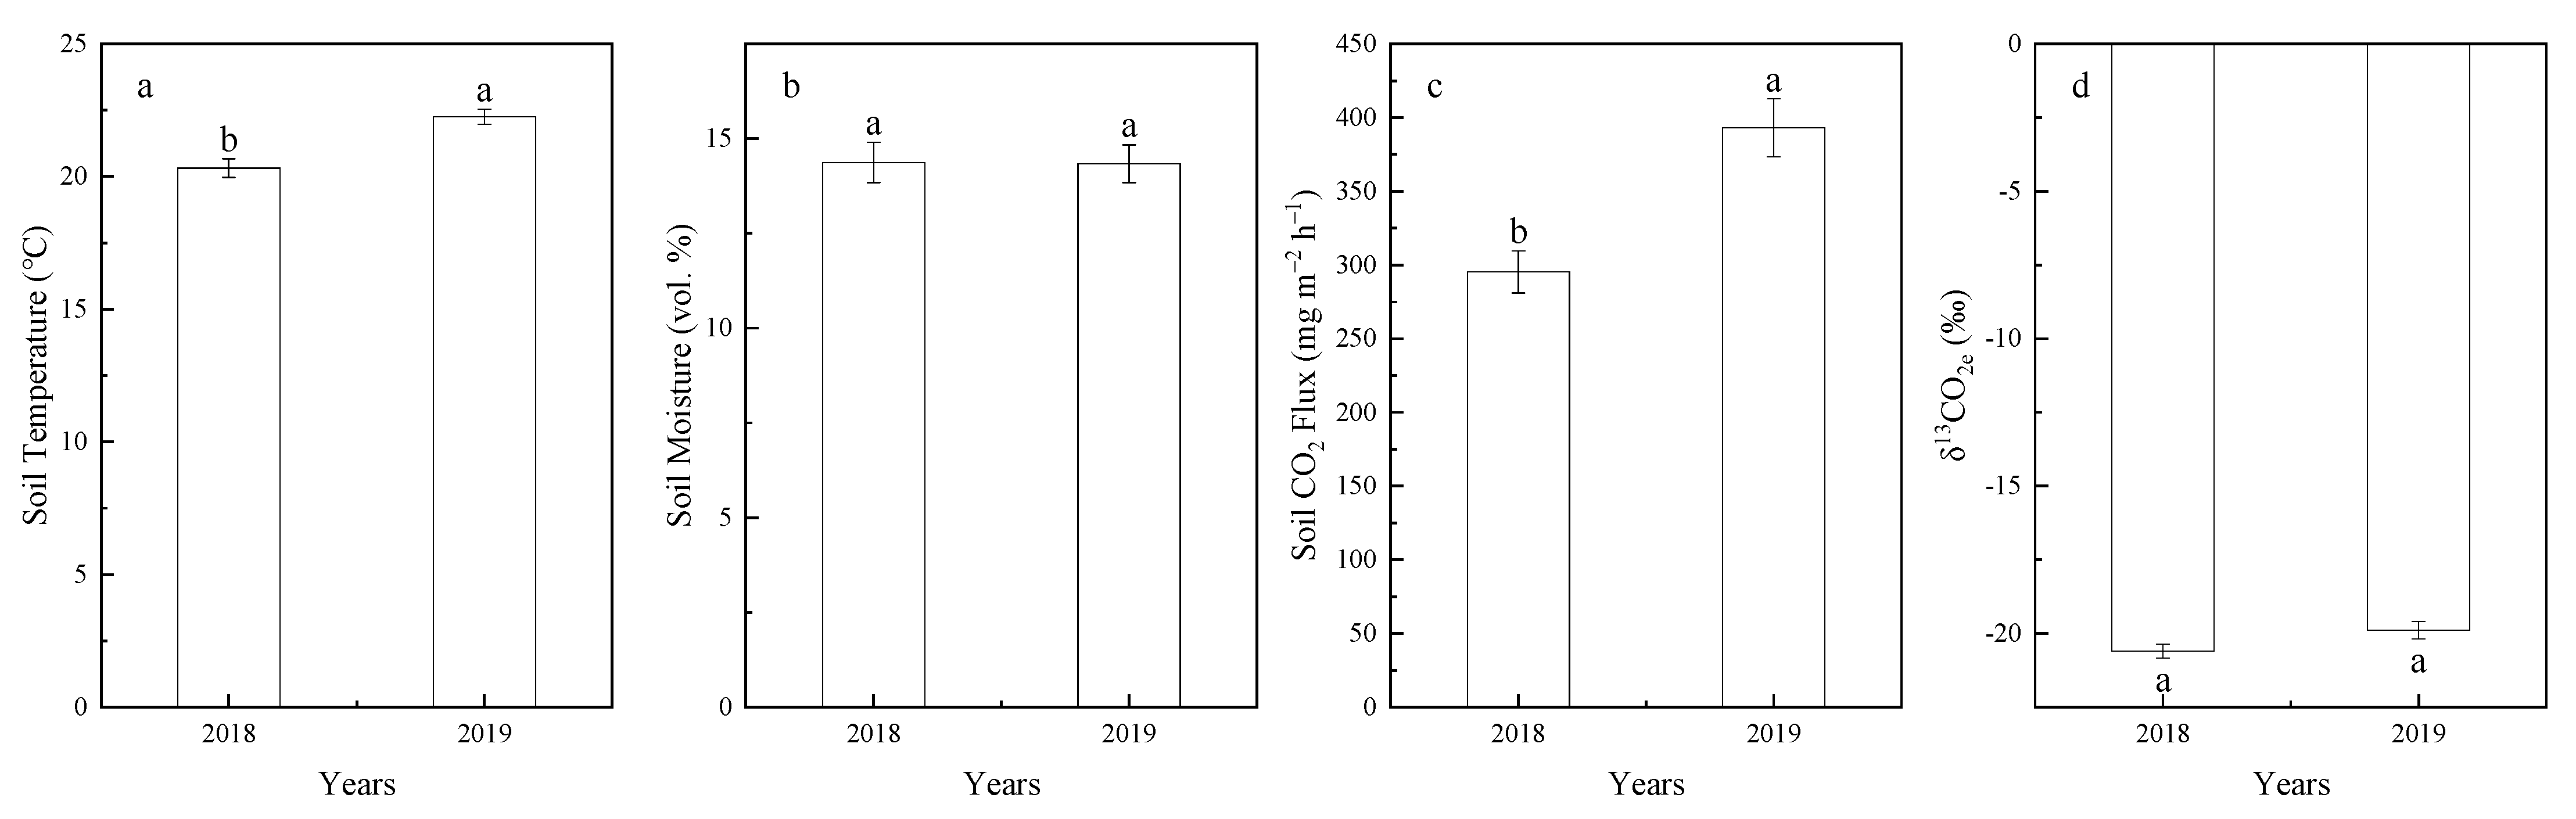
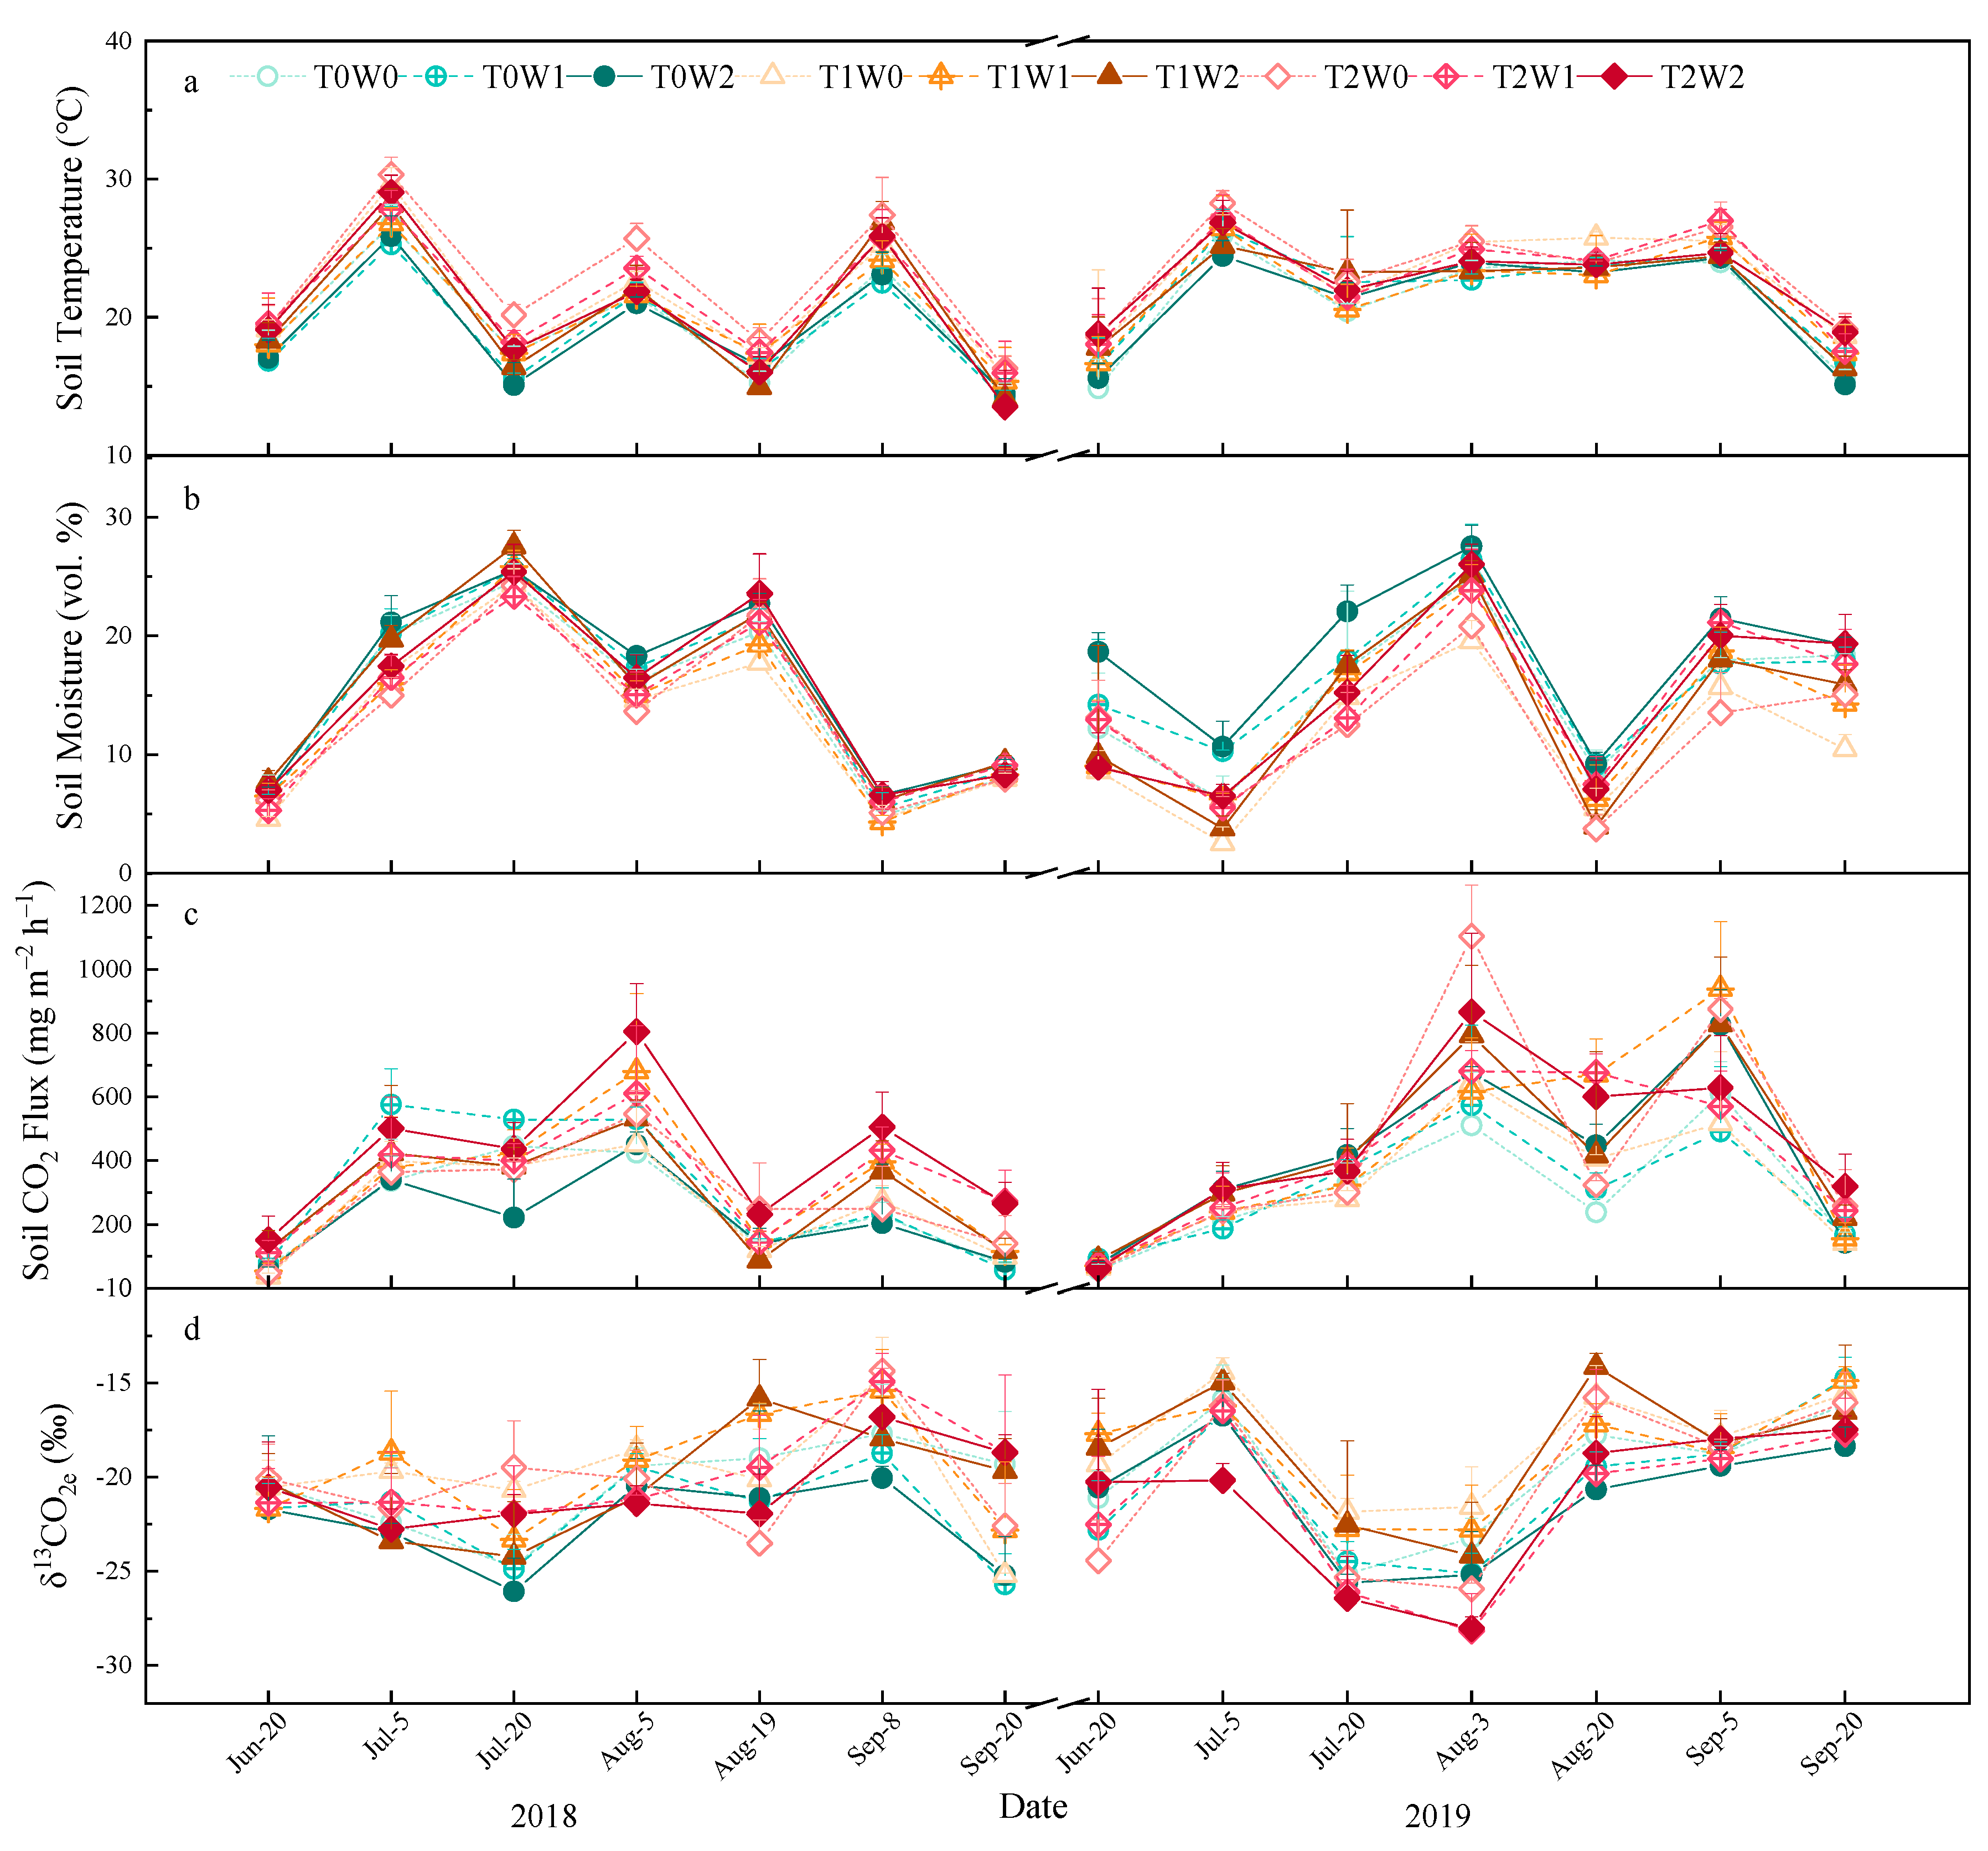
3.1. Effects of Warming and Precipitation on Soil Temperature and Moisture

Soil temperature (ST), soil CO2 flux, and its carbon isotope composition were all significantly affected by year (p < 0.001, Table 1 and Figure 2). However, there were no significant inter-annual differences in soil moisture (SM) (p > 0.05, Figure 2).
Compared with ambient temperature treatment (T0), ST increased to the extent of 1.1 °C and 1.9 °C at T1 and T2, respectively, while SM decreased by 1.9% and 2.5% (p < 0.05, Table 1 and Table 2). When taking the ambient precipitation (W0) treatment as a comparison, SM increased by 1.3% and 2.3% in the 25% and 50% increased precipitation treatments, with a corresponding decline in ST of 0.7 °C and 0.9 °C, respectively (p < 0.05, Table 1 and Table 2). The interaction of warming and precipitation (T × W) had no significant impact on ST and SM. In terms of overall performance, the soil temperature in the T2W0 treatment plot was higher than other interactive treatments in 2018 and 2019 (Table 2). It was observed that T0W2 maintained the highest soil moisture, while the T1W0 treatment plot had the lowest soil moisture. Relatively higher SM was observed on 20 July and 19 August 2018 and 3 August 2019 (Figure 3b).

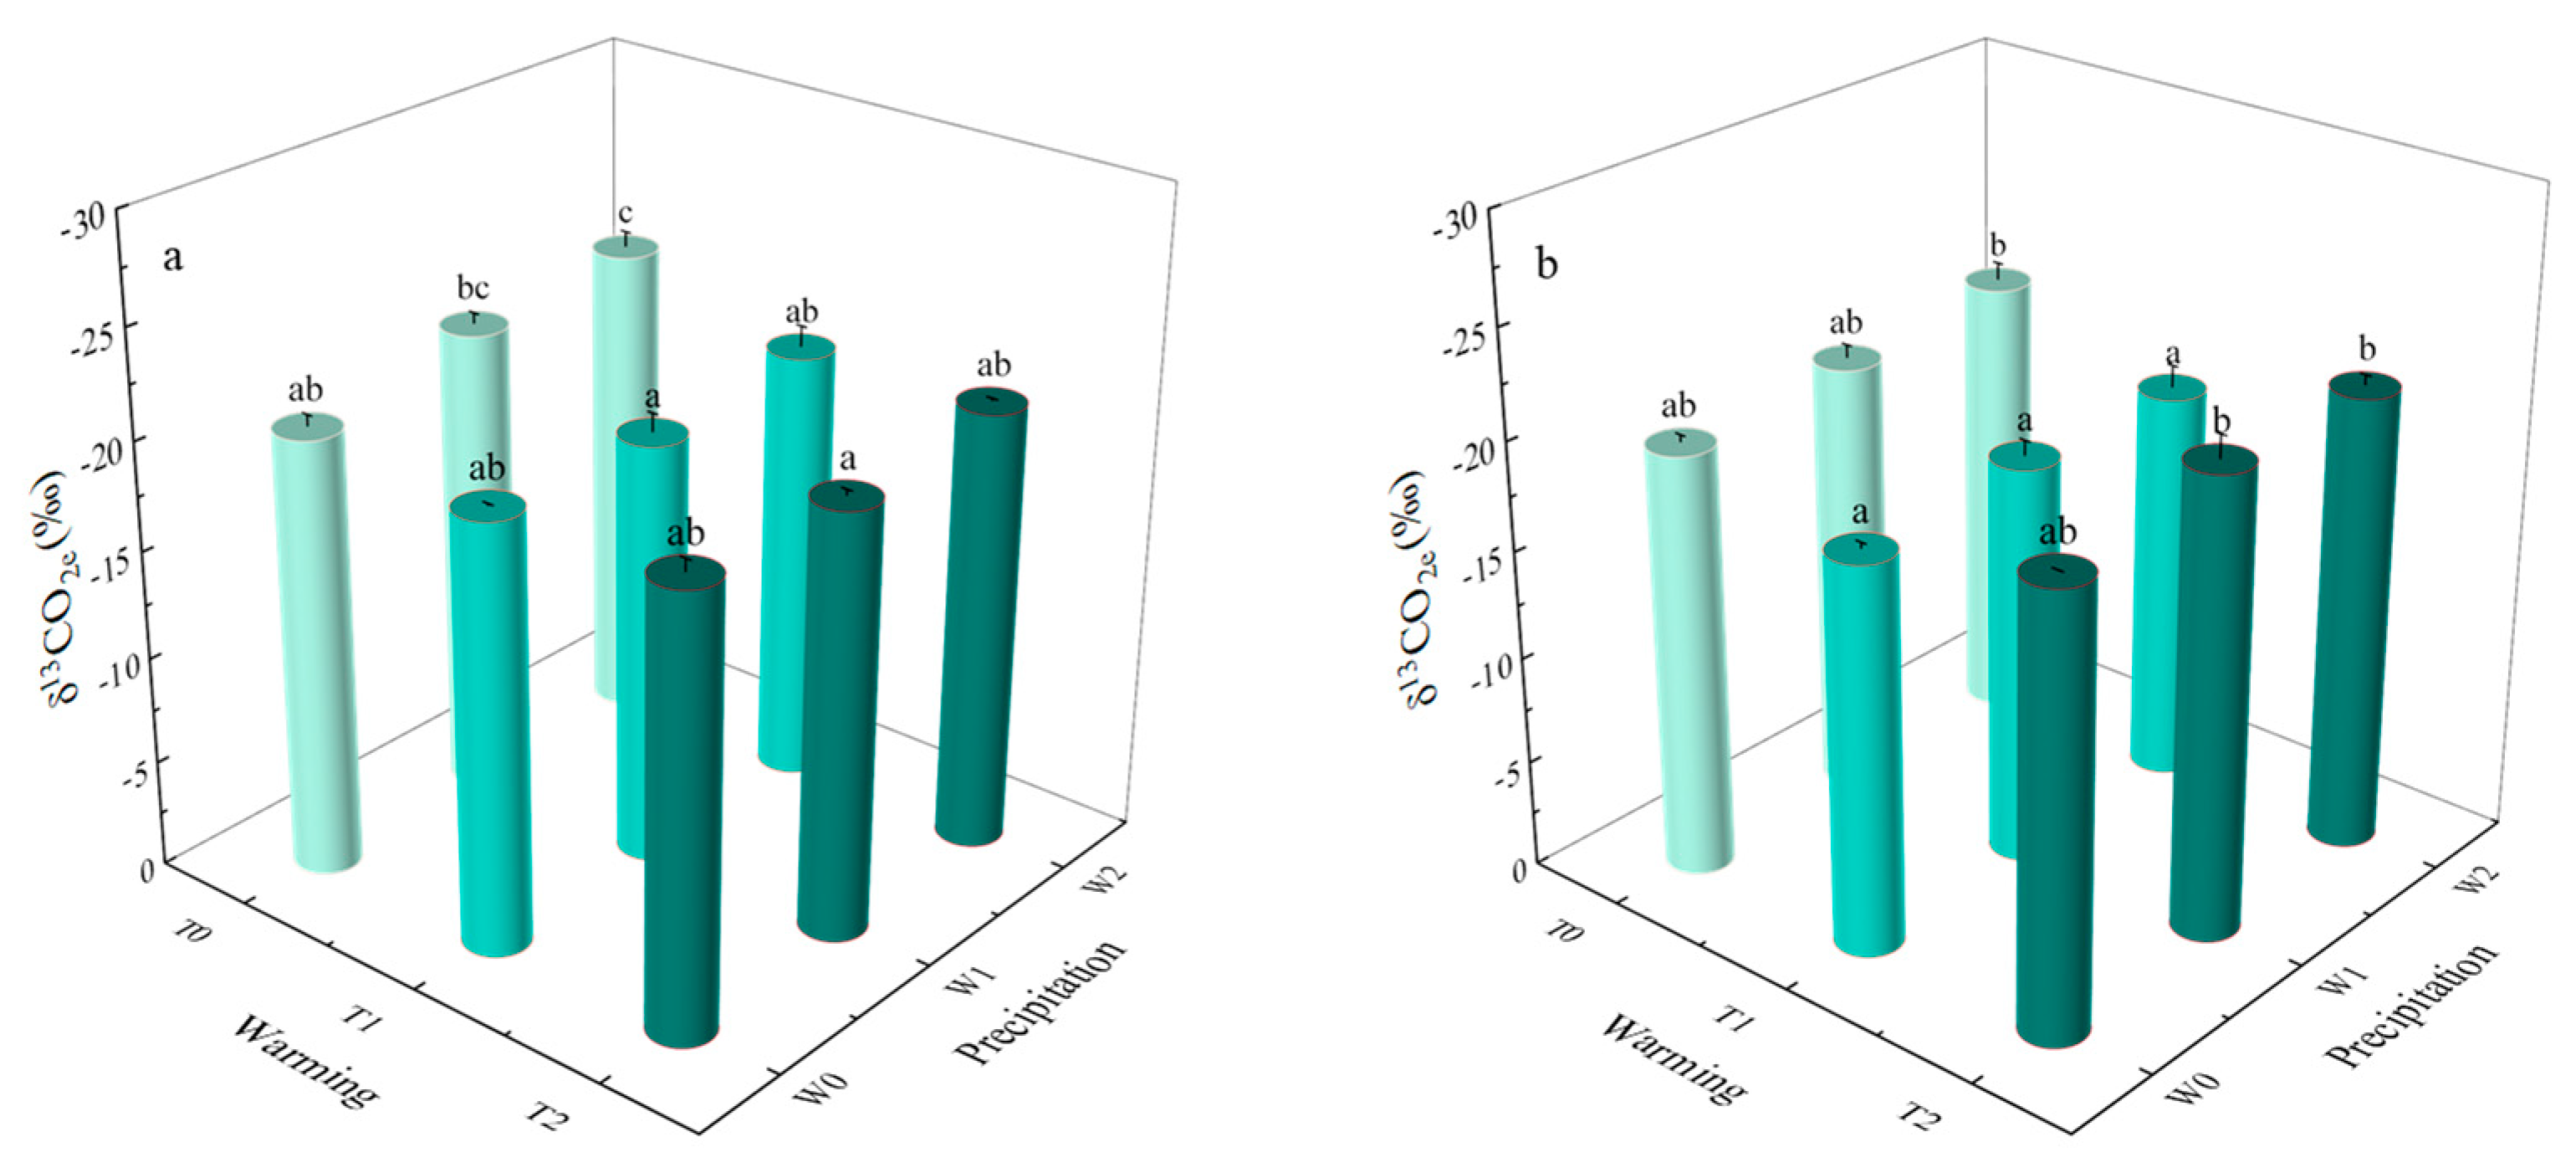
3.2. Effects of Warming and Precipitation on Soil CO2 Flux and Its Isotope Characteristics

Over the growing season in 2018 and 2019, soil CO2 efflux observations showed a continual increase until mid-September in all treatments peaking between the end of July and mid-August (Figure 3c). Soil CO2 flux ranged from 37 to 1103 mg m−2·h−1, with the mean value across all treatments 344.3 ± 240.9 mg m−2·h−1 (Table 2). The soil CO2 efflux increased 14.2% and 30.9% with a respective air temperature increase of 2 °C and 4 °C (T1 and T2) (p < 0.05, Table 1 and Table 2). The average soil CO2 efflux increased by 14% and 19.3% with 25% and 50% increased precipitation, respectively (p < 0.05, Table 2). Yet, soil CO2 efflux did not significantly differ under the interaction of warming and precipitation treatment (p > 0.05, Table 2). Nevertheless, the highest soil CO2 efflux was observed for T2W2 in 2018 and 2019 (Figure 4a,b).
Overall, the δ13C of soil CO2 efflux (δ13CO2e) varied from −28.2‰ to −14.1‰ across treatments, with a mean of −20.2 ± 3.7‰. The signal δ13CO2e of the control plots underwent an increasing trend from 20th Jun to early September, and decreased from 20 September 2018 (Figure 3d). The δ13CO2e under T1 treatment (−19.2‰) was significantly enriched compared with T0 treatment (increased by 1.8‰). Moreover, there was a significant decrease in δ13CO2e with increased precipitation (p < 0.05, Table 1); δ13CO2e values decreased 0.5‰ to 0.9‰ with precipitation increase (Table 2). Under different precipitation levels (W0, W1, and W2), all δ13CO2e values showed a trend of first rising and then falling with the temperature gradient (Figure 5a,d). The interaction of warming and precipitation had no significant effect on δ13CO2e values.

3.3. Effects of Warming and Precipitation on SOC and Its δ13C Values

The average SOC content (0–20 cm) in the study area was 13.2 g/kg. There was a significant difference in SOC between 2018 and 2019. Compared with the control, the SOC under the 2 °C and 4 °C warming treatments was significantly increased, by 6.09% and 13.6%, respectively (p < 0.05, Table 3). The interaction of warming and precipitation increase had no significant impact on SOC (p > 0.05, Table 3).
The average stable carbon isotope value of the soil (δ13Csoil, 0–20 cm) in desert grassland is −22.7‰ (Table 3), and the δ13Csoil value in 2018 was significantly higher than in 2019. Warming significantly increased the δ13Csoil values (p < 0.05, Table 3). The mean δ13Csoil values with the 2 °C and 4 °C warming treatments were 0.95‰ and 1.5‰ higher than control, respectively (Table 3). The increased precipitation treatment had no significant influence on δ13Csoil values, whereas the interaction of T and W had a significant impact on the δ13Csoil value; the δ13Csoil value under the T2W0 treatment was significantly higher than other treatments.

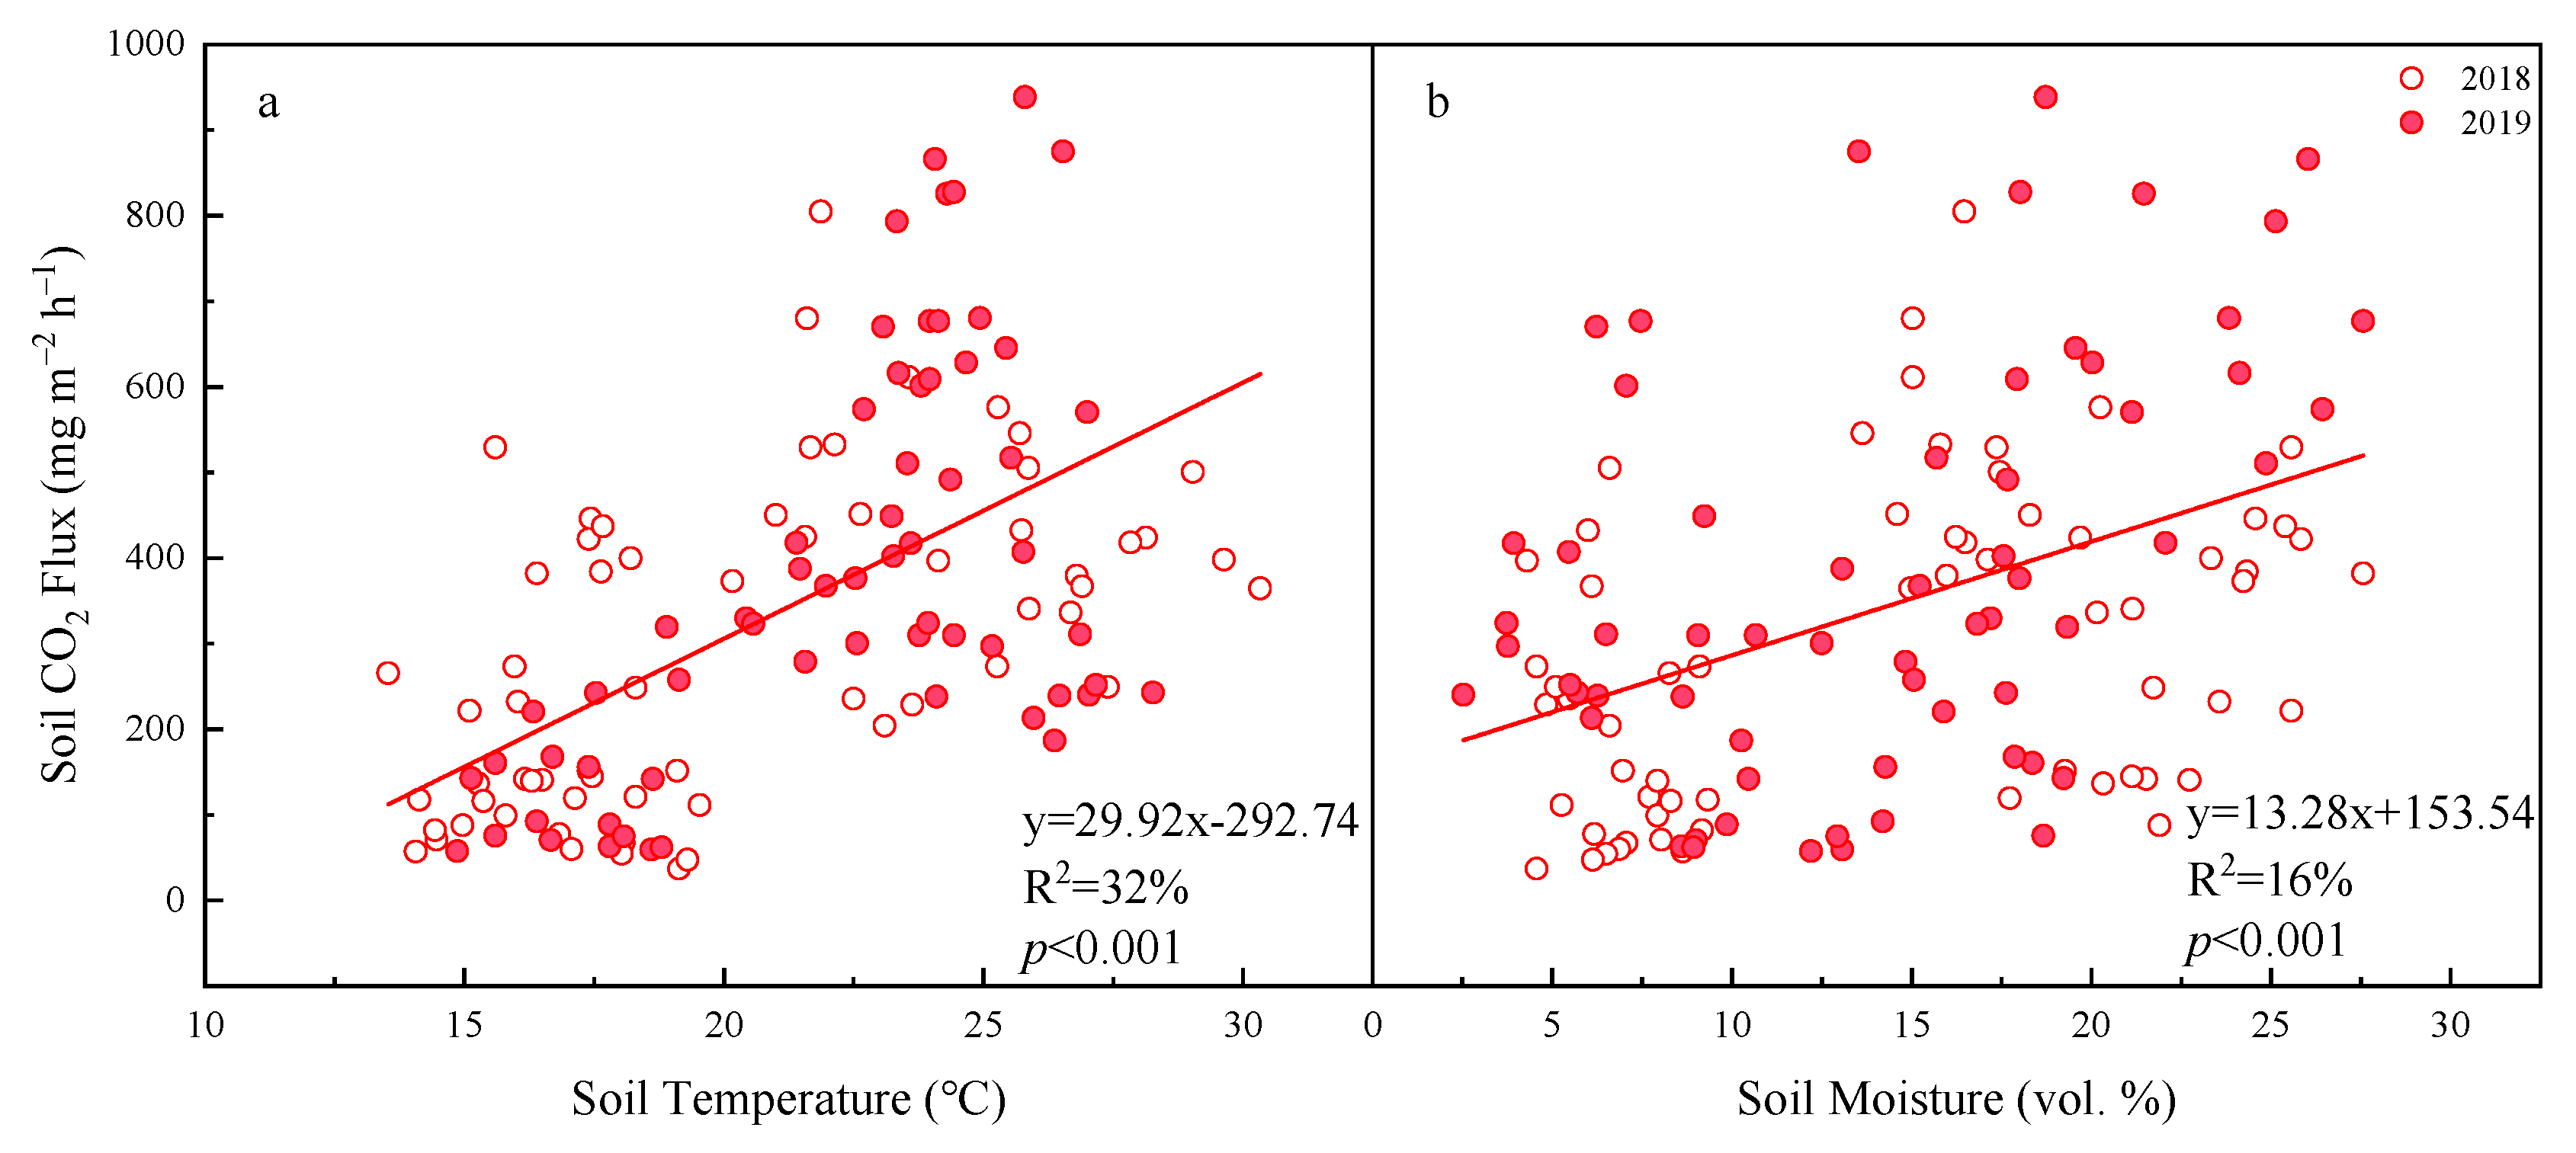
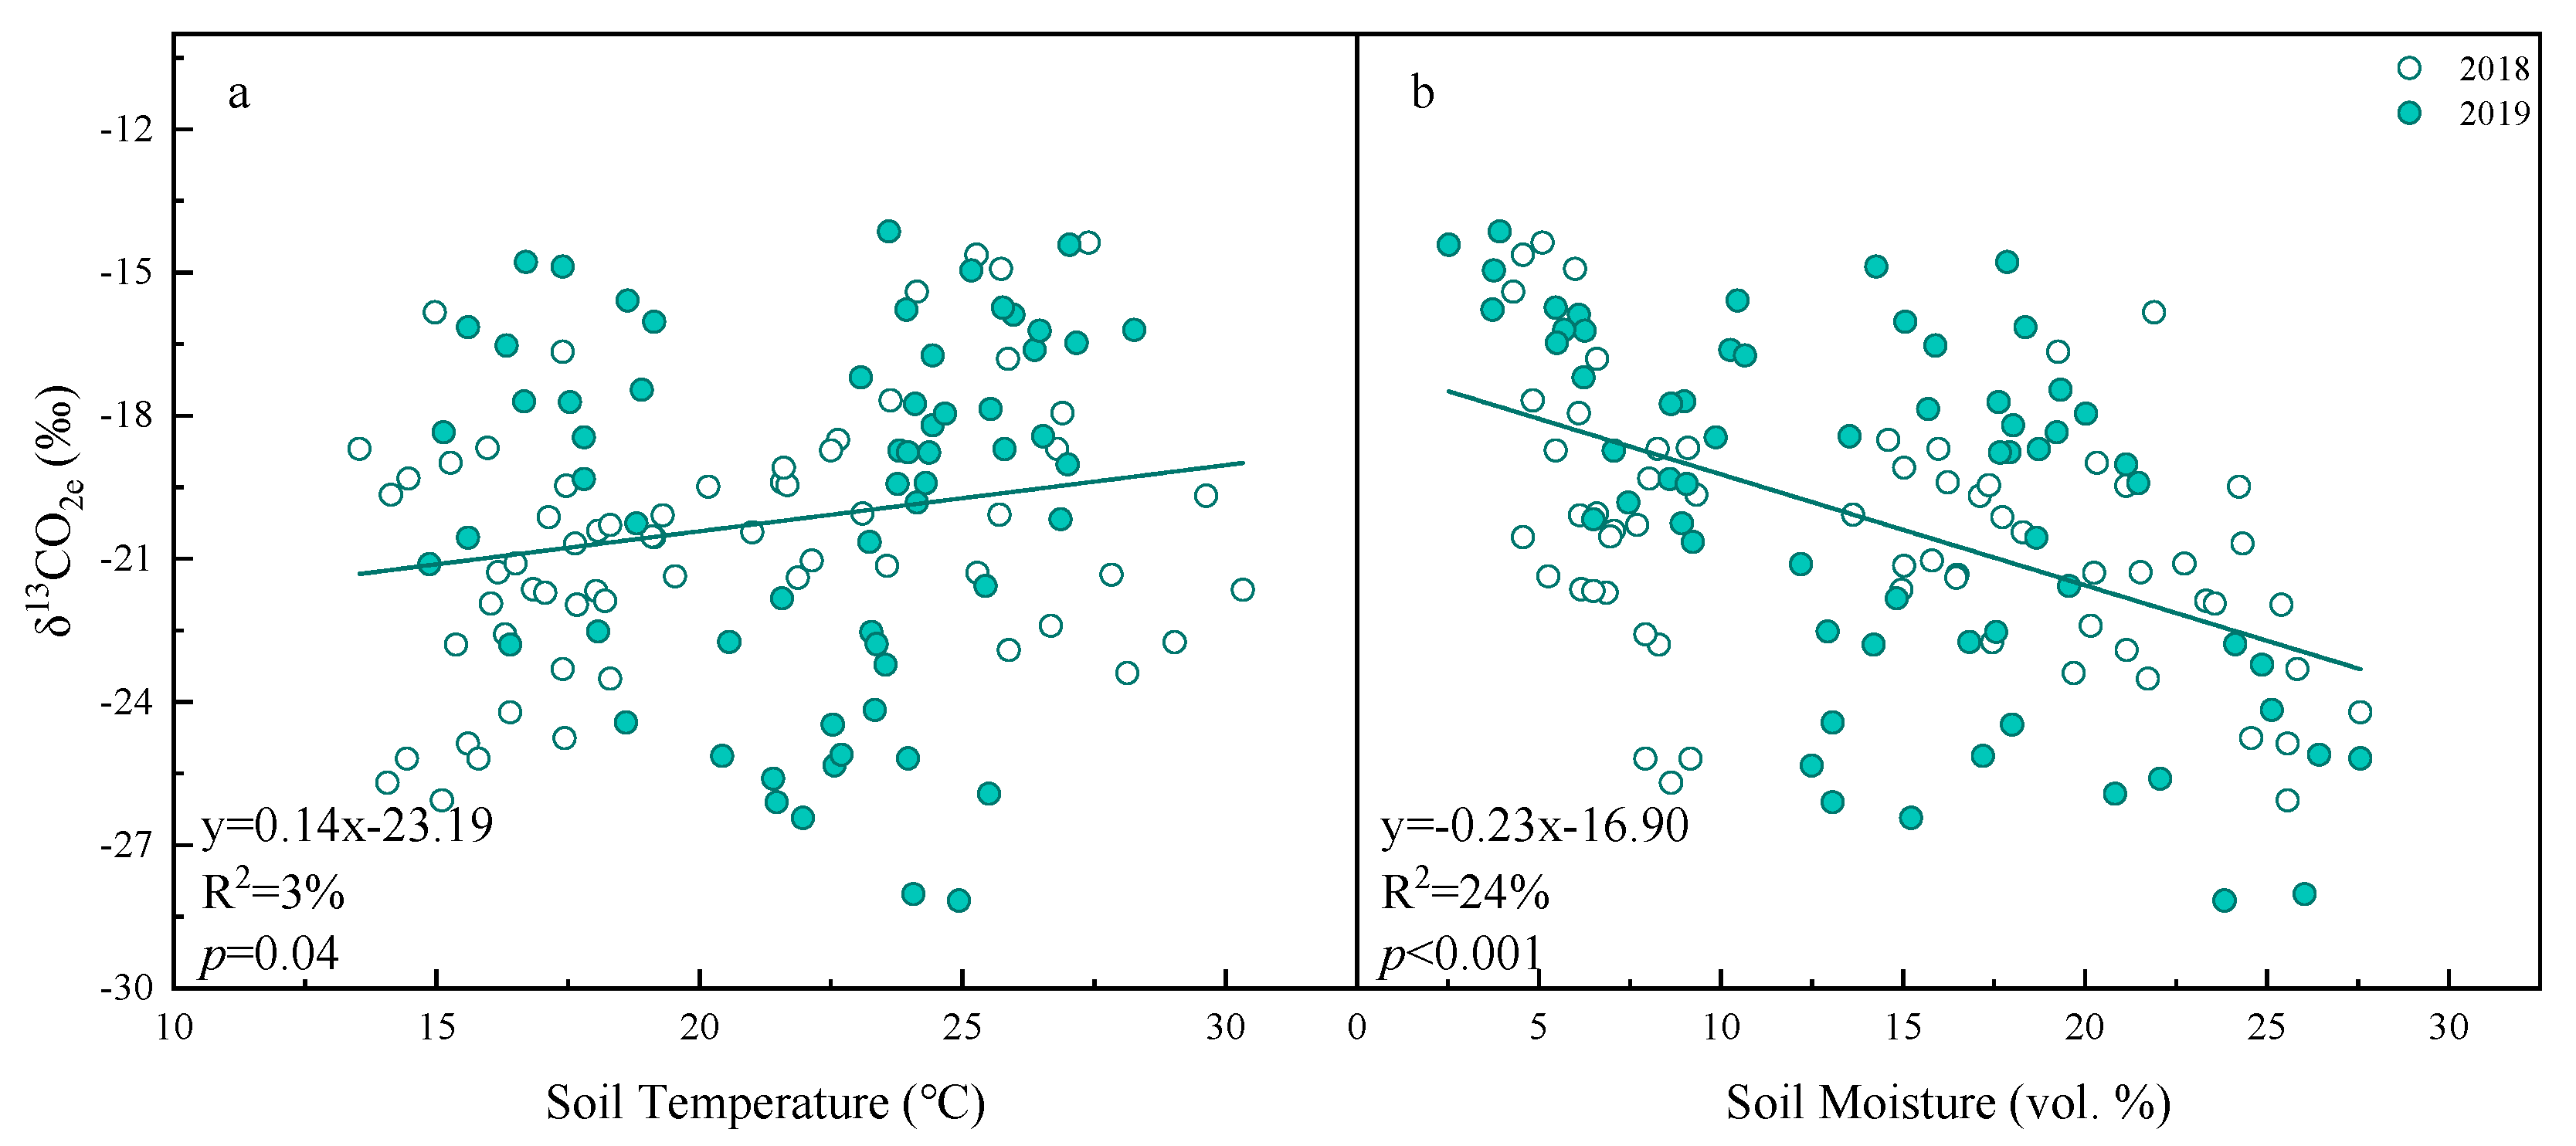
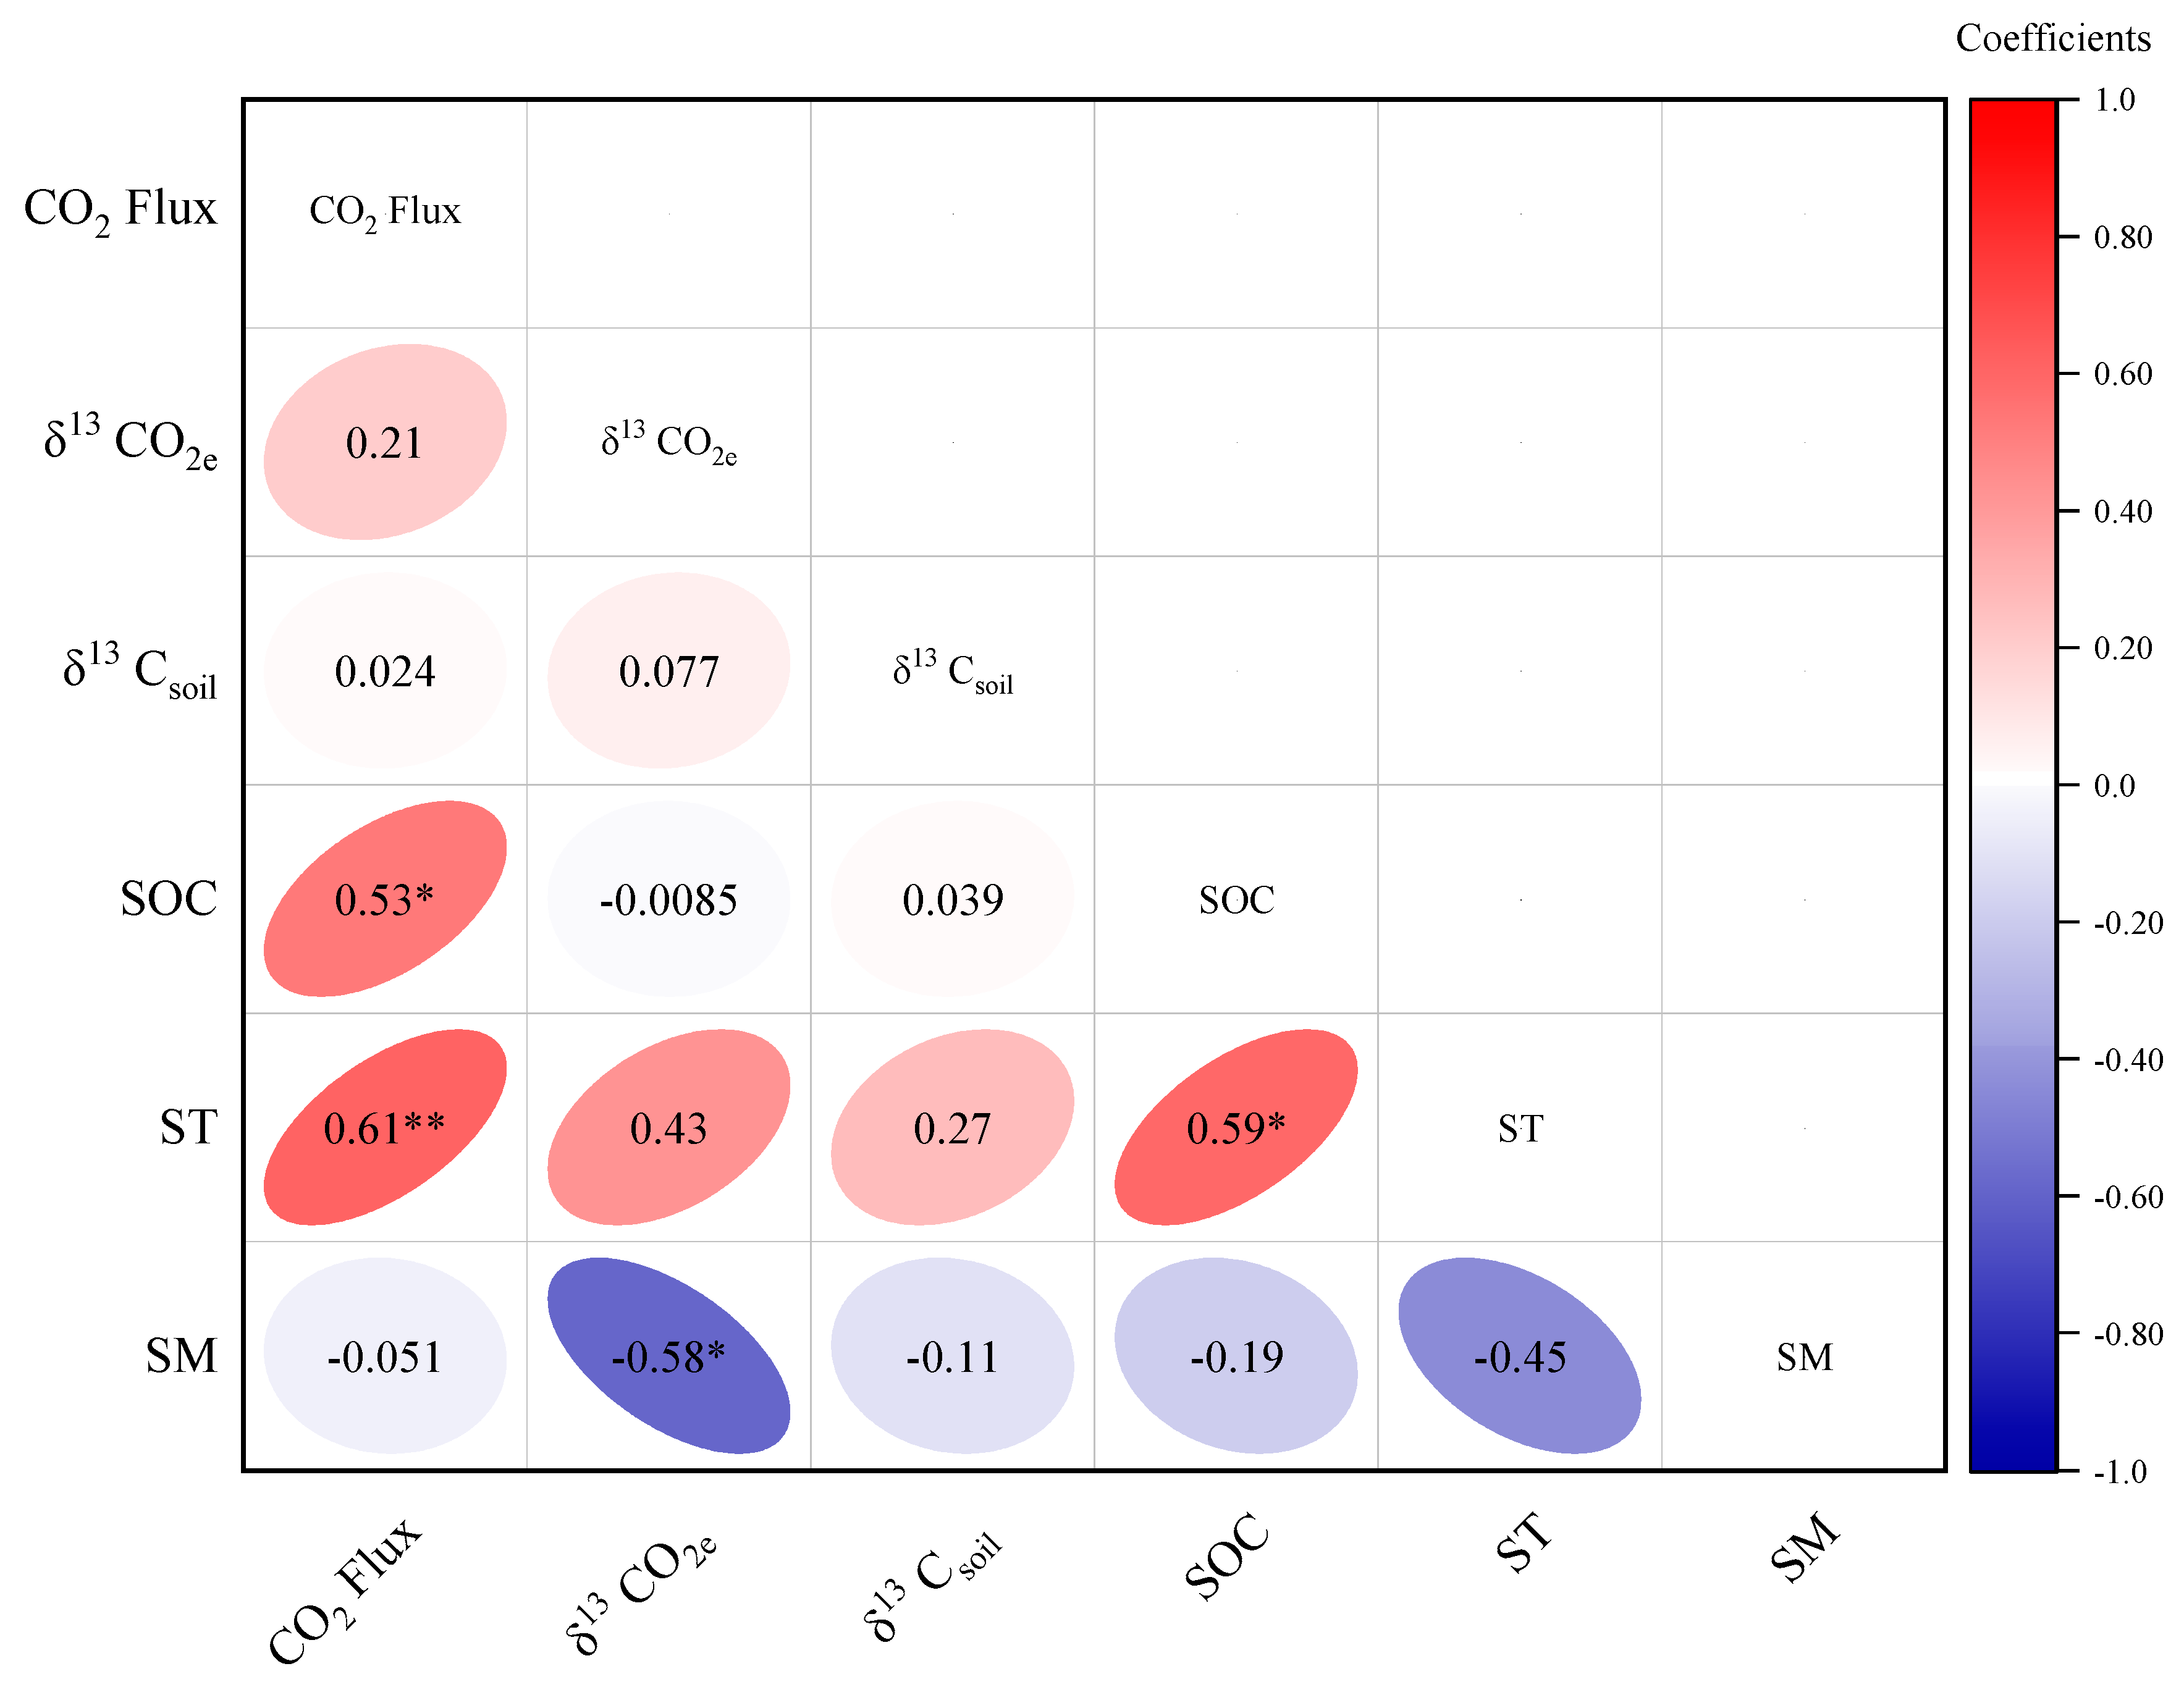
3.4. Key Factors Affecting Soil CO2 Efflux and Its δ13C Values

Across all treatments, significant positive relationships were observed between soil CO2 flux and ST (p < 0.001, Figure 6a) and SM (p < 0.001, Figure 6b). A linear model with ST as a predictor variable explained 32% of the variation in soil CO2 flux. Although δ13CO2e was significantly positively correlated with ST (p < 0.05, Figure 7a), the degree of explanation was relatively low (R2 = 3%). The δ13C of soil CO2 efflux was negatively correlated with SM (R2 = 24%, Figure 7b), whereas no significant relationships were found between δ13CO2e and the C content and δ13C of soil. In addition, the close relationship of soil CO2 flux and SOC content was seen during measurement (r = 0.53, p < 0.05, Figure 8) Further, a significant positive correlation was found between SOC content and ST (r = 0.59, p < 0.05, Figure 8).

3.5. The Difference between δ13C Values of Soil CO2 Efflux and SOC

All differences from δ13CO2e to δ13Csoil at 0–20 cm (Δe-s = Δefflux-soil = δ13CO2e − δ13Csoil) in the plots were above zero. The average annual value of Δe-s was 2.4‰, and Δe-s showed significantly higher values at T1 compared with T0 and T2 treatment (p < 0.001, Table 4); Δe-s significantly decreased with increased precipitation (p < 0.05, Table 4). The interaction of T×W had no significant effect on Δe-s.

4. Discussion

4.1. Effect of Warming and Precipitation on Soil CO2 Efflux

Global climate change has a great impact on soil carbon dynamics in desert steppe, and soil respiration is an important pathway of carbon emission [38]. This study obtained the soil CO2 flux under warming, increased precipitation, and their interaction in the temperate desert steppe. The results found significant inter-annual variation in soil CO2 flux in 2018 and 2019 (Figure 2), in line with previous research [2]. In addition, soil CO2 flux followed a seasonal variation, peaking in the summer [11].
The observations showed that warming caused significant improvement in ST and SOC in desert steppe. The enhanced SOC under warming may be due to the C input from aboveground being greater than that consumed due to increased microbial activity [11,39]. Meanwhile, warming enhanced the soil CO2 efflux during the growing seasons of 2018 and 2019, as supported by the positive correlation between soil CO2 flux and ST. Every increase of one unit in soil temperature will increase soil CO2 emissions by 29.92 mg m−2·h−1. These results indicate that desert steppes exacerbate soil CO2 emissions during the growing season on account of climate warming, which is unfavorable for greenhouse gas emission reduction. Indeed, soil CO2 flux had a strong positive relationship with ST. The result was in agreement with the finding that ST plays an important role in soil respiration [40]. Furthermore, the positive relationship between ST and SOC content was confirmed (Figure 8). Additionally, soil CO2 flux increased with SOC, and the Pearson correlation coefficient between the two variables was 0.53. Therefore, the increase of soil CO2 flux caused by warming may be attributed to the enhanced SOC caused by warming (Table 3) [11]. However, this speculation must be interpreted with caution as warming-induced CO2 emissions are likely linked to higher levels of microbial activity and enhanced plant C input [11]. Hence, higher microbial activity corresponding to high substrate availabilities (abundant SOC) facilitates increased soil CO2 production. This is consistent with previous warming experiments illustrating the phenomenon of increasing CO2 emissions, which are possibly due to increased carbon ingress, increased soil microbial activity, and increased SOC mineralization [11,41]. However, Zhao et al. [42] suggested that moderate warming decreases soil CO2 emissions in semi-arid and arid ecosystems because moderate warming improves CO2 fixation by soil autotrophs. Alternatively, it has been suggested that long-term warming does not increase soil respiration emissions, possibly due to the spatial heterogeneity of different regions [43].
This study demonstrated that a 25% to 50% increase in precipitation can directly elevate soil moisture while increasing soil CO2 flux by 14% to 19.3%. Similarly, most studies have shown that soil water content is a major driver of soil CO2 emission in arid areas [44]. For instance, it has been predicted that a 30% precipitation increase in the North China Plain will enhance soil CO2 emissions by 14% [11]. However, in humid regions such as the subtropical regions of China, increased precipitation may have limited impact on soil CO2 emission [37]. Previous studies have found that increased precipitation can be expected to accelerate soil microbial activity and SOC decomposition rate, contributing to soil CO2 emissions [11], and pointed to a significant positive correlation between soil CO2 flux and SM, although no correlation with SOC. Hence, the aforementioned study suggests that in arid surface soil a relatively high moisture content promotes soil microbiological activity and stimulates CO2 emissions. This assumption was supported by the observation of increased microbiological and soil enzyme activity concurrent with precipitation [45,46].

4.2. Effect of Warming and Precipitation on δ13C Values of CO2 Efflux

Overall, the variation in δ13CO2e from −28.2‰ to −14.1‰ across treatments was very similar to Liang’s results (−29.7‰ to −10.0‰) [47], in which plots were located in the Little Belt Mountains of central Montana, USA. Although the climatic conditions were different between the study area and cited study region, this study involved nine treatments and collected data on warming and precipitation over a two-year growing season during which a distinct fluctuation in the environmental conditions occurred. The citation study area contains gas samples from 34 sample plots, including full ranges from wet to dry locations [47]. We believe that the gas samples involved in these two articles have a large spatio-temporal scale, which is the reason for their similar ranges. Furthermore, the δ13CO2e values were progressively enriched from June to early September in 2018; a similar seasonal pattern of δ13CO2e had been studied for subalpine grassland [16].
In addition, δ13CO2e was more enriched under the warming treatment in desert steppe, which was consistent with our hypothesis that warming would indirectly lead to the enrichment of δ13CO2e values. These finding were in agreement with a previous study which demonstrated that experimental warming increased the δ13C of the respired CO2 by 0.77‰ on average [48]. Indeed, there was a positive relationship between δ13CO2e and ST. When increasing the air temperature by 2 °C to 4 °C, δ13CO2e increased by 0.4‰ to 1.8‰, indicating a shift towards respiration of enriched carbon substrates [48]. This relationship confirms that photosynthesis provides an important and immediate C source for soil respiration, as proven by carbon isotopic labeling [29], and that the soil environment influences the stomatal conductance of plants, altering photosynthetic discrimination and leading (via root respiration or exudation) to changes in the δ13C of soil efflux [15]. Conversely, the δ13C of soil CO2 emission was negatively correlated with ST in agricultural land [40]. Actually, δ13C ratios in soil CO2 are mainly determined by gas transport, decomposition of soil organic matter, and respiration [49]. Indeed, the SOC and microorganism contents were different between agricultural land and desert steppe, illustrating that soil microorganisms have different preferences for respiratory substrates in different soil types.
Previous studies have demonstrated that δ13CO2e values can be depleted under conditions of high soil moisture [21], similar to our results showing that the strongest depletion in δ13CO2e was observed under condition W2 (+50% precipitation). A significant negative correlation was found between δ13CO2e and SM, which was consistent with our hypothesis. However, there was no significant difference in SOC under short-term increased precipitation treatment (2018, the fourth year of the experimental treatment), and no significant correlation between SOC and SM was found. Therefore, it was speculated that the depleted soil δ13CO2e value concomitant with increased precipitation may be due to (1) an increase in soil moisture leading to the intensification of anaerobic environments; (2) the occurrence of rainfall events in alkaline soils leading to the dissolution of soil CO2 in soil water, indirectly influencing the value of soil δ13CO2e [15]; and (3) the limited oxygen in wet soil may, due to the generation of CH4 carrying a negative δ13C signal, affect the value of δ13CO2e [50]. Hence, our findings highlight the way in which soil δ13CO2e values decrease with increased soil moisture due to the anaerobic environment and intensification of gas diffusive fractionation. This speculation is supported by evidence that poor aeration conditions could lead to soil having a more negative δ13CO2e [5].

4.3. The Difference between δ13CO2e and δ13Csoil

The variations in isotopic composition of soil CO2 efflux (δ13CO2e) record historical climate change at the regional scale [51]. The variety of biological and physicochemical processes (e.g., respiration of roots or microbes and decomposition of SOC) in the soil environment directly affect the isotopic composition of soil CO2 [49]. Thus, the levels of stable carbon isotope released from the soil may be enriched or depleted compared to the δ13C of SOC [46]. Our observations show that the mean δ13CO2e value (−20.2 ± 3.7‰) was higher than the mean value of the soil stable carbon isotope, at 0–20cm (δ13Csoil = −22.6‰). The Δe-s value represents the difference between δ13CO2e and δ13Csoil. Actually, the soil samples were collected only to a depth of 20 cm, whereas biological and physicochemical processes may occur deeper than 20 cm. In particular, the presence of the relatively heavier isotope 13C in deeper soil is well known [43]. Hence, the higher δ13CO2e indicates that either enriched 13C in substrates was selected by soil microorganisms, or stable carbon stocked in the soil was possibly decomposed below 20 cm. Generally, soil old carbon is relatively stable and enriched in 13C [52], and is not always difficult to break down; as Δe-s was greater than zero in terms of soil CO2 efflux improvement, it might more likely that substrate enriched in 13C was consumed. If the value of Δe-s is less than zero, this might suggest induced young carbon decomposition. Moreover, higher Δe-s values were observed at T1, indicating that more recalcitrant C pools may be utilized under warming of 2 °C [20], concomitant with enriched gas being released from deeper soil. From the above results, it can be speculated that short-term warming intensified the decomposition of part of the old soil C in desert steppe. Based on the natural 13C/12C ratio, Vanhala et al. [12] found that climatic warming improves the decomposition of old soil C, while increased precipitation causes the opposite effect. The absence of statistical differences in the interaction supports the conjecture that warming combined with precipitation alleviates the increased degradation of SOC in desert steppe [43].
In summary, soil CO2 flux was released from soil and its carbon isotope value was an index of the integrative oxidation of diverse carbon sources underground. Interestingly, Δe-s may be an indicator (echoing our hypothesis 3) for judging the preference of the substrates utilized in the soil oxidation process.

5. Conclusions

This study takes the Stipa breviflora desert steppe as its object, and studies the response of soil CO2 flux and its stable carbon isotope characteristics to warming, precipitation, and their interactions. The results indicate that climate change, especially temperature increases of 2 °C to 4 °C, increase soil CO2 efflux and δ13CO2e values as well as SOC content and δ13Csoil value. Increased precipitation of 25% to 50% directly increase soil moisture and simultaneously increase soil CO2 flux while decreasing δ13CO2e values. Although both warming and precipitation increase soil CO2 efflux, the mechanism of action is different. The results of this study prove that the increased soil CO2 flux under warming treatment is caused by the enhancement of SOC content, while precipitation improves soil microbial activity. In addition, the δ13CO2e value is significantly enriched by ST and depleted by SM. These results suggest that soil moisture is a dominant factor in δ13CO2e variability. Meanwhile, the difference in δ13CO2e and δ13Csoile-s) could be used to evaluate the likelihood of substrate utilization. In the desert steppe, 13C-enriched stable C pools may be utilized below 20 cm under warming of 2 °C. Ultimately, the interaction of warming and precipitation has no significant influence on either δ13CO2e values or Δe-s, indicating that warming combined with precipitation alleviates the degradation of SOC in desert steppe.

Author Contributions

C.W. and Z.W. conceived and designed the experiments; N.G., G.L., X.X., Z.Y. and X.Q. performed the experiments; S.L. and H.Y. analyzed the data; N.G. and S.L. wrote the paper; C.W. revised the manuscript. All authors have read and agreed to the published version of the manuscript.

Funding

This research was funded by the National Science Foundation of China (31960357; 32160331), Inner Mongolia Science and Technology Plan Project (2019GG245), Natural Science Foundation of Inner Mongolia (2019MS03065) and Central Government Guides Local Science and Technology Development Special Funds (2021ZY0020).

Institutional Review Board Statement

Not applicable.

Informed Consent Statement

Not applicable.

Data Availability Statement

The dataset on soil CO2 flux and its isotope composition and soil properties is available on figshare (https://doi.org/10.6084/m9.figshare.14774382, accessed on 6 December 2021).

Acknowledgments

Thanks to the Isotope Analysis Laboratory of Inner Mongolia Agricultural University for analysing the stable carbon isotope ratios of carbon dioxide, and to Chao Chen and Bin Zhang for constructive suggestions. Thanks to Wilkes Andreas for improving the language of the paper.

Conflicts of Interest

The authors declare no conflict of interest.

References

  1. Lyon, C.; Saupe, E.E.; Smith, C.J.; Hill, D.J.; Beckerman, A.P.; Stringer, L.C.; Marchant, R.; McKay, J.; Burke, A.; O’Higgins, P.; et al. Climate change research and action must look beyond 2100. Glob. Chang. Biol. 2022, 28, 349–361. [Google Scholar] [CrossRef] [PubMed]
  2. Yu, C.Q.; Wang, J.W.; Shen, Z.X.; Fu, G. Effects of experimental warming and increased precipitation on soil respiration in an alpine meadow in the Northern Tibetan Plateau. Sci. Total Environ. 2019, 647, 1490–1497. [Google Scholar] [CrossRef] [PubMed]
  3. Arunrat, N.; Sereenonchai, S.; Wang, C. Carbon footprint and predicting the impact of climate change on carbon sequestration ecosystem services of organic rice farming and conventional rice farming: A case study in Phichit province, Thailand. J. Environ. Manag. 2021, 289, 112458. [Google Scholar] [CrossRef] [PubMed]
  4. Millard, P.; Midwood, A.J.; Hunt, J.E.; Whitehead, D.; Boutton, T.W. Partitioning soil surface CO2 efflux into autotrophic and heterotrophic components, using natural gradients in soil δ13C in an undisturbed savannah soil. Soil Biol. Biochem. 2008, 40, 1575–1582. [Google Scholar] [CrossRef]
  5. Zhou, J.; Yang, Z.; Wu, G.; Yang, Y.; Lin, G. The relationship between soil CO2 efflux and its carbon isotopic composition under non-steady-state conditions. Agric. For. Meteorol. 2018, 256–257, 492–500. [Google Scholar] [CrossRef]
  6. Millard, P.; Sommerkorn, M.; Grelet, G.A. Environmental change and carbon limitation in trees: A biochemical, ecophysiological and ecosystem appraisal. New Phytol. 2007, 175, 11–28. [Google Scholar] [CrossRef] [PubMed]
  7. Lai, L.; Wang, J.; Tian, Y.; Zhao, X.; Jiang, L.; Chen, X.; Gao, Y.; Wang, S.; Zheng, Y. Organic Matter and Water Addition Enhance Soil Respiration in an Arid Region. PLoS ONE 2013, 8, e77659. [Google Scholar] [CrossRef] [PubMed] [Green Version]
  8. Ravn, N.R.; Elberling, B.; Michelsen, A. Arctic soil carbon turnover controlled by experimental snow addition, summer warming and shrub removal. Soil Biol. Biochem. 2020, 142, 107698. [Google Scholar] [CrossRef]
  9. Balogh, J.; Papp, M.; Pintér, K.; Fóti, S.; Posta, K.; Eugster, W.; Nagy, Z. Autotrophic component of soil respiration is repressed by drought more than the heterotrophic one in dry grasslands. Biogeosciences 2016, 13, 5171–5182. [Google Scholar] [CrossRef] [Green Version]
  10. Harper, C.W.; Blair, J.M.; Fay, P.A.; Knapp, A.K.; Carlisle, J.D. Increased rainfall variability and reduced rainfall amount decreases soil CO2 flux in a grassland ecosystem. Glob. Chang. Biol. 2005, 11, 322–334. [Google Scholar] [CrossRef]
  11. Wu, G.; Chen, X.M.; Ling, J.; Li, F.; Li, F.Y.; Peixoto, L.; Wen, Y.; Zhou, S.L. Effects of soil warming and increased precipitation on greenhouse gas fluxes in spring maize seasons in the North China Plain. Sci. Total Environ. 2020, 734, 139269. [Google Scholar] [CrossRef] [PubMed]
  12. Vanhala, P.; Karhu, K.; Tuomi, M.; Sonninen, E.; Jungner, H.; Fritze, H.; Liski, J. Old soil carbon is more temperature sensitive than the young in an agricultural field. Soil Biol. Biochem. 2007, 39, 2967–2970. [Google Scholar] [CrossRef]
  13. Midwood, A.J.; Gebbing, T.; Wendler, R.; Sommerkorn, M.; Hunt, J.E.; Millard, P. Collection and storage of CO2 for 13C analysis: An application to separate soil CO2 efflux into root- and soil-derived components. Rapid Commun. Mass Spectrom. 2006, 20, 3379–3384. [Google Scholar] [CrossRef] [PubMed]
  14. Bowling, D.R.; Egan, J.E.; Hall, S.J.; Risk, D.A. Environmental forcing does not induce diel or synoptic variation in the carbon isotope content of forest soil respiration. Biogeosciences 2015, 12, 5143–5160. [Google Scholar] [CrossRef] [Green Version]
  15. Gamnitzer, U.; Moyes, A.B.; Bowling, D.R.; Schnyder, H. Measuring and modelling the isotopic composition of soil respiration: Insights from a grassland tracer experiment. Biogeosciences 2011, 8, 1333–1350. [Google Scholar] [CrossRef] [Green Version]
  16. Volk, M.; Bassin, S.; Lehmann, M.F.; Johnson, M.G.; Andersen, C.P. 13C isotopic signature and C concentration of soil density fractions illustrate reduced C allocation to subalpine grassland soil under high atmospheric N deposition. Soil Biol. Biochem. 2018, 125, 178–184. [Google Scholar] [CrossRef] [PubMed]
  17. Jacotot, A.; Marchand, C.; Allenbach, M. Biofilm and temperature controls on greenhouse gas (CO2 and CH4) emissions from a Rhizophora mangrove soil (New Caledonia). Sci. Total Environ. 2019, 650, 1019–1028. [Google Scholar] [CrossRef] [PubMed]
  18. Talmon, Y.; Sternberg, M.; Grünzweig, J.M. Impact of rainfall manipulations and biotic controls on soil respiration in Mediterranean and desert ecosystems along an aridity gradient. Glob. Chang. Biol. 2011, 17, 1108–1118. [Google Scholar] [CrossRef]
  19. Midwood, A.J.; Millard, P. Challenges in measuring the δ13C of the soil surface CO2 efflux. Rapid Commun. Mass Spectrom. 2011, 25, 232–242. [Google Scholar] [CrossRef] [PubMed]
  20. Biasi, C.; Rusalimova, O.; Meyer, H.; Kaiser, C.; Wanek, W.; Barsukov, P.; Junger, H.; Richter, A. Temperature-dependent shift from labile to recalcitrant carbon sources of arctic heterotrophs. Rapid Commun. Mass Spectrom. 2005, 19, 1401–1408. [Google Scholar] [CrossRef] [PubMed]
  21. Phillips, C.L.; Nickerson, N.; Risk, D.; Kayler, Z.E.; Andersen, C.; Mix, A.; Bond, B.J. Soil moisture effects on the carbon isotope composition of soil respiration. Rapid Commun. Mass Spectrom. 2010, 24, 1271–1280. [Google Scholar] [CrossRef] [PubMed]
  22. Qin, Y.; Yi, S.; Chen, J.; Ren, S.; Wang, X. Responses of ecosystem respiration to short-term experimental warming in the alpine meadow ecosystem of a permafrost site on the Qinghai-Tibetan Plateau. Cold Reg. Sci. Technol. 2015, 115, 77–84. [Google Scholar] [CrossRef]
  23. Buchmann, N.; Kao, W.Y.; Ehleringer, J. Influence of stand structure on carbon-13 of vegetation, soils, and canopy air within deciduous and evergreen forests in Utah, United States. Oecologia 1997, 110, 109–119. [Google Scholar] [CrossRef] [PubMed]
  24. Bowling, D.R.; McDowell, N.G.; Bond, B.J.; Law, B.E.; Ehleringer, J.R. 13C content of ecosystem respiration is linked to precipitation and vapor pressure deficit. Oecologia 2002, 131, 113–124. [Google Scholar] [CrossRef] [PubMed]
  25. Butcher, K.R.; Nasto, M.K.; Norton, J.M.; Stark, J.M. Physical mechanisms for soil moisture effects on microbial carbon-use efficiency in a sandy loam soil in the western United States. Soil Biol. Biochem. 2020, 150, 107969. [Google Scholar] [CrossRef]
  26. Keeling, C.D. The concentration and isotopic abundances of carbon dioxide in rural and marine air. Geochim. Cosmochim. Acta 1961, 24, 277–298. [Google Scholar] [CrossRef]
  27. Lv, G.; Wang, Z.; Guo, N.; Xu, X.; Liu, P.; Wang, C. Status of Stipa breviflora as the constructive species will be lost under climate change in the temperate desert steppe in the future. Ecol. Indic. 2021, 126, 107715. [Google Scholar] [CrossRef]
  28. Brüggemann, N.; Gessler, A.; Kayler, Z.; Keel, S.G.; Badeck, F.; Barthel, M.; Boeckx, P.; Buchmann, N.; Brugnoli, E.; Esperschütz, J.; et al. Carbon allocation and carbon isotope fluxes in the plant-soil-atmosphere continuum: A review. Biogeosciences 2011, 8, 3457–3489. [Google Scholar] [CrossRef] [Green Version]
  29. Bahn, M.; Schmitt, M.; Siegwolf, R.; Richter, A.; Brüggemann, N. Does photosynthesis affect grassland soil-respired CO2 and its carbon isotope composition on a diurnal timescale? New Phytol. 2009, 182, 451–460. [Google Scholar] [CrossRef] [PubMed] [Green Version]
  30. Tang, S.; Zhang, Y.; Guo, Y.; Zhai, X.; Wilkes, A.; Han, G.; Jiang, Y.; Liu, K.; Zhou, P.; Wang, K.; et al. Changes of soil CO2 flux under different stocking rates during spring-thaw period in a northern desert steppe, China. Atmos. Environ. 2015, 122, 343–348. [Google Scholar] [CrossRef]
  31. Wang, C.J.; Tang, S.M.; Wilkes, A.; Jiang, Y.Y.; Han, G.D.; Huang, D. Effect of stocking rate on soil-atmosphere CH4 flux during spring freeze-thaw cycles in a Northern desert steppe, China. PLoS ONE 2012, 7, e36794. [Google Scholar] [CrossRef]
  32. Ollivier, Q.R.; Maher, D.T.; Pitfield, C.; Macreadie, P.I. Winter emissions of CO2, CH4, and N2O from temperate agricultural dams: Fluxes, sources, and processes. Ecosphere 2019, 10, e02914. [Google Scholar] [CrossRef] [Green Version]
  33. Luo, C.; Wang, S.; Zhang, L.; Wilkes, A.; Zhao, L.; Zhao, X.; Xu, S.; Xu, B. CO2, CH4 and N2O fluxes in an alpine meadow on the Tibetan Plateau as affected by N-addition and grazing exclusion. Nutr. Cycl. Agroecosystems 2020, 117, 29–42. [Google Scholar] [CrossRef] [Green Version]
  34. Zhou, Y.; Ding, Y.; Li, H.; Xu, X.; Li, Y.; Zhang, W.; Lin, H. The effects of short-term grazing on plant and soil carbon and nitrogen isotope composition in a temperate grassland. J. Arid Environ. 2020, 179, 104198. [Google Scholar] [CrossRef]
  35. Lin, G.; Rygiewicz, P.T.; Ehleringer, J.R.; Johnson, M.G.; Tingey, D.T. Time-dependent responses of soil CO2 efflux components to elevated atmospheric [CO2] and temperature in experimental forest mesocosms. Plant Soil 2001, 229, 259–270. [Google Scholar] [CrossRef]
  36. Pataki, D.E.; Ehleringer, J.R.; Flanagan, L.B.; Yakir, D.; Bowling, D.R.; Still, C.J.; Buchmann, N.; Kaplan, J.O.; Berry, J.A. The application and interpretation of Keeling plots in terrestrial carbon cycle research. Global Biogeochem. Cycles 2003, 17, 1022. [Google Scholar] [CrossRef] [Green Version]
  37. Deng, Q.; Hui, D.; Zhang, D.; Zhou, G.; Liu, J.; Liu, S.; Chu, G.; Li, J. Effects of precipitation increase on soil respiration: A three-year field experiment in subtropical forests in China. PLoS ONE 2012, 7, e41493. [Google Scholar] [CrossRef]
  38. Wang, G.; Jia, Y.; Li, W. Effects of environmental and biotic factors on carbon isotopic fractionation during decomposition of soil organic matter. Sci. Rep. 2015, 5, 11043. [Google Scholar] [CrossRef] [PubMed] [Green Version]
  39. Na, L.; Genxu, W.; Yan, Y.; Yongheng, G.; Guangsheng, L. Plant production, and carbon and nitrogen source pools, are strongly intensified by experimental warming in alpine ecosystems in the Qinghai-Tibet Plateau. Soil Biol. Biochem. 2011, 43, 942–953. [Google Scholar] [CrossRef]
  40. Zhang, Q.; Wu, J.; Lei, Y.; Yang, F.; Zhang, D.; Zhang, K.; Zhang, Q.; Cheng, X. Agricultural land use change impacts soil CO2 emission and its 13C-isotopic signature in central China. Soil Tillage Res. 2018, 177, 105–112. [Google Scholar] [CrossRef]
  41. Pedersen, E.P.; Elberling, B.; Michelsen, A. Seasonal variations in methane fluxes in response to summer warming and leaf litter addition in a subarctic heath ecosystem. J. Geophys. Res. Biogeosciences 2017, 122, 2137–2153. [Google Scholar] [CrossRef]
  42. Zhao, K.; Kong, W.; Wang, F.; Long, X.E.; Guo, C.; Yue, L.; Yao, H.; Dong, X. Desert and steppe soils exhibit lower autotrophic microbial abundance but higher atmospheric CO2 fixation capacity than meadow soils. Soil Biol. Biochem. 2018, 127, 230–238. [Google Scholar] [CrossRef]
  43. Ravn, N.R.; Ambus, P.; Michelsen, A. Impact of decade-long warming, nutrient addition and shading on emission and carbon isotopic composition of CO2 from two subarctic dwarf shrub heaths. Soil Biol. Biochem. 2017, 111, 15–24. [Google Scholar] [CrossRef]
  44. Quan, Q.; Tian, D.; Luo, Y.; Zhang, F.; Crowther, T.W.; Zhu, K.; Chen, H.Y.H.; Zhou, Q.; Niu, S. Water scaling of ecosystem carbon cycle feedback to climate warming. Sci. Adv. 2019, 5, 1–8. [Google Scholar] [CrossRef] [PubMed] [Green Version]
  45. Borowik, A.; Wyszkowska, J. Soil moisture as a factor affecting the microbiological and biochemical activity of soil. Plant Soil Environ. 2016, 62, 250–255. [Google Scholar] [CrossRef]
  46. Tate, R.L.; Terry, R.E. Variation in Microbial Activity in Histosols and Its Relationship to Soil Moisture. Appl. Environ. Microbiol. 1980, 40, 313–317. [Google Scholar] [CrossRef] [PubMed] [Green Version]
  47. Liang, L.L.; Riveros-Iregui, D.A.; Risk, D.A. Spatial and seasonal variabilities of the stable carbon isotope composition of soil CO2 concentration and flux in complex terrain. J. Geophys. Res. Biogeosci. 2016, 121, 2328–2339. [Google Scholar] [CrossRef]
  48. Dorrepaal, E.; Toet, S.; Van Logtestijn, R.S.P.; Swart, E.; Van De Weg, M.J.; Callaghan, T.V.; Aerts, R. Carbon respiration from subsurface peat accelerated by climate warming in the subarctic. Nature 2009, 460, 616–619. [Google Scholar] [CrossRef]
  49. Andrews, J.A.; Matamala, R.; Westover, K.M.; Schlesinger, W.H. Temperature effects on the diversity of soil heterotrophs and the δ13C of soil-respired CO2. Soil Biol. Biochem. 2000, 32, 699–706. [Google Scholar] [CrossRef]
  50. Huang, W.; Hall, S.J. Large impacts of small methane fluxes on carbon isotope values of soil respiration. Soil Biol. Biochem. 2018, 124, 126–133. [Google Scholar] [CrossRef] [Green Version]
  51. Ehleringer, J.R.; Buchmann, N.; Flanagan, L.B. Carbon isotope ratios in belowground carbon cycle processes. Ecol. Appl. 2000, 10, 412–422. [Google Scholar] [CrossRef]
  52. Flanagan, L.B.; Ehleringer, J.R. Ecosystem-atmosphere CO2 exchange: Interpreting signals of change using stable isotope ratios. Trends Ecol. Evol. 1998, 13, 10–14. [Google Scholar] [CrossRef]
Figure 1. Plan of test platform (a); open-top chamber (OTC) and self-built precipitation collector (b).
Sustainability 14 03351 g001
Figure 2. Inter-annual variations in soil temperature (a) and moisture (b), soil CO2 efflux (c), and soil CO2 efflux carbon isotope composition (δ13CO2e) (d) under warming and increased precipitation treatments (n = 189). Different lowercase letters indicate significant differences.
Sustainability 14 03351 g002
Figure 3. The variations of mean (n = 3) soil temperature (a) and moisture (b), soil CO2 efflux (c), and soil CO2 efflux carbon isotope composition (δ13CO2e) (d) within warming and increased precipitation treatments.
Sustainability 14 03351 g003
Figure 4. The mean soil CO2 flux (n = 7) under warming and increased precipitation treatments in 2018 (a) and 2019 (b).
Sustainability 14 03351 g004
Figure 5. The mean stable carbon isotope of soil CO2 efflux (δ13CO2e, n = 7) under warming and increased precipitation treatments in 2018 (a) and 2019 (b).
Sustainability 14 03351 g005
Figure 6. The relationship between soil CO2 flux (n = 126) and soil temperature (a) and soil moisture (b) across years and treatments. R2 indicates how well the regression model explains the dependent variable.
Sustainability 14 03351 g006
Figure 7. The relationship between stable carbon isotope of soil CO2 efflux (δ13CO2e, n = 126) and soil temperature (a) and soil moisture (b) across years and treatments. R2 indicates how well the regression model explains the dependent variable.
Sustainability 14 03351 g007
Figure 8. The relationship between soil CO2 flux and its carbon isotope values and soil properties (n = 18). * Significant at the 0.05 level, ** Significant at the 0.01 level.
Sustainability 14 03351 g008
Table 1. Effects of warming treatment (T), increased precipitation treatment (W), date (D), year (Y), and their interactions on soil temperature (ST) and moisture (SM) and carbon isotope value of soil CO2 efflux (δ13CO2e) in the temperate desert steppe.
SourceST (°C)SM (vol. %)CO2 Flux (mg m−2·h−1)δ13C-CO2 (‰)
Year (Y)139.3 ***0.0285.9 ***11.4 ***
Date (D)336.5 ***232.7 ***187.8 ***64.3 ***
Warming (T)46.4 ***47.4 ***25.7 ***27.7 ***
Increased precipitation (W)11.2 ***37.9 ***11.4 ***6.3 **
T × W1.90.61.91.1
Y × D52.4 ***380.1 ***47.5 ***48.5 ***
Y × T1.014.1 ***0.5 12.9 ***
Y × W1.34.5 *3.0 0.7
D × T0.83.2 **4.1 ***3.6 ***
D × W0.60.60.9 1.5
Y × D × T1.02.0 *1.3 2.5 **
Y × D × W1.51.13.0 **2.2 *
Y × T × W1.21.96.5 ***1.0
D × T × W0.50.92.0 **1.4
Y × D × T × W0.71.42.3 **1.5
Note: Model was the variance analysis model. * Significant at the 0.05 level, ** Significant at the 0.01 level, *** Significant at the 0.001 level.
Table 2. Soil temperature (ST), soil moisture (SM), soil CO2 flux, and stable carbon isotope value of soil CO2 efflux (δ13CO2e) under warming (T) and precipitation increased treatment (W) in the temperate desert steppe.
ItemsYearTreatmentsT0T1T2MeanS.E.M
ST
(°C)
2018W019.62122.521 A0.6
W118.920.121.220.1 B0.6
W21920.120.419.9 B0.6
2019W021.223.123.522.6 A0.5
W121.821.922.922.2 AB0.5
W221.22222.722 B0.5
TotalMean20.3 C21.4 B22.2 A21.3
SM
(vol. %)
2018W014.51313.413.6 C0.9
W11513.613.814.1 B0.9
W215.815.41515.4 A1.0
2019W0151112.112.7 B0.8
W116.213.614.514.8 A0.8
W218.413.514.715.5 A1.0
TotalMean15.8 A13.4 C13.9B14.4
CO2 flux
(mg m−2·h−1)
2018W0244.4251.9281.2259.17 B21.1
W1306.7314.4341.5320.84 A26.9
W2214.2290.3413.8306.1 A25.7
2019W0302.6327.7451.7360.7 B34.6
W1314.1430.5412385.55 B32.2
W2413.9435.1450.8433.28 A35.0
TotalMean299.3 C341.7 B391.9 A344.3
δ13CO2e
(‰)
2018W0−20.4−19.9−20.3−20.2 A0.4
W1−21.9−19.7−19.8−20.4 AB0.4
W2−22.5−20.3−20.6−21.1 B0.4
2019W0−19.7−18−20.3−19.4 A0.5
W1−20.3−18.6−21.4−20.1 B0.5
W2−20.9−18.4−21.3−20.2 B0.5
TotalMean−21 B−19.2 A−20.6 B−20.2
Note: Different uppercase letters indicate significant differences among groups at p < 0.05; S.E.M: standard error of mean; T0: ambient temperature, T1: T0 + 2 °C and T2: T0 + 4 °C; W0: ambient precipitation, W1: W0 + 25% and W2: W0 + 50%.
Table 3. Effects of warming (T), precipitation increase (W), year (Y), and their interactions on soil organic carbon (SOC) and stable carbon isotope value of soil (δ13Csoil, 0–20 cm) in 2018 and 2019.
ItemsWarmingPrecipitation20182019MeanS.E.Mp-Values
TWT × W
δ13Csoil
(‰)
T0W0–25.11–22.52–23.46 c0.25***ns*
W1–24.11–23.13
W2–22.76–23.14
T1W0–22.48–23.11–22.51 b0.24
W1–22.64–23.11
W2–20.91–22.83
T2W0–20.51–22.59–21.96 a0.24
W1–21.17–22.6
W2–22.28–22.58
Mean–22.44 a–22.85 b
SOC
(g/kg)
T0W012.112.712.3 b0.32*nsns
W111.213
W213.211.6
T1W012.514.313.1 ab0.40
W111.314.1
W212.614
T2W011.613.514.2 a0.82
W113.416.5
W212.817.7
Mean12.3 b14.1 a
Notes: Different lowercase letters indicate significant differences among 2018 and 2019 at p < 0.05. * represents p < 0.05, *** represents p < 0.05, ns represents p > 0.05.
Table 4. Effects of warming (T), precipitation increase (W), and their interactions on the difference between δ13CO2e and δ13Csoile-s) in 2018 and 2019.
ItemsPrecipitationT0T1T2MeanS.E.Mp-Values
TWT × W
Δe-s (‰)W03.73.81.32.9 a0.4****ns
W12.63.71.32.5 b0.4
W21.22.51.51.7 c0.5
Mean2.5 a3.3 a1.3 b2.4
Notes: Different lowercase letters indicate significant differences at p < 0.05. * represents p < 0.05, *** represents p < 0.05, ns represents p > 0.05.
Publisher’s Note: MDPI stays neutral with regard to jurisdictional claims in published maps and institutional affiliations.

