Article

Experiencing a Food Production Site Using Wearable Devices: The Indirect Impact of Immersion and Presence in VR Tours

by
Francesca De Canio
1,*,
Elisa Martinelli
1,
Margherita Peruzzini
2 and
Sara Cavallaro
2
1
Department of Economics Marco Biagi, University of Modena and Reggio Emilia, 41121 Modena, Italy
2
Department of Engineering Enzo Ferrari, University of Modena and Reggio Emilia, 41123 Modena, Italy
*
Author to whom correspondence should be addressed.
Sustainability 2022, 14(5), 3064; https://doi.org/10.3390/su14053064
Submission received: 24 January 2022 / Revised: 3 March 2022 / Accepted: 4 March 2022 / Published: 6 March 2022

Abstract

:
Virtual reality (VR) is among the main technologies revolutionizing numerous sectors, including tourism. In the latter context, virtual tours (VTs) are finding increasing application. Providing an immersive and realistic human–machine interaction, VR tours can bring visitors to virtually experience destination areas. The proposed research presents a theoretical and empirical investigation of the role played by some technical VR features (i.e., presence, immersion, ease-of-use) on VR visitors’ enjoyment, satisfaction, and, accordingly, on the physical visit intention of the production site and neighboring areas. After having experienced a 360-degree VR tour of a food production site, created specifically for this study, 140 visitors were surveyed online. Results—emerging from a PLS structural equation model—show that immersion and presence both directly impact the enjoyment and indirectly the user’s VR tour satisfaction and visit intention. Further, if the VR tour is perceived as easy to use, it influences visitors’ satisfaction and physical visit intention. This study contributes to the novel VR literature, applied in the tourism sector, evidencing how immersive and enjoyable scenarios, experienced via widespread devices such as smartphones, may impact tourists’ choices. In food tourism, VR technologies can be fundamental in attracting new visitors to the production sites and neighboring areas.

1. Introduction

Innovative and wearable technologies are reshaping the way companies may interact with final consumers [1]. New opportunities are emerging for businesses, allowing distant consumers to experience their product and/or services digitally. Increasingly popular technologies, such as smartphones, are becoming necessary to improve efficiency and effectiveness in many sectors, from tourism to retail, production to education and culture, to wellness and entertainment [2,3]. Technological innovation moved operators to design highly personalized customer experiences, where the real and virtual can be merged in a seamless experience. Thus, implementation of ICTs creates enhanced experiences going beyond the traditional one [4,5].
In addition to an increasingly widespread use of wearable devices, virtual and augmented realities are offering the opportunity to employ sustainable, immersive, and interactive solutions impacting on business operators’ performance and sector’s profitability, currently strongly constrained by the pandemic. Indeed, increasing restrictions to people’s mobility determined by the spread of the COVID-19 pandemic, and the related changes in people’s lifestyles and behaviors [6,7,8] have amplified the need for businesses to find new ways to be in contact with final customers remotely.
Pervasive immersive realities such as Augmented Reality (AR), Virtual Reality (VR), and Mixed Reality (MR), providing immersive and interactive experiences, are becoming key for compensating for people’s lack of mobility due to the pandemic, affecting travelers’ choices [8]. Immersive realities allow customers to experience products, services, or places before their purchase [9,10]. They are also considered a sustainable way to visit places [11] as they do not contribute to increasing pollution and CO2 emissions, supporting environmentally sustainable behaviors [12]. Augmented, virtual, and mixed realities allow travelers to explore a destination in advance and properly plan their travel. Particularly, a VR tour guarantees a high sense of authenticity, bringing consumers closer to the object represented in the tour, such as a place of destination. A VT is considered a realistic alternative to traditional tourism [13,14]. It allows travelers to previsit a museum [15], for example, and explore destination areas [16]. This is why destinations are increasingly providing 360-degree tours to offer a way of fulfilling the urge to travel in the context of the pandemic [17,18]. Nevertheless, while the intention to adopt virtual tours (VTs) has been found to be positively associated with the proneness to visit museums and destination areas [19], the role of immersive realities in supporting food tourism is still to be verified.
Emerging studies are exploring how to allow people to virtually visit a food production site, and to achieve a deep knowledge of food’s origins and production processes remotely could involve food tourism [20,21]. When applied to a food production site, VTs allow customers to improve their food product knowledge, by the means of the virtual visit to the production site and, accordingly, they can also play a fundamental role in attracting tourists to food destinations and their neighboring areas. The latter has been found true in the context of a hypothetical virtual tour to a dairy [21]. However, recent previous studies provide only preliminary indications of the potential visit proneness of the participants, lacking a wider understanding of the phenomenon, highlighting the need for further studies. The gaps in the previous literature on VR tours applied to food tourism support the scope of our study.
Secondly, new hardware such as viewers, glasses, gloves, among others, as well as devices’ functionalities, such as connection to social networks, gyroscopes, and accelerometers to track the users’ movements, not to mention multifunctional apps, compatible with new mobile devices, are redefining the human–machine and human–human interaction by bringing the user into digital realities [22,23]. However, not all users own new sensorial hardware and/or use/know how to use all the functionalities offered by their devices [24]. Despite the enormous growth of VR technology adoption and usage, a limited diffusion of potentiated hardware and an overall limited users’ knowledge of all smartphone functionalities have motivated us to investigate how a VR tour into a food production site, experienceable through a wearable device (e.g., a smartphone), may encourage people to visit the production site and its neighborhood.
This study aims to overcome the limitations of the recent literature about the application of VR tours in food tourism by providing a more robust analysis of the impact of the 360-degree digital tours on people’s intention to visit the food production site. First, a 360-degree VR tour, experienceable via smartphone, was developed and uploaded on YouTube. Subsequently, an online user survey was conducted to collect data about user’s preferences and quality of experience. To fill the aforementioned gaps, this study provides theoretical and empirical evidence on the impact of 360-degree VR tours, testable via smartphone, through one of the most popular social networks (i.e., YouTube), on people’s visit intention of a food production site.
Theoretically, the present study contributes to the literature combining technical aspects related to the virtual tour (e.g., presence, immersion, and ease-of-use) with emotional aspects related to the VR experience (i.e., enjoyment and VR tour satisfaction) felt by users during the VR tour experience. Even if digital technologies were proved to impact consumer buying intentions [22], current knowledge on the emotional and behavioral impact of VR is still limited. To this aim, the Technology Acceptance Model (TAM) [25] has been extended to better explore the role played by presence and immersion in determining users’ visit intention. In this way, the present study integrates the previous literature in VR tours applied to food tourism and fills the aforementioned gaps, both theoretically and empirically.
In an evolving context, this study aims to investigate how technical features of an immersive and realistic VT may impact visitors’ satisfaction with the VR and indirectly influence travelers’ intentions to visit it also onsite. We extend previous studies [26] investigating how experiencing authentic local food virtually may influence tourists’ behavior. Presence and immersion are explored as antecedents of a complex structural model leading us to estimate how the experience of a 360-degree VT may encourage travelers to visit the production site of a food product—in line with the new food tourism trends—and, accordingly, to encourage people to visit the area where the food is produced.
Empirically, the study develops a highly immersive but authentic 360-degree virtual tour within a food production site, specifically a dairy producing Parmigiano Reggiano cheese. The choice of this product derives from the strong bond that Parmigiano Reggiano cheese has with its production area—this characteristic is typical of traditional foods, such as Protected Designation of Origin (PDO) and Protected Geographical Indication (PGI) foods, so-called EU quality labels. The video, uploaded on YouTube, was shared with a sample of people; after viewing it, each user participated in a survey provided on-line as well. 140 structured questionnaires, filled by the 360-degree VTs viewers, represent the dataset used to estimate the structural equation model.

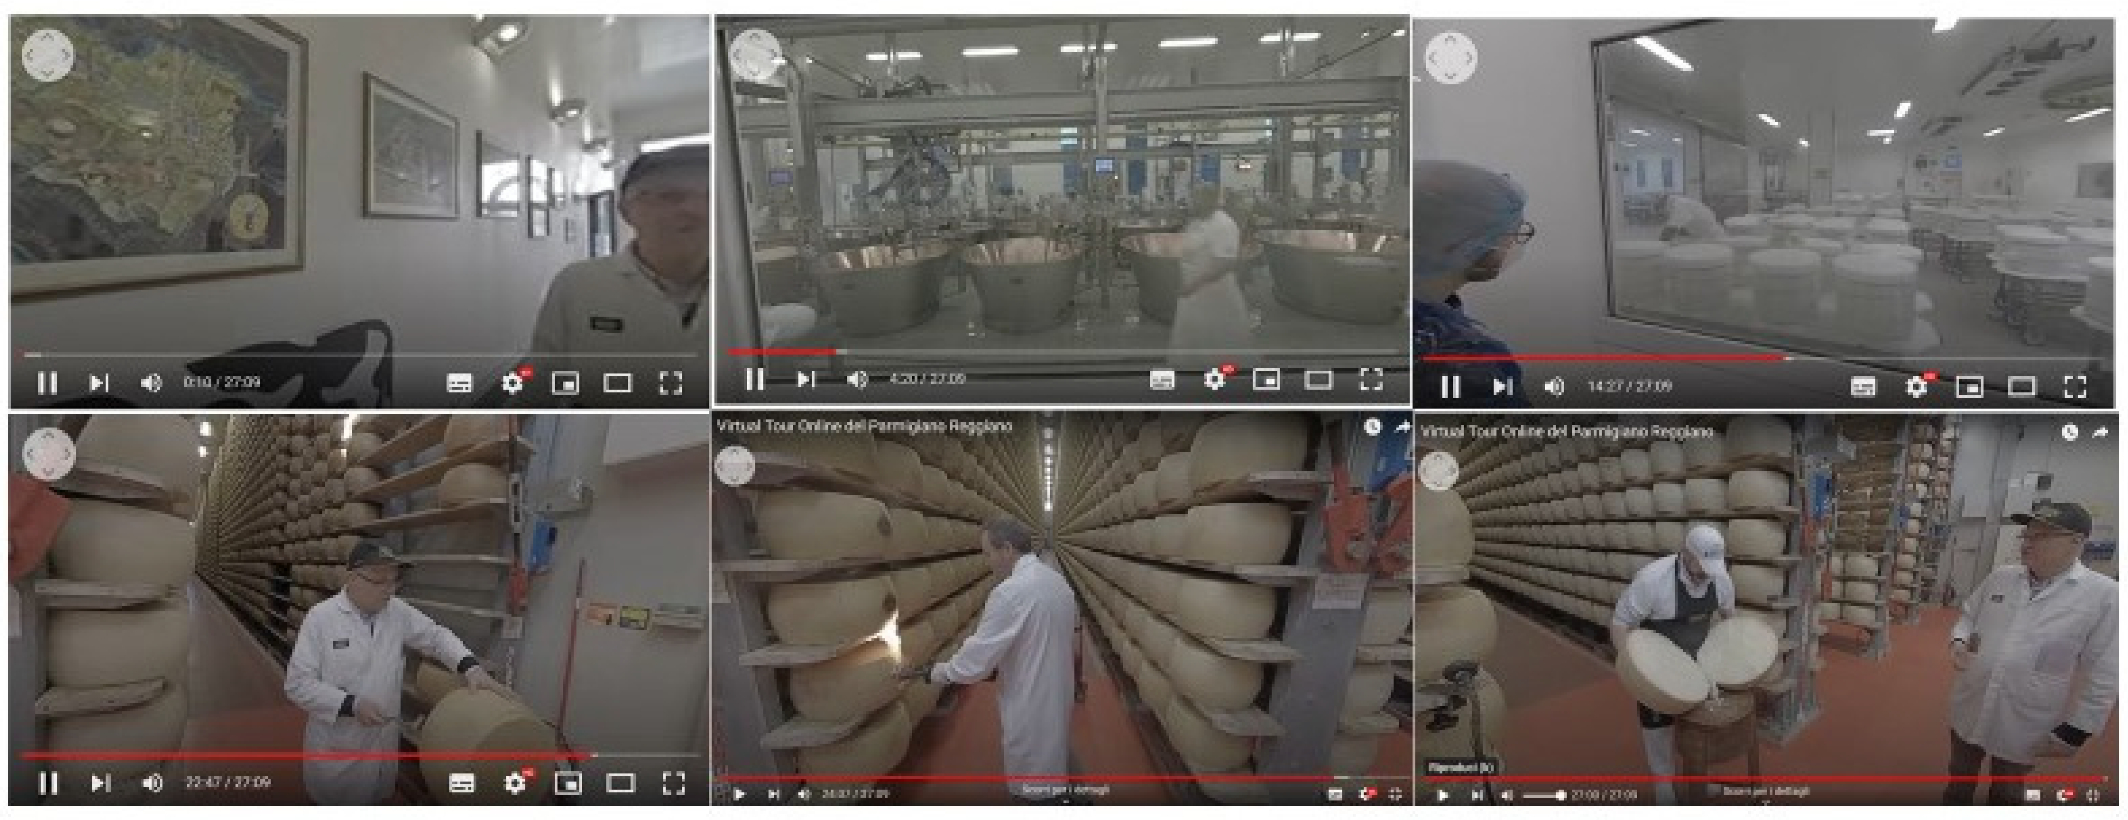
2. VT Experience with VR Technology

The term virtual tour has various interpretations and thus lacks a generally accepted definition [19]. Nevertheless, it can be described as “a simulation of an existing location that is composed of a sequence of video images’’ [27]. The simulation is set up by a sequence of videos or pictures and can be accompanied by text descriptions, audio guides, or sound effects. The simulated environment, with all peculiarities, is built up to authentically recreate the real site experience [28]. In the past, VTs were experienced through the world wide web using a computer, through which a visitor could see and interact with a simulated environment using the monitor and the mouse [29]. Today, VTs may also be experienced using other advanced technologies such as VT or AR head-mounted displays or smartphones [30], through which a visitor can see the simulated environment in a more immersive way, by interacting with it and moving inside the simulated location through a gyroscope and tracking sensors. This allows potential visitors to experience a destination represented in the virtual environment in a more powerful way [31]. A 360-degree virtual video is a type of virtual tour. It is filmed in the real place and allows users to turn around at any angle, navigate the video by choosing any direction they wish to view. Using a VR headset, visitors can live an individual experience of the simulated environment. Such experience arouses the audiences’ interest and the impacts their behavioral intention [32]. This research explores a VT implemented with a sequence of 360-degree videos, recorded in the production site and properly arranged, that can be experienced by different devices: VR head-mounted displays, smartphones, or simply by a monitor and a mouse.
This research also explores the presence feeling inducted by the VT to influence the visitor intention. For that reason, VT designers have to give the feeling of being present to the audience, achieving the presence feeling, which is the heart of what makes an immersive experience unique. The presence is the feeling of being there in a given experience [33]. This sensation leads to the need to be active and play a role in the story; this can be achieved by shooting the 360 videos from a particular perspective. In the extant literature, the experience of immersion consists of three dimensions: physical presence (PP), social/self-presence (SP), and involvement (INV). These dimensions are influenced by the technology, the content, and subjective factors [34].

3. Theoretical Background

3.1. TAM in VR

In the last decade, the literature has begun to explore how virtual, augmented, and mixed reality are revolutionizing human–machine interactions and consequently affecting people’s lives. Numerous papers have tried to synthesize the relevance of VR, AR, and MR in the business–user relationship, but given the constant and rapid evolution of technology, it is not yet possible to clearly state the advantages and disadvantages associated with the adoption of these new technologies. Nevertheless, scholars agree in affirming that augmented and immersive experiences widely influence consumers’ choices [35].
Since 2007, Bowman and McMahan [36] evidenced that when investigating digital reality, immersion and presence are jointly relevant in making the virtual reality application effective. That is why, this study, extending the TAM [25], explores the role played by presence and immersion in determining travelers’ physical visit intention. Emerging digital realities have been shown to display a strong potential in influencing customers’ shopping [37,38] and travel behaviors [39,40]. When people may test a product or service or directly experience a place, even remotely, they show an emotional reaction to the product and/or place with a strong impact on their intentions [22].

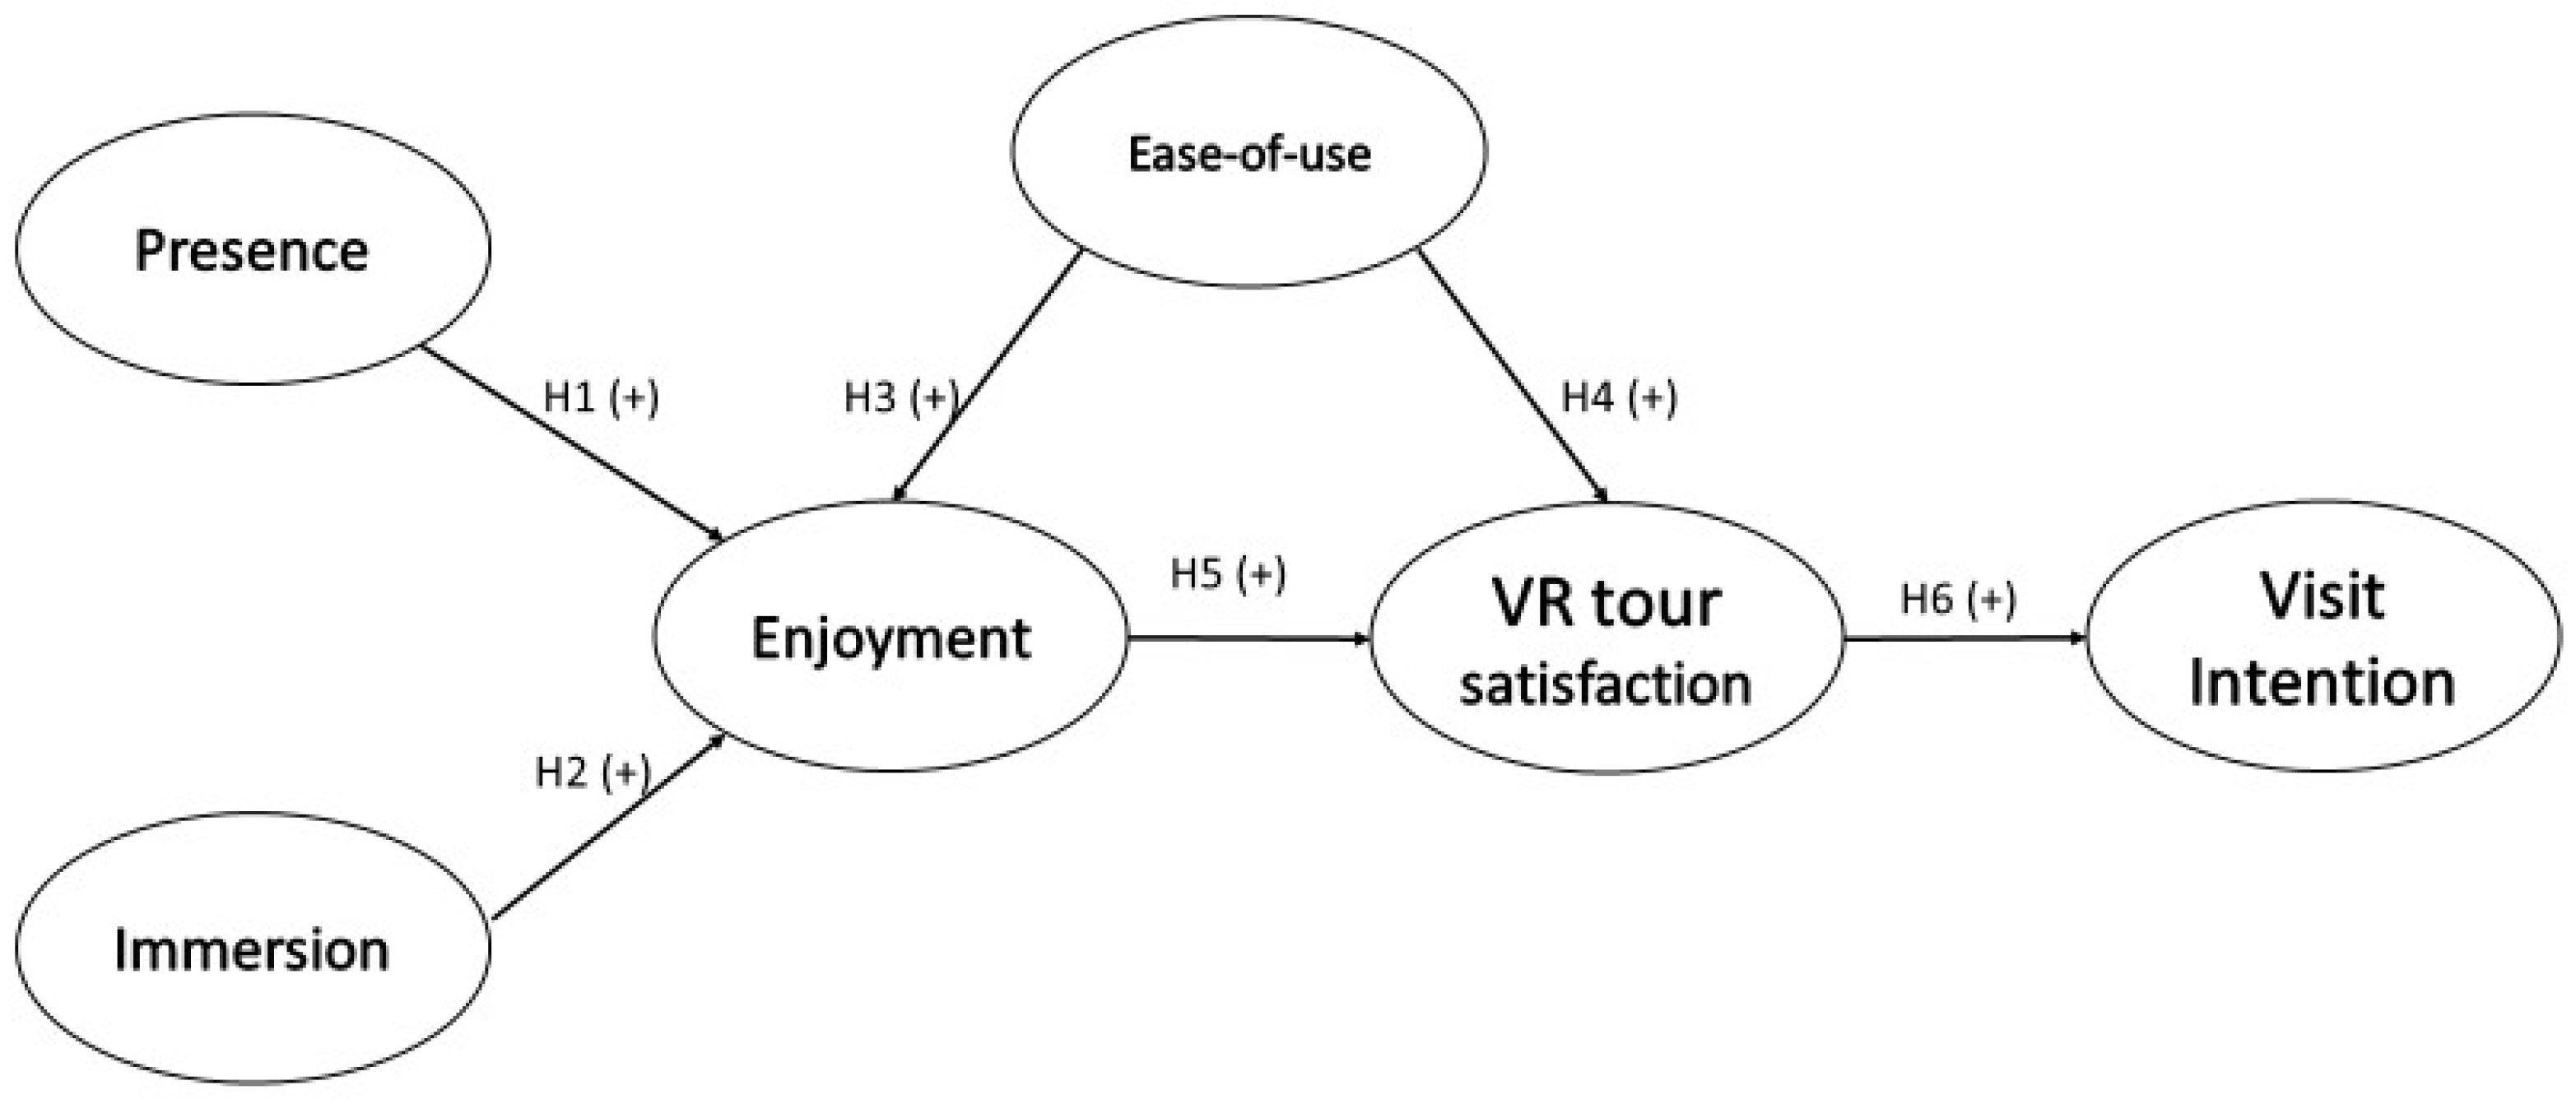
3.2. Research Hypotheses
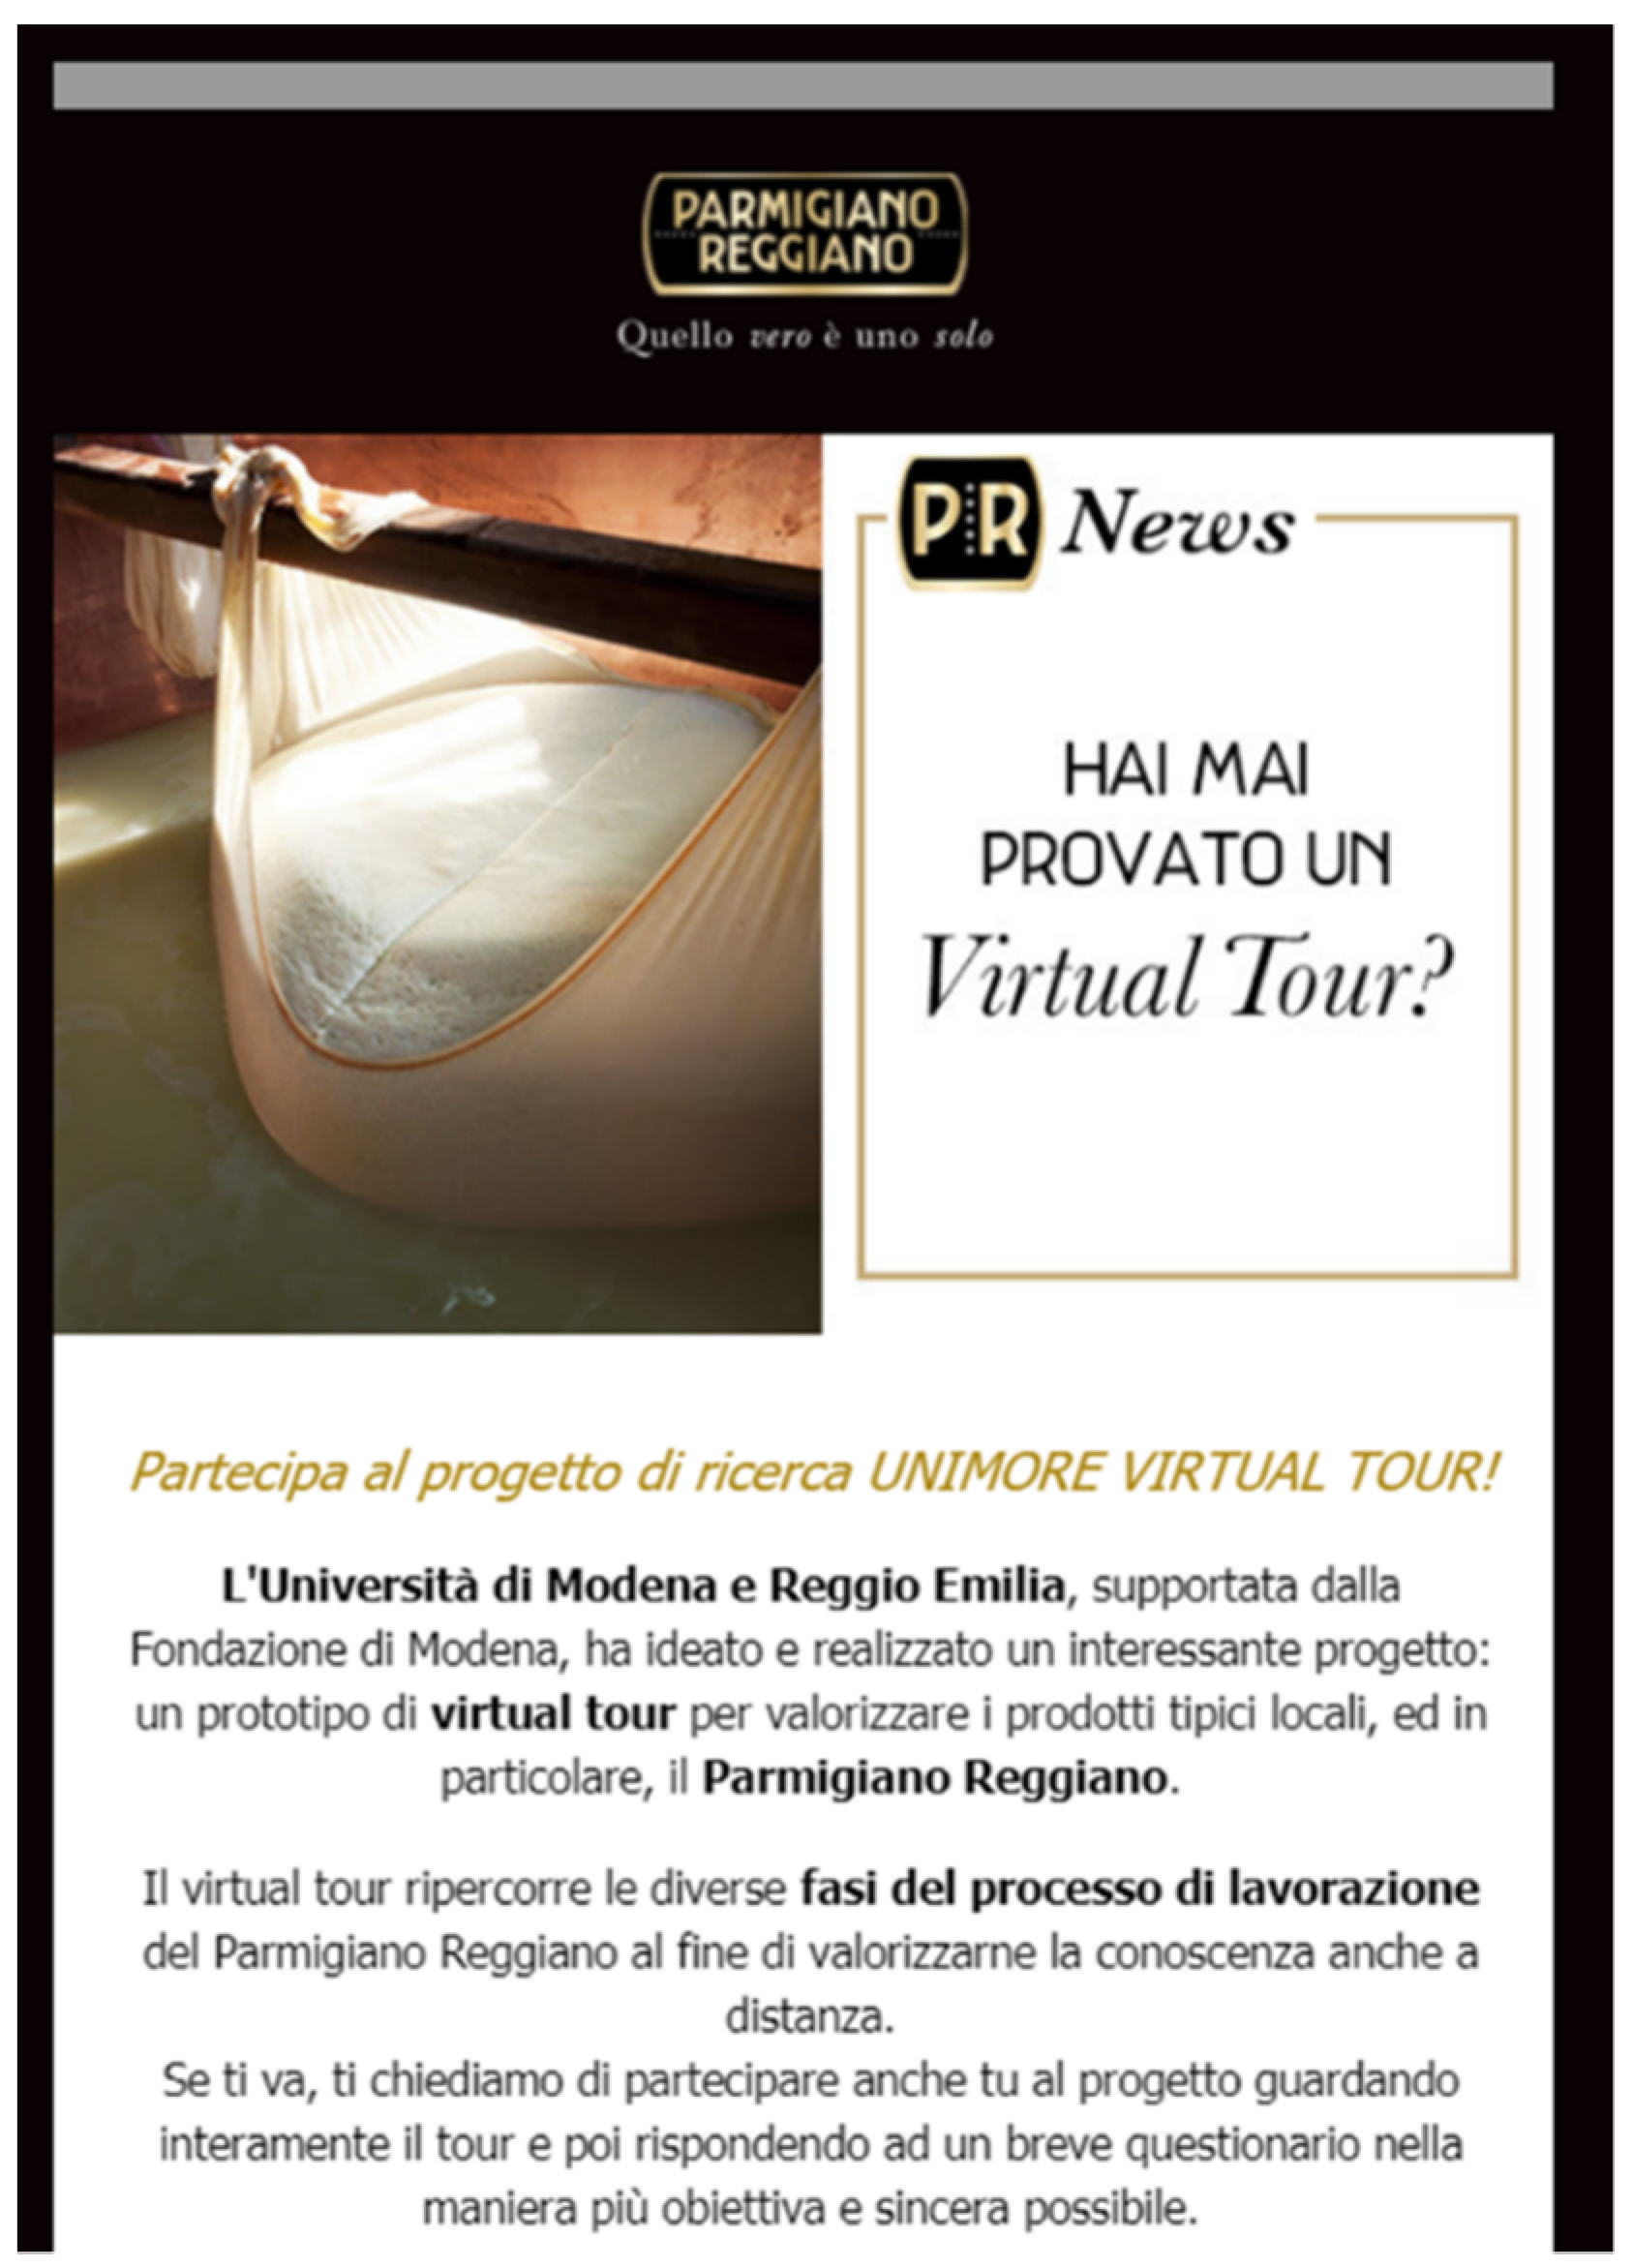
The concept of presence usually overlaps with the concept of flow. Koufaris [41] defined flow as “the holistic sensation that people feel when they act with total involvement” (p. 24). Presence represents a psychological state/perception to be incorporated into the digital environment, determining a temporary dissociation from the real environment due to the task performed in the digital environment [42]. It is a total cognitive absorption determined by the involvement in the digital and augmented space [43,44]. Presence occurs when, within a virtual environment, the virtuality of the experience is not noticed to be virtual and real objects are perceived similarly [10]. Through presence, “users undergo a perceptual illusion of unmediated experience in a setting mediated by human technology-typical of VR environments” [45] (p. 461). Herzig et al. [46] found a positive relationship between presence and enjoyment, confirming previous studies; the latter, developed in the virtual tourism environment, evidence that a high level of perceived presence is statistically associated with enjoyment, e.g., [10,47].
Hypothesis 1 (H1).
Presence exerts a positive effect on Enjoyment.
Immersion means being “in” a real or virtual experience, getting away from everyday experience, playing a different role, or taking on a new identity [48]. It has been defined as “a form of spatio-temporal belonging in the world that is characterized by deep involvement in the present moment” [49] (p. 212). Some studies indirectly suggest that immersion can lead to increased satisfaction and loyalty [50]. Immersion has the intuitive benefit of letting the user understand the virtual and/or augmented reality space [36]. When interacting with immersive environments, users feel an array of positive feelings. In VR environments, immersion is strongly determined by the level of vividness and interactivity provided by the VR tour [51,52]. Yim et al. [53] confirmed a positive relation between VR immersion and enjoyment.
Hypothesis 2 (H2).
Immersion exerts a positive effect on Enjoyment.
Perceive ease-of-use was first introduced in the TAM. Perceived Ease of Use refers to “the degree to which a person believes that using a particular system would be free of effort” [54] (p. 320). Davis explains people’s choices among various decision-making strategies in terms of task complexity.
The relationship between ease-of-use and enjoyment has been shown to be positive in many TAM applications, e.g., [55,56]. Huang et al. [57] identified the importance of perceived ease-of-use on customers’ enjoyment.
Similarly, the ease-of-use of technological systems has been proved to be an antecedent of user satisfaction, e.g., [58,59].
Hypothesis 3 (H3).
Ease-of-use exerts a positive effect on Enjoyment.
Hypothesis 4 (H4).
Ease-of-use exerts a positive effect on VR tour satisfaction.
Another relevant construct at the underpinnings of TAM is enjoyment. Enjoyment is defined as “the activity [to use] technology is perceived to be enjoyable in its own right” [25] (p. 1113). VR has been proved to enrich customers’ consumption enjoyment [57]. Customers could experience fun and hedonic entertainment while searching for information [60]. Thus, virtually experiencing the production phases of a food product stimulates a sense of enjoyment in users [61]. When visiting a production site through a VT, users feel positive emotions [62]. Visitors experiencing immersive and realistic experiences through a VT show higher emotional responses and positive emotions [63,64].
Hypothesis 5 (H5).
Enjoyment exerts a positive effect on VR tour satisfaction.
Customer satisfaction is usually defined as the endorsement of expectations people have during and after their experience with a product, a service, and/or a place. Thus, satisfaction is fundamental to influencing consumer intentions. The extant literature fully supports this acknowledgment among different products and experiences, regarding food [65] and touristic destinations too. The offer of an immersive experience determines and influences user satisfaction [2,66]. This is confirmed also in the tourism sector [67]. Authors found that VR can have a positive impact on customer satisfaction and loyalty [68] and that VT satisfaction enhances positive consumer behavioral intentions [69]. Thus, we can postulate the following:
Hypothesis 6 (H6).
VR tour satisfaction exerts a positive effect on visit intention.
Figure 1 presents the overall theoretical model, hypotheses, and signs of paths between constructs.

4. Research Methods

The study is developed in a quasiexperimental scenario, in which potential visitors are first invited to take a view of a VR video, developed with 360-degree technology, and then invited to participate in a survey.
A 360-degree VT was designed with the scope to understand how a virtual tool may support food producers to encourage people to visit the production site and accordingly the production area, getting in contact with the product itself. The VT was then shared with potential customers and the production site’s visitors through YouTube social media. YouTube was selected for our study, being the most popular social network for videos [70].
The 360-degree shots, recorded in a Parmigiano Reggiano production site, aimed to maintain a high level of authenticity, without excessively mitigating the long processing times—a feature relevant in the purchasing choice of Parmigiano Reggiano—as well as the typical noises of the production site. Figure 2 presents a few scenes of the VT.
The total duration of the VT is 27 min and 9 s. The duration of the VT is representative of the usual duration of a physical tour in the Parmigiano Reggiano production site. The tour, usable at 360-degrees thanks to the gyroscope function of modern devices, allows an immersive experience inside the production site of a typical Italian cheese. To date, the VT has received 1160 views.
To empirically analyze the theoretical model depicted in the previous section, we settle a set of psychographic measures. The online launch of the VT has been planned with the support of the Parmigiano Reggiano Consortium (PRC), which shared the link of the YouTube VT with its newsletter subscribers. At the end of July 2021, we invited the Parmigiano Reggiano newsletter subscribers to experience the VT within the Parmigiano Reggiano production site. Figure 3 shows the main communication used to involve potential shoppers and visitors of the Parmigiano Reggiano dairy to experience the VT on YouTube. To incentive participation, a EUR 5 coupon on a EUR 50 online purchase on the Parmigiano Reggiano marketplace was awarded to those who fulfilled our questionnaire. It is important to note that no one redeemed the coupon; therefore, we can assume a genuine intent to support the research by respondents. Among the VT viewers, 140 were also available to participate in the online survey, filling in the structured questionnaire associated with the VT. The final dataset is composed only of complete and valid structural questionnaires.

4.1. Sample Composition

The sample is composed of people with at least a minimum level of knowledge of the Parmigiano Reggiano product. This is presumably due to the subscription to the Parmigiano Reggiano newsletter. Demographics of the sample, presented in Table 1, show that males and females are almost homogeneously distributed, with a slight predominance of females (60.7%). Conversely, considering the age distribution among the survey participants, a greater presence of adult respondents emerges (cluster: 36–50 y.o.: 27.1%; 51–65 y.o.: 53.6%). More than 65% of respondents stated that they never visited a dairy physically. Nevertheless, they declared themselves to be large consumers of the Parmigiano Reggiano product with a daily (48.6%) and/or almost daily usage (42.1%).
Almost 82% of the respondents stated that they came in contact with the VR tour through the newsletter received from the CPR. However, almost 9% intercepted the VR tour uploaded on YouTube looking for information on the CPR or the Parmigiano Reggiano product, and around 4% by surfing the social network (YouTube). A total of 58.2% of respondents enjoyed the tour using a smartphone, 35.3% using a PC, and 6.5% using a tablet. No one viewed the tour on a game console, smart TV, or using an augmented reality headset. The audio was reproduced in most cases through the device (68.2%), while in the remaining cases an additional hardware component was used (e.g., earphones (13.6%), headphones (9.4%), Dolby surround-sound system (5.9%), wireless speaker (2.9%)).
Although a 360-degree technology was used to develop the VR tour, and the gyroscope symbol was shown at the top left of the screen (indicating an extension of the view), almost 53% of the respondents viewed it in static mode (i.e., two-dimensional view). The remaining 66 respondents interacted with the extended space through the device touchscreen or the tracking tools provided by the social network.

4.2. Measures

To derive constructs and relative items useful for our study, we conducted a wider analysis of the main literature on VTs and technology acceptance and usage. We selected a small sample of 10 possible visitors to preliminarily test the structured questionnaire. The overall questionnaire is composed of three main sections. In the first section, respondents are asked to evaluate some main aspects of the technology used during the VT (i.e., device, audio support, gyroscope). In the second section, a number of items aimed at allowing respondents to assess the six constructs included in the theoretical model are listed. To anchor items, we used a 5-point Likert scale from “strongly disagree–1” to “strongly agree–5”. Table 2 shows the measures used in the questionnaire. To reduce response bias, we shuffled the order of items by respondents [71]. Specifically, we measured the intention to visit the Parmigiano Reggiano production site using a three-item scale derived by De Canio et al. [21], Papagiannidis et al. [72], and Fiore et al. [38]. We used a four-item scale derived by Jung et al. [73] and Han et al. [67] to measure VR tour satisfaction (4 items). We measured enjoyment using a four-item scale derived from the recent study of De Canio et al. [1], while the four items used to measure the ease-of-use construct, as well as the four items used to measure the presence construct, are derived from Georgiou et al. [74]. Finally, the immersion construct, based on a five-item scale, is derived from previous studies of Hudson et al. [45] and Yim et al. [53].
In the third section, demographic information and purchase and consumption behaviors of respondents are collected.

5. Results

5.1. Data Analysis and Measure Validity

Due to the nature of the constructs used in the empirical analysis, and following previous studies’ approaches, we treat all items as reflective indicators. The indications proposed by Hair et al. [75] and Anderson and Gerbing [76] are followed to evaluate constructs’ dimensionality, internal consistency, and validity. The dataset presents no missing values. Accordingly, we implement a two-step approach to first test the unidimensionality and convergent validity of constructs by the means of confirmatory factor analysis (CFA); secondly, we measure structural paths among latent constructs by implementing a Partial Least Square Structural Equation Model (PLS-SEM). To analyze data we use the software Smart PLS 3.3.3 [77]. The PLS procedure was selected to the scope of our analysis for its superior analytical capacity in the presence of small samples [78,79].
We assess convergent and discriminant validities as all factor loadings, presented in Table 2, scored more than 0.70 and are highly significant [80,81]. All items exhibit a high item-total correlation, indicating their capability to measure the construct. Values for both average variance extracted (AVE) and composite reliability (CR) above the threshold cited in the relevant literature (AVE > 0.5 and CR > 0.7) [82], confirming the convergent validity of measures included in the empirical model (See Table 3).
As we implemented a PLS-SEM, we used three methods to assess the discriminant validity between constructs. First, all items showed the highest loadings with their corresponding construct. Second, AVEs between each construct were greater than the squared multiple correlations for each construct pairing [82]. Third, the heterotrait–monotrait ratios (HTHM) showed no intercorrelation between constructs higher than the threshold of 0.9 [83].
The analysis of the standardized root mean squared residual (SRMR = 0.055) for the composite factor model showed no problem with residuals [81].

5.2. Structural Model Results

To provide standard errors and t-values, a two-tail PLS bootstrapping tested on 5000 subsamples was implemented [84]. The structural model shows a good predictive ability, with R-square values higher than 0.10. Specifically, the empirical model is able to explain 78.8% of the enjoyment variance, 61.9% of the VR tour satisfaction, and 51.8% of the variance of the intention to visit a Parmigiano Reggiano dairy. The inner VIF values (Table 4), lower than 4, show no problems related to multicollinearity in the structural model [85].

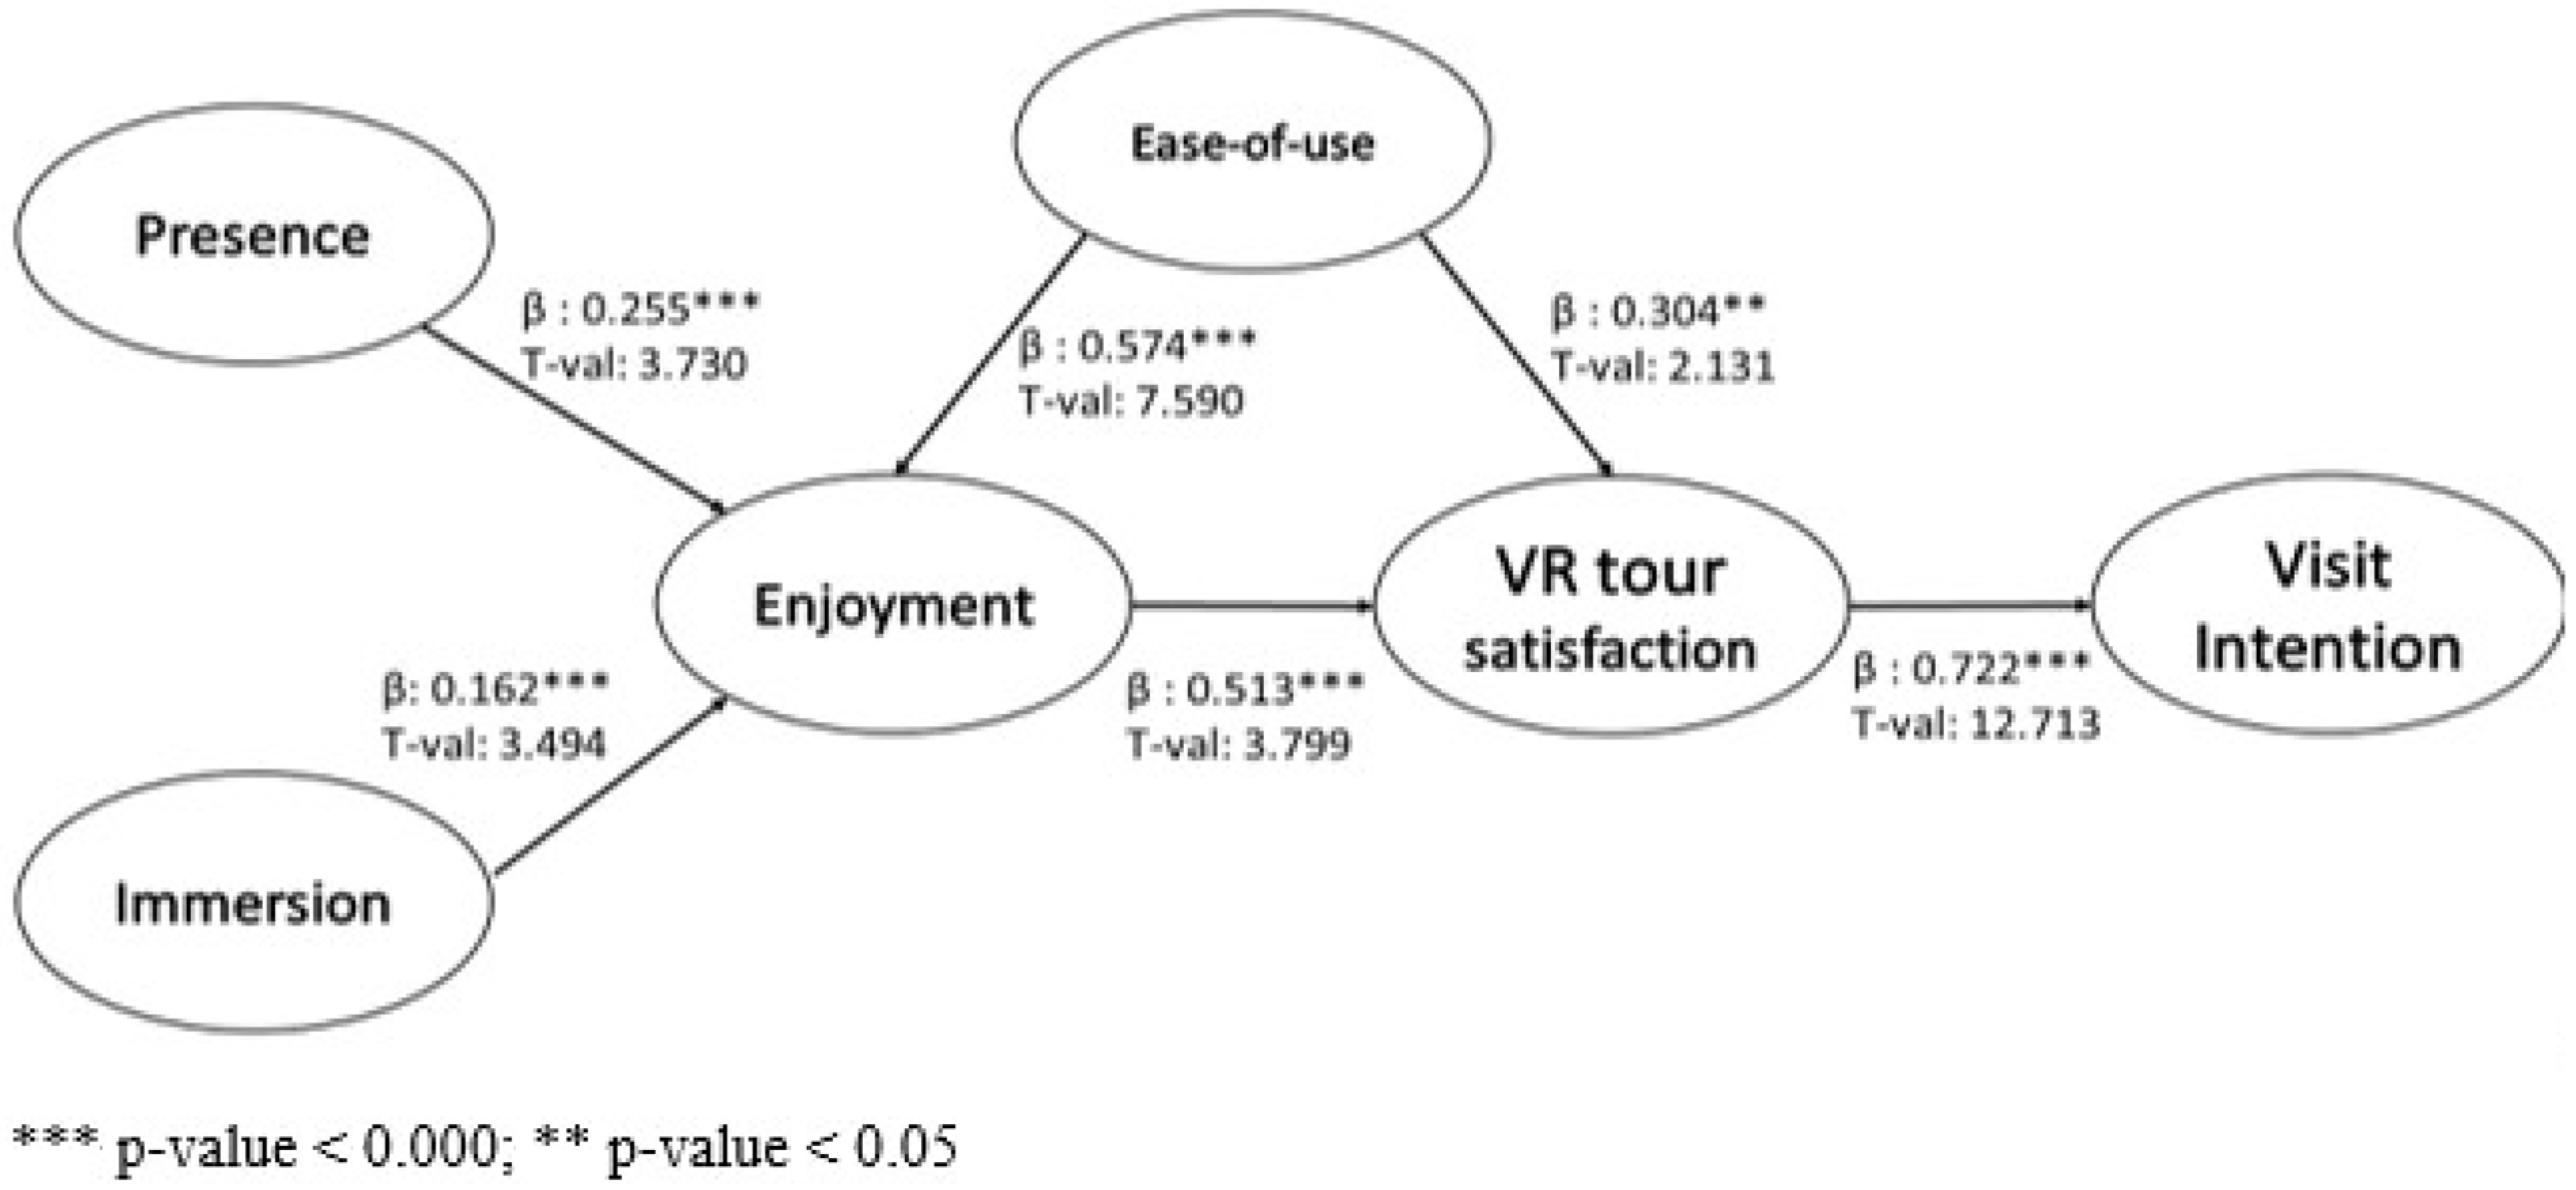
5.2.1. Structural Paths Analysis: Direct Effects

The analysis of the direct effects (see Figure 4) allows us to accept all the formulated hypotheses. We identify a positive and significant impact of flow on the enjoyment, in agreement with the first hypothesis (H1) presented in the theoretical model. Similarly, the impact of immersion on enjoyment is positive and significant, as postulated in H2. The enjoyment receives also a positive and significant influence from the ease-of-use construct, confirming H3. In turn, ease-of-use also affects VR tour satisfaction in a significant and positive way, leading us to confirm H4. Enjoyment exerts a direct and positive impact on VR tour satisfaction, confirming H5. Finally, H6 is also confirmed as VR tour satisfaction shows a positive and significant impact on the intention to visit the dairy. Cohen’s f2 [86] evidenced that H3 and H6 manifest a strong effect, H5 has a medium effect, while H1, H2, and H4 provide a small effect (please see Table 5).

5.2.2. Indirect Effects

The analysis of the indirect effects (see Table 5) shows that presence, immersion, and ease-of-use have a positive indirect effect on VR tour satisfaction by the means of enjoyment. Similarly, ease-of-use and enjoyment indirectly influence visit intention positively, mediated by VR tour satisfaction. Albeit with a reduced impact, presence and immersion indirectly influence the physical visit intention, confirming that immersive and realistic VR technologies may be relevant in influencing tourists’ decisions.

6. Discussion

6.1. Theoretical Implications

Today, we are experiencing the widespread diffusion of wearable devices, that, although not all allow a full VR experience—such as the one provided by sensory stimulation tools (e.g., tactile gloves, extensions of the digital environment, gamified designs)—can reduce the distance between producers and consumers, offering an immersive but easily accessible experience with no time, space, or device limitations. Emerging technologies are deeply influencing consumers’ lives, opening up new challenges and opportunities for businesses across all sectors. Among others, the tourism sector, widely affected by the COVID-19 pandemic, is pushed to redesign its offer by sustainably exploiting new digital opportunities. Within this context, AR and VR technologies are compensating for tourists’ needs to visit a place and are considered a sustainable way to stimulate tourists’ urge to travel in a context of severe restrictions [6,18,87].
This study represents one of the first multidisciplinary attempts to combine both marketing and computer engineering perspectives. Results show that by the use of immersive and realistic 360-degree VTs, tourists may visit a place comfortably seated on their sofa, and without risk of infection of the virus. Thus, today, more than in the past, it is important to design VTs that are particularly engaging and able to let the user lose their sense of time, highly immersive, and easy to use. In this way, users will feel a sense of pleasure, which will positively influence their level of satisfaction with the VR tour and their intention to visit the place physically as soon as possible. This is to say that the more pleasurable and enjoyable the VR experience, the more visitors are satisfied with the VR tour and are more willing to physically visit the production site and the destination area. From a theoretical point of view, our findings extend the TAM [25], verifying that presence and immersion are two fundamental variables when analyzing the 360° video immersive tour. Findings confirm that presence influences travelers’ behavioral intentions [44]. Accordingly, in the context of virtual and augmented reality, TAM must be extended with variables strictly connected to interactivity and immersion, in line with Bowman and McMahan’s [36] statement. Our results confirm that both presence and immersion, as well as the ease of use of the VR tour, should be equally considered in the AR and VR literature.
Our results are also in line with the recent tourism literature highlighting the relevance of the virtual experience in determining tourists’ visiting intentions. Results confirm that the VR experience may positively influence the overall VR satisfaction [68], and accordingly, tourists’ visiting intention [69]. The digital previsit allows the tourists’ expectations to be amplified when deciding their next destination to visit. Last but not least, our results contribute to the recent literature on the role of different devices in consumers’ lives. Even in the context of VR tours, the smartphone is confirmed as the main device chosen by users, confirming the pervasive role played by the mobile device.

6.2. Managerial Implications

Our findings are also able to corroborate that food products can play a key role in the definition of the destination image even when AR and VR technologies are concerned, broadening previous studies [88].
Findings drive relevant strategies and tactics useful for economic and business players called to adopt multiple strategies to attract visitors [89]. AR and VR technologies can offer a sustainable opportunity to businesses aimed at establishing a strong relationship with their users, consumers, and tourists by the means of technologies, above all in the context of restrictions determined by the pandemic. Virtual and interactive technologies have been proved as excellent tools to build and extend the relationship with customers [67] and tourists [3]. Englobing social, environmental, and technological elements of sustainability, VR allows companies to be in touch with people far away and to promote their brand. Similar to previous findings in the AR technology context [20], VR tours may enable sectors to reach a 4.0 level with direct relevance to sustainability indicators. As our study proves, VTs can become a source of economic sustainability for agri-food producers and touristic destinations as they can boost customers’ proneness to visit the production site, benefiting the local territories in which they are located. As a matter of fact, the majority of food-production sites offer the possibility to buy their products at the end of the visit, so by enhancing the possibility to visit the production site, sales can be improved. At the same time, visitors, attracted by the production site, can then take advantage of their venue to visit the surroundings, stimulating positive returns for the local destination as a whole. Moreover, the use of social media to promote digital applications, spread across different age targets, could bring new visitor targets closer to destinations with a strong food connotation. However, to achieve these positive effects, agri-food producers should arrange enjoyable and immersive VTs, able to let the users be completely absorbed and involved by the virtual scenario. As other interactive gamified tools [90,91,92], VR tours augment tourists’ experience stimulating the visiting intention. VR tour customer satisfaction is critical to developing visitors’ proneness, so the commitment of food producers in offering a valuable and satisfying VR tour should be strong and long term. To this concern, the easiness of virtually visiting the production site cannot be overlooked, as it exerts an important role in impacting, both directly and indirectly, the level of customer satisfaction. Interactive virtual environments, where the visitor may participate in the food production, can represent an opportunity to stimulate food tourism, particularly in the context of a pandemic. Indeed, although still under travel restrictions—especially severe in the case of international travel—AR and VR may represent an opportunity for traditional tourism and tourism operators [15]. To this regard, local policymakers and tour operators should stimulate cooperation programs between the local agri-food producers and the actors operating in the hospitality local industry, to plan and manage joint communication campaigns and promotional initiatives that match visits to the production sites with local tours to local cultural, heritage, and commercial sites. This will foster a more sustainable perspective of the local destination.
Finally, results on the use of VT opens up new challenges for operators who want to implement digital tools to attract new visitors into the destination area, as well as into the production site. As the usage results presented in the method section show, to date, the smartphone is the main device to be used to experience the digital experience, due to its large diffusion and availability. Accordingly, virtual tours should be implemented to suit a 5–7-inch screen. Further, to increase the experience, the device’s tactile responses should be implemented to amplify the interaction with the video, and, accordingly, to extend the overall experience engagement.

7. Conclusions

7.1. Study Limitations

The research presents a theoretical and empirical analysis of the way VR tours may involve people in visiting the production site and, accordingly, the relative geographic area. This is increasingly true when PDO/PGI products are concerned, due to their strong relationship with the production area. Although this study provides a great contribution, it also presents some limitations that should be covered in future studies. In this study, we approached the role of VR technologies to involve people to visit a food production area. However, further studies should investigate how virtual technologies may strengthen this effect. Further, due to the data collection method, we selected people with an average level of product knowledge a priori and we did not explore the role played by product knowledge. This aspect, in our opinion, may represent a very strong impact above all when agri-food products are concerned. Last but not least, since the empirical analysis is cross-sectional, caution must be exercised concerning the results obtained, leading us to avoid any claim on constructs’ causality.

7.2. Recommendations and Future Research Agenda

The development of new augmented and virtual technologies is revolutionizing the theory of human–machine interactions. Companies, as well as researchers, are now called to deepen an economic and social scenario, as well as a technological one, which is both offering multiple opportunities to the players, as well as highlighting enormous challenges. Future studies are called to investigate how the constant evolution in mobile technologies, the emerging gaming trends among the younger generations, and the increasingly widespread technological instrumentation will be able to change the human–machine relationship in favor of the stakeholders. Operators of the tourism sector may offer a sustainable and interactive virtual experience, involving and cooperating with food producers, to improve their market performance. Future studies should explore how immersive and interactive VR tours may enhance travel eWOM [93] and travel community [94].
Further, new immersive glasses, avatars, tactile gloves, and increasingly sophisticated screens and audio tools will be able to make the experience through augmented, virtual or mixed reality increasingly decisive in managing the relationship between companies and users, breaking the space and time boundaries still present. The issue of economic sustainability should be better explored when it comes to VR applications: as this research evidences, VTs can support potential sales and the intention to physically visit the food production site. From this viewpoint, augmented and virtual tours can become a source of social, environmental and economic sustainability for agri-food producers and the local destinations. However, these technologies are still very expensive to be used in practice and complex to arrange, especially for micro and small businesses. Consequently, a further avenue of future research should address this issue and shed light on a cost–benefit perspective. Last but not least, technological development requires further investigation on the ability of virtual, augmented, and mixed reality to stimulate the user sensorially, in order to definitively undermine the gap identified in the literature to date [95].

Author Contributions

Introduction, F.D.C. and E.M.; VT experience with VR technology, M.P. and S.C.; conceptualization and hypotheses, F.D.C.; methodology, F.D.C.; VT development, S.C.; formal analysis, F.D.C.; investigation, E.M. and M.P.; data curation and results, F.D.C.; discussion, E.M.; conclusions, F.D.C.; supervision, E.M.; project administration, M.P. All authors have read and agreed to the published version of the manuscript.

Funding

This research was funded by the Fondazione di Modena and by the University of Modena and Reggio Emilia-University Fund for Research, grant name “UNIMORE FAR2019”, competitive research project name “New digital tools for remote customer experience: how to promote the Modenese agri-food typical products”.

Institutional Review Board Statement

Not applicable.

Informed Consent Statement

Informed consent was obtained from all subjects involved in the study.

Data Availability Statement

Not applicable.

Acknowledgments

Authors wish to acknowledge the Parmigiano Reggiano Consortium for their precious collaboration.

Conflicts of Interest

The authors declare no conflict of interest. The funders had no role in the design of the study; in the collection, analyses, or interpretation of data; in the writing of the manuscript, or in the decision to publish the results.

References

  1. De Canio, F.; Fuentes-Blasco, M.; Martinelli, E. Engaging shoppers through mobile apps: The role of gamification. Int. J. Retail Distrib. Manag. 2021, 49, 919–940. [Google Scholar] [CrossRef]
  2. Kim, D.; Ko, Y.J. The impact of virtual reality (VR) technology on sport spectators’ flow experience and satisfaction. Comput. Human Behav. 2019, 93, 346–356. [Google Scholar] [CrossRef]
  3. Buhalis, D.; Leung, R. Smart hospitality—Interconnectivity and interoperability towards an ecosystem. Int. J. Hosp. Manag. 2018, 71, 41–50. [Google Scholar] [CrossRef]
  4. Neuhofer, B.; Buhalis, D. Understanding and Managing Technology-Enabled Enhanced Tourist Experiences. In Proceedings of the 2nd Conference on Hospitality and Tourism Marketing & Management, Corfu, Greece, 31 May–3 June 2018; Available online: https://www.academia.edu/download/16392263/Neuhofer_and_Buhalis_2012_Understanding_and_Managing_Technology-Enabled_Enhanced_Tourist_Experiences.pdf (accessed on 15 January 2022).
  5. Neuhofer, B.; Buhalis, D.; Ladkin, A. Experiences, co-creation and technology: A conceptual approach to enhance tourism experiences. Tour. Glob. Chang. Edge Something Big 2013, 546–555. [Google Scholar]
  6. Correia Loureiro, S.M.C.; Nascimento, J. Shaping a view on the influence of technologies on sustainable tourism. Sustainability 2021, 13, 12691. [Google Scholar] [CrossRef]
  7. Gretzel, U.; Fesenmaier, D.R.; O’leary, J. The transformation of consumer behaviour. In Tourism Business Frontiers: Consumers, Products and Industry; Buhalis, D., Costa, C., Eds.; Elsevier: Burlington, MA, USA, 2006; pp. 9–18. Available online: https://www.sciencedirect.com/science/article/pii/B9780750663779500092?via%3Dihub (accessed on 15 January 2022).
  8. Mohanty, P.; Hassan, A.; Ekis, E. Augmented reality for relaunching tourism post-COVID-19: Socially distant, virtually connected. Worldw. Hosp. Tour. Themes 2020, 12, 753–760. [Google Scholar] [CrossRef]
  9. Chung, N.; Han, H.; Joun, Y. Tourists’ intention to visit a destination: The role of augmented reality (AR) application for a heritage site. Comput. Human Behav. 2015, 50, 588–599. [Google Scholar] [CrossRef]
  10. Tussyadiah, I.P.; Wang, D.; Jung, T.H.; Tom Dieck, M.C. Virtual reality, presence, and attitude change: Empirical evidence from tourism. Tour. Manag. 2018, 66, 140–154. [Google Scholar] [CrossRef]
  11. Van, N.T.T.; Vrana, V.; Duy, N.T.; Minh, D.X.H.; Dzung, P.T.; Mondal, S.R.; Das, S. The Role of Human–Machine In-teractive Devices for Post-COVID-19 Innovative Sustainable Tourism in Ho Chi Minh City, Vietnam. Sustainability 2020, 12, 9523. [Google Scholar] [CrossRef]
  12. Scurati, G.W.; Bertoni, M.; Graziosi, S.; Ferrise, F. Exploring the use of virtual reality to support environmentally sustainable behavior: A framework to design experiences. Sustainability 2021, 13, 943. [Google Scholar] [CrossRef]
  13. Schiopu, A.F.; Hornoiu, R.I.; Padurean, M.A.; Nica, A.M. Virus tinged? Exploring the facets of virtual reality use in tourism as a result of the COVID-19 pandemic. Telemat. Inform. 2021, 60, 101575. [Google Scholar] [CrossRef]
  14. Gegung, E.M. International Tourism and the Covid-19 Pandemic: The Use of Virtual Reality to Increase Tourism Destination Sustainability and How Users Perceive the Authenticity of Vr Experiences. J. Kepariwisataan Indones. J. Penelit. Dan Pengemb. Kepariwisataan Indones. 2021, 15, 9–15. [Google Scholar] [CrossRef]
  15. Harada, T.; Hideyoshi, Y.; Gressier-Soudan, E.; Jean, C. Museum experience design based on multi-sensory transformation approach. Proc. Int. Des. Conf. Des. 2018, 5, 2221–2228. [Google Scholar] [CrossRef]
  16. Bec, A.; Moyle, B.; Schaffer, V.; Timms, K. Virtual reality and mixed reality for second chance tourism. Tour. Manag. 2021, 83, 104256. [Google Scholar] [CrossRef]
  17. De Luca, G.; Dastgerdi, A.S.; Francini, C.; Liberatore, G. Sustainable cultural heritage planning and management of overtourism in art cities: Lessons from atlas world heritage. Sustainability 2020, 12, 3929. [Google Scholar] [CrossRef]
  18. Akhtar, N.; Khan, N.; Mahroof Khan, M.; Ashraf, S.; Hashmi, M.S.; Khan, M.M.; Hishan, S.S. Post-covid 19 tourism: Will digital tourism replace mass tourism? Sustainability 2021, 13, 5352. [Google Scholar] [CrossRef]
  19. El-Said, O.; Aziz, H. Virtual Tours a Means to an End: An Analysis of Virtual Tours’ Role in Tourism Recovery Post COVID-19. J. Travel Res. 2021, 61, 528–548. [Google Scholar] [CrossRef]
  20. Cavallaro, S.; Grandi, F.; Peruzzini, M.; De Canio, F. Virtual Tours to Promote the Remote Customer Experience; IOS Press: Amsterdam, The Netherlands, 2021. [Google Scholar]
  21. De Canio, F.; Martinelli, E.; Peruzzini, M.; Marchi, G. The use of virtual tours to stimulate consumers’ buying and visit intentions: An application to the Parmigiano Reggiano cheese. Ital. J. Mark. 2021, 1, 209–226. [Google Scholar] [CrossRef]
  22. Hoyer, W.D.; Kroschke, M.; Schmitt, B.; Kraume, K.; Shankar, V. Transforming the Customer Experience through New Technologies. J. Interact. Mark. 2020, 51, 57–71. [Google Scholar] [CrossRef]
  23. Sidiropoulos, V.; Bechtsis, D.; Vlachos, D. An augmented reality symbiosis software tool for sustainable logistics activities. Sustainability 2021, 13, 10929. [Google Scholar] [CrossRef]
  24. De Canio, F.; Pellegrini, D.; Aramendia-Muneta, M.E. The smartphoners: Consumer segmentation by smartphone usage. Mer. Comp. 2016, 1, 123–144. [Google Scholar] [CrossRef]
  25. Davis, F.D.; Bagozzi, R.P.; Warshaw, P.R. Extrinsic and Intrinsic Motivation to Use Computers in the Workplace. J. Appl. Soc. Psychol. 1992, 22, 1111–1132. [Google Scholar] [CrossRef]
  26. Antón, C.; Camarero, C.; Laguna, M.; Buhalis, D. Impacts of authenticity, degree of adaptation and cultural contrast on travellers’ memorable gastronomy experiences. J. Hosp. Mark. Manag. 2019, 28, 743–764. [Google Scholar] [CrossRef]
  27. Mohammad, A.; Ismail, H. Development and evaluation of an interactive 360 virtual tour for tourist destinations. J. Inform. Technol. Impact 2009, 9, 137–182. [Google Scholar]
  28. Spielmann, N.; Mantonakis, A. In virtuo: How user-driven interactivity in virtual tours leads to attitude change. J. Bus. Res. 2018, 88, 255–264. [Google Scholar] [CrossRef]
  29. Koutsoudis, A.; Arnaoutoglou, F.; Chamzas, C. On 3D reconstruction of the old city of Xanthi. A minimum budget approach to virtual touring based on photogrammetry. J. Cult. Herit. 2007, 8, 26–31. [Google Scholar] [CrossRef]
  30. Germak, C.; Di Salvo, A.; Abbate, L. Augmented Reality Experience for Inaccessible Areas in Museums. In Proceedings of the EVA London 2021 (EVA 2021), London, UK, 5–9 July 2021; pp. 39–45. [Google Scholar]
  31. Huang, Y.C.; Backman, K.F.; Backman, S.J.; Chang, L.L. Exploring the implications of virtual reality technology in tourism marketing: An integrated research framework. Int. J. Tour. Res. 2016, 18, 116–128. [Google Scholar] [CrossRef]
  32. Flavián, C.; Ibáñez-Sánchez, S.; Orús, C. Impacts of technological embodiment through virtual reality on potential guests’ emotions and engagement. J. Hosp. Mark. Manag. 2021, 30, 1–20. [Google Scholar] [CrossRef]
  33. Ijsselsteijn, W.; Riva, G. Being there: The experience of presence in mediated environments. In Being There: Concepts, Effects and Measurements of User Presence in Synthetic Environments; Riva, G., Davide, F., Jsselsteijn, W.A.I., Eds.; IOS Press: Amsterdam, The Netherlands, 2003; pp. 3–16. [Google Scholar]
  34. Nykänen, N. Achieving the Experience of Immersion in Virtual Reality. 2021. Available online: https://jyx.jyu.fi/handle/123456789/76748 (accessed on 15 January 2022).
  35. Correira Loureiro, S.M.C.; Guerreiro, J.; Eloy, S.; Langaro, D.; Panchapakesan, P. Understanding the use of Virtual Reality in Marketing: A text mining-based review. J. Bus. Res. 2019, 100, 514–530. [Google Scholar] [CrossRef]
  36. Bowman, D.A.; McMahan, R.P. Virtual reality: How much immersion is enough? Computer 2007, 40, 36–43. [Google Scholar] [CrossRef]
  37. Papagiannidis, S.; Bourlakis, M.; Li, F. Making real money in virtual worlds: MMORPGs and emerging business opportunities, challenges and ethical implications in metaverses. Technol. Forecast. Soc. Chang. 2008, 75, 610–622. [Google Scholar] [CrossRef]
  38. Fiore, A.M.; Kim, J.; Lee, H.H. Effect of image interactivity technology on consumer responses toward the online retailer. J. Interact. Mark. 2005, 19, 38–53. [Google Scholar] [CrossRef]
  39. Kim, H.; So, K.K.F.; Mihalik, B.J.; Lopes, A.P. Millennials’ virtual reality experiences pre-and post-COVID-19. J. Hosp. Tour. Manag. 2020, 48, 200–209. [Google Scholar] [CrossRef]
  40. Yung, R.; Khoo-Lattimore, C.; Potter, L.E. VR the world: Experimenting with emotion and presence for tourism marketing. J. Hosp. Tour. Manag. 2021, 46, 160–171. [Google Scholar] [CrossRef]
  41. Koufaris, M. Applying the Technology Acceptance Model and Flow Theory to Cyworld User Behavior. Inf. Syst. Res. 2002, 13, 205–223. [Google Scholar] [CrossRef] [Green Version]
  42. Blazquez Cano, M.; Perry, P.; Ashman, R.; Waite, K. The influence of image interactivity upon user engagement when using mobile touch screens. Comput. Hum. Behav. 2017, 77, 406–412. [Google Scholar] [CrossRef]
  43. Hsu, C.L.; Lu, H.P. Why do people play on-line games? An extended TAM with social influences and flow experience. Inf. Manag. 2004, 41, 853–868. [Google Scholar] [CrossRef]
  44. Ongsakul, V.; Ali, F.; Wu, C.; Duan, Y.; Cobanoglu, C.; Ryu, K. Hotel website quality, performance, telepresence and behavioral intentions. Tour. Rev. 2020, 76, 681–700. [Google Scholar] [CrossRef]
  45. Hudson, S.; Matson-Barkat, S.; Pallamin, N.; Jegou, G. With or without you? Interaction and immersion in a virtual reality experience. J. Bus. Res. 2019, 100, 459–468. [Google Scholar] [CrossRef]
  46. Herzig, P.; Strahringer, S.; Ameling, M. Gamification of ERP systems—Exploring gamification effects on user acceptance constructs. In Proceedings of the Multikonferenz Wirtschaftsinformatik 2012—Tagungsband der MKWI 2012, Braunschweig, Germany, 21–22 March 2012; pp. 793–804. [Google Scholar]
  47. Sylaiou, S.; Mania, K.; Karoulis, A.; White, M. Exploring the relationship between presence and enjoyment in a virtual museum. Int. J. Hum. Comput. Stud. 2010, 68, 243–253. [Google Scholar] [CrossRef]
  48. Pine, B.J.; Pine, J.; Gilmore, J.H. The Experience Economy: Work Is Theatre & Every Business a Stage; Harvard Business Press: Boston, MA, USA, 1999; ISBN 0875848192. [Google Scholar]
  49. Hansen, A.H.; Mossberg, L. Consumer immersion: A key to extraordinary experiences. In Handbook on the Experience Economy; Edward Elgar Publishing: Cheltenham, UK, 2013. [Google Scholar]
  50. Jung, T.H.; tom Dieck, M.C. Augmented reality, virtual reality and 3D printing for the co-creation of value for the visitor experience at cultural heritage places. J. Place Manag. Dev. 2017, 10, 140–151. [Google Scholar] [CrossRef]
  51. Kim, J.; Forsythe, S. Adoption of virtual try-on technology for online apparel shopping. J. Interact. Mark. 2008, 22, 45–59. [Google Scholar] [CrossRef]
  52. Lombard, M.; Ditton, T. At the heart of it all: The concept of presence. J. Comput. Mediat. Comm. 1997, 3, 89–103. [Google Scholar] [CrossRef]
  53. Yim, M.Y.C.; Chu, S.C.; Sauer, P.L. Is Augmented Reality Technology an Effective Tool for E-commerce? An Interactivity and Vividness Perspective. J. Interact. Mark. 2017, 39, 89–103. [Google Scholar] [CrossRef]
  54. Davis, F.D. Perceived usefulness, perceived ease of use, and user acceptance of information technology. MIS Q. Manag. Inf. Syst. 1989, 13, 319–339. [Google Scholar] [CrossRef] [Green Version]
  55. Rodrigues, L.F.; Oliveira, A.; Costa, C.J. Does ease-of-use contributes to the perception of enjoyment? A case of gamification in e-banking. Comput. Hum. Behav. 2016, 61, 114–126. [Google Scholar] [CrossRef]
  56. Sun, H.; Zhang, P. Causal Relationships between Perceived Enjoyment and Perceived Ease of Use: An Alternative Approach. J. Assoc. Inf. Syst. 2006, 7, 618–645. [Google Scholar] [CrossRef] [Green Version]
  57. Huang, Y.C.; Backman, S.J.; Backman, K.F.; Moore, D.W. Exploring user acceptance of 3D virtual worlds in travel and tourism marketing. Tour. Manag. 2013, 36, 490–501. [Google Scholar] [CrossRef]
  58. Helin, K.; Kuula, T.; Vizzi, C.; Karjalainen, J.; Vovk, A. User experience of augmented reality system for astronaut’s manual work support. Front. Rob. AI 2018, 5, 106. [Google Scholar] [CrossRef] [Green Version]
  59. Ohk, K.; Park, S.B.; Hong, J.W. The influence of perceived usefulness, perceived ease of use, interactivity, and ease of navigation on satisfaction in mobile application. Int. J. Adv. Sci. Technol. 2015, 84, 88–92. [Google Scholar] [CrossRef]
  60. Healy, N.; van Riper, C.J.; Boyd, S.W. Low versus high intensity approaches to interpretive tourism planning: The case of the Cliffs of Moher, Ireland. Tour. Manag. 2016, 52, 574–583. [Google Scholar] [CrossRef]
  61. Schlosser, A.E. Experiencing Products in the Virtual World: The Role of Goal and Imagery in Influencing Attitudes versus Purchase Intentions. J. Consum. Res. 2003, 30, 184–198. [Google Scholar] [CrossRef]
  62. Kang, H.J.; Shin, J.H.; Ponto, K. How 3D Virtual Reality Stores Can Shape Consumer Purchase Decisions: The Roles of Informativeness and Playfulness. J. Interact. Mark. 2020, 49, 70–85. [Google Scholar] [CrossRef]
  63. Buonincontri, P.; Marasco, A.; Ramkissoon, H. Visitors’ experience, place attachment and sustainable behaviour at cultural heritage sites: A conceptual framework. Sustainability 2017, 9, 1112. [Google Scholar] [CrossRef] [Green Version]
  64. Nian, S.; Zhang, H.; Mao, L.; Zhao, W.; Zhang, H.; Lu, Y.; Zhang, Y.; Xu, Y. How Outstanding Universal Value, service quality and place attachment influences tourist intention towardsworld heritage conservation: A case study of Mount Sanqingshan National Park, China. Sustainability 2019, 11, 3321. [Google Scholar] [CrossRef] [Green Version]
  65. Sudari, S.A.; Tarofder, A.K.; Khatibi, A.; Tham, J. Measuring the critical effect of marketing mix on customer loyalty through customer satisfaction in food and beverage products. Manag. Sci. Lett. 2019, 9, 1385–1396. [Google Scholar] [CrossRef]
  66. Rhee, H.L.; Lee, K.H. Enhancing the sneakers shopping experience through virtual fitting using augmented reality. Sustainability 2021, 13, 6336. [Google Scholar] [CrossRef]
  67. Han, S.; Yoon, J.H.; Kwon, J. Impact of experiential value of augmented reality: The context of heritage tourism. Sustainability 2021, 13, 4147. [Google Scholar] [CrossRef]
  68. McLean, G.; Al-Nabhani, K.; Wilson, A. Developing a Mobile Applications Customer Experience Model (MACE)—Implications for Retailers. J. Bus. Res. 2018, 85, 325–336. [Google Scholar] [CrossRef] [Green Version]
  69. Chung, N.; Lee, H.; Kim, J.-Y.; Koo, C. The role of augmented reality for experience-influenced environments: The case of cultural heritage tourism in Korea. J. Travel Res. 2018, 57, 627–643. [Google Scholar] [CrossRef]
  70. Statista. Most Popular Social Networks Worldwide as of January 2022, Ranked by Number of Monthly Active Users. 2022. Available online: https://www.statista.com/statistics/272014/global-social-networks-ranked-by-number-of-users/ (accessed on 15 January 2022).
  71. Danaher, P.J.; Haddrell, V. A comparison of question scales used for measuring customer satisfaction. Int. J. Serv. Ind. Manag. 1996, 7, 4–26. [Google Scholar] [CrossRef]
  72. Papagiannidis, S.; Pantano, E.; See-To, E.W.K.; Bourlakis, M. Modelling the determinants of a simulated experience in a virtual retail store and users’ product purchasing intentions. J. Mark. Manag. 2013, 29, 1462–1492. [Google Scholar] [CrossRef]
  73. Jung, T.; Chung, N.; Leue, M.C. The determinants of recommendations to use augmented reality technologies: The case of a Korean theme park. Tour. Manag. 2015, 49, 75–86. [Google Scholar] [CrossRef]
  74. Georgiou, Y.; Kyza, E.A. The development and validation of the ARI questionnaire: An instrument for measuring immersion in location-based augmented reality settings. Int. J. Hum. Comput. Stud. 2017, 98, 24–37. [Google Scholar] [CrossRef]
  75. Hair, J.F.; Risher, J.J.; Sarstedt, M.; Ringle, C.M. When to use and how to report the results of PLS-SEM. Eur. Bus. Rev. 2019, 31, 2–24. [Google Scholar] [CrossRef]
  76. Anderson, J.C.; Gerbing, D.W. Structural equation modeling in practice: A review and recommended two-step approach. Psychol. Bull. 1988, 103, 411. [Google Scholar] [CrossRef]
  77. Ringle, C.; Wende, M.S.; Becker, J.M. Smart PLS 3; SmartPLS GmbH: Boenningstedt, Germany, 2015. [Google Scholar]
  78. Goodhue, D.L.; Lewis, W.; Thompson, R. Does PLS have advantages for small sample size or non-normal data? MIS Q. 2012, 36, 981–1001. [Google Scholar] [CrossRef] [Green Version]
  79. Hair, J.; Hollingsworth, C.L.; Randolph, A.B.; Chong, A.Y.L. An updated and expanded assessment of PLS-SEM in information systems research. Ind. Manag. Data Syst. 2017, 117, 442–458. [Google Scholar] [CrossRef]
  80. Browne, M.W.; Cudeck, R. Alternative Ways of Assessing Model Fit. Sociol. Methods Res. 1992, 21, 230–258. [Google Scholar] [CrossRef]
  81. Hu, L.T.; Bentler, P.M. Cutoff criteria for fit indexes in covariance structure analysis: Conventional criteria versus new alternatives. Struct. Equ. Model. 1999, 6, 1–55. [Google Scholar] [CrossRef]
  82. Fornell, C.; Larcker, D.F. Evaluating Structural Equation Models with Unobservable Variables and Measurement Error. J. Mark. Res. 1981, 18, 39. [Google Scholar] [CrossRef]
  83. Henseler, J.; Ringle, C.M.; Sarstedt, M. A new criterion for assessing discriminant validity in variance-based structural equation modeling. J. Acad. Mark. Sci. 2015, 43, 115–135. [Google Scholar] [CrossRef] [Green Version]
  84. Dijkstra, T.K.; Henseler, J. Consistent and asymptotically normal PLS estimators for linear structural equations. Comput. Stat. Data Anal. 2015, 81, 10–23. [Google Scholar] [CrossRef] [Green Version]
  85. Miles, J.N.V.; Shevlin, M.E. Applying Regression and Correlation: A Guide for Students and Researchers; Sage Publications: London, UK, 2021. [Google Scholar]
  86. Cohen, J. Statistical Power Analysis for the Behaviors Science, 2nd ed.; Lawrence Erlbaum Associates: Hillsdale, NJ, USA, 1988. [Google Scholar]
  87. Buhalis, D.; Harwood, T.; Bogicevic, V.; Viglia, G.; Beldona, S.; Hofacker, C. Technological disruptions in services: Lessons from tourism and hospitality. J. Serv. Manag. 2019, 30, 484–506. [Google Scholar] [CrossRef]
  88. Henderson, J.C. Food tourism reviewed. Br. Food J. 2009, 111, 317–326. [Google Scholar] [CrossRef]
  89. Navarro-Ruiz, S.; McKercher, B. The usability of visitor attractions: State-of-the-art. Tour. Rev. 2020, 75, 497–509. [Google Scholar] [CrossRef]
  90. Xu, F.; Weber, J.; Buhalis, D. Gamification in tourism. In Information and Communication Technologies in Tourism; Springer: Cham, Switzerland, 2014; pp. 525–537. [Google Scholar] [CrossRef]
  91. Xu, F.; Tian, F.; Buhalis, D.; Weber, J.; Zhang, H. Tourists as mobile gamers: Gamification for tourism marketing. J. Trav. Tour. Mark. 2016, 33, 1124–1142. [Google Scholar] [CrossRef]
  92. Xu, F.; Buhalis, D.; Weber, J. Serious games and the gamification of tourism. Tour. Manag. 2017, 60, 244–256. [Google Scholar] [CrossRef]
  93. Pourfakhimi, S.; Duncan, T.; Coetzee, W.J.L. Electronic word of mouth in tourism and hospitality consumer behaviour: State of the art. Tour. Rev. 2020, 75, 637–661. [Google Scholar] [CrossRef]
  94. Chung, J.Y.; Buhalis, D. Information needs in online social networks. Inf. Technol. Tour. 2008, 10, 267–281. [Google Scholar] [CrossRef]
  95. Pelet, J.-É.; Lick, E.; Taieb, B. The internet of things in upscale hotels: Its impact on guests’ sensory experiences and behavior. Int. J. Contemp. Hosp. Manag. 2021, 33, 4035–4056. [Google Scholar] [CrossRef]
Figure 1. Theoretical Model.
Sustainability 14 03064 g001
Figure 2. Examples of 360-degree VT scenes experienced with a VR headset available on YouTube.
Sustainability 14 03064 g002
Figure 3. Communication used in the newsletter to launch the VT.
Sustainability 14 03064 g003
Figure 4. Results of the structural model.
Sustainability 14 03064 g004
Table 1. Sociodemographic characteristics of the sample.
Characteristic N%
GenderMale5539.3%
Female8560.7%
Age<2510.7%
25–3542.9%
36–503827.1%
51–657553.6%
>652215.7%
How often do you consume the Parmigiano Reggiano cheese?Everyday6848.6%
Usually (1–2 times/week)5942.1%
Sometimes (2–3 times/month)117.9%
Rarely (a few times/year)10.7%
Never10.7%
How many times have you visited a Parmigiano Reggiano dairy?Never9265.7%
1 time2719.3%
2 times64.3%
3 times53.6%
4 times107.1%
5 or more times--
Table 2. Constructs, items loading, and measures’ reliability.
Constructs Factor Loadingst-ValuesC.A. *
Intention to visit a Parmigiano Reggiano dairy (INT)
adapted from [21,38,72]
The likelihood that I’ll visit a Parmigiano Reggiano dairy in the future is high0.93640.5200.945
When possible, I’ll visit a Parmigiano Reggiano dairy 0.95191.028
I intend to visit a Parmigiano Reggiano dairy0.961107.931
VR tour satisfaction (SAT)
adapted from [67,73]
I am satisfied with the VR tour0.971141.3090.960
The VR tour met my expectations0.94980.150
I am pleased to have been on the VR tour0.90935.169
I am satisfied with the contents offered by the VR tour experience0.95089.567
Enjoyment (ENJ)
adapted from [1]
The VR tour was enjoyable0.955106.0160.949
The VR tour was captivating0.94372.355
The VR tour was interesting0.91239.330
The VR tour was funny0.91644.124
Ease of use (EOU)
adapted from [74]
The VR tour was easy to do0.94893.2440.944
It was easy to surf through the VR tour0.92034.979
I have found that the VR tour experience offers a lot of interaction flexibility0.90533.475
I had no difficulty using the VR tour0.92750.592
Presence (PRE)
adapted from [74]
During the VR tour, I had no external distractions0.86730.9330.916
During the VR tour, I felt in another world0.93681.509
It was strange to come back to reality after experiencing the VR tour0.89744.914
During the VR tour, I lost track of time0.87226.864
Immersion (IMM)
adapted from [45,53]
Not at all engrossed/Totally engrossed0.80915.6350.945
Not concentrated at all/Totally concentrated0.93138.354
Not at all absorbed/Totally absorbed0.94155.172
Not at all immersed/Totally immersed0.92840.783
Not focused at all/Totally focused0.91841.385
Note: * Cronbach’s alpha.
Table 3. Correlation Matrix and HTMT.
AVE *CR *INTSATENJEOUPREIMM
INT0.9010.9650.9490.7580.6330.6870.6540.287
SAT0.8930.9710.7220.9450.8110.7820.7130.453
ENJ0.8680.9630.6000.7750.9320.8750.8580.604
EOU0.8560.9600.6500.7460.8600.9250.8610.507
PRE0.7990.9410.6120.6740.8060.8110.8940.558
IMM0.8220.9580.2710.4340.5750.4840.5280.907
Note: * Average Variance Extracted (AVE); Composite Reliability (CR). Values in bold are the square root of the AVEs. Off-diagonal values are the correlations between constructs, while those above the diagonal are presented values for the HTMT ratio.
Table 4. Inner VIF, R square.
EnjoymentVR Tour
Satisfaction
IntentionR2 Adjusted
Immersion1.527
Presence 2.143
Ease-of-use2.0463.768
Enjoyment 3.768 0.788
VR tour satisfaction 1.0000.619
Intention 0.518
Table 5. Structural paths.
HypothesisPathβt-Valuef2Remarks
H1Presence → Enjoyment0.2553.730 ***0.100Supported
H2Immersion → Enjoyment0.1623.494 ***0.091Supported
H3Ease-of-use → Enjoyment0.5747.590 ***0.539Supported
H4Ease-of-use → VR tour satisfaction0.3042.131 **0.064Supported
H5Enjoyment → VR tour satisfaction0.5133.799 ***0.183Supported
H6VR tour satisfaction → Visit intention0.72212.713 ***0.987Supported
Indirect Pathsβt-Value
Presence → VR tour satisfaction0.1312.691 **
Presence → Visit intention0.0952.397 **
Immersion → VR tour satisfaction0.0833.213 ***
Immersion → Visit intention0.0603.121 ***
Ease-of-use → VR tour satisfaction0.2955.669 ***
Ease-of-use → Visit intention0.4334.615 ***
Enjoyment → Visit intention0.3714.157 ***
Note: *** p-value < 0.000, ** p-value < 0.05.
Publisher’s Note: MDPI stays neutral with regard to jurisdictional claims in published maps and institutional affiliations.

