
Spatializing Social Networking Analysis to Capture Local Innovation Flows towards Inclusive Transition


Abstract
:1. Introduction
2. Overview of Cluster-Based Analysis and Social Network Analysis

| Domain | Characteristics | Annotation | Definition | Equation | Note |
|---|---|---|---|---|---|
| Node | Degree | dv | the degree dv of a vertex or node v, in a network graph G = (V,E) counts number of edges in E incident upon v. | {d1,…,dNv} | Degree varies among Direct and Undirect networks based on In/Out degree distinction. |
| Node and Network | Closeness Centrality | CCl | The standard approach lets the centrality vary inversely with a measurement of the total distance of a vertex from all others where dist.(v,u) is the geodesic distance between the vertices u,v ∈ V. | Often, for comparison across graphs and with other centrality measures, this measure is normalized to lie in the interval [0, 1]. | |
| Node and Network | Eigenvector centrality | CEi | This definition of centrality seeks to capture the idea that the more central the vertex’s neighbourhood is, the more central the vertex itself is. | The convention is to report the absolute values of these entries, which will automatically lie between 0 and 1 by orthonormality of eigenvector. | |
| Network | Degree Distributions | fd | Given a graph G, define fd as the fraction of ver-tices v ∈ V with degree dv = d. The collection {fd}d ≥0 is called degree of distribution of G and is simply the histogram formed from the degree sequence, with bins of size one, centred on non-negative integer. | {fd}d ≥ 0 | The degree distribution provides a natural summary of the connectivity in the graph. In practice, degree distribution is arguably interesting as descriptors for large graphs. |
| Network | Density | den(G) | Cliques are subsets of fully cohesive vertices in the sense that edges connect all vertices within the subset. | The value of den(H) will lie between zero and one and provides a measure of how close H is to be a clique. |
3. Methodology
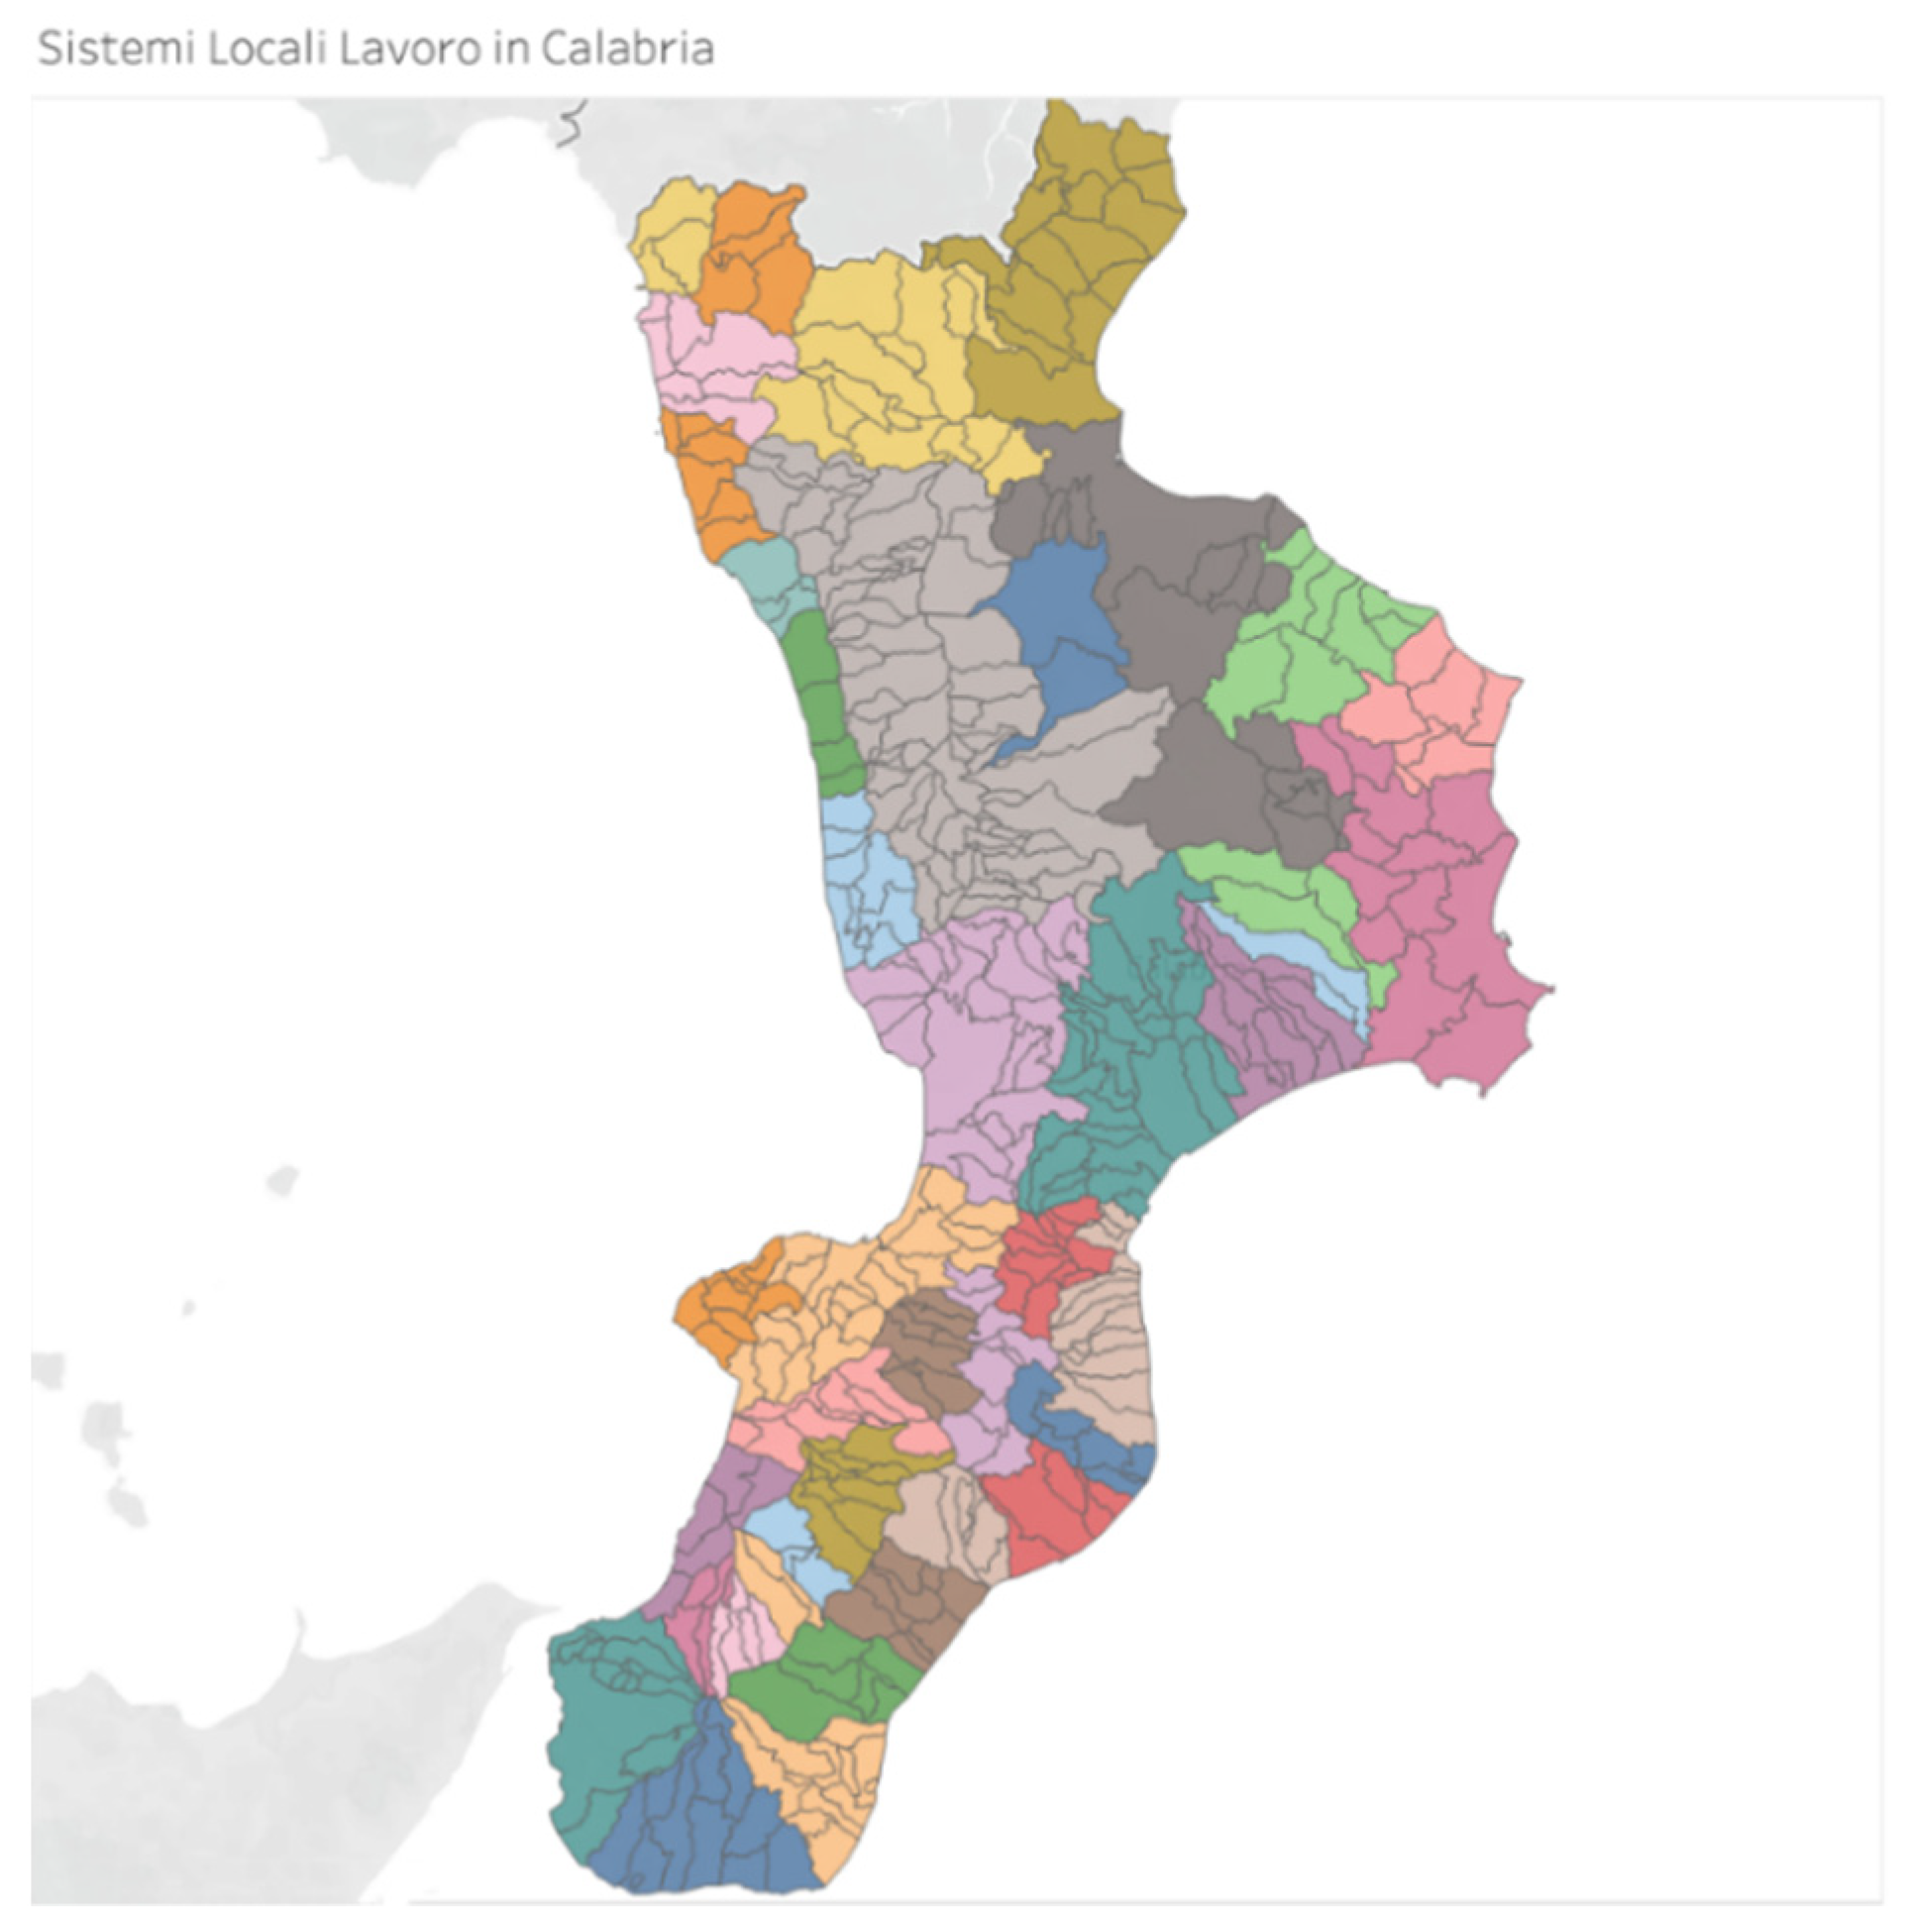
3.1. Area of Study
3.2. Methods and Materials
3.2.1. Forming Territorial Social Networking (TSN) of Calabria Region
3.2.2. Random Sampling TSN in Calabria
3.2.3. Education and Knowledge Creation Cluster TSN and Blue Growth TSN in Calabria
4. Results and Discussion
4.1. Forming Territorial Social Networking Analysis (TSNA)
4.2. Random Sampling TSNA in Calabria
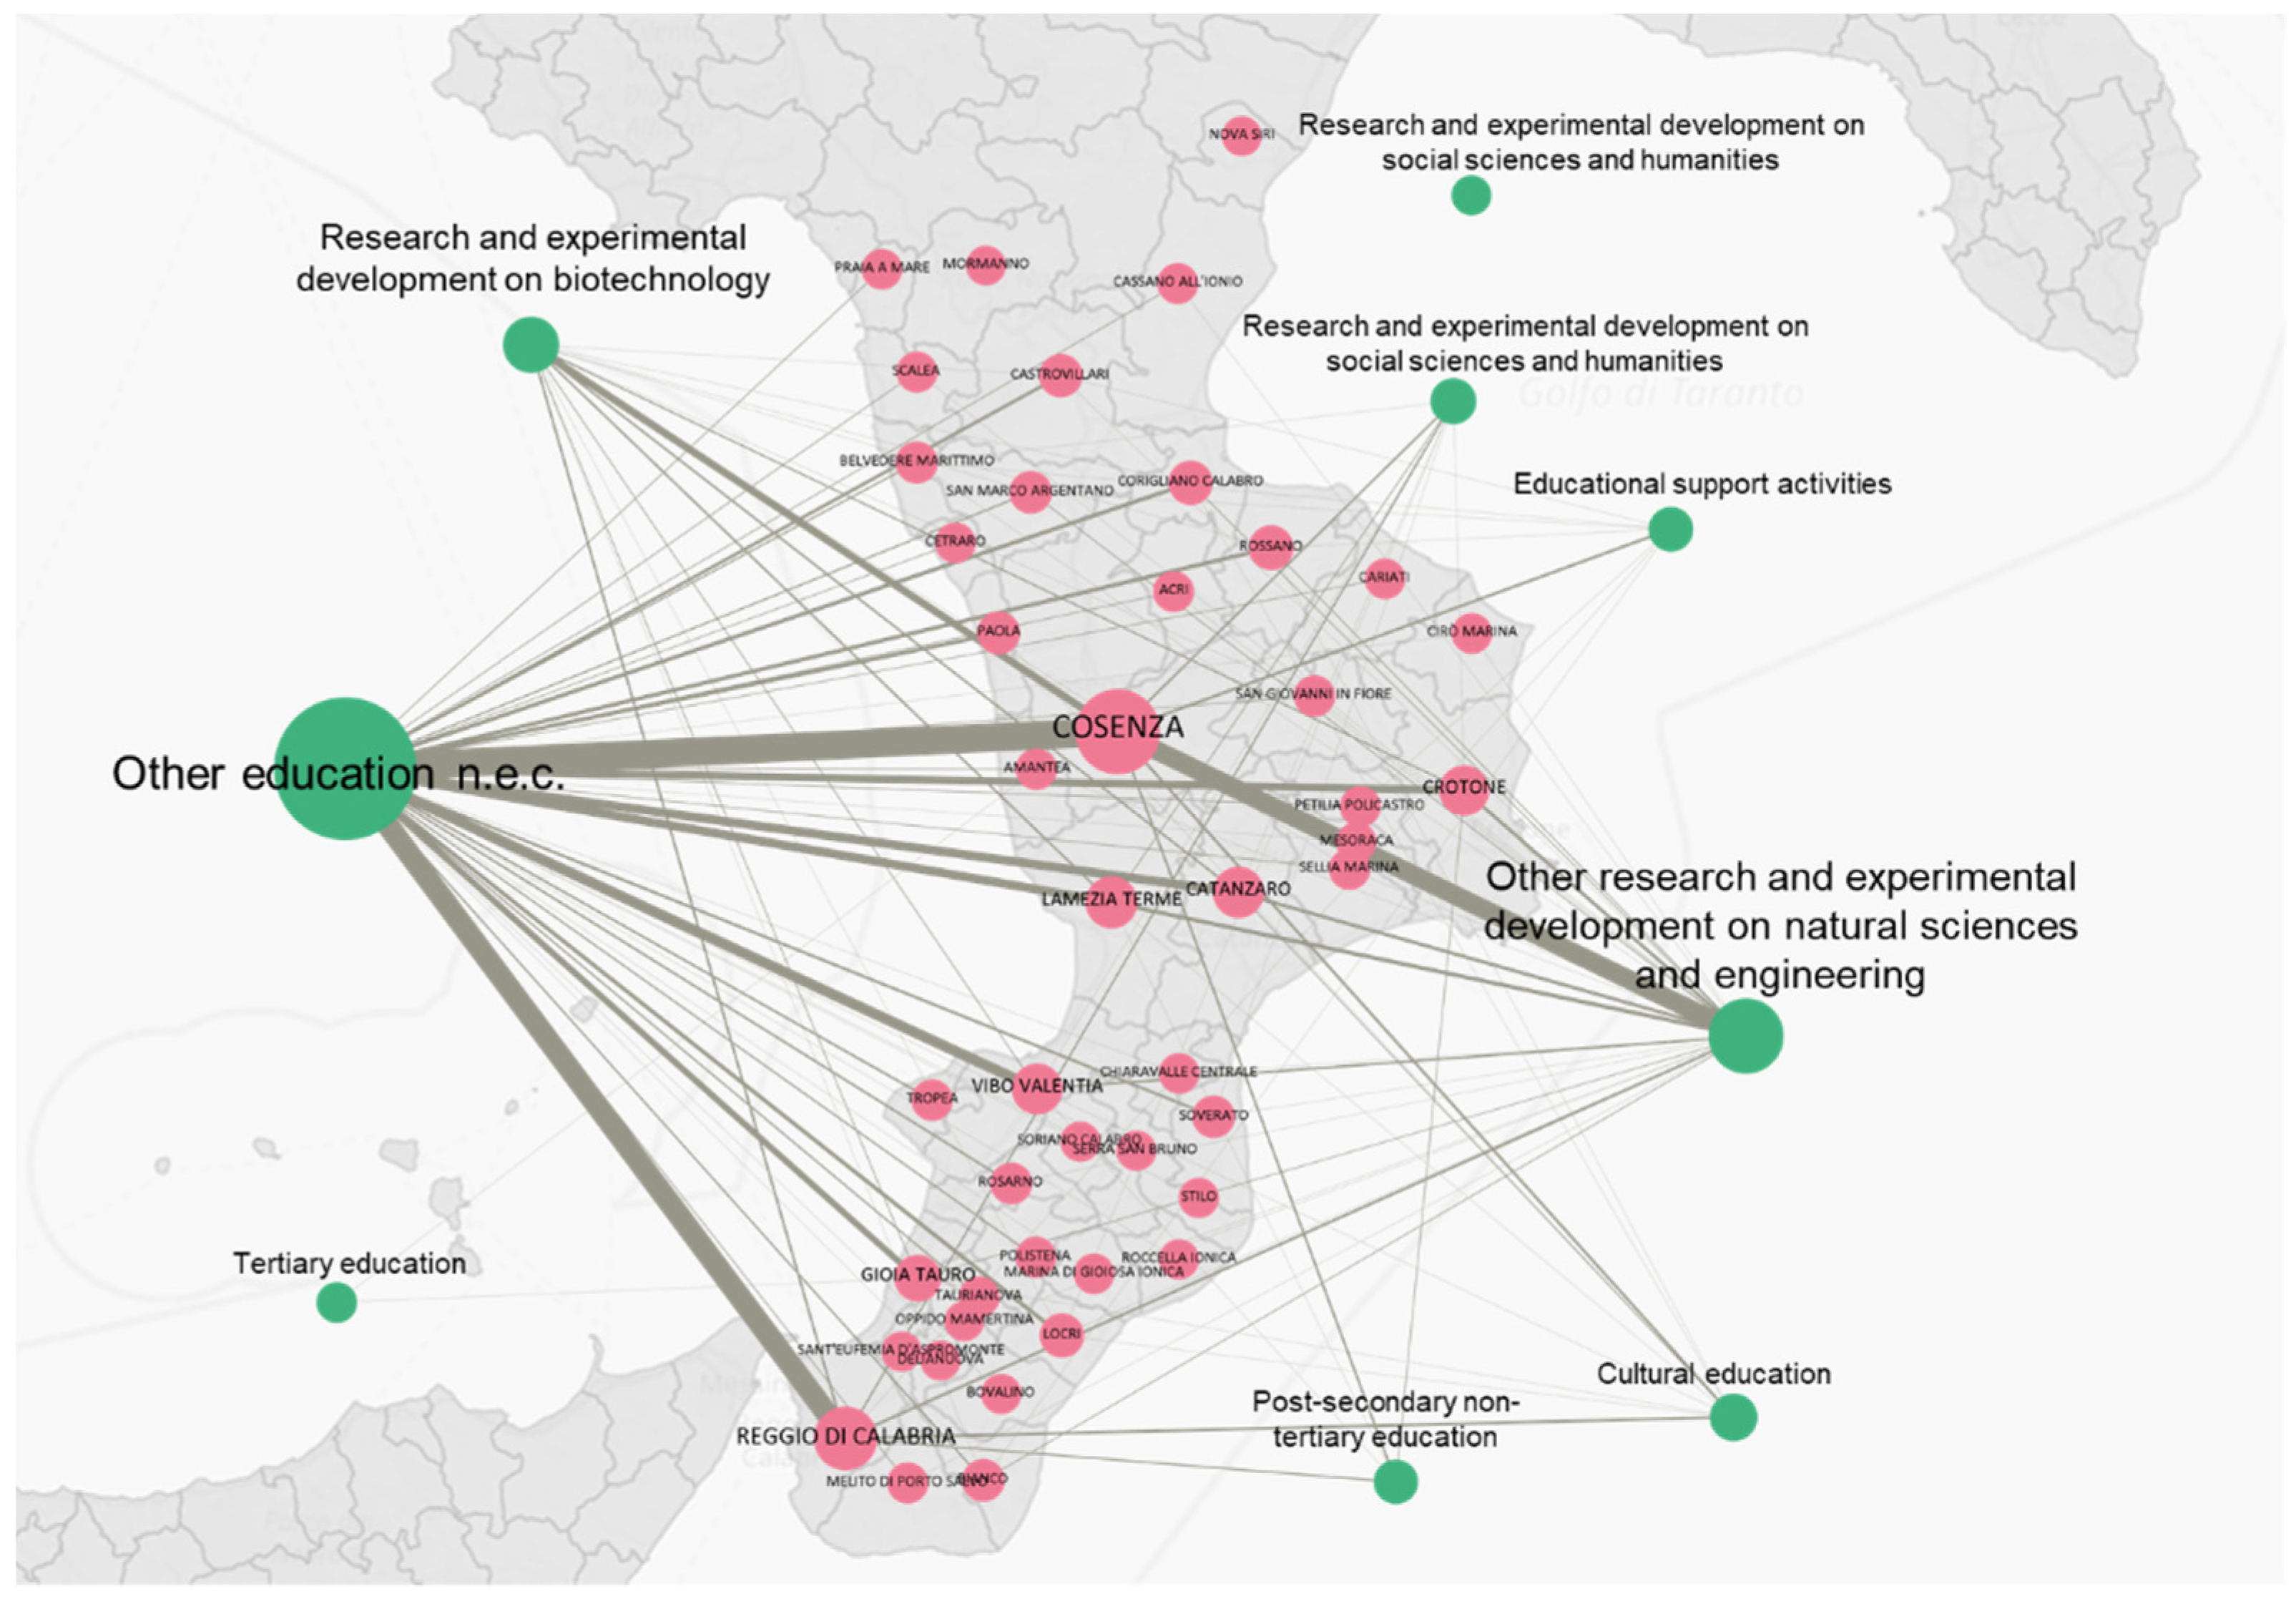
4.3. TSNA Education and Knowledge Creation Cluster
4.4. TSNA Education and Knowledge Creation Cluster
4.5. TSNA Emerging Industries: Blue Growth
5. Conclusions
Author Contributions
Funding
Institutional Review Board Statement
Informed Consent Statement
Data Availability Statement
Conflicts of Interest
References
- Balland, P.-A.; Boschma, R. Complementary interregional linkages and Smart Specialisation: An empirical study on European regions. Reg. Stud. 2021, 55, 1059–1070. [Google Scholar] [CrossRef]
- Balland, P.-A.; Boschma, R. Mapping the potentials of regions in Europe to contribute to new knowledge production in Industry 4.0 technologies. Reg. Stud. 2021, 55, 1652–1666. [Google Scholar] [CrossRef]
- Hidalgo, C.A.; Hausmann, R. The building blocks of economic complexity. Proc. Natl. Acad. Sci. USA 2009, 106, 10570–10575. [Google Scholar] [CrossRef] [Green Version]
- Hidalgo, C.A. Economic complexity theory and applications. Nat. Rev. Phys. 2021, 3, 92–113. [Google Scholar] [CrossRef]
- Balland, P.A.; Boschma, R.A.; Crespo, J.; Rigby, D.L. Smart specialization policy in the EU: Relatedness, knowledge complexity and regional diversification. Knowl. Complex. Reg. Diversif. 2017, 53, 1252–1268. [Google Scholar] [CrossRef] [Green Version]
- Loorbach, D.; Rotmans, J. The practice of transition management: Examples and lessons from four distinct cases. Futures 2010, 42, 237–246. [Google Scholar] [CrossRef]
- Davoudi, S.; Shaw, K.; Haider, L.J.; Quinlan, A.E.; Peterson, G.D.; Wilkinson, C.; Fünfgeld, H.; McEvoy, D.; Porter, L.; Davoudi, S. Resilience: A bridging concept or a dead end? “Reframing” resilience: Challenges for planning theory and practice interacting traps: Resilience assessment of a pasture management system in Northern Afghanistan urban resilience: What does it mean in planning practice? Resilience as a useful concept for climate change adaptation? The politics of resilience for planning: A cautionary note: Edited by Simin Davoudi and Libby Porter. Plan. Theory Pract. 2012, 13, 299–333. [Google Scholar]
- Davoudi, S.; Brooks, E.; Mehmood, A. Evolutionary resilience and strategies for climate adaptation. Plan. Pract. Res. 2013, 28, 307–322. [Google Scholar] [CrossRef] [Green Version]
- Garud, R.; Kumaraswamy, A.; Karnøe, P. Path dependence or path creation? J. Manag. Stud. 2010, 47, 760–774. [Google Scholar] [CrossRef] [Green Version]
- Simmie, J. Path dependence and new technological path creation in the Danish wind power industry. Eur. Plan. Stud. 2012, 20, 753–772. [Google Scholar] [CrossRef]
- Martín-Peña, M.-L.; Sánchez-López, J.-M.; Díaz-Garrido, E. Servitization and digitalization in manufacturing: The influence on firm performance. J. Bus. Ind. Mark. 2019, 35, 564–574. [Google Scholar] [CrossRef]
- Ardolino, M.; Rapaccini, M.; Saccani, N.; Gaiardelli, P.; Crespi, G.; Ruggeri, C. The role of digital technologies for the service transformation of industrial companies. Int. J. Prod. Res. 2018, 56, 2116–2132. [Google Scholar] [CrossRef]
- Hassankhani, M.; Alidadi, M.; Sharifi, A.; Azhdari, A. Smart City and Crisis Management: Lessons for the COVID-19 Pandemic. Int. J. Environ. Res. Public Health 2021, 18, 7736. [Google Scholar] [CrossRef]
- Vegesna: Remote Patient Monitoring via Non-Invasive—Google Scholar. Available online: https://scholar.google.com/scholar_lookup?journal=Telemed.+e-Health&title=Remote+patient+monitoring+via+non-invasive+digital+technologies:+a+systematic+review&author=A.+Vegesna&author=M.+Tran&author=M.+Angelaccio&author=S.+Arcona&volume=23&issue=1&publication_year=2017&pages=3-17& (accessed on 26 January 2022).
- Pan, C. Spain’s military uses DJI agricultural drones to spray disinfectant in fight against COVID-19. South China Morning Post Apr. 2020. Available online: https://www.scmp.com/tech/gear/article/3077945/spains-military-uses-dji-agricultural-drones-spray-disinfectant-fight (accessed on 5 January 2022).
- Cities Policy Responses—OECD. Available online: https://read.oecd-ilibrary.org/view/?ref=126_126769-yen45847kf&title=Coronavirus-COVID-19-Cities-Policy-Responses.%20Accessed%2010%20Nov%202021 (accessed on 10 December 2021).
- Söderholm, P. The green economy transition: The challenges of technological change for sustainability. Sustain. Earth 2020, 3, 1–11. [Google Scholar] [CrossRef]
- Pita, M.; Costa, J.; Moreira, A.C. Entrepreneurial Ecosystems and Entrepreneurial Initiative: Building a Multi-Country Taxonomy. Sustainability 2021, 13, 4065. [Google Scholar] [CrossRef]
- Conca, K.; Dabelko, G.D. (Eds.) Green Planet Blues: Critical Perspectives on Global Environmental Politics, 5th ed.; Routledge: New York, NY, USA, 2019; ISBN 978-0-429-49374-4. [Google Scholar]
- Regional Inequality in Europe: Evidence, Theory and Policy Implications|Journal of Economic Geography|Oxford Academic. Available online: https://academic.oup.com/joeg/article-abstract/19/2/273/4989323 (accessed on 11 December 2021).
- Pinheiro, F.L.; Balland, P.-A.; Boschma, R.; Hartmann, D. The Dark Side of the Geography of Innovation. Relatedness, Complexity, and Regional Inequality in Europe; Papers in Evolutionary Economic Geography (PEEG) 2202, Utrecht University, Department of Human Geography and Spatial Planning, Group Economic Geography, revised January 2022; Available online: https://ideas.repec.org/p/egu/wpaper/2202.html (accessed on 5 January 2022).
- OECD Local Economic and Employment Development (LEED). Monitoring the Transition to a Low-Carbon Economy. OECD LEED REPORT 2015, pp. 1–110. Available online: https://www.oecd.org/regional/Monitoring-Green-Transition-Final2.pdf (accessed on 29 November 2021).
- Eraydin, A. “Resilience Thinking” for Planning. In Resilience Thinking in Urban Planning; Springer: Berlin/Heidelberg, Germany, 2013; pp. 17–37. [Google Scholar]
- Geels, F.W.; Schot, J. Typology of sociotechnical transition pathways. Res. Policy 2007, 36, 399–417. [Google Scholar] [CrossRef]
- European Commission; Joint Research Centre. Annual Report 2019: Joint Research Centre, the European Commission’s Science and Knowledge Service; Publications Office: Luxembourg, 2020. [Google Scholar]
- Foray, D.; Goenaga, X. The goals of smart specialisation. S3 Policy Brief Ser. 2013, 1, S3. [Google Scholar]
- Porter, M.E. The competitive advantage of nations. Compet. Intell. Rev. 1990, 1, 14. [Google Scholar] [CrossRef]
- Maskell, P. Towards a knowledge-based theory of the geographical cluster. In Economy; Routledge: Abingdon, UK, 2017; pp. 377–399. [Google Scholar]
- Malmberg, A.; Maskell, P. Towards an explanation of regional specialization and industry agglomeration. Eur. Plan. Stud. 1997, 5, 25–41. [Google Scholar] [CrossRef]
- Delgado, M.; Porter, M.E.; Stern, S. Defining clusters of related industries. J. Econ. Geogr. 2016, 16, 1–38. [Google Scholar] [CrossRef]
- Porter, M.E. Clusters and the New Economics of Competition; Harvard Business Review: Boston, MA, USA, 1998; Volume 76. [Google Scholar]
- Ketels, C.; Protsiv, S. European Cluster Panorama. Center for Strategy and Competitiveness, Stockholm School of Economics. 2016. Available online: https://www.researchgate.net/publication/320372319_European_Cluster_Panorama_2016 (accessed on 5 January 2022).
- Tallman, S.; Jenkins, M.; Henry, N.; Pinch, S. Knowledge, clusters, and competitive advantage. Acad. Manag. Rev. 2004, 29, 258–271. [Google Scholar] [CrossRef]
- Hill, E.W.; Brennan, J.F. A methodology for identifying the drivers of industrial clusters: The foundation of regional competitive advantage. Econ. Dev. Q. 2000, 14, 65–96. [Google Scholar] [CrossRef]
- Nolan, C.; Morrison, E.; Kumar, I.; Galloway, H.; Cordes, S. Linking industry and occupation clusters in regional economic development. Econ. Dev. Q. 2011, 25, 26–35. [Google Scholar] [CrossRef]
- Purdue Center for Regional Development. Unlocking Rural Competitiveness: The Role of Regional Clusters. 2006. Available online: https://www.iatp.org/documents/unlocking-rural-competitiveness-the-role-of-regional-clusters (accessed on 5 January 2022).
- Bordei, C. Clusters–Sources of Economic Growth in Europe. SEA–Pract. Appl. Sci. 2016, 4, 141–148. [Google Scholar]
- Ortuzar, G. Industry clusters and economic development. Indiana Bus. Rev. 2015, 90, 7. [Google Scholar]
- Delgado, M.; Bryden, R.; Zyontz, S. Categorization of traded and local industries in the US economy. Retrieved May 2014, 8, 2019. [Google Scholar]
- Izsak, K.; Ketels, C.; Lämmer-Gamp, L.; Meier zu Köcker, G. Smart Guide to Cluster Policy, European Cluster Observatory, Brussels. 2016. Available online: https://ec.europa.eu/enterprise/initiatives/cluster/observatory/cluster-mapping-services/services/index_en.htm (accessed on 5 January 2022).
- European Observatory for Clusters and Industrial Change. Available online: https://ec.europa.eu/growth/industry/strategy/cluster-policy/observatory_en (accessed on 11 December 2021).
- Tajani, A.; Hahn, J. The Smart Guide to Service Innovation; Europäische Union: Brüssel, Belgium, 2012. [Google Scholar]
- Franco, S.; Murciego, A.; Salado, J.P.; Sisti, E.; Wilson, J. European Cluster Panorama 2021. In Leveraging Clusters for Resilient, Green and Digital Regional Economies; European Union: Brussels, Belgium, 2021; Volume 116. [Google Scholar]
- Chang, R.M.; Kauffman, R.J.; Kwon, Y. Understanding the paradigm shift to computational social science in the presence of big data. Decis. Support Syst. 2014, 63, 67–80. [Google Scholar] [CrossRef]
- O’Donoghue, D.; Gleave, B. A note on methods for measuring industrial agglomeration. Reg. Stud. 2004, 38, 419–427. [Google Scholar] [CrossRef]
- Cassi, L.; Morrison, A.; Ter Wal, A.L. The evolution of trade and scientific collaboration networks in the global wine sector: A longitudinal study using network analysis. Econ. Geogr. 2012, 88, 311–334. [Google Scholar] [CrossRef]
- Glueckler, J.; Doreian, P. Social network analysis and economic geography—Positional, evolutionary and multi-level approaches. J. Econ. Geogr. 2016, 16, 1123–1134. [Google Scholar]
- Searle, G.; Sigler, T.; Martinus, K. Firm evolution and cluster specialization: A social network analysis of resource industry change in two Australian cities. Reg. Stud. Reg. Sci. 2018, 5, 369–387. [Google Scholar] [CrossRef] [Green Version]
- Wasserman, S.; Faust, K. Social Network Analysis: Methods and Applications; Cambridge University Press: New York, NY, USA, 1994; pp. 28–78. [Google Scholar]
- Freeman, L.C. Centrality in social networks conceptual clarification. Soc. Netw. 1978, 1, 215–239. [Google Scholar] [CrossRef] [Green Version]
- Boschma, R. Proximity and innovation: A critical assessment. Reg. Stud. 2005, 39, 61–74. [Google Scholar] [CrossRef]
- Freeman, L.C. A set of measures of centrality based on betweenness. Sociometry 1977, 40, 35–41. [Google Scholar] [CrossRef]
- Ter Wal, A.L.; Boschma, R.A. Applying social network analysis in economic geography: Framing some key analytic issues. Ann. Reg. Sci. 2009, 43, 739–756. [Google Scholar] [CrossRef] [Green Version]
- Morrison, A. Gatekeepers of knowledge within industrial districts: Who they are, how they interact. Reg. Stud. 2008, 42, 817–835. [Google Scholar] [CrossRef] [Green Version]
- Giuliani, E.; Bell, M. The micro-determinants of meso-level learning and innovation: Evidence from a Chilean wine cluster. Res. Policy 2005, 34, 47–68. [Google Scholar] [CrossRef]
- Glückler, J. Economic geography and the evolution of networks. J. Econ. Geogr. 2007, 7, 619–634. [Google Scholar] [CrossRef] [Green Version]
- Alberti, F.G.; Belfanti, F.; Giusti, J.D. Knowledge exchange and innovation in clusters: A dynamic social network analysis. Ind. Innov. 2021, 28, 880–901. [Google Scholar] [CrossRef]
- Bevilacqua, C.; Pizzimenti, P.; Hamdy, N.; Mangiulli, F. From Deinstitutionalization to Community-Based Urban Development: Investigating Accessibility of Urban Systems in Calabria through Network Analytics. Sustainability 2022, 14, 1348. [Google Scholar] [CrossRef]
- Falcone, P.M.; Lopolito, A.; Sica, E. The networking dynamics of the Italian biofuel industry in time of crisis: Finding an effective instrument mix for fostering a sustainable energy transition. Energy Policy 2018, 112, 334–348. [Google Scholar] [CrossRef]
- Taylor, P.; Derudder, B. World City Network: A Global Urban Analysis, 2nd ed.; Routledge: London, UK; New York, NY, USA, 2015; Volume 2, pp. 28–35. [Google Scholar]
- Zhang, W.; Fang, C.; Zhou, L.; Zhu, J. Measuring megaregional structure in the Pearl River Delta by mobile phone signaling data: A complex network approach. Cities 2020, 104, 102809. [Google Scholar] [CrossRef]
- Huggins, R.; Johnston, A. Knowledge flow and inter-firm networks: The influence of network resources, spatial proximity and firm size. Entrep. Reg. Dev. 2010, 22, 457–484. [Google Scholar] [CrossRef]
- Lopolito, A.; Falcone, P.M.; Sica, E. The role of proximity in sustainability transitions: A technological niche evolution analysis. Res. Policy 2022, 51, 104464. [Google Scholar] [CrossRef]
- Beije, P.R.; Groenewegen, J. A network analysis of markets. J. Econ. Issues 1992, 26, 87–114. [Google Scholar] [CrossRef]
- Boschma, R.A.; Ter Wal, A.L. Knowledge networks and innovative performance in an industrial district: The case of a footwear district in the South of Italy. Ind. Innov. 2007, 14, 177–199. [Google Scholar] [CrossRef] [Green Version]
- Lentini, L.; Decortis, F. Space and places: When interacting with and in physical space becomes a meaningful experience. Pers. Ubiquitous Comput. 2010, 14, 407–415. [Google Scholar] [CrossRef] [Green Version]
- Castells, M. Grassrooting the space of flows. Urban Geogr. 1999, 20, 294–302. [Google Scholar] [CrossRef]
- Montana, J.; Reamer, A.; Henton, D.; Melville, J.; Walesh, K. Strategic Planning in the Technology-Driven World: A Guidebook for Innovation-Led Development; Economic Development Administration: Washington, DC, USA, 2001; Volume 1, pp. 13–28. [Google Scholar]
- Marshall, A. Distribution and exchange. Econ. J. 1898, 8, 37–59. [Google Scholar] [CrossRef]
- Marshall, A.; Marshall, M.P. The Economics of Industry; Macmillan and Company: New York, NY, USA, 1920. [Google Scholar]
- Casado-Díaz, J.M. Local labour market areas in Spain: A case study. Reg. Stud. 2000, 34, 843–856. [Google Scholar] [CrossRef]
- Suedekum, J.; Wolf, K.; Blien, U. Cultural diversity and local labour markets. Reg. Stud. 2014, 48, 173–191. [Google Scholar] [CrossRef]
- Rangone, M. I sistemi locali del lavoro come mercati locali del lavoro. Argom. Riv. Di Econ. Cult. E Ric. Soc. 2002, 6, 105–128. [Google Scholar]
- Casado-Díaz, J.M.; Taltavull de La Paz, P. An Exploration of the Contribution of Local Labour Market Areas to the Analysis of Regional Clusters. 2007; Volume 1, pp. 12–34. Available online: http://rua.ua.es/dspace/handle/10045/2670 (accessed on 5 January 2022).
- Kolaczyk, E.D.; Csárdi, G. Statistical Analysis of Network Data with R; Springer: Berlin/Heidelberg, Germany, 2014; Volume 65. [Google Scholar]
- D’italia, B. Eurosistema Economie Regionali. In L’economia della Calabria. Rapporto Annuale; Banca D’Italia: Roma, Italy, 2021; pp. 47–53. [Google Scholar]
- Jackson, M.O. Social and Economic Networks; Princeton University Press: Princeton, NJ, USA, 2010. [Google Scholar]
- Jacomy, M.; Venturini, T.; Heymann, S.; Bastian, M. ForceAtlas2, a continuous graph layout algorithm for handy network visualization designed for the Gephi software. PLoS ONE 2014, 9, e98679. [Google Scholar]
- Jackson, M.O. Average distance, diameter, and clustering in social networks with homophily. In Proceedings of the International Workshop on Internet and Network Economics; Springer: Berlin/Heidelberg, Germany, 2008; pp. 4–11. [Google Scholar]
- Tunkelang, D.; Sleator, D.; Heckbert, P.; Maggs, B. A Numerical Optimization Approach to General Graph Drawing; Carnegie-Mellon Universty, Department of Computer Science: Pittsburgh, PA, USA, 1999. [Google Scholar]
- Bastian, M.; Heymann, S.; Jacomy, M. Gephi: An open source software for exploring and manipulating networks. In Proceedings of the Third International AAAI Conference on Weblogs and Social Media, San Jose, CA, USA, 17–20 May 2009. [Google Scholar]
- Nešetril, J.; Ossona de Mendez, P. From sparse graphs to nowhere dense structures: Decompositions, independence, dualities and limits. In Proceedings of the European Congress of Mathematics; European Mathematical Society: Helsinki, Finland, 2010; pp. 135–165. [Google Scholar]


| LMA | Population in Thousands | LMA | Population in Thousands |
|---|---|---|---|
| Acri | 22.9 | Gioia Tauro | 58.9 |
| Amantea | 27.5 | Locri | 38.6 |
| Belvedere Marittimo | 21.9 | Marina Di Gioiosa Ionica | 20.3 |
| Cariati | 17.7 | Melito Di Porto Salvo | 34.2 |
| Cassano All’ionio | 49.3 | Oppido Mamertina | 7.2 |
| Castrovillari | 59.9 | Polistena | 43.5 |
| Cetraro | 13.7 | Reggio Di Calabria | 215.0 |
| Cosenza | 259.3 | Roccella Ionica | 18.2 |
| Mormanno | 16.7 | Rosarno | 29.2 |
| Paola | 31.3 | Sant’eufemia D’aspromonte | 7.4 |
| Praia A Mare | 13.5 | Stilo | 8.7 |
| San Giovanni In Fiore | 21.6 | Taurianova | 18.3 |
| San Marco Argentano | 30.7 | Cirò Marina | 25.8 |
| Scalea | 25.5 | Crotone | 119.0 |
| Catanzaro | 146.9 | Mesoraca | 6.6 |
| Chiaravalle Centrale | 14.8 | Petilia Policastro | 17.6 |
| Sellia Marina | 29.4 | Serra San Bruno | 15.1 |
| Soverato | 41.4 | Soriano Calabro | 12.5 |
| Lamezia Terme | 130.4 | Tropea | 22.2 |
| Bianco | 15.4 | Vibo Valentia | 101.9 |
| Bovalino | 26.2 | Corigliano-Rossano | 99.4 |
| Delianuova | 5.8 | Nova Siri | 13.7 |
| Cluster Name | ||
|---|---|---|
| Selection Period | Year (2012–2019) | |
| NUTS Level ISTAT (National Census Bureau) Italia (NUT 1) Region (NUT 2) Municipality (NUT 3) | Number of Establishment NACE 4 digits per cluster and LMA | Number of Employees NACE 4 digits per cluster and LMA |
| ATECO Code (2007) | Sectors NACE 4-digit aggregation based on Traded Cluster and Emerging Industries | |
| Italy | ||
| Southern Italy | ||
| Calabria | ||
| LMAs | ||
| Sectors | 1801 | 1802 | . | . | . | 1845 |
|---|---|---|---|---|---|---|
| 510 | 1 | 1 | . | . | . | 0 |
| 610 | 1 | 0 | . | . | . | 0 |
| 620 | 0 | 1 | . | . | . | 1 |
| . | . | . | . | . | . | . |
| . | . | . | . | . | . | . |
| . | . | . | . | . | . | . |
| 9329 | 0 | 0 | . | . | . | 0 |
| Cluster | NACE | Industry Name |
|---|---|---|
| Education and knowledge creation | 72.11 | Research and experimental development on biotechnology |
| 72.19 | Other research and experimental development on natural sciences and engineering | |
| 72.20 | Research and experimental development on social sciences and humanities | |
| 85.41 | Post-secondary non-tertiary education | |
| 85.42 | Tertiary education | |
| 85.52 | Cultural education | |
| 85.59 | Other education n.e.c. | |
| 85.60 | Educational support activities | |
| 94.12 | Activities of professional membership organisations |
| Emerging Industry | NACE | NACE Name |
|---|---|---|
| Blue growth industries | 03.11 | Marine fishing |
| 03.12 | Freshwater fishing | |
| 09.10 | Support activities for petroleum and natural gas extraction | |
| 10.20 | Processing and preserving of fish, crustaceans and molluscs | |
| 22.19 | Manufacture of other rubber products | |
| 25.99 | Manufacture of other fabricated metal products n.e.c. | |
| 28.11 | Manufacture of engines and turbines, except aircraft, vehicle and cycle engines | |
| 28.22 | Manufacture of lifting and handling equipment | |
| 30.11 | Building of ships and floating structures | |
| 30.12 | Building of pleasure and sporting boats | |
| 33.15 | Repair and maintenance of ships and boats | |
| 35.11 | Production of electricity | |
| 35.12 | Transmission of electricity | |
| 36.00 | Water collection, treatment and supply | |
| 42.91 | Construction of water projects | |
| 46.14 | Agents involved in the sale of machinery, industrial equipment, ships and aircraft | |
| 49.41 | Freight transport by road | |
| 50.10 | Sea and coastal passenger water transport | |
| 50.20 | Sea and coastal freight water transport | |
| 50.30 | Inland passenger water transport | |
| 50.40 | Inland freight water transport | |
| 52.10 | Warehousing and storage | |
| 52.22 | Service activities incidental to water transportation | |
| 52.23 | Service activities incidental to air transportation | |
| 52.24 | Cargo handling | |
| 52.29 | Other transportation support activities | |
| 71.12 | Engineering activities and related technical consultancy | |
| 71.20 | Technical testing and analysis | |
| 72.19 | Other research and experimental development on natural sciences and engineering | |
| 73.11 | Advertising agencies | |
| 77.32 | Renting and leasing of construction and civil engineering machinery and equipment | |
| 77.34 | Renting and leasing of water transport equipment | |
| 79.11 | Travel agency activities |
Publisher’s Note: MDPI stays neutral with regard to jurisdictional claims in published maps and institutional affiliations. |
© 2022 by the authors. Licensee MDPI, Basel, Switzerland. This article is an open access article distributed under the terms and conditions of the Creative Commons Attribution (CC BY) license (https://creativecommons.org/licenses/by/4.0/).
Share and Cite
Bevilacqua, C.; Sohrabi, P.; Hamdy, N. Spatializing Social Networking Analysis to Capture Local Innovation Flows towards Inclusive Transition. Sustainability 2022, 14, 3000. https://doi.org/10.3390/su14053000
Bevilacqua C, Sohrabi P, Hamdy N. Spatializing Social Networking Analysis to Capture Local Innovation Flows towards Inclusive Transition. Sustainability. 2022; 14(5):3000. https://doi.org/10.3390/su14053000
Chicago/Turabian StyleBevilacqua, Carmelina, Poya Sohrabi, and Nourhan Hamdy. 2022. "Spatializing Social Networking Analysis to Capture Local Innovation Flows towards Inclusive Transition" Sustainability 14, no. 5: 3000. https://doi.org/10.3390/su14053000
APA StyleBevilacqua, C., Sohrabi, P., & Hamdy, N. (2022). Spatializing Social Networking Analysis to Capture Local Innovation Flows towards Inclusive Transition. Sustainability, 14(5), 3000. https://doi.org/10.3390/su14053000