1. Introduction
The seriousness of ecological problems is emphasized by Brown, who states in his book: “ecological deficit threatens the long-term prospects of the economy, which is derived from the borrowing of future generations [
1]”. The eco-environmental problems of basins in China are particularly prominent. Different sections of a basin are endowed with different ecological and economic functions. The upstream and middle reaches need to conserve water sources for the downstream in order to maximize the sustainable development of ecological resources in the whole basin. Therefore, the upstream and middle reaches need to continue to carry out ecological treatment projects to limit the development of some industries that consume resources or discharge large pollutants, which will lose many economic development opportunities in the region, resulting in a serious imbalance of ecological, resource and economic interests in the upstream and downstream regions. The emergence of Ecological Compensation provides a way to solve this problem. Ecological Compensation makes it possible to realize the equivalence of responsibilities, rights and interests between the Indemnifying Party and the Indemnified Party. In order to obtain better ecological services, the Indemnifying Party will share the lost opportunity cost of economic development for the Indemnified Party in the form of compensation funds; meanwhile, in order to obtain timely and sufficient compensation funds, the Indemnified Party will more strictly and effectively implement control measures such as resource protection and environmental governance, so as to enhance the value of ecological services.
International research on Payment for Ecosystem Services (PES) is equivalent to what is referred to as Ecological Compensation research in China. International scholars have carried out many aspects of research from the perspective of theoretical basis, mechanism exploration and effect evaluation of Payment for Watershed Ecosystem Services (PWES). In recent years, more studies have focused on mechanism exploration and effect evaluation. Research on the mechanism of PWES mainly focuses on the compensation mode and compensation standard. Research on the compensation effect of PWES mainly evaluates the effect of existing compensation practice from the perspective of ecological resources or reflects the effect of compensation on individuals from the perspective of residents’ will. For example, studies on the compensation mode of PES by Cavalletti et al. have demonstrated that the government can provide support for the implementation of PES mechanism in the study [
2]. Gao et al. further analyzed the interaction mechanism of governments at all levels participating in compensation [
3], while Zilberman analyzed the advantages of the market in the implementation of the PES mechanism [
4]. In their study on the compensation standard of PES, O’Connell et al. believed that the compensation standard can be determined according to the qualified state of sectional water quality [
5]. Taye et al., based on the psychological perspective, investigated residents’ support for PES and estimated residents’ payment level, which can be a reference for compensation standard [
6]. Studying the compensation effect of PES, Meng et al. evaluated the compensation effect of the Xiaohong River Basin in China by constructing a comprehensive evaluation model covering social, economic and environmental aspects [
7]. Moreno-Sanchez et al. found that the mutual questioning of relevant subjects in the basin will directly affect the compensation efficiency by investigating the willingness to pay of residents in the basin [
8], while Nyongesa et al. evaluated the willingness to pay for ecosystem services of residents in Naivasha Lake Basin, Kenya, and analyzed various factors affecting the willingness to pay [
9]. It can be seen that foreign countries paid early attention to the ecosystem resources of small watersheds and explored the structure of market-oriented PES, providing a reference case for China.
China has also carried out many practices and made great progress in River Basin Ecological Compensation, such as Xin’an River, Chishui River, Dongjiang River, Yangtze River economic belt and other river basins. Chinese scholars have gradually paid attention to research on the practice of River Basin Ecological Compensation since 2008. The main focus is on the analysis of conceptual basis such as compensation objects, and the action mechanism such as compensation standards and methods of River Basin Ecological Compensation [
10,
11,
12], but the literature on the evaluation and analysis of policy ecological benefits, social benefits and economic benefits after the implementation of River Basin Ecological Compensation is relatively scarce. Some mainstream policy evaluation methods have been applied in the current research on the effect or performance evaluation of the River Basin Horizontal Ecological Compensation policy in China: Jing et al. evaluated the environmental effect of the Ecological Compensation policy in the Xin’an River Basin through the difference-in-differences (DID) model [
13]; Zhang et al. applied the DID method to test the economic effect of the Ecological Compensation policy in the Xin’an River Basin in the upstream area [
14]. Based on the county panel data of Anhui and Zhejiang in Xin’an River Basin, Liu et al. applied the DID method to test the policy effect of the Ecological Compensation pilot in Xin’an River Basin on the economic development of upstream and downstream areas of the basin [
15]. Chen et al. evaluated and analyzed the efficiency of government-led River Basin Ecological Compensation in the Yangtze River Economic Belt, based on the data envelopment analysis (DEA) model [
16], while Yang [
17] and Qu [
18], respectively, applied the DEA method to evaluate the performance of River Basin Ecological Compensation. Based on the IPAT series theory, Lin et al. comprehensively used the synthetic control method and regression discontinuity method to evaluate the environmental effect and sustainability of Ecological Compensation in the Yangtze River Delta [
19]. In addition, the commonly used method is to evaluate the performance of River Basin Ecological Compensation by establishing an evaluation index system [
20,
21].
The Shiyang River Basin is a typical ecologically fragile region of inland rivers in northwest China. It belongs to a typical small and medium-sized river basin where Ecological Compensation policy exploration started earlier but was formally piloted later. The series of Ecological Compensation policies implemented since the early 21st century have played a distinct role in promoting the improvement of the ecological and development of the economic environment in the Shiyang River Basin. In 2020, it initiated a pilot study on the horizontal Ecological Compensation mechanism in the upper, middle and lower parts. This is an important reference for the future innovation of the Ecological Compensation mechanism in the river basin to accurately evaluate the benefits of implemented river basin Ecological Compensation policies. It can be seen from previous studies on the evaluation of the effect of Ecological Compensation in river basins in the literature that, first of all, scholars mostly focused on large river basins where an Ecological Compensation pilot was carried out earlier, such as the Xin’an River and Yangtze River Economic Belt, while only a few scholars have paid attention to small and medium-sized river basins such as the Shiyang River Basin. Secondly, most research on small and medium-sized river basins adopt a qualitative analysis method to evaluate the effect of the Ecological Compensation policy on the ecological environment and pay less attention to its effect on the social economy. Moreover, there are many interfering factors in qualitative evaluation, so it is impossible to evaluate the policy benefits objectively. Thirdly, most research methods are used to establish an evaluation index system, and the application of a mainstream policy evaluation method is less and single, and the DID or DEA method is mostly used. In view of this, this study comprehensively applied DID and RDD methods to evaluate the economic effects of the series of Ecological Compensation policies in the Shiyang River Basin, in order to provide a practical reference for the innovation of the Ecological Compensation mechanism in the Shiyang River basin and other small and medium-sized basins.
2. Study Area
The Shiyang River Basin is a typical ecological fragile area where the water resources of inland rivers in northwest China have been over exploited, causing ecological deterioration. It is located in the east of the Hexi Corridor in Gansu Province, west of Wushaoling mountain and the north foot of Qilian Mountain, between 101°41′–104°16′ E and 36°29′–39°27′ N. From east to west it is composed of eight rivers: Dajing River, Gulang River and Huangyang River and many small ditches and rivers. The river’s source is mountain atmospheric precipitation and mountain ice and snow melt water, and the whole basin area is about 4.16 × 10⁴ km2. The administrative division includes nine counties (districts) of four cities in Gansu Province: Tianzhu, Gulang, Liangzhou and Minqin counties (districts) of Wuwei City; Yongchang and Jinchuan counties (districts) of Jinchang City; some areas of Sunan and Shandan counties of Zhangye City, specifically including Sunan Huangcheng district and the Shandan military horse farm and some areas of Jingtai County of Baiyin City. The eco-environmental problems in the Shiyang River Basin have become more and more obvious since the end of the 20th century. First, the expanding population in the basin has led to an increase in the demand for water and soil resources, followed by the continuous expansion of the area of artificial oasis, which has led to the excessive development and utilization of water resources in the basin. Second, water efficiency is low and the area suffers from serious water pollution. As a result, there is a shortage of quality water resources due to wasteful and inefficient water usage and ecological agriculture lags behind. Third, the long-term over utilization of resources has led to serious ecological degradation and frequent natural disasters in the basin. It has gradually become one of the most serious desertification areas in China.
As a typical medium and small basin with serious water resource problems and obvious ecosystem deterioration in China’s inland rivers, the ecological problems in the Shiyang River Basin have attracted significant attention from all parties. Since the beginning of the 21st century, Premier Wen has repeatedly stressed that “Minqin should never become the ‘second Lop Nur’”. Governments at all levels began to carry out ecological governance of the Shiyang River Basin through financial assistance and policy support; putting forward targeted policies and effectively implementing a series of Ecological Compensation policies. Among them, the more important basin-wide Ecological Compensation policies included: the implementation of the Water Resources Allocation Plan and the Implementation Plan of Water Regulation for 2005–2006 in Shiyang River Basin (abbreviation “Water Resources Allocation and Regulation Plan in Shiyang River Basin”), which was approved in 2005 and is mainly responsible for allocating water resources by reducing agricultural water use, reducing non-point source pollution, developing water-saving agriculture, eliminating high energy consumption and high pollution industrial production capacity, and developing the tertiary industry eco-tourism economy. In 2006, phase I of the Key Governance Planning Project in Shiyang River Basin was launched in advance (phase II was launched in 2011). In 2007, Key Governance Planning in Shiyang River Basin (with a total investment of 4.749 billion yuan) was officially approved and implemented. By increasing the proportion of the tertiary industry, improving the internal structure of the primary industry and appropriately reducing the proportion of the secondary industry, this policy aimed to develop water-saving and green agricultural economy, eco-tourism economy and other projects to promote the sustainable economic development of the Shiyang River Basin. At the same time, Gansu Province has successively issued policies and regulations such as Regulations of Gansu Province on Water Resources Management of Shiyang River Basin, Plan for Sand Prevention and Control and Ecological Restoration of Shiyang River Basin, and Management Measures for Surface Water Regulation of Shiyang River Basin, which provide support for the effective implementation of a series of Ecological Compensation policies. The effective implementation of a series of Ecological Compensation policies in the Shiyang River Basin has achieved initial results in its comprehensive management, which not only improved the ecological environment and water resources, but also optimized the economy of the basin. As shown in
Figure 1, the economy of the basin has basically maintained medium and high-speed growth since 2004, particularly there was an obvious inflection point in 2007. In addition, the proportion of three-industries structure in the basin was adjusted from 15:58:27 at the beginning of the governance period to 20:37:43 in 2019, and the economic structure was constantly optimized. However, whether this phenomenon is related to the implementation of a series of Ecological Compensation policies in Shiyang River Basin will be verified by designing a quasi-natural experiment and a quasi-random experiment.
3. Methodology and Data
The evaluation of policy effect can be regarded as an “average treatment effect (ATE)” problem, but individuals usually choose whether to participate according to the expected benefits of the policy. This problem can be overcome by random experiment or natural experiment. However, in economics, studying policy effects can only collect observational data, which cannot meet the expectations of random experiments. Additionally, as a result, the influence of unobservable factors can be controlled by the selection of unobservable variables. Common estimation methods include the instrumental variable method (IV), propensity score matching method (PSM), difference method (DID or DDD) and regression discontinuity design (RDD), etc. [
22]. By consulting relevant literature and comprehensively considering the implementation of a series of Ecological Compensation policies in the Shiyang River Basin, this study selected the difference-in-differences method and regression discontinuity design to jointly evaluate the economic effects of a series of Ecological Compensation policies in the Shiyang River Basin. The difference-in-differences method can identify the average economic effects of the Ecological Compensation policies. However, the estimated value may be biased due to other factors. Therefore, the regression discontinuity design was further used to estimate the local average economic effect of the Ecological Compensation policy, so as to further prove the reliability of the estimation results of the difference-in-differences method and the action mechanism of the economic effect of the policy.
3.1. Difference-in-Differences Method
The difference-in-differences method (DID) is an early estimation method used internationally to study policy impact, that is, the estimated value of the average intervention effect of the treatment group is obtained through non-parametric regression, such as local linear matching, and then the average intervention effect of the treatment group is estimated dynamically by applying this method to the data at two time points [
23].
The use of the DID method not only controls the heterogeneity between samples to a certain extent, but also controls other factors that are difficult to observe over time. Its dual control over the effect of time and the effect of policy implementation results in a more accurate estimation of the effect of policy implementation. The principle is that when
is assumed to be the external performance of different subjects,
and
represent the control group and the treatment group, respectively, while
and
represent the pre-implementation and post-implementation of the policy, respectively. Thus, after a certain treatment of the model, the net effect of the policy can be obtained as follows:
For the content of this study, the early start of phase I of the Key Governance Planning Project in the Shiyang River Basin provides an opportunity for this study to use the DID method to evaluate the economic effect of this Ecological Compensation policy. Before and after the implementation of the policy and whether it is interfered by the policy, the economic development of each county (district) in the Shiyang River Basin presents different states; through the DID method, the policy effects that change the economic development of the Shiyang River Basin can be separated.
3.1.1. Difference-in-Differences Model
Since the implementation of a series of Ecological Compensation policies in the Shiyang River Basin, the economic development level of the basin has been greatly improved. However, whether this phenomenon is affected by the series of Ecological Compensation policies or only due to the changes brought by time factors, it is necessary to separate the economic effects of the series of Ecological Compensation policies in the Shiyang River Basin and the DID model can achieve this goal. The series of Ecological Compensation policies in the Shiyang River Basin can be regarded as an exogenous environmental impact, which provides feasible conditions for using the DID model to estimate the economic effects of the series of Ecological Compensation policies in the Shiyang River Basin. First build the basic model (2):
Model (2) is a general DID model, which is more suitable for two-phase estimation. This purpose of this study is to investigate the impact of a series of Ecological Compensation policies on regional economic development in the Shiyang River Basin. In order to accurately evaluate the economic effect of those policies. To do this, it is necessary to separate the policy, time and natural factors affecting the economic development level of the basin. Therefore, this study uses the “quasi-natural experiment” nature of policy, combined with the changes in regional economic development before and after the implementation of those policies, to estimate the county panel data for multiple periods, and applies the more extensive DID model (3) to estimate the policy effect.
In Equation (3): take the economic development status of Shiyang River Basin as the explained variable. At the same time, two dummy variables are constructed: one is the policy time dummy variable , which is used to estimate the difference between the two time periods before and after the implementation of phase I of the Key Governance Planning Project in the Shiyang River Basin. In the year when this is started and in subsequent years, the value is 1, otherwise it is 0. The second is the policy grouping virtual variable , which is used to measure the difference between the treatment group and the control group under whether to implement phase I of the Key Governance Planning Project in the Shiyang River Basin. When the value is 1, it indicates the county (district) is the region participating in the policy; otherwise, the value is 0. (did) is the interaction term between the treatment group and the treatment period, which can estimate the real policy effect of phase I of the Key Governance Planning Project in Shiyang River Basin on the treatment group. The coefficient represents the net effect of the policy, which is significantly positive, indicating that phase I of the Key Governance Planning Project in the Shiyang River Basin has significantly improved local economic development. The other is inhibition: is the control variables; is a constant term; represents time fixed effect; is the regional fixed effect; is a random error term.
3.1.2. Variables Selection
Explained Variable. State of economic development (
PGDP): The purpose of implementing a series of Ecological Compensation policies in the Shiyang River Basin is not only to improve the ecological environment of the basin, but also to change the mode of production and life and improve the level of economic development as an important aspect of evaluating the implementation effect of the series of Ecological Compensation policies. Regarding common practices in academic circles, the state of economic development is measured by per capita GDP or regional GDP [
15]. In order to evaluate the economic effect of the series of Ecological Compensation policies in the Shiyang River Basin, this study selects per capita GDP as the explanatory variable.
Explanatory Variables: This study takes the early start of phase I of the Key Governance Planning Project in Shiyang River Basin as the policy impact, taking 2006 as the starting year of the policy; the time dummy variable () is introduced to identify the evolution difference in economic development level between the treatment group and the control group before and after this. The regional dummy variable () is used to identify whether phase I of the Key Governance Planning Project in Shiyang River Basin will have different effects on the treatment group and the control group. The interactive term () of time and region dummy variables is introduced at the same time and taking this as the core explanatory variable, this study tests the policy impact effect of phase I of the Key Governance Planning Project in Shiyang River Basin on regional economic development.
Control Variables. Household saving capacity (deposit): To some extent, residents’ saving capacity reflects the degree of regional economic development and economic agglomeration, which is related to regional economic development. On the one hand, an appropriate amount of deposit savings has brought support to the national economic construction, while on the other hand, excessive savings will reflect problems such as blocked economic development motivation, lack of market vitality and poor investment channels, which is detrimental to economic development. This study uses the balance of residents’ savings deposits to reflect the savings capacity of residents in the Shiyang River Basin.
Level of government support (government): Many previous studies have confirmed the positive impact of government financial support on regional economic development. Considering the integrity of available data and referring to existing research, public financial expenditure is selected to reflect the financial support of the local government for ecological governance.
Regional economic activity (fixedasset): Fixed asset investment is an important factor in county economic growth, which can reveal the activity and development vitality of regional economic development to a certain extent. Here, the amount of fixed asset investment is used to reflect the economic activity of counties (districts) in the Shiyang River Basin.
Labor input level (
labor): According to the research of previous scholars, the level of labor input is also the main influencing factor of regional economic development, reflecting the level of regional human resources [
14]. Considering the industrial structure characteristics of the main counties (districts) in the Shiyang River Basin, the number of rural employees is selected to evaluate this index.
Education level (education): Regional education level also affects the local economic development to a great extent, which is an important factor to improve labor productivity. Limited to the availability and integrity of data, the number of students in ordinary middle schools is selected to reflect the education level of counties (districts) in the Shiyang River Basin.
In addition, in view of the different units of the above variables and the poor comparability between indicators, in order to adjust the distribution trend of variables, reduce data fluctuation and eliminate the influence of variable heteroscedasticity and price index, this study takes the natural logarithm of the above relevant variables in the regression process of DID model.
3.1.3. Selection of Treatment Group and Control Group
Treatment Group: The actual scope of the series of Ecological Compensation policies in the Shiyang River Basin covers four cities and nine counties (districts) in the Shiyang River Basin, including Tianzhu, Gulang, Liangzhou and Minqin counties (districts) of Wuwei City; Yongchang and Jinchuan counties (districts) of Jinchang City; some areas of Sunan and Shandan counties of Zhangye City, specifically including Sunan Huangcheng district and Shandan military horse farm; and some areas of Jingtai County of Baiyin City. Considering that the county-level statistical data are more objective and comprehensive and can describe the policy effect more microcosmically, nine counties (districts) were selected as the treatment group.
Control Group: If the treatment group and the control group are adjacent or close to each other, each county (district) may be more in line with the parallel trend assumption of the DID model before the implementation of the policy. At the same time, the selection of the control group is not affected by the policy in principle and has a similar change trend with the treatment group before the implementation of the policy. Considering that the comparison within the same administrative region can more accurately reveal the real impact of a series of Ecological Compensation policies, the remaining counties (districts) of Jinchang, Baiyin, Wuwei and Zhangye City are selected as the control group, including eight counties (districts) of Baiyin, Pingchuan, Jingyuan, Huining, Ganzhou, Minle, Linze and Gaotai.
3.2. Regression Discontinuity Design
Regression discontinuity design (RDD) was first proposed by Thistlethwaite et al. to evaluate social planning alternatives [
24]. This has been widely applied in a variety of fields [
25,
26,
27,
28]. RDD is a quasi-experimental method used to evaluate local average treatment effect (LATE). Its basic idea is that there is a variable
, When
is less than a threshold (breakpoint)
, the individual does not accept the treatment; when
is greater than or equal to the threshold
, the individual accepts the treatment. The basic form of RDD is:
is called the running or assignment variable, and is the decentralization of , makes the breakpoint by move to . is to allow the graphs on both sides of the breakpoint to have different slopes. There is no systematic difference in other aspects for the samples near breakpoint c (), the jump of at the breakpoint can only be logically by , because at the breakpoint changes from 0 to 1. Thus, is LATE at breakpoint . There may be other control variables (covariates) influence . However, RDD is a quasi-random experimental method, that is, whether individuals enter the control group, or the treatment group is completely random, which is independent of these control variables.
The reason why RDD can study the economic effects at the beginning of the implementation of the series of Ecological Compensation policies in the Shiyang River Basin is that there is no systematic difference between counties (districts) in the Shiyang River Basin in the year before and in the year of policy implementation; the only difference is whether to participate in the policies. Therefore, the year before the policy implementation can be regarded as the control group, and the policy implementation and subsequent years can be regarded as the treatment group; that is, the policy implementation year is an accurate grouping of whether the samples participate in the policy implementation. This characteristic determines that the sharp regression discontinuity design (SRD) is adopted in this study.
3.2.1. Regression Discontinuity Model
Lee et al. said in their review on RDD that both parametric RDD and non-parametric RDD should be used in empirical research, and their results should be compared [
29].
In parametric RDD, the local polynomial regression is used in this study, and its basic form is as follows:
In Equation (5):
,
is polynomial degree. According to the RDD specification proposed by Lee et al.,
should try from 1 to 8–9 degree to select the model with the lowest AIC value [
29]. However, according to the latest empirical research from Gelman et al.,
can only be tried twice at most, because the estimated value of treatment effect is very sensitive to the degree selection of higher-order polynomials [
30]. Therefore, this study will follow the literature and will try
once and twice.
In non-parametric RDD, most researchers use local linear regression in non-parametric regression. To do this, we need to minimize the following objective functions:
In Equation (6): is the kernel function, which is used to weight the samples within the range of . The closer to the breakpoint, the higher the sample weight value. The more commonly used kernel functions in RDD are triangular kernel and uniform kernel.
Whether parametric RDD or non-parametric RDD, the size of bandwidth
h needs to be determined before estimation. In recent years, most RDD literatures have used the IK method [
31] and CCT method [
32] to determine the optimal bandwidth
h. This study will report the estimation results of these two methods at the same time [
33]. At the same time as there are different choices in the actual operation of RDD, such as the choice of kernel function, whether to include control variables, etc. The results of different choices in estimating
need to be reported later to ensure the robustness of the results. Through literature reading, the general specifications of parametric RDD and non-parametric RDD include the following.
Firstly, test the continuity of the density function of the running variable
on both sides of the breakpoint; that is the test assuming that the individual cannot accurately manipulate the running variable. RDD assumes that there is random grouping at the breakpoint, so the density function of the running variable should be continuous at the breakpoint, otherwise the results of RDD will be invalid [
34,
35]. Secondly, through local linear estimation and adding control variables, the significance and coefficient of each control variables and
of the whole model were observed; the first-order and second-order polynomials, with and without control variables are used for parameter RDD to test the robustness of the results. If there is not much difference between the two results, it means that the results are more robust. Thirdly, carry out non-parametric RDD, determine the optimal bandwidth value by the IK method and CCT method, and report different results whether to add covariates, use triangular kernel and uniform kernel and different bandwidth values to test the robustness of the results. If the results are not too different, it means that the results are relatively robust. In addition, we try to change the location of breakpoint for pseudo breakpoint test. If the estimation result is not significant, it proves the reliability of the real breakpoint estimation result; Test the continuity of the density function of covariates
on both sides of the breakpoint, that is the test of whether there is an obvious jump in the covariates on both sides of the breakpoint. If the jump occurs, the causal inference will lose its effectiveness.
3.2.2. Variables Selection
Explained variables: In order to achieve the goal of ecological resources management, a series of Ecological Compensation policies in the Shiyang River Basin require improving the tertiary industry economy and developing the green agricultural economy. Therefore, in order to further explore the economic effect and action mechanism of those policies, this study selected the economic development of tertiary industry (tertiary) and economic development of primary industry (primary) as the explanatory variables. Referring to existing studies, the proportion of the added value of the tertiary industry in GDP and the proportion of the added value of the primary industry in GDP can be used to reflect the regional economic development structure, which, respectively, reflects the contribution rate of the tertiary industry to the regional GDP and the contribution rate of the primary industry to the regional GDP. Therefore, these two indicators can be used to reflect the economic development of tertiary industry and economic development of primary industry in the Shiyang River Basin.
Explanatory variables: The series of Ecological Compensation policies in the Shiyang River Basin are selected as the core variable (). The value of participation policies (after policy implementation) is 1; the value of non-participating policies (before policy implementation) is 0.
The control variables: The standard RDD does not need to add covariates [
29]. However, in order to control the influence of other factors to enhance the effectiveness and reliability of the RDD model, covariates such as household saving capacity (
deposit), level of government support (
government), regional economic activity (
fixedasset), labor input level (
labor), education level (
education) are added to test the robustness of the estimation results. The above covariates are taken as natural logarithms in RDD estimation.
3.3. Data Source and Sample Description
The data used in this study mainly come from Gansu Statistical Yearbook, China Country Statistical Yearbook, the statistical yearbook and statistical bulletin of four cities in the Shiyang River Basin, and some data are derived from the statistical bulletin of 17 counties (districts) under the jurisdiction of the four cities. In these statistics, the complete data can be collected from 2000, and the latest data can be collected in 2019.
The samples selected in this study are counties (districts) under the jurisdiction of the four cities implementing a series of Ecological Compensation policies in the Shiyang River Basin. The treatment group of the DID model includes nine counties (districts) such as Jinchuan, and the control group includes eight counties (districts) such as Baiyin. The experimental samples of the RDD model are the nine counties (districts) implementing a series of Ecological Compensation policies in the Shiyang River Basin, that is, the treatment group of the DID model. Considering the integrity and comparability of the available data, the sample data used ranges from 2000 to 2019. The descriptive statistical results of the samples are shown in
Table 1.
The above research shows that the standard deviation (Std. Dev.) of the four indicators such as household saving capacity (deposit), level of government support (government), regional economic activity (fixedasset), and education level (education) in the treatment group of DID model are relatively large. If the differences caused by time changes are not considered, it reflects that there are large regional differences in the treatment group. The Std. Dev. of the two variables such as level of government support (government), regional economic activity (fixedasset) in the control group is relatively the largest. Without considering the time fluctuation, this means that there is a large regional absolute gap in the control group with large volatility. The Std. Dev. of the two variables of the economic development of tertiary industry (tertiary) and economic development of primary industry (primary) in the RDD model are high, which reflects that the regional absolute gap of this variable is large when the time factor is ignored.
4. Empirical Results and Analysis
4.1. Regression Results and Test of Difference-in-Differences Model
4.1.1. Benchmark Regression Results
The effect of series of Ecological Compensation policies on per capita GDP of the Shiyang River Basin is estimated based on the DID model, and the estimation results are shown in
Table 2. Column (1) of
Table 2 shows the estimation results of the basic DID model. There is no control time and regional effect, and the control variables are not considered. It can be seen that phase I of the Key Governance Planning Project in the Shiyang River Basin has significantly promoted the economic development of each county (district) in the treatment group. In column (2), the fixed effects of time and region are controlled, the policy effect is still significantly positive, and the goodness of fit is relatively good. In column (3), considering the influence of control variables such as household saving capacity (
deposit), level of government support (
government), regional economic activity (
fixedasset), labor input level (
labor), and education level (
education), without controlling time and regional effects, the policy effect is still significantly positive. In column (4), when considering the control variables and controlling the time and regional effects, the goodness of fit is relatively better, and the policy effect is still significant. The DID benchmark model of regression results show that taking into account the control variables or not and whether the fixed time region effects the estimation results prove that phase I of the Key Governance Planning Project in Shiyang River Basin significantly promotes the economic development of the treatment group of various counties (districts), and the “did” coefficients are positive, at least at the significance level of 5%, indicating that the test results are robust.
4.1.2. Time Effect Test of Policy
The basic regression results of the DID model can only reflect the effect of phase I of the Key Governance Planning Project in Shiyang River Basin on the economic development of the River Basin after implementation compared to before implementation but cannot reflect whether this effect has a sustained effect or lag effect. Considering that the full manifestation of the effect of Ecological Compensation policy needs a time buffer, an empirical test is carried out on the dynamic effect of this policy by referring to the methods in existing studies [
36,
37], extending model (3) to model (7):
In Equation (7), is a dummy variable of year. In this study, from the year after the implementation of the policy, is 1 in year and 0 in other years, so as to estimate whether the economic effect of phase I of the Key Governance Planning Project in Shiyang River Basin is persistent or lagging.
The test results are shown in
Table 3. Column (1) in
Table 3 shows the results without the fixed time effect and without adding control variables, column (2) shows the results with fixed time and regional effect and without adding control variables, and column (3) is the estimated results considering time and regional fixed effect and relevant influencing factors. It is found that under full consideration of the influence of time and regional effects, phase I of the Key Governance Planning Project in Shiyang River Basin shows a dynamic impact effect on the economic development of the basin. When the control variable is not added, the estimation coefficient of the interaction term is always positive and passes the significance test; when the control variable is added, the estimation coefficient of the interaction term is still positive but affected by relevant influencing factors; it did not pass the significance test. This means that there is no time lag effect on the impact of phase I of the Key Governance Planning Project in Shiyang River Basin on the economic development of the basin. The policy not only significantly promoted the economic development of the basin on the whole, but also the promotion effect is sustainable.
4.1.3. Robustness Test
In the practical application of the DID model in policy evaluation, there are some problems such as subjectivity and randomness in the selection of the control group. Therefore, the applicability of the DID model needs to be tested.
The parallel trend hypothesis (CT hypothesis) is the precondition that must be met when applying the DID model to evaluate the policy effect. Only when the explained variable in the treatment group and the control group has a parallel trend before the implementation of the policy can we ensure that the DID model estimates the causal effect of the policy. This study verifies the parallel trend hypothesis by two methods: mapping analysis and regression test to ensure the accuracy of the results.
As shown in
Figure 2, the per capita GDP of the treatment group and the control group from 2000 to 2019 is used for the parallel trend test. It can be seen that the per capita GDP trend of the treatment group and the control group is basically highly consistent before 2006, and the per capita GDP trend of the treatment group and the control group shows significant differences after 2006. The growth rate of per capita GDP in the treatment group was significantly faster than that of control group. Therefore, it can be seen that the treatment group and the control group meet the parallel trend assumption before policy implementation, which is in line with the premise of using the DID method for policy impact assessment.
Figure 2 preliminarily proves that the change trend of the economic development of the treatment group and the control group before the implementation of phase I of the Key Governance Planning Project in Shiyang River Basin is basically parallel. This study further uses a more rigorous empirical method to prove it. Referring to the practice of existing studies [
15,
36,
37], replace
(dummy variable in the experimental period) in model (3) with “year dummy variable”; that is, use model (7) for the test. Five interaction terms can be obtained by multiplying year dummy variables by
in the five years before the implementation of the policy, which can be used to capture the differences between the two groups in the years before policy implementation. If those interaction terms are not significant, then there is no significant difference, that is, the CT hypothesis is satisfied. The test results are shown in
Table 4. It can be seen that the five interaction terms before the implementation of the policy fully meet the insignificant requirements, so the CT hypothesis passes the test.
- 2.
Placebo Test
The DID model not only requires the treatment group and the control group to meet the parallel trend hypothesis before the implementation of the policy, but also needs to pay attention to whether there are other policy factors that may affect the trend change at the same time; that is, the change in the trend of the treatment group and the control group after the policy intervention may not really be caused by the policy, but by other policies coexisting in the same period. In this regard, in order to test the exclusivity of the action mechanism of the processing variable on the output variable, this study conducted a placebo test from three aspects: changing the implementation time of the policy, changing the samples of the treatment group and redefining the explained variables.
Random Hypothesis Test of Policy Intervention Time: The premise of regarding phase I of the Key Governance Planning Project in Shiyang River Basin as a quasi-natural experiment is that the policy impact is random; that is, before the impact of this policy, all parts of the basin had no expected benefits for the policy. Drawing on existing research [
36,
37], this study tests the expected effects of phase I of the Key Governance Planning Project in Shiyang River Basin. At the same time, considering that the DID model needs to compare the differences between the two time periods before and after policy implementation, this study adds
,
,
,
,
to model (3), respectively, to examine whether there were any expected effects in 2001–2005 in different parts of the Shiyang River basin. If the estimated coefficients of these variables are significant, it indicates that there were expected effects on the policy before its implementation. The test results are shown in
Table 5, and the coefficients of all variables are not significant. Therefore, it can be seen that before the impact of phase I of the Key Governance Planning Project in Shiyang River Basin, the counties (districts) of the treatment group did not impose any significant expected effects.
In addition, since the selection of the time point of policy implementation involves the intervention of many policies in the same period, if the impact of other policy effects is not excluded, the relevant results estimated by this study will be meaningless. Based on this, in order to increase the persuasion of the economic effect of phase I of the Key Governance Planning Project in Shiyang River Basin, this study further tests whether there is a similar impact by changing the policy intervention time. Since the 21st century, the ecological and environmental problems of the Shiyang River Basin have attracted great attention from all parties. The earliest concerns were of the governance of Minqin Oasis in the lower reaches and the vegetation restoration in the Qilian Mountain Area in the upper reaches. Therefore, the measures proposed are similar to phase I of the Key Governance Planning Project in Shiyang River Basin, as it provides adaptability for testing the exclusiveness of phase I of the Key Governance Planning Project in Shiyang River Basin. In view of this, this study advances the policy implementation time to 2002, and the estimation results are shown in column (1) of
Table 6. It can be found that when the policy implementation time is set to 2002, the estimation coefficient of the policy effect variable (
) is no longer significant, which further shows that the estimation results of this study are reliable.
Counterfactual Test: This test is used to change the samples of the treatment group for testing. Theoretically, phase I of the Key Governance Planning Project in Shiyang River Basin will not have a significant impact on the economic development of non-policy implementation areas. In this regard, this study carries out the counterfactual test by making up the treatment group, that is, selecting the known groups that are not affected by the policy as the pseudo treatment group for regression. The six counties (districts) such as Jingyuan County, Huining County, Ganzhou District, Minle County, Linze County and Gaotai County. If the policy effect is no longer significant, it proves that the above research results are stable. The estimated results are shown in column (2) of
Table 6. It can be seen that phase I of the Key Governance Planning Project in Shiyang River Basin has no significant policy impact on the six counties (districts), so it well supports the above conclusions and further improves their reliability.
Test of the Transformation Explained Variable: In this study, the explained variable per capita GDP is changed to regional GDP, which is the same index used to measure regional economic development. In the test of regional GDP, 2006 was still taken as the policy dividing point, and the policy impact and dynamic effect were tested at the same time. The test results are shown in (3) and (4) of
Table 6. The coefficient of
in the test results is still significantly positive. The test results support the conclusion that phase I of the Key Governance Planning Project in Shiyang River Basin significantly promotes the economic development of the basin to a certain extent, and the promotion effect is sustainable, indicating that the basic regression result is stable.
4.1.4. Research Summary
This section takes the early start of phase I of the Key Governance Planning Project in Shiyang River Basin in 2006 as a natural experiment, based on the panel data of 17 counties (districts) under the jurisdiction of four cities in the Shiyang River Basin from 2000 to 2019, the impact of phase I of the Key Governance Planning Project in Shiyang River Basin on the economic development of nine counties (districts) of the treatment group was estimated using the DID method. The conclusions are as follows: (1) Phase I of the Key Governance Planning Project in Shiyang River Basin significantly promoted the economic development level of the treatment group. The policy coefficients were significantly positive regardless of whether the control variables were considered or not and whether the time and region effects were fixed. (2) With full consideration of time and regional effects, the impact of phase I of the Key Governance Planning Project in Shiyang River Basin on the economic development of the treatment group did not have a time lag effect, showing a dynamic impact effect. (3) The robustness of the regression results was proved by the applicability test of the DID model (parallel trend test) and placebo test (change of policy implementation time, change of treatment group samples, redefine explained variables, etc.).
In order to improve the credibility of the estimation results of the DID model, this study further used the RDD model to estimate the average economic effect of the series of Ecological Compensation policies in the Shiyang River Basin, corroborate the estimation results of the DID model, and analyze the action mechanism of the economic effect of the series of Ecological Compensation policies in the Shiyang River Basin.
4.2. Estimation Results and Test of Regression Discontinuity Model
4.2.1. Time of Policy Effect
Through the data-driven method in the RDD model, the occurrence time of the short-term economic effect of the series of Ecological Compensation policies in the Shiyang River Basin is obtained. Whether the existence of the policy effect is judged through the graph, if the explained variable jumps at the breakpoint, it proves that the policy effect does exist, and then the occurrence time of the short-term effect is further analyzed.
In order to eliminate the influence of nonlinear factors as much as possible, quartic polynomial is selected for fitting in this study (
Figure 3).
Figure 3 (left) shows that on the left side of the breakpoint (2005), the economic development of the tertiary industry has an obvious downward jump: there is a clear breakpoint, which means that the implementation of the Water Resources Allocation and Regulation Plan in the Shiyang River Basin in 2005 has produced significant economic effects on the tertiary industry.
Figure 3 (right) shows that on the left side of the breakpoint (2007), the economic development of the primary industry has an obvious downward jump: there is a clear breakpoint, which means that the formal implementation of Key Governance Planning in Shiyang River Basin in 2007 has produced significant economic effects on the primary industry.
According to the changes in sample data on both sides of the breakpoint, the optimal bandwidth value was obtained using the IK method and CCT method (
Table 7) to determine the choice of the wide range of samples near the breakpoint, so as to estimate the time when the series of Ecological Compensation policies in the Shiyang River Basin had an economic effect on the tertiary and primary industry.
According to the results in
Table 7, the bandwidth value of the economic effects on the tertiary industry estimated by the IK method is h = 3.390, and the bandwidth value estimated by the CCT method is h = 3.426. Both methods estimate the samples of three years near the breakpoint (2005). In other words, the short-term economic effect of Water Resources Allocation and Regulation Plan in Shiyang River Basin on the tertiary industry occurred from 2005 to 2007. The bandwidth value of the economic effects on primary industry estimated by the IK method is h = 4.254, and the bandwidth value estimated by CCT method is h = 2.130. This is an estimate of the samples of 4 years and 2 years near the breakpoint (2007), respectively. In other words, the short-term economic effect of Key Governance Planning in Shiyang River Basin on the primary industry occurred from 2007 to 2010 or 2007 to 2008.
4.2.2. Estimation Results of Regression Discontinuity
Parameter local linear regression was performed on the sample data, each control variables was added, and the first-order polynomial was used. For the selection of the optimal bandwidth h, considering that the full manifestation of the effect of the Ecological Compensation policy needs a time buffer, in order to enhance the robustness of the estimation results, the IK method is used to estimate the results. The parameter estimation results are shown in
Table 8. It can be seen that the fitting effect after the model adjustment is basically good (0.5327, 0.3663) in the control variables; except for household saving capacity (deposit), labor input level (labor), and regional economic activity (fixedasset), other variables had a positive effect on the tertiary and primary industry economy. The coefficient D of tertiary is 7.6229 (
p < 0.01); that is, the economic effect on the tertiary industry at the beginning of the implementation of the Water Resources Allocation and Regulation Plan in Shiyang River Basin (2005–2007) is 7.6229. The coefficient D of primary is 2.0622 (
p < 0.01); that is, the economic effect on the primary industry at the beginning of the implementation of Key Governance Planning in Shiyang River Basin (2007–2010) is 2.0622.
In order to further estimate and test the impact of the series of Ecological Compensation policies in Shiyang River Basin on the tertiary and primary industries economy, the parameter local polynomial regression was carried out at the breakpoint and the influence of first-order or second-order and whether to add covariates was considered. The estimation results are shown in
Table 9. It can be seen that whether the control variables were added to the first-order polynomial model or not, there is a significant upward jump in the economic development of the tertiary and primary industries at the breakpoint, while the second-order polynomial model has no significant impact on the economic development of the tertiary and primary industries in the Shiyang River Basin.
- 2.
Non-Parametric Estimation
Taking the implementation year of the Water Resources Allocation and Regulation Plan in Shiyang River Basin and Key Governance Planning in Shiyang River Basin as the breakpoints, non-parametric local linear regression is carried out on the sample data, the IK method and CCT method are used to estimate the optimal bandwidth
h at the same time, and the triangular kernel (tri) and uniform kernel (uni) functions are used to estimate the short-term economic effects on the tertiary and primary industries of the series of Ecological Compensation policies in the Shiyang River Basin, as shown in
Table 10.
According to the empirical results in
Table 10, the results of estimating the economic effects on the tertiary and primary industries of the series of Ecological Compensation policies in the Shiyang River Basin by using the IK method or CCT method, triangular kernel or uniform kernel function are significant. The economic effects on the tertiary industry of Water Resources Allocation and Regulation Plan in Shiyang River Basin: When the IK method is used to determine the optimal bandwidth, the estimated value of this effect is 9.6616 in the triangular kernel and 9.4859 in the uniform kernel; When the optimal bandwidth is determined by the CCT method, the estimated value of this effect is 8.4399 in the triangular kernel and 8.3086 in the uniform kernel. The economic effects on the primary industry of Key Governance Planning in Shiyang River Basin: when the IK method is used to determine the optimal bandwidth, the estimated value of this effect is 4.3375 in the triangular kernel and 5.1077 in the uniform kernel; when the optimal bandwidth is determined by the CCT method, the estimated value of this effect is 3.9860 in the triangular kernel and 4.2805 in the uniform kernel.
Table 10 shows the estimation results under the optimal bandwidth without adding control variables. It can be seen that the economic effects on the tertiary and primary industries of the series of Ecological Compensation policies in the Shiyang River Basin are statistically significant, which is consistent with the results obtained from parameter estimation, and the difference between the estimated values of the same effect is small, which proves the robustness of the model.
4.2.3. Test of Regression Discontinuity Estimation Results
Different bandwidth tests: Considering the sample size and optimal bandwidth and referring to previous studies, the IK method manually selects the first year and the last year of the optimal bandwidth
h, and the CCT method selects 0.5-times and 1.5-times the optimal bandwidth to test whether the size of the bandwidth affects the non-parametric estimation (
Table 11).
Table 11 reports the estimation results of the economic effects on the tertiary and primary industries of the series of Ecological Compensation policies in the Shiyang River Basin, selecting different bandwidths by using the IK method and CCT method, triangular kernel and uniform kernel functions, respectively. It can be seen that the estimation results are basically significant. The economic effects on the tertiary industry of Water Resources Allocation and Regulation Plan in Shiyang River Basin: The fluctuation range of triangular kernel estimation of the IK method under different bandwidths is 8.0063–9.6616, and the fluctuation range of uniform kernel estimation under different bandwidths is 7.9115–9.4859. The fluctuation range of triangular kernel estimation of the CCT method under different bandwidths is 8.3032–8.5112, and the fluctuation range of uniform kernel estimation under different bandwidths is 7.9471–8.3086. The economic effects on the primary industry of Key Governance Planning in Shiyang River Basin: The fluctuation range of triangular kernel estimation of the IK method under different bandwidths is 2.0794–4.7268, and the fluctuation range of uniform kernel estimation under different bandwidths is 2.6914–5.1077. The fluctuation range of triangular kernel estimation of the CCT method under different bandwidths is 2.0794–3.9860, and the fluctuation range of uniform kernel estimation under different bandwidths is 2.0794–4.2805. This shows that the results of non-parametric estimation are robust under different bandwidths; that is, the estimated value of RDD passes the test of bandwidth dependence. It can be seen that the estimated economic effects on the tertiary and primary industries of the series of Ecological Compensation policies in the Shiyang River Basin obtained by different methods and different bandwidths fluctuate slightly. This shows that the results of non-parametric estimation are robust under different bandwidths; that is, the estimated value of RDD passes the test of bandwidth dependence.
Test with covariates: Add covariates to the RDD model to test the robustness of non-parametric estimation results (
Table 12).
Table 12 simultaneously reports the estimation results of the RDD model, selecting different bandwidths after adding covariates and using the IK method, CCT method, triangular kernel and uniform kernel functions, respectively. It can be seen from
Table 12 that the estimation results of the RDD model with covariates are significantly positive. Compared with the estimation results without covariates (
Table 11), the robustness of non-parametric estimation results is further proved.
Placebo test. Taking the series of Ecological Compensation policies in the Shiyang River Basin as false breakpoints before and after implementation, the estimated results are shown in
Table 13.
As can be seen from the estimation results in
Table 13, the economic effect of the tertiary industry of the policy is estimated by taking the pre implementation (c = −1.25) and post implementation (c = 1.25) of Water Resources Allocation and Regulation Plan in Shiyang River Basin (2005) as pseudo breakpoints, respectively, and the economic effect of the tertiary industry of the policy is estimated by taking the pre-implementation (c = −1.25) and post implementation (c = 1.25) of Key Governance Planning in Shiyang River Basin (2007) as pseudo breakpoints, respectively. The triangular kernel function estimation is selected by default, and the results of the IK method and CCT method are not significant. The results of the pseudo breakpoint test further confirm that the RDD model does not mix the influence of other unobserved factors, and the pseudo breakpoint test passes.
- 2.
Effectiveness Test
Continuity test of running variable: The running variable in this study are year variable; there is no human manipulation in the year, and the driving variable is the series of Ecological Compensation policies in the Shiyang River Basin. The approval and implementation of policy only has the problem of participation rather than human control.
Continuity test of covariates: If the covariates such as household saving capacity (deposit), level of government support (
government), regional economic activity (fixedasset), labor input level (labor) and education level (
education) jump at the breakpoint; that is, the estimated value of the covariates is significant and it is impossible to judge that the improvement of the tertiary and primary industry economy in the Shiyang River Basin was caused by the implementation of the series of Ecological Compensation policies, or because of other factors. The explained variable is replaced with covariates here to estimate the difference in covariates on both sides of the breakpoint. The results are shown in
Table 14.
Table 14 shows that the non-parametric estimation results of covariates are not significant; that is, the density distribution of all covariates is continuous at the breakpoint, meeting the assumption that covariates do not jump significantly at the breakpoint. It shows that in this study, only the implementation of the series of Ecological Compensation policies in Shiyang River Basin brought changes to the economic situation of the tertiary industry in 2005 and the primary industry in 2007. The validity test of RDD passed.
4.2.4. Research Summary
In this section, the formal implementation of Water Resources Allocation and Regulation Plan in Shiyang River Basin in 2005 and Key Governance Planning in Shiyang River Basin in 2007 are taken as quasi-random experiments. Based on the research conclusion of DID model that “phase I of the Key Governance Planning Project in the Shiyang River Basin significantly promoted the economic development level of the treatment group”. Using the method of sharp regression discontinuity design (SRD) model and the panel data of nine counties (districts) in the Shiyang River Basin from 2000 to 2019, this study further estimates the local effect and mechanism of the series of Ecological Compensation policies on its economic development. The conclusions are as follows: (1) The implementation of Water Resources Allocation and Regulation Plan in Shiyang River Basin in 2005 has produced a significant positive economic effect on the tertiary industry. This conclusion is tenable under both parametric regression discontinuity and non-parametric regression discontinuity and passed the placebo test (changing bandwidth, adding covariates, pseudo breakpoints) and effectiveness test of the RDD model. (2) In 2005, the short-term economic effect of Water Resources Allocation and Regulation Plan in Shiyang River Basin on the tertiary industry occurred from 2005 to 2007; the estimations are on the samples near the breakpoint (2005), both using the IK method and the CCT method. (3) The implementation of Key Governance Planning in Shiyang River Basin in 2007 produced a significant positive economic effect on the primary industry. That conclusion is tenable under both parametric regression discontinuity and non-parametric regression discontinuity, and passed the placebo test (changing bandwidth, adding covariates, pseudo breakpoints) and effectiveness test of the RDD model. (4) In 2007, the short-term economic effect of Key Governance Planning in Shiyang River Basin on the primary industry occurred from 2007 to 2010 (IK method) or 2007 to 2008 (CCT method). Considering that the full manifestation of the effect of the Ecological Compensation policy needs a time buffer, this study chose to estimate the samples of four years near the breakpoint (2007).
5. Discussion
This study examines the impact of a series of Ecological Compensation policies on regional economic development in the Shiyang River Basin, but the research content and purpose are not “only economic theory” or simply calculating the economic development of the Shiyang River Basin. Instead, this study tries to analyze the key problems of a series of Ecological Compensation policies on the economic development of the Shiyang River Basin, such as the influence, the extent of the influence, whether there is a dynamic impact and its trend, and the mechanism of the influence, to judge whether there is a good trend of transforming ecological benefits into economic benefits from the side. This study has made progress in the following aspects. First, from a research perspective, through the quantitative evaluation of the possible positive impact of a series of Ecological Compensation policies on the economic development of the Shiyang River Basin, it overcomes the one sidedness of previous studies, which mainly focus on the effect of ecological governance to a certain extent. Second, in terms of data selection, compared with provincial or municipal data, using county level data can better describe the regional differences caused by policies. In addition, the research sample covers two governance cycles of a series of Ecological Compensation policies in the Shiyang River Basin. The research is carried out based on a complete policy implementation interval, which is convenient for comparative analysis with the follow-up policy interval. Thirdly, in terms of research methods, the joint application of the DID model and RDD model can better solve the problems of endogenous and missing variables, and the conclusions are more accurate and reliable.
The DID model preliminarily identified that the series of Ecological Compensation policies in the Shiyang River Basin had a positive average economic effect on the basin’s economy, but there are some problems in the selection of a control group in the practical application of this method, such as subjectivity and randomness. For example, the control group selected in this study consisted of other counties (districts) that did not participate in the Ecological Compensation policies in the same administrative region as the treatment group. The eight counties (districts) themselves are not located in the Shiyang River Basin. There are differences in resource basis, ecological basis and economic basis between the treatment group and the control group, so the experimental results may be biased. The RDD model can further prove this and analyze the mechanism of the economic effects of Ecological Compensation policies in the Shiyang River Basin. The estimation results of the RDD model can be obtained as follows. The substantial progress of the tertiary industry economy in the basin in 2005 increased the economic development level of the basin in 2006, which gradually showed a significant gap in the control group. The conclusion of the DID model that “phase I of the Key Governance Planning Project in Shiyang River Basin significantly promoted the economic development level of the treatment group” was proved. At the same time, the development of a green agricultural economy in the basin in 2007 also made a great contribution to the continuous rise in the economic level of the basin, which supports the conclusion obtained by the DID model that “phase I of the Key Governance Planning Project in Shiyang River Basin shows a dynamic promoting effect on the economic development level of the treatment group”.
The estimation results of the DID model and RDD model jointly prove that the implementation of the series of Ecological Compensation policies in the Shiyang River Basin has an obvious promoting effect on the basin’s economy. Compared with other studies of the same type, on the one hand, compared with the research results of the “Effect of ecological governance in Shiyang River Basin”, for example, some studies have analyzed the improvement effect of ecological governance in the Shiyang River Basin on the ecological environment [
38]; some research results show that ecological governance in the Shiyang River Basin significantly optimized the level of green agriculture, promoted the increase in farmers’ income [
39] and improved agricultural output value [
11], while other studies have demonstrated the poverty reduction effect of the compensation fund for ecological governance in the Shiyang River Basin [
40]. It can be seen that the research conclusion and this research conclusion of the RDD models “series of Ecological Compensation policies in Shiyang River Basin had a significant positive economic effect on the tertiary and primary industries” are basically consistent. The significant improvement of tertiary industry economy mainly derived from the development of ecological tourism industry, which reflected the substantial improvement of ecological environment; The obvious progress of the primary industry economy mainly comes from the optimization of agricultural structure, which reflected the progress of green agriculture and promoted the increase in household income. On the other hand, compared with the research results of “economic effects of Ecological Compensation in river basins”, taking the Xin’an River Basin as an example, relevant studies have proved that the pilot of Ecological Compensation in Xin’an River Basin has a significant inhibitory effect on the upstream economy [
14], but has no significant impact on the downstream economy [
15]. It can be seen that the conclusions obtained from these studies are not similar to the DID model of this study that “the series of Ecological Compensation policies in the Shiyang River Basin have a significant promoting effect on the basin economy”. It can be concluded that the governance of the Xin’an River Basin mainly focuses on water environment pollution, which spans Anhui and Zhejiang, two provinces with high levels of economic development and high levels of secondary industry. Therefore, the implementation of an Ecological Compensation policy will limit the upstream economy of the basin. The main problem of the Shiyang River Basin is the shortage of water resources, and the whole basin mainly develops agricultural economy and tourism economy. Therefore, with the promotion of ecological governance, the basin economy will be gradually promoted.
Generally speaking, the implementation of the current series of Ecological Compensation policies in the Shiyang River Basin has a significant and sustainable role in promoting the economic development of the basin, which mainly comes from the contribution of the economic progress of the tertiary industry and the primary industry. How long the promotion effect can last and how to change, in addition to the impact of the series of Ecological Compensation policies on the optimization of industrial structure and the incentive degree of Eco-economic industry development in the Shiyang River Basin, is also controlled by the dynamic balance between the ecological governance benefits and economic development benefits of the series of Ecological Compensation policies in the Shiyang River Basin. In addition, it may be affected by household saving capacity (deposit), level of government support (government), regional economic activity (fixedasset), labor input level (labor), education level (education) and other factors. In this regard, the follow-up of this study will consider further study into the comprehensive performance of the implementation of the series of Ecological Compensation policies in the Shiyang River Basin and analyze the dynamic balance relationship between the ecological governance benefits and the economic development benefits generated by the policies. It is expected to provide a reference for the sustainable innovation of for the series of Ecological Compensation policies in the Shiyang River Basin.
6. Conclusions
In order to realize the sustainable development of ecological resources and social economy, the Shiyang River Basin has explored and implemented a series of Ecological Compensation policies since the early 21st century. This study uses a series of Ecological Compensation policies in the Shiyang River basin to design experiments, the counties (districts) under the jurisdiction of four cities in Shiyang River Basin affected by the policy are taken as experimental samples and the experimental period is 2000–2019. Taking the event that the early start of phase I of the Key Governance Planning Project in Shiyang River Basin in 2006 as a quasi-natural experiment, its impact on the economic development of nine counties (districts) in the treatment group is estimated by using the DID model. Taking the implementation of Water Resources Allocation and Regulation Plan in Shiyang River Basin in 2005 and Key Governance Planning in Shiyang River Basin in 2007 as quasi-random experiments, based on the research conclusions of the DID model, this study further estimates the local effect and mechanism of the Ecological Compensation policies on economic development in Shiyang River Basin. The conclusions are as follows: (1) The early start of phase I of the Key Governance Planning Project in Shiyang River Basin in 2006 has played a significant role in promoting the economic development of the basin, and the implementation of Ecological Compensation is the main reason for the significant improvement in the economic development of the basin. (2) phase I of the Key Governance Planning Project in Shiyang River Basin had a dynamic effect on the promotion of river basin economic development; that is, the economic effect of the policy is sustainable. (3) In 2005, the implementation of Water Resources Allocation and Regulation Plan in Shiyang River Basin produced a significant positive economic effect on the tertiary industry, and the local effect occurred from 2005 to 2007. (4) In 2007, the implementation of Key Governance Planning in Shiyang River Basin produced a significant positive economic effect on the primary industry, and the local effect occurred from 2007 to 2010. (5) The substantial progress of the tertiary industry economy in the basin in 2005 gradually led to a gap on the economic development level between the basin and the control group in 2006; the development of green agricultural economy in the basin further contributed to the continuous rise in the economic level of the basin in 2007, which is reflected in the significant positive and sustainable economic effects of a series of Ecological Compensation policies in the Shiyang River Basin. (6) Through the applicability test, effectiveness test and statistical test of the DID model and RDD model, the robustness and reliability of the above research conclusions are further proved.
The implementation of a series of policies on Ecological Compensation in the Shiyang River basin provides a useful attempt for the innovation of China’s river basin ecological governance mechanism. It combines river basin ecological governance with economic sustainable development, not only completing the ecological improvement, but also promoting the increase in farmers’ income, providing a reference for the exploration of watershed Ecological Compensation in China. From the experiences of implementing a series of Ecological Compensation policies in the Shiyang River Basin and the above research conclusions, we can obtain the following practical enlightenment: (1) The implementation of Water Resources Allocation and Regulation Plan in Shiyang River Basin mainly focuses on saving water resources and governing the Minqin Oasis. The main measures taken include reducing agricultural water use, reducing non-point source pollution, developing water-saving agriculture, limiting the secondary industry with high energy consumption and high pollution, and developing the tertiary industry eco-tourism economy. It can be seen that the development of the ecotourism economy can significantly improve the contribution rate of the tertiary industry to the regional economy, and the increase of the added value of the tertiary industry in GDP reflects the effectiveness of the supply side structural reform. (2) The promulgation and implementation of Key Governance Planning in Shiyang River Basin gradually focuses on the ecological governance of the whole basin and the balanced economic development of the upper, middle and lower reaches. The measures taken mainly include increasing the proportion of the tertiary industry, improving the internal structure of the primary industry, appropriately reducing the proportion of the secondary industry, and promoting the sustainable economic development of Shiyang River Basin through the development of water-saving green agricultural economy, eco-tourism economy and other projects. It can be seen that optimizing the agricultural production structure and developing green agricultural economy can effectively improve the contribution of the primary industry to the regional economy, and the increase in the added value of the primary industry in GDP shows that the agricultural economy has played an important role in stabilizing the “basic market”. (3) In order to realize the dynamic balance of ecological, social and economic benefits, river basin Ecological Compensation needs to optimize the industrial structure to the greatest extent. Specifically, in the Shiyang River Basin, it needs to develop green water-saving agriculture, limit high energy consumption and high pollution industries, vigorously support the eco-tourism industry to promote the sustainable economic development of Shiyang River Basin through the development of water-saving green agricultural economy, eco-tourism economy and other projects. (4) The DID model can effectively separate and estimate the ATE produced by the policy, however, the selection of the control group is artificially manipulated, which may lead to estimation bias. The RDD model is the closest method to the random experiment, but it only makes causal inference at the breakpoint. The conclusions may not be applied to other sample values; that is, its external effectiveness is weak. The joint use of the two methods can more accurately estimate the ATE of policy implementation.
Author Contributions
Conceptualization, H.S., F.S. and B.F.; methodology, H.S., J.F. and F.S.; software, J.F. and H.S.; validation, J.F., F.S. and B.F.; formal analysis, J.F., H.S. and F.S.; investigation, H.S., F.S and B.F.; resources, F.S and H.S.; data curation, J.F. and B.F.; writing—original draft preparation, J.F., H.S. and F.S.; writing—review and editing, F.S. and B.F. All authors have read and agreed to the published version of the manuscript.
Funding
This research was funded by the National Social Science Foundation of China under grant number 21BJY138; the National Natural Science Foundation of China under grant number 42171281; the Shaanxi Province Innovation Capability Support Program Soft Science Project under grant number 2022KRM045; the Shaanxi Province Science and Technology Innovation Team Project under grant number 2021TD-35; the National Natural Science Foundation of China under grant number 72034007; the ‘Thousand People Plan’ specially invited expert for young professionals in Shaanxi Province.
Institutional Review Board Statement
Not applicable.
Informed Consent Statement
Informed consent was obtained from all subjects involved in the study.
Data Availability Statement
Data is not publicly available, though the data may be made available on request from the corresponding author.
Conflicts of Interest
The authors declare no conflict of interest.
References
- Brown, L.R. Eco-Economy: Building an Economy for the Earth; Lin, Z.X.; Gan, S.Z., Translators; Oriental Publishing House: Beijing, China, 2002; p. 21. [Google Scholar]
- Cavalletti, B.; Di Fabio, C.; Lagomarsino, E.; Ramassa, P. Ecosystem accounting for marine protected areas: A proposed framework. Ecol. Econ. 2020, 173, 106623. [Google Scholar] [CrossRef]
- Gao, X.; Shen, J.Q.; He, W.J.; Sun, F.H.; Zhang, Z.F.; Guo, W.J.; Zhang, X.; Kong, Y. An evolutionary game analysis of governments’ decision-making behaviors and factors influencing watershed ecological compensation in China. J. Environ. Manag. 2019, 251, 109–121. [Google Scholar] [CrossRef]
- Zilberman, D. Payments for environmental services: Who gains and who loses? Agric. Resour. Econ. Upd. 2007, 11, 1–3. [Google Scholar]
- O’ Connell, C.; Billingsley, K. A Place at the Well: The Imperative for Farmer Inclusion in Water Conservation Policy Design. Cult. Agric. Food Environ. 2020, 42, 51–62. [Google Scholar] [CrossRef]
- Taye, F.A.; Vedel, S.E.; Jacobsen, J.B. Accounting for environmental attitude to explain variations in willingness to pay for forest ecosystem services using the new environmental paradigm. J. Environ. Econ. Polic. 2018, 7, 420–440. [Google Scholar] [CrossRef]
- Meng, Y.; Liu, M.; Guan, X.J.; Liu, W.K. Comprehensive evaluation of ecological compensation effect in the Xiaohong River Basin, China. Environ. Sci. Pollut. Res. 2019, 26, 7793–7803. [Google Scholar] [CrossRef]
- Moreno-Sanchez, R.; Maldonado, J.H.; Wunder, S.; Borda-Almanza, C. Heterogeneous users and willingness to pay in an ongoing payment for watershed protection initiative in the Colombian Andes. Ecol. Econ. 2012, 75, 126–134. [Google Scholar] [CrossRef]
- Nyongesa, J.M.; Bett, H.K.; Lagat, J.K.; Ayuya, O.I. Estimating farmers’ stated willingness to accept pay for ecosystem services: Case of Lake Naivasha watershed Payment for Ecosystem Services scheme-Kenya. Ecol. Process. 2016, 5, 15. [Google Scholar] [CrossRef] [Green Version]
- Liu, G.H.; Wen, Y.H.; Zhang, H.Y. Research on Ecological Compensation Mechanism of Guanting Reservoir Basin Based on Ecosystem Services. Resour. Sci. 2010, 32, 856–863. [Google Scholar]
- Li, J. Evaluation and Analysis of Ecological Compensation Effect in Shiyang River Basin. Master’s Thesis, Lanzhou University, Lanzhou, China, 2012. [Google Scholar]
- Dong, Z.F.; Li, H.X.; Qu, A.Y.; Ge, C.Z. Construction of ecological compensation mechanism in the Yangtze River Basin: Framework and focus. China Environ. Manag. 2017, 9, 60–64. [Google Scholar]
- Jing, S.W.; Zhang, J. Has the horizontal ecological compensation in the Xin’an River Basin reduced the intensity of water pollution? China Popul. Resour. Environ. 2018, 28, 152–159. [Google Scholar]
- Zhang, H.; Wu, S.; Zhang, Y.Y.; Yu, Y. Research on the impact of river basin ecological compensation policies on economic growth in compensated areas: Taking Huangshan City, Anhui Province as an example. Resour. Environ. Yangtze Basin 2019, 28, 2848–2856. [Google Scholar]
- Liu, C.; Zhang, N. Economic effects of horizontal ecological compensation in the Xin’an River Basin. China Environ. Sci. 2021, 41, 1940–1948. [Google Scholar]
- Chen, W.; Yu, X.H.; Xiong, X. Research on the measurement of Ecological Compensation Efficiency in Government-led Watersheds: Taking the main coastal cities in the Yangtze River Economic Belt as an example. Jianghuai Trib. 2018, 3, 43–50. [Google Scholar]
- Yang, Y. Research on Ecological Compensation in Songhua River Basin. Master’s Thesis, Harbin Institute of Technology, Harbin, China, 2019. [Google Scholar]
- Qu, C. Research on Ecological Compensation Performance Evaluation. Ph.D. Thesis, Graduate School of Chinese Academy of Social Sciences, Beijing, China, 2020. [Google Scholar]
- Lin, A.H.; Shen, L.S. Evaluation of the effect of ecological compensation mechanism in the Yangtze River Delta region. China Popul. Resour. Environ. 2020, 30, 149–156. [Google Scholar]
- Wang, H.J.; Bi, F.F.; Dong, Z.F. Evaluation of ecological compensation policy performance in Xin’an River basin based on AHP-fuzzy comprehensive evaluation method. Acta. Ecol. Sin. 2020, 40, 7493–7506. [Google Scholar]
- Peng, Y.T. Comprehensive benefit evaluation of ecological compensation in water source areas of Xin’an River Basin. Jianghuai Trib. 2020, 5, 75–82. [Google Scholar]
- Imbens, G.W.; Wooldridge, J.M. Recent Developments in the Econometrics of Program Evaluation. J. Econ. Lit. 2009, 47, 5–86. [Google Scholar] [CrossRef] [Green Version]
- Guo, S.Y. Propensity Value Analysis: Statistical Methods and Applications; Chongqing University Press: Chongqing, China, 2012; p. 27. [Google Scholar]
- Thistlethwaite, D.L.; Campbell, D.T. Regression-discontinuity analysis: An alternative to the ex post facto experiment. J. Educ. Psychol. 1960, 51, 309–317. [Google Scholar] [CrossRef] [Green Version]
- Zhang, C.C.; John, G.; Zhao, Y.H. Evaluation of New Rural Social Endowment Insurance Policy Effect: Income, Poverty, Consumption, Subjective Welfare and Labor Supply. China Econ. Q. 2015, 14, 203–230. [Google Scholar]
- Zou, H.; Yu, K.Z. Retirement and Urban Household Consumption: Empirical Evidence Based on Breakpoint Regression Design. Econ. Res. J. 2015, 50, 124–139. [Google Scholar]
- Liu, S.L.; Hu, A.G.; Zhang, X.M. More children and more happiness? The influence of the number of children on the mental status of the elderly in rural areas. China Rural. Econ. 2020, 8, 69–84. [Google Scholar]
- Shang, H.Y.; Kou, Y.; Su, F.; Song, N.N.; Mao, S.X. The Policy Effect, Spatial Heterogeneity, and Spillover Effect of Land System Pilots. Sustainability 2021, 13, 11818. [Google Scholar] [CrossRef]
- Lee, D.S.; Moretti, E.; Butler, M.J. Do Voters Affect or Elect Policies? Evidence from the U. S. House. Q. J. Econ. 2004, 119, 807–859. [Google Scholar] [CrossRef]
- Gelman, A.; Imbens, G. Why High-Order Polynomials Should Not Be Used in Regression Discontinuity Designs. J. Bus. Econ. Stat. 2019, 37, 447–456. [Google Scholar] [CrossRef]
- Imbens, G.; Kalyanaraman, K. Optimal bandwidth choice for the regression discontinuity estimator. Rev. Econ. Stud. 2012, 79, 933–959. [Google Scholar] [CrossRef]
- Calonico, S.; Cattaneo, M.D.; Titiunik, R. Robust nonparametric confidence intervals for regression-discontinuity designs. Econom. 2014, 82, 2295–2326. [Google Scholar] [CrossRef] [Green Version]
- Xie, Q.; Xue, X.L.; Fu, M.W. Research review on the application of breakpoint regression design method. Rev. Econ. Manag. 2019, 35, 69–79. [Google Scholar]
- McCrary, J. Manipulation of the running variable in the regression discontinuity design: A density test. J. Econom. 2007, 142, 698–714. [Google Scholar] [CrossRef] [Green Version]
- Imbens, G.W.; Lemieux, T. Regression discontinuity designs: A guide to practice. J. Econom. 2007, 142, 615–635. [Google Scholar] [CrossRef] [Green Version]
- Jiang, L.D.; Lu, Y. Does Intensified Market Competition Promote State-Owned Enterprises to Increase Leverage. Chin Ind. Econ. 2018, 11, 155–173. [Google Scholar]
- Ren, S.G.; Zheng, J.J.; Liu, D.H.; Chen, X.H. Does the emission trading mechanism improve the total factor productivity of enterprises: Evidence from Chinese Listed Companies. China Ind. Econ. 2019, 5, 5–23. [Google Scholar]
- Jiang, Y.; Yang, J.S.; Zhao, F.J.; Hong, K.; Liu, X.N.; Hao, Y.Y. Evaluation of the effect of comprehensive management in shiyang River Basin from the perspective of temporal and spatial change of vegetation coverage in Minqin Basin. J. Yunnan Agric. Univ. Nat. Sci. 2020, 35, 726–735. [Google Scholar]
- Hao, J.N.; Chang, G.Y.; Zhang, X.; Gao, Z.Y. Evaluation of agricultural green development level before and after the shiyang River Basin governance. J. Lanzhou Univ. Nat. Sci. 2021, 57, 109–116. [Google Scholar]
- Shang, H.Y.; Song, N.N.; Ding, Y. Poverty reduction effect of ecological cash compensation. Stat. Decis. 2018, 34, 90–93. [Google Scholar]
| Publisher’s Note: MDPI stays neutral with regard to jurisdictional claims in published maps and institutional affiliations. |
© 2022 by the authors. Licensee MDPI, Basel, Switzerland. This article is an open access article distributed under the terms and conditions of the Creative Commons Attribution (CC BY) license (https://creativecommons.org/licenses/by/4.0/).


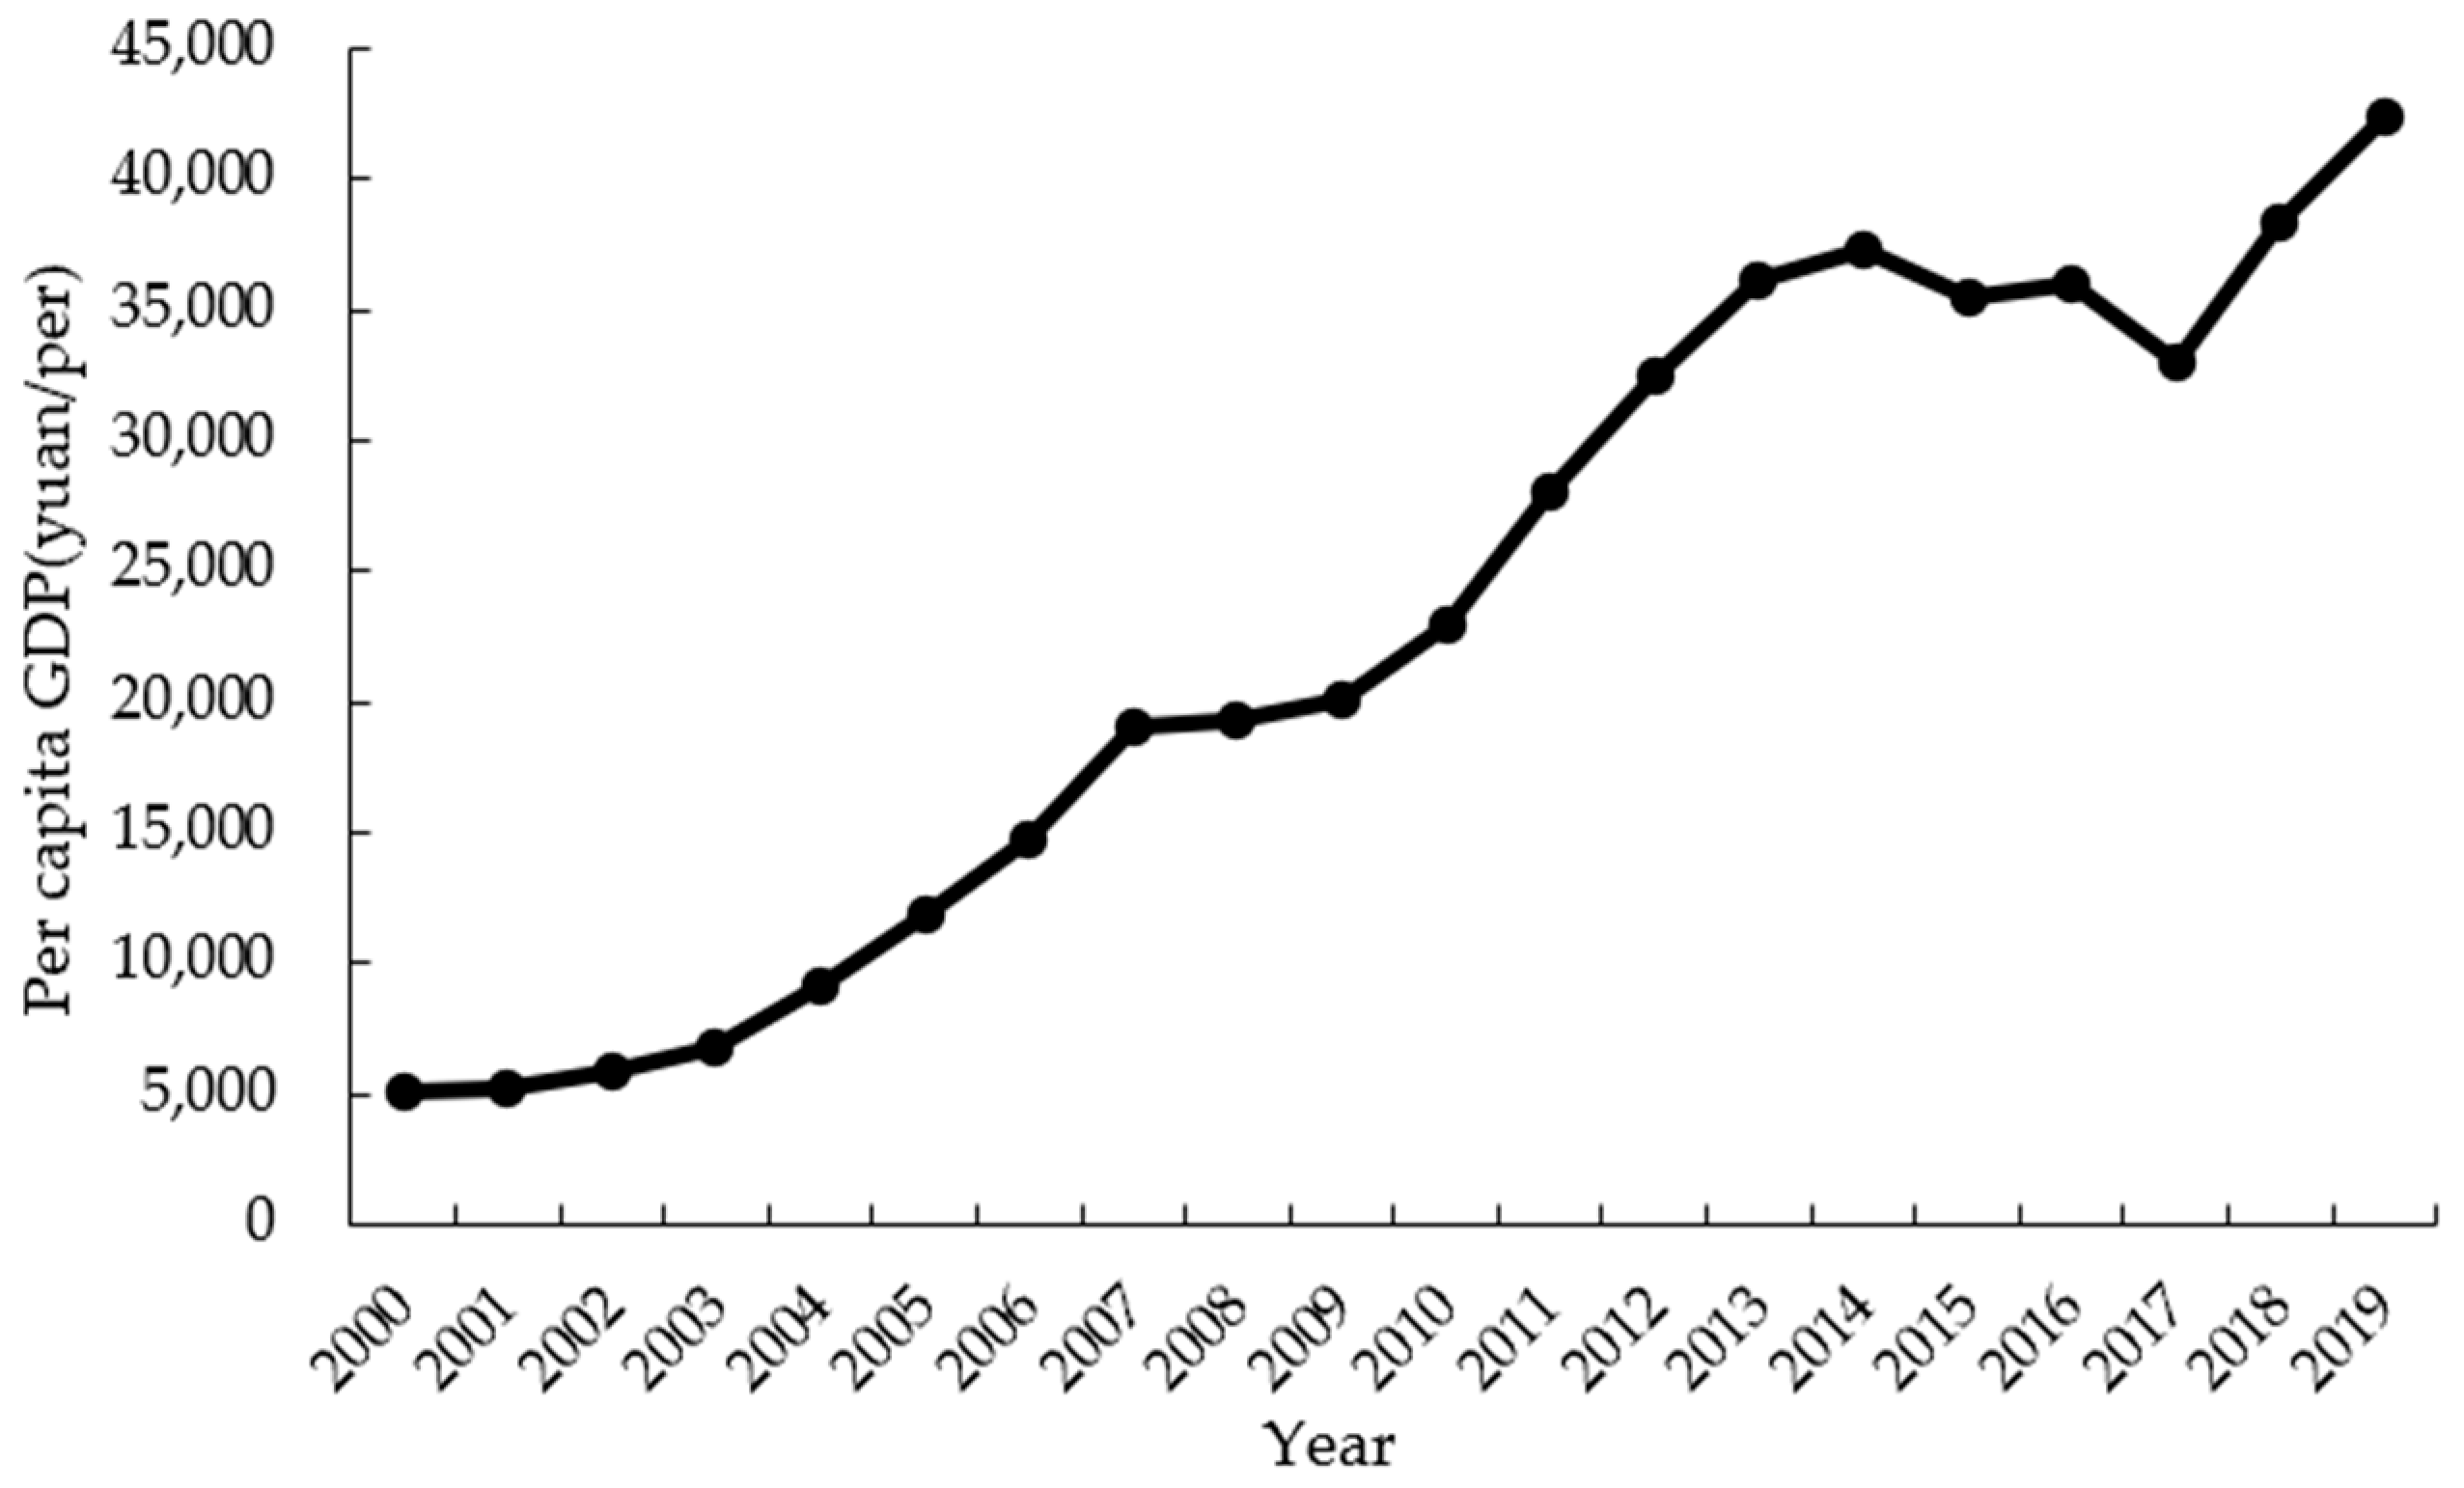
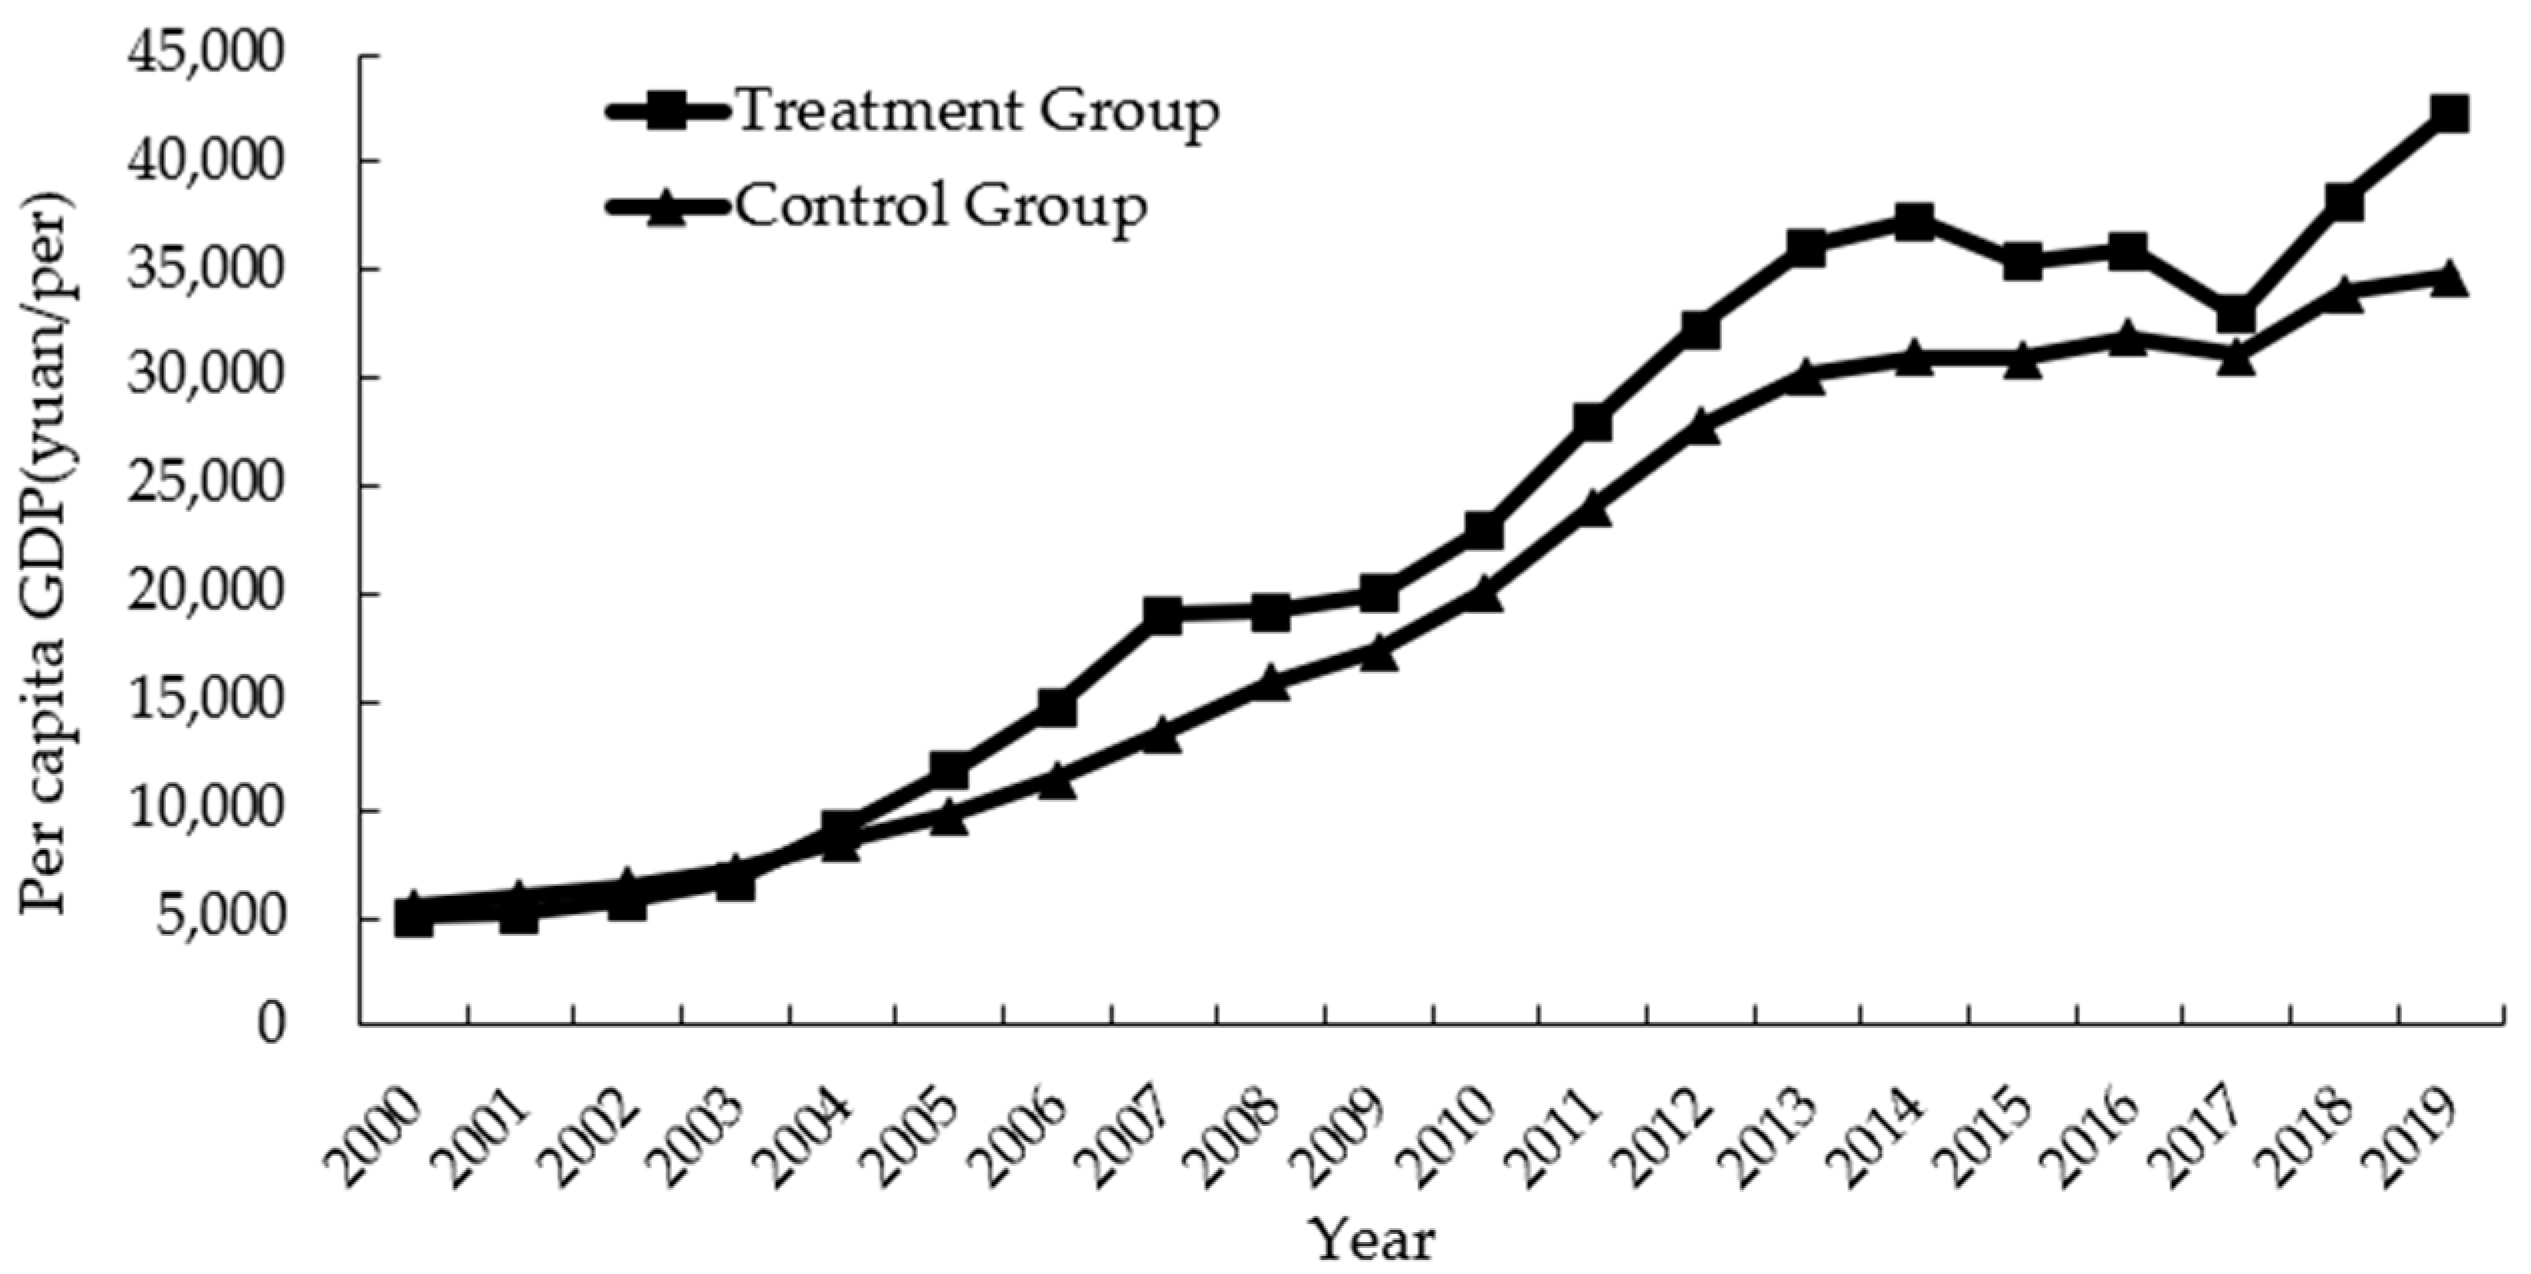
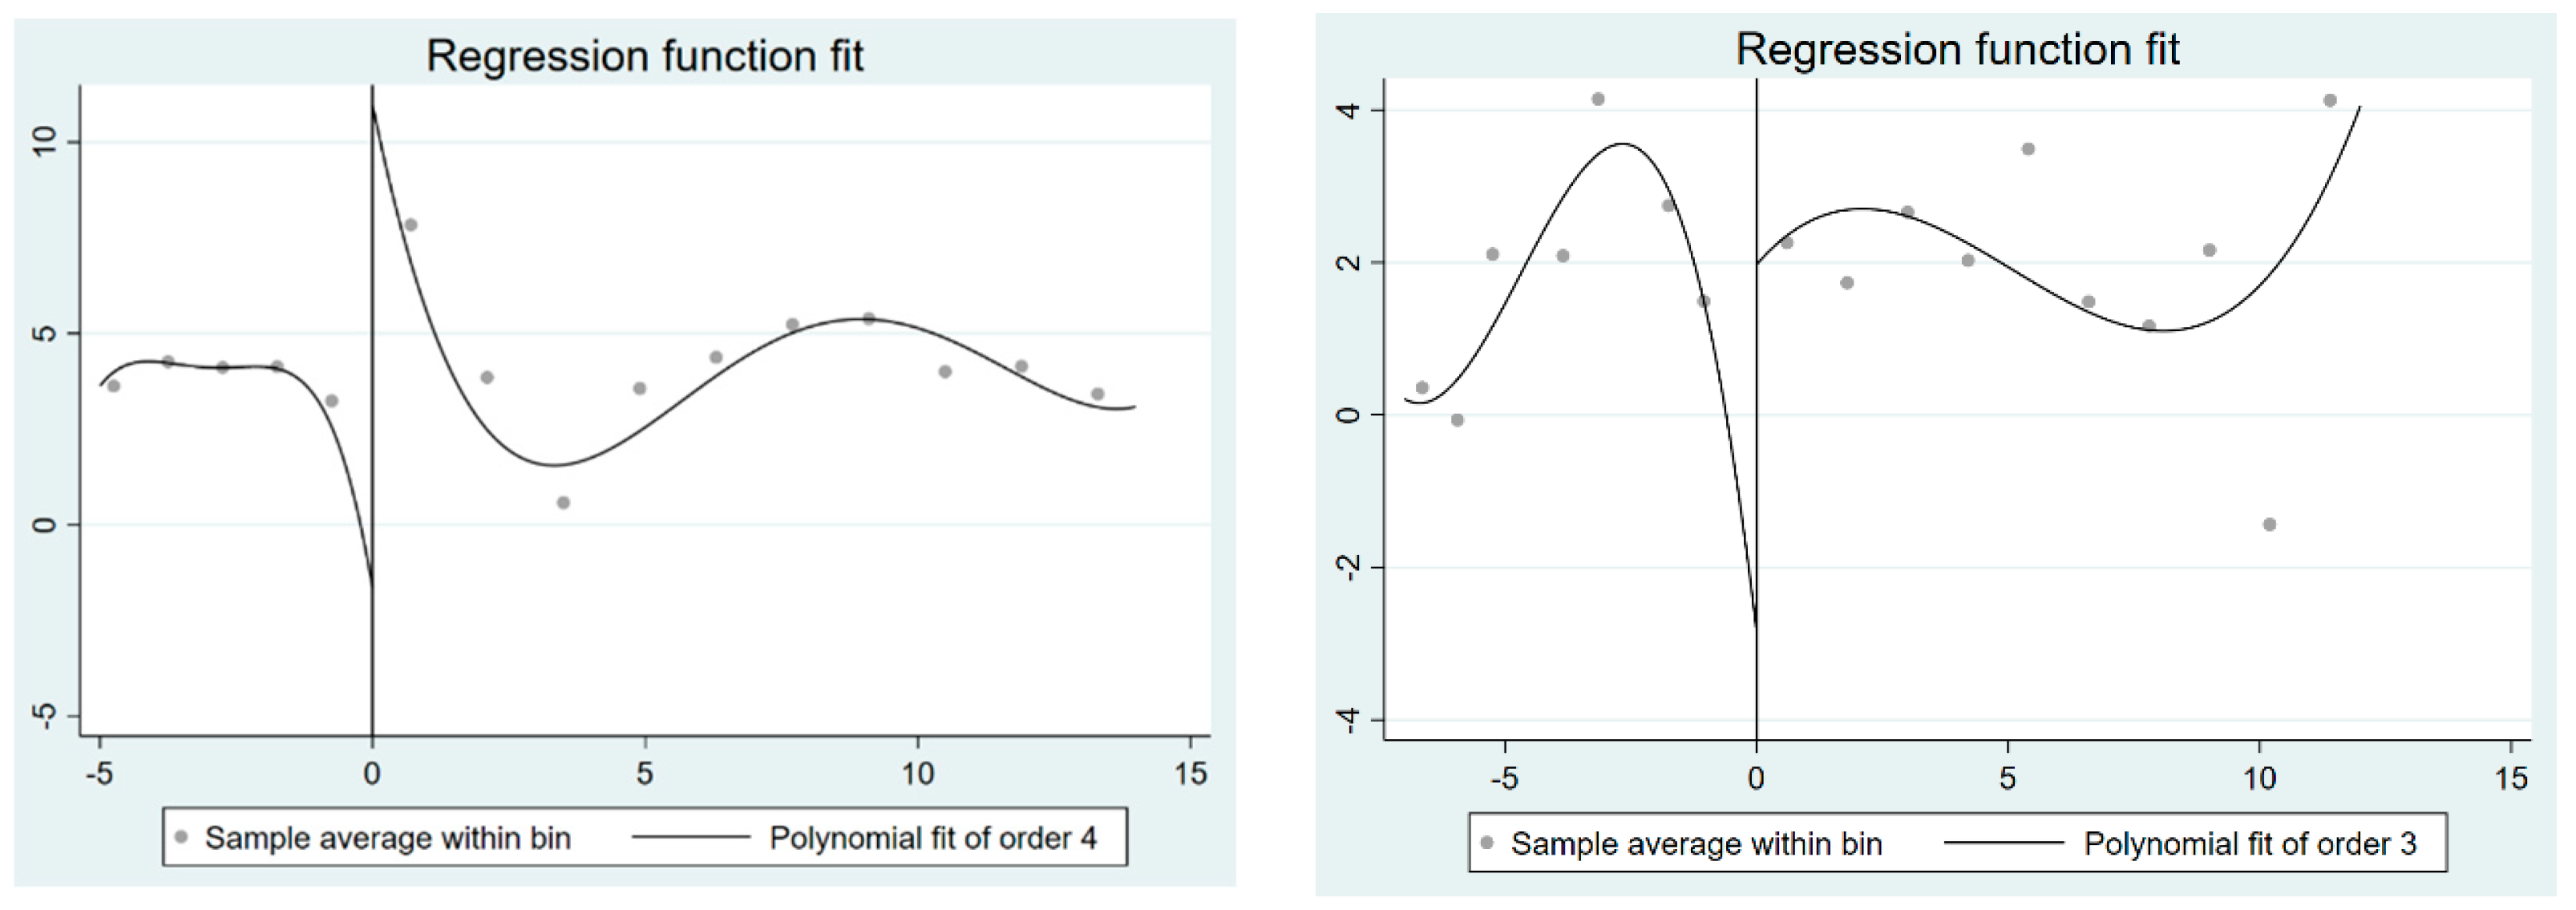
