Article

Effect of Leaf Area Index on Green Facade Thermal Performance in Buildings

1
Department of Agricultural and Environmental Science, University of Bari, 70126 Bari, Italy
2
Department of Biological and Environmental Sciences and Technologies, University of Salento, 73100 Lecce, Italy
3
Department of Veterinary Sciences, University of Pisa, 56124 Pisa, Italy
*
Author to whom correspondence should be addressed.
Sustainability 2022, 14(5), 2966; https://doi.org/10.3390/su14052966
Submission received: 3 February 2022 / Revised: 24 February 2022 / Accepted: 28 February 2022 / Published: 3 March 2022
(This article belongs to the Special Issue Green Infrastructures and Sustainable Development)

Abstract

:
Green facades applied on a building’s envelope allow achieving the building’s passive thermal control and energy consumption reduction. These are complex systems and many site- and plant-specific parameters influence their energy behavior. The leaf area index (LAI) is a relevant plant characteristic to consider. Solar shading and latent heat loss of plant evapotranspiration are the two main cooling mechanisms. The aim of this study was to assess the cooling effect provided by an evergreen south oriented green facade in summer in a Mediterranean area and to investigate what happens when LAI changes. Experimental data were used to calculate the cooling effect provided by the facade. Simulations with different LAI values were performed to determine the related cooling effect. The canopy solar transmissivity decreased by 54% for every LAI unit increase. LAI significantly influenced the green facade cooling performance. As LAI increased, solar shading and latent heat increased; this was relevant until an upper limit value of 6. An exponential equation to calculate the mean extinction coefficient (km), and a polynomial relationship, with very good agreement, were proposed to calculate shading and latent heat as function of LAI. The findings of this research can effectively contribute to fill still existing gaps on green facades’ energy performance and to the energy simulation of buildings equipped with them.

1. Introduction

The urban population is estimated to reach a peak of more than 68% by 2050, and about 86% in more developed regions [1]. With the increasing urbanization of the world’s population, the surface of cities has undergone significant changes such as the replacement of vegetated areas with artificial surfaces characterized by non-reflective and water-resistant materials with high absorption of solar radiation and elevated heat storage capacity. Urban structure, lack of vegetation cover and the presence of hard surfaces in cities are considered the major causes of the urban heat island (UHI) phenomenon [2], consisting of increased air temperatures in cities, compared to surrounding suburban or rural areas, even up to 8 °C [3]. A 1 °C increase in maximum daily temperature can result in a 2–4% rise in electricity demand, and this increase in urban air temperature can account for 5–10% of urban peak electricity demand due to the additional use of air conditioning [4]. In 2019, 35% of global final energy consumption was accounted for the total final energy consumption of the building construction and operations sector, and 38% of global CO2 emissions was attributed to energy-related carbon dioxide emissions from this sector [5]. Therefore, the building sector offers significant potential for energy savings. The need to reduce energy consumption of buildings and to mitigate the UHI and the local climate change are key challenges for today’s society [6]. As a result, much research has been conducted in recent years on the potential of vertical greenery systems (VGSs) in the area of environmental sustainability and energy saving in buildings [7,8,9,10].
VGSs refer to vegetated systems designed to be integrated on the building facades. The integration of plants in the building envelope is a nature-based solution for the passive thermal regulation and the reduction of the energy consumption of buildings. Additional benefits are provided by VGSs at building and city scale [11,12]. Several studies have shown that the use of VGSs affects positively the acoustic insulation [13], the mitigation of the UHI effect [14], the air quality improvement [15], the urban biodiversity reconciliation [16], as well as increase in aesthetics and property value [17].
VGSs can be categorized into green facades (GFs) and living walls (LWs) in relation to the construction techniques and characteristics [18]. In GFs, evergreen or deciduous plants climb vertically on the building wall directly through morphological features (direct GFs); alternatively, plants grow on a lightweight supporting structure positioned at a small distance from the wall (double-skin or indirect GFs). This realizes an air gap (AG) between the vegetation layer and the building envelope. Plants are rooted within ground soil, or even in pots placed at different height along the facade. LWs use plants that are placed into continuous permeable screens or in modular elements. These contain the growing medium or hydroponic systems, held by frame structures fixed to the building wall [19]. LWs, which require higher initial investment and operating costs and intensive maintenance, have higher potential impacts on the environment than GFs [20,21].
The effects GFs can have on the facade thermal functioning comprise the reduction of surface temperatures due to the solar shading [22,23], cooling through evapotranspiration [24,25], as well as wind speed reductions in the foliage and near the facade [26]. In cold periods, GFs warm the facade due to the green layer (GL) that acts as a thermal barrier [27]. Overall, regarding the passive energy saving potential, GFs can improve energy performance of buildings, thus promoting the attainment of comfort conditions and energy saving for air conditioning. GFs are especially advantageous in warm climates, enabling the reduction of energy consumption for building cooling [8].
The magnitude of the benefits achievable depends on many factors, i.e., plant (percentage of plant coverage, density and width of plant foliage), building characteristics (plant-covered facade orientation, presence and relative position of a thermal insulation layer in the masonry, solar absorption coefficient of the facade), and local climate [28,29]. Prior studies have rarely examined and compared the effect of leaf area index (LAI) on the thermal performance of GFs, although LAI is one of the most influential variables affecting the thermal effects of a GF. LAI is a dimensionless quantity, defined as the leaf cross-sectional area per unit covered area. LAI has been recently used for comparing several types of plants used in GFs, for monitoring plant growth and maturity, and for evaluating energy saving seasonal variation [19,30,31]. Wong et al. [32] found a linear correlation between LAI and shading coefficient values for different VGSs. This means that higher values of LAI can result into greater thermal performance for the building. As reviewed by Bakhshoodeh et al. [31], the plant-covered wall external surface becomes colder as LAI increases compared with the walls directly exposed to solar radiation. Pérez et al. [30] used LAI of the vegetation in a GF for characterizing the potential shadow effect, considered to be the most relevant parameter for delivering energy savings in building. They established a simple procedure of measuring LAI and finally related it to the energy savings provided by the GF. Pérez et al. [19] characterized, through continuous monitoring, the annual evolution of LAI for an indirect GF made up of a Boston ivy deciduous climber plant in Mediterranean continental climate. The impact of facade orientation and LAI on the wall external surface temperature and the energy consumption were addressed and the results confirmed their direct dependance on LAI evolution across the seasons. LAI near 5 was shown in early summer, with little fluctuation between orientations, and a resulting energy saving of 54% was estimated. Moreover, results highlighted the importance of considering the seasonal dynamics of plants also in relation to the facade orientation. More research is still needed to investigate the contribution of different LAI values on the different cooling mechanisms provided by GF in Mediterranean climate.
To overcome the aforementioned research gap, this study deepens the role of LAI and its impact on the energy performance of a double-skin GF in Mediterranean climate. An experimental GF prototype, made up of an evergreen climber plant, was monitored during a summer period. Our research aims to evaluate the cooling effect provided by the green layer. As a novel contribution to the research, we propose the definition, based on experimental data, of a mean extinction coefficient (km) of solar radiation and mathematical relationships to quantify shading and evapotranspiration as function of LAI. This allows to enrich the knowledge on the energy performance of buildings equipped with GFs and its simulation.

2. Materials and Methods

The experimental GF was built at the experimental centre of the University of Bari (Figure 1). The prototype is placed in Valenzano (Bari, Italy), at latitude 41°01′ N, longitude 16°54′ E and elevation 124 m a.s.l. The site climate is mild temperate with hot and humid summer, classified as Cfa category defined by Köppen–Geiger [33].
The GF was realized according to the double skin typology on the south wall of a building having a rectangular plane (4.20 m long, 1.50 m wide) with a medium height of 2.00 m. The wall equipped with the greenery system was made up of hollow bricks (0.20 m thick) held together with cement mortar and externally finished with white plaster. This was not thermally insulated; its thermal resistance is 0.87 K m2 W−1. The not insulated wall was used to simulate the thermal behavior of a typical Mediterranean building envelope and to evaluate the opportunity of using GF to enhance envelope thermal performance by retrofitting.
The GF was realized with evergreen plants of Rhyncospermum Jasminoides supported in upward growing by an iron net and placed at 0.15 m far from the wall, thus creating an AG in between.
The prototype monitoring was achieved by means of many sensors and three data loggers (two CR10X and one CR1000 Campbell, Logan, UH, USA), allowing the detection and storage of climatic and physical parameters. Solar radiation on the horizontal plane was measured by means of a pyranometer (model 8–48, Eppley Laboratory, Newport, RI, USA); air temperature and relative humidity by using HygroClip-S3 sensors (Rotronic, Zurich, Switzerland); and wind speed and direction through a Wind Sentry anemometer (model 03002, R. M. Young Company, Traverse City, MI, USA). Incoming long-wave infrared (LWIR) radiation on the wall was detected by means of a PIR pyrgeometer (Eppley Laboratory, Newport, RI, USA); solar radiation in front of and behind the vegetation by two pyranometers PIR02 (Geoves s.n.c. Conegliano, Italy); and air velocity and direction in front of and behind the vegetation by means of ATMOS 22 ultrasonic anemometers (METER Group, Inc., Pullman, WA, USA). Wall surface temperature and canopy temperature were measured by thermistors (Tecno.el s.r.l. Formello, Rome, Italy) and Apogee SI 400 radiometers (Logan, UT, USA), respectively.
The internal volume of the prototype was conditioned with a portable heat pump monobloc air conditioner (Ellisse hp, Olimpia Splendid, Cellatica, Italy). A room chronothermostat (C804, Fantini Cosmi, Milan, Italy) was used to manage the internal air temperature. The temperature set point was 26 °C.
A multi-year experimental campaign was conducted. A summer week, from 9 to 15 August 2020, characterized by clear sky days was analyzed in this paper. During these days the external air temperature ranged from 19.7 °C to 36.8 °C, with an average value of 25.5 °C. The external air relative humidity varied from 29.3% to 90.5%, with an average of 59.3%. Wind speed was between 0.0 m s−1 and 4.7 m s−1, with an average of 1.7 m s−1. The maximum value of solar radiation on the horizontal plane was 854.0 W m−2, while the average daily cumulative value was 23.8 MJ m−2.
The radiometric coefficients of the leaves and of the wall surface were measured at the DISAAT Department laboratory. The values for the leaves were: 0.54 for solar absorptivity, 0.32 for reflectivity, 0.14 for transmissivity and 0.96 for LWIR emissivity. Solar absorptivity and reflectivity and LWIR emissivity of the plaster were 0.21, 0.79 and 0.98, respectively.
The GL of vegetation was characterized also by its LAI. Being a GF, LAI was considered as normal to the vertical surface. This was directly evaluated, according to Convertino et al. [34], when the plant was fully grown and resulted equal to 4.11 (the facade on the right in Figure 1).
The two main cooling mechanisms, i.e., shading effect and evapotranspiration, were calculated through the measured data for the real experimental configuration (LAI = 4.11) and were simulated for other LAI values.
The latent heat of evapotranspiration (Φ, W m−2) was calculated from the canopy scale version of the Penman–Monteith [34,35] relationship:
Φ = Δ · R n + ρ a · c p · ( e s e a ) · r e 1 Δ + γ · ( 1 + r c · r e 1 )
where: Δ [Pa K−1] is the rate of change of saturated water pressure with temperature; ρa [kg m−3] is the air density; cp [J kg−1 K−1] is the specific heat of air at constant pressure; es and ea [Pa] are the air vapor pressure at saturation and the actual air vapor pressure, respectively; γ [Pa K−1] is the psychrometric constant; rc and re [s m−1] are the canopy and the external or aerodynamic resistance, respectively. Rn [W m−2] is the effective net radiation and was calculated as function of the global radiation Rg [W m−2], which includes solar and LWIR radiative terms, as [36,37,38]:
R n = 0.86 · ( 1 e x p ( 0.7 · LAI ) ) · R g
The solar shading (SS, W m−2) was calculated as difference between the sum of the instantaneous values of solar energy hitting the GL (E1i, W m−2) and the sum of the instantaneous values of solar energy transmitted to the wall behind the GL (E2i, W m−2):
S S = i = 1 n E 1 i i = 1 n E 2 i
The main issue for the simulation of shading and evapotranspiration in correspondence with different LAI values was to define the solar radiation transmitted to the wall behind the GL and, in turn, the canopy solar transmissivity.
The solar radiation behind the GL can be obtained from:
E 2 i = E 1 i · e x p ( k i · L A I )
where ki is the instantaneous value of the extinction coefficient. This coefficient depends on the leaf angle distribution and on the incidence angle of the solar exposure to the vertical surface [39,40].
By using the measured data of solar radiation (E1i and E2i), ki values can be calculated starting from Equation (4).
The mean solar transmissivity of the GL (τGL) can be calculated as a function of LAI and of km:
τ G L = e x p ( k m · LAI )
For evaluating τGL, km was calculated from the measured data. Given the exponential trend of Equation (4), km was evaluated as follows:
i = 1 n E 2 i · t i = i = 1 n [ E 1 i · t i · e x p ( k i · LAI ) ] = ( i = 1 n E 1 i · t i ) · e x p ( k m · LAI )
Consequently:
k m · LAI = ln ( i = 1 n E 2 i · t i ) l n ( i = 1 n E 1 i · t i )
where n is the time sample and t i (s) are the time intervals from instant ‘i’ to ‘i+1’.
The obtained km can be used to calculate the overall solar energy transmitted through the GL ( i = 1 n E 2 i · t i ), based on the total solar energy hitting the GL ( i = 1 n E 1 i · t i ). This, in turn, allowed to calculate the shading and the latent heat.
The simulations were performed for LAI values varying from 1 to 10, according to Pérez et al. [30] who reported the value of 10 as the usual upper limit of LAI.

3. Results

The application of Equations (6) and (7) to the measured data of solar radiation allowed to obtain a km equal to 0.777. The km coefficient, depending on the specific plant leaves inclination and on the site solar characteristics of the period, is valid in these conditions and was used in Equation (5), varying the term LAI from 1 to 10. This allowed to evaluate τGL for the different LAI values in the same conditions. In the real configuration of the experiment (LAI = 4.11), τGL was 0.041; τGL decreases by 54% for each increase in LAI unit.
The application of Equation (3) to the measured data allowed to determine the SS effect provided by the GL for the experimental GF. It was observed that the integration of SS over the time within the examined period was equal to 66.5 MJ m−2, with an average daily value of 10.4 MJ m−2. The evaluated τGL for the different LAI values was used to simulate, by using Equations (3) and (6), the SS effect in correspondence of these LAIs thanks to the values of solar radiation transmitted through the GL obtained by applying Equation (4) (Figure 2). The simulations found that the SS effect rises with LAI increments (Figure 3), showing a most relevant increase (31.05%) when LAI passes from 1 to 2 (Table 1). The influence of LAI was significant, i.e., it implies increase higher than 1.00%, up to LAI of 6; for LAI becoming higher than 6, the SS effect grows very slowly.
Latent heat due to the GL evapotranspiration was quantified by applying Equation (1) to the measured data of the analysis period. It was obtained an overall latent heat loss equal to 48.8 MJ m−2 in the period and an average daily value of 6.1 MJ m−2. The latent heat loss was, then, simulated for the other LAI values (Figure 4). As for the SS effect, latent heat loss increases when LAI rises. This behavior could be described by a polynomial profile with a R2 equal to 1.00 (Figure 5). The evaluation of the latent heat percentage increases, associated to LAI increases, highlighted a perfectly exponential trend (R2 equal to 1.00). Furthermore, as for the SS effect, the highest rise in latent heat loss (33.73%) was recorded for LAI going from 1 to 2 (Table 1). When LAI becomes higher than 6, the increase of this cooling mechanism is lower than 1%.
The total cooling effect, as sum of the SS and of the latent heat loss, recorded for the experimental configuration was equal to 115.2 MJ m−2 during the whole analysis period, with a daily average of 16.5 MJ m−2. This was evaluated also for the other LAI values (Figure 6). Even when considering the overall cooling effect, the most significant increase (32.00%) was obtained for LAI varying from 1 to 2, while increases lower than 1% were found for LAI growing beyond 6 (Table 1).
The quantification of the two effects contributing to the overall cooling highlighted also that the SS effect contributed the most. For the real experimental configuration, the SS represented on average the 62.97% of the overall cooling. By looking at the simulated results, it can be noted that when LAI increases, the contribution of the SS to the overall cooling decreases, while the contribution of the latent heat loss increases (Table 2). This changing in the two terms’ contributions becomes smaller as LAI increases, until it is almost null for the highest LAI values.

4. Discussion

GFs integrate vegetation in building envelope and allow achieving many advantages, especially in terms of passive thermal regulation and of energy saving for buildings’ air conditioning [8]. This technology is a nature-based solution that can offer the possibility of improving the energy efficiency of buildings and providing a healthy living environment. The former is of interest also to rural residents to better improve their living standards [41,42]. The latter is a topic of current interest to both building designers and people living in urban areas [43,44].
It is commonly recognized that plant characteristics influence the thermal functioning of VGSs [28,29]. Many researchers also agree that, among all these factors, LAI is the most crucial parameter [19,40,45]. Regarding the beneficial cooling effect provided in warm periods, as highlighted in our research, also other studies stated the influence of LAI on the potential cooling achievable by shading and evapotranspiration [19,40,45,46]. Moreover, it is suggested that there is a threshold value of LAI beyond which its influence on the cooling effect is no longer significant [46]. The findings of our research are consistent with those found in the literature.
In our research we showed that cooling due to shading and evapotranspiration becomes higher as LAI increases; anyhow, the cooling effect increases less than 1% when associated to each LAI unit increase above 6. Consistent results were found by Dahanayake et al. [45]. They performed simulations of a building equipped with a west vertical greenery system by varying LAI from 1 to 5 under hot humid climate conditions in Hong Kong (China). They found that plants with higher LAI increase the shading effect, providing more cooling. Of the same opinion are Cameron et al. [46], who studied the performance of GFs with many plant species in the temperate maritime climate in Reading (UK). They evaluated the total cooling load due to shading and evapotranspiration for different LAI values. The authors observed that plants with a higher number of leaves provided greater overall cooling and agreed that increase of foliage density (hence, LAI) is necessary to improve cooling potential of the canopies. With reference to the shading effect, the authors stated that a saturation point exists, with additional leaves providing no extra benefits. From our study, we draw a similar conclusion, not only concerning the shading effect, but also the evapotranspiration, and we identified a sort of threshold value of LAI equal to 6. We highlighted that the shading effect is related to LAI, through the green layer transmissivity which decreases as LAI increases. Similar considerations were made by Ip et al. [22]. They analyzed the shading performance of a deciduous vertical greenery system placed on a southwest facade of an office building in Brighton (UK). The authors measured solar radiation behind 1 to 5 leaf layers over the summer period, calculating the related transmissivities. The reported average transmissivities were 0.45, 0.31, 0.27, 0.22 and 0.12 corresponding to 1 to 5 leaf layers, respectively. It was noted that during the hottest months, when the plant growth was maximum, the shading effect was also the highest. The solar radiation transmission in canopies with LAI from 0 to 2 was analyzed also by Chen et al. [40] who performed measurements and simulations of living walls behavior with east, south, west and north orientations, in Wuhan (China). Their findings suggested that the higher the LAI, the less solar radiation was transmitted; thus, the better shading effect was provided. It was observed a relevant change in transmissivity with varying LAI. The obtained values of transmissivity were 0.56, 0.14, 0.07 and 0.04 for LAI of 0.5, 1.0, 1.5 and 2, respectively.
The results of the present research contribute to deepen the knowledge for the simulation of the energy performance of GFs. The study focused on the quantification of their cooling effects by providing mathematical relationships to relate shading and evapotranspiration with LAI, as one of the plant’s most important parameters. The study focused on the energy behavior of the single facade, which inevitably affects the energy functioning of the building. Future research will be conducted to integrate the presented results in the energy analysis of a whole building to determine the influence on the building energy needs for cooling.

5. Conclusions

This study focuses on the cooling effect provided by a green facade realized with Rhyncospermum jasminoides in summer, under Mediterranean climate conditions. The two main cooling mechanisms, i.e., solar shading and evapotranspiration, were evaluated by using experimental data, for the real configuration, and were simulated for different LAI values, an important plant parameter. Simulations were performed to assess the influence of LAI on plant transmissivity and cooling effect. The findings of this study highlighted the key role played by LAI in the green facade performance. Green layer solar transmissivity decreased by 54% for every LAI unit increase. Both the solar shading and the latent heat loss due to plant evapotranspiration were influenced by LAI. It was found that as LAI increased, the cooling effect increased. Anyway, beyond a certain LAI value, no more significant increases of the cooling effect were recorded. The solar shading effect contributed more than the latent heat loss to the overall cooling and their ratio slightly varied with LAI. This study proposed nonlinear relationships that allow quantifying, with very good agreement, the two cooling effects provided by the green facade varying LAI. The results of this research contribute to fill the gaps in literature on the energy performance of green facades and to the simulation of thermal behavior of buildings equipped with them, allowing the evaluation of the energy advantages.

Author Contributions

Conceptualization, F.C.; methodology, I.B. and E.S.; software, I.B.; validation, G.V. and C.B.; data curation, F.C.; writing, E.S.; supervision, G.V. and C.B. All authors have read and agreed to the published version of the manuscript.

Funding

This research received no external funding.

Institutional Review Board Statement

Not applicable.

Informed Consent Statement

Not applicable.

Data Availability Statement

Not applicable.

Conflicts of Interest

The authors declare no conflict of interest.

References

  1. United Nations. World Urbanization Prospects: The 2018 Revision; ST/ESA/SER.A/420; United Nations: New York, NY, USA, 2018. [Google Scholar]
  2. Soltani, A.; Sharifi, E. Daily variation of urban heat island effect and its correlations to urban greenery: A case study of Adelaide. Front. Arch. Res. 2017, 6, 529–538. [Google Scholar] [CrossRef]
  3. Kolokotsa, D.; Psomas, A.; Karapidakis, E. Urban heat island in southern Europe: The case study of Hania, Crete. Sol. Energy 2009, 83, 1871–1883. [Google Scholar] [CrossRef]
  4. Akbari, H.; Pomerantz, M.; Taha, H. Cool surfaces and shade trees to reduce energy use and improve air quality in urban areas. Sol. Energy 2001, 70, 295–310. [Google Scholar] [CrossRef]
  5. United Nations Environment Programme. 2020 Global Status Report for Buildings and Construction: Towards a Zero-Emissions, Efficient and Resilient Buildings and Construction Sector; The United Nations Environment Programme: Nairobi, Kenya, 2020. [Google Scholar]
  6. Sangiorgio, V.; Fiorito, F.; Santamouris, M. Development of a holistic urban heat island evaluation methodology. Sci. Rep. 2020, 10, 1–13. [Google Scholar] [CrossRef]
  7. Lee, L.S.H.; Jim, C.Y. Transforming thermal-radiative study of a climber green wall to innovative engineering design to enhance building-energy efficiency. J. Clean. Prod. 2019, 224, 892–904. [Google Scholar] [CrossRef]
  8. Coma, J.; Pérez, G.; de Gracia, A.; Burés, S.; Urrestarazu, M.; Cabeza, L.F. Vertical greenery systems for energy savings in buildings: A comparative study between green walls and green facades. Build. Environ. 2017, 111, 228–237. [Google Scholar] [CrossRef] [Green Version]
  9. Pérez, G.; Coma, J.; Martorell, I.; Cabeza, L.F. Vertical Greenery Systems (VGS) for energy saving in buildings: A review. Renew. Sustain. Energy Rev. 2014, 39, 139–165. [Google Scholar] [CrossRef] [Green Version]
  10. Blanco, I.; Vox, G.; Schettini, E.; Russo, G. Assessment of the environmental loads of green façades in buildings: A comparison with un-vegetated exterior walls. J. Environ. Manag. 2021, 294, 112927. [Google Scholar] [CrossRef]
  11. Bustami, R.A.; Belusko, M.; Ward, J.; Beecham, S. Vertical greenery systems: A systematic review of research trends. Build. Environ. 2018, 146, 226–237. [Google Scholar] [CrossRef]
  12. Blanco, I.; Schettini, E.; Mugnozza, G.S.; Vox, G. Thermal behaviour of green façades in summer. J. Agric. Eng. 2018, 49, 183–190. [Google Scholar] [CrossRef]
  13. Wong, N.H.; Tan, A.Y.K.; Tan, P.Y.; Chiang, K.; Wong, N.C. Acoustics evaluation of vertical greenery systems for building walls. Build. Environ. 2010, 45, 411–420. [Google Scholar] [CrossRef]
  14. Alexandri, E.; Jones, P. Temperature decreases in an urban canyon due to green walls and green roofs in diverse climates. Build. Environ. 2008, 43, 480–493. [Google Scholar] [CrossRef]
  15. Rahman, A.M.A.; Yeok, F.S.; Amir, A.F. The Building Thermal Performance and Carbon Sequestration Evaluation for Psophocarpustetrogonobulus on Biofaçade Wall in theTropical Environment. Int. J. Environ. Ecol. Eng. 2011, 5, 206–214. [Google Scholar] [CrossRef]
  16. Francis, R.A.; Lorimer, J. Urban reconciliation ecology: The potential of living roofs and walls. J. Environ. Manag. 2011, 92, 1429–1437. [Google Scholar] [CrossRef]
  17. Wong, N.H.; Tan, A.Y.K.; Puay, Y.T.; Sia, A.; Wong, N.C. Perception studies of vertical greenery systems in Singapore. J. Urban Plan. Dev. 2010, 136, 330–338. [Google Scholar] [CrossRef]
  18. Medl, A.; Stangl, R.; Florineth, F. Vertical greening systems—A review on recent technologies and research advancement. Build. Environ. 2017, 125, 227–239. [Google Scholar] [CrossRef]
  19. Pérez, G.; Coma, J.; Chàfer, M.; Cabeza, L.F. Seasonal influence of leaf area index (LAI) on the energy performance of a green facade. Build. Environ. 2022, 207, 108497. [Google Scholar] [CrossRef]
  20. Zhang, L.; Deng, Z.; Liang, L.; Zhang, Y.; Meng, Q.; Wang, J.; Santamouris, M. Thermal behavior of a vertical green facade and its impact on the indoor and outdoor thermal environment. Energy Build. 2019, 204, 109502. [Google Scholar] [CrossRef]
  21. Ottelé, M.; Perini, K.; Fraaij, A.L.A.; Haas, E.M.; Raiteri, R. Comparative life cycle analysis for green façades and living wall systems. Energy Build. 2011, 43, 3419–3429. [Google Scholar] [CrossRef]
  22. Ip, K.; Lam, M.; Miller, A. Shading performance of a vertical deciduous climbing plant canopy. Build. Environ. 2010, 45, 81–88. [Google Scholar] [CrossRef]
  23. Hoelscher, M.-T.; Nehls, T.; Jänicke, B.; Wessolek, G. Quantifying cooling effects of facade greening: Shading, transpiration and insulation. Energy Build. 2016, 114, 283–290. [Google Scholar] [CrossRef]
  24. Stec, W.J.; van Paassen, A.H.C.; Maziarz, A. Modelling the double skin façade with plants. Energy Build. 2005, 37, 419–427. [Google Scholar] [CrossRef]
  25. Blanco, I.; Convertino, F.; Schettini, E.; Vox, G. Energy analysis of a green façade in summer: An experimental test in Mediterranean climate conditions. Energy Build. 2021, 245, 111076. [Google Scholar] [CrossRef]
  26. Perini, K.; Ottelé, M.; Fraaij, A.L.A.; Haas, E.M.; Raiteri, R. Vertical greening systems and the effect on air flow and temperature on the building envelope. Build. Environ. 2011, 46, 2287–2294. [Google Scholar] [CrossRef]
  27. Convertino, F.; Vox, G.; Schettini, E. Thermal barrier effect of green façades: Long-wave infrared radiative energy transfer modelling. Build. Environ. 2020, 177, 106875. [Google Scholar] [CrossRef]
  28. Manso, M.; Teotónio, I.; Silva, C.M.; Cruz, C.O. Green roof and green wall benefits and costs: A review of the quantitative evidence. Renew. Sustain. Energy Rev. 2021, 135, 110111. [Google Scholar] [CrossRef]
  29. Kontoleon, K.J.; Eumorfopoulou, E.A. The effect of the orientation and proportion of a plant-covered wall layer on the thermal performance of a building zone. Build. Environ. 2010, 45, 1287–1303. [Google Scholar] [CrossRef]
  30. Pérez, G.; Coma, J.; Sol, S.; Cabeza, L.F. Green facade for energy savings in buildings: The influence of leaf area index and facade orientation on the shadow effect. Appl. Energy 2017, 187, 424–437. [Google Scholar] [CrossRef] [Green Version]
  31. Bakhshoodeh, R.; Ocampo, C.; Oldham, C. Thermal performance of green façades: Review and analysis of published data. Renew. Sustain. Energy Rev. 2022, 155, 111744. [Google Scholar] [CrossRef]
  32. Wong, N.H.; Tan, A.Y.K.; Tan, P.Y.; Wong, N.C. Energy simulation of vertical greenery systems. Energy Build. 2009, 41, 1401–1408. [Google Scholar] [CrossRef]
  33. Peel, M.C.; Finlayson, B.L.; McMahon, T.A. Updated world map of the Köppen-Geiger climate classification. Hydrol. Earth Syst. Sci. 2007, 11, 1633–1644. [Google Scholar] [CrossRef] [Green Version]
  34. Convertino, F.; Vox, G.; Schettini, E. Evaluation of the cooling effect provided by a green façade as nature-based system for buildings. Build. Environ. 2021, 203, 108099. [Google Scholar] [CrossRef]
  35. Monteith, J.L.; Unsworth, M.H. Principles of Environmental Physics, 4th ed.; Elsevier: Amsterdam, The Netherlands, 2013; ISBN 1865843830. [Google Scholar]
  36. Villarreal-Guerrero, F.; Kacira, M.; Fitz-Rodríguez, E.; Kubota, C.; Giacomelli, G.A.; Linker, R.; Arbel, A. Comparison of three evapotranspiration models for a greenhouse cooling strategy with natural ventilation and variable high pressure fogging. Sci. Hortic. 2012, 134, 210–221. [Google Scholar] [CrossRef]
  37. Bontsema, J.; Hemming, J.; Stanghellini, C.; de Visser, P.; van Henten, E.J.; Budding, J.; Rieswijk, T.; Nieboer, S. On-line estimation of the transpiration in greenhouse horticulture. In Proceedings of the 2nd IFAC International Conference on Modeling and Design of Control Systems in Agriculture, Osijek, Croatia, 3–5 September 2007; pp. 29–34. [Google Scholar]
  38. Stanghellini, C. Transpiration of Greenhouse Crops, an Aid to Climate Management; Institute of Agricultural Engineering: Wageningen, The Netherlands, 1987. [Google Scholar]
  39. Bréda, N.J.J. Ground-based measurements of leaf area index: A review of methods, instruments and current controversies. J. Exp. Bot. 2003, 54, 2403–2417. [Google Scholar] [CrossRef]
  40. Chen, Q.; Ding, Q.; Liu, X. Establishment and validation of a solar radiation model for a living wall system. Energy Build. 2019, 195, 105–115. [Google Scholar] [CrossRef]
  41. Li, B.; You, L.; Zheng, M.; Wang, Y.; Wang, Z. Energy consumption pattern and indoor thermal environment of residential building in rural China. Energy Built Environ. 2020, 1, 327–336. [Google Scholar] [CrossRef]
  42. Liang, N.; Kong, Q.; Cao, Y.; Liu, S.; Yan, Y. Investigation on Energy-Saving Walls of Houses in Rural Hangzhou. In Proceedings of the 11th International Symposium on Heating, Ventilation and Air Conditioning, Harbin, China, 12–15 July 2019; Springer: Berlin/Heidelberg, Germany, 2019; pp. 949–957. [Google Scholar] [CrossRef]
  43. Bungău, C.C.; Prada, I.F.; Prada, M.; Bungău, C. Design and Operation of Constructions: A Healthy Living Environment-Parametric Studies and New Solutions. Sustainability 2019, 11, 6824. [Google Scholar] [CrossRef] [Green Version]
  44. Prada, M.; Prada, I.F.; Cristea, M.; Popescu, D.E.; Bungău, C.; Aleya, L.; Bungău, C.C. New solutions to reduce greenhouse gas emissions through energy efficiency of buildings of special importance—Hospitals. Sci. Total Environ. 2020, 718, 137466. [Google Scholar] [CrossRef]
  45. Dahanayake, K.C.; Chow, C.L.; Hou, G.L. Selection of suitable plant species for energy efficient Vertical Greenery Systems (VGS). Energy Procedia 2017, 142, 2473–2478. [Google Scholar] [CrossRef]
  46. Cameron, R.W.F.; Taylor, J.E.; Emmett, M.R. What’s “cool” in the world of green façades? How plant choice influences the cooling properties of green walls. Build. Environ. 2014, 73, 198–207. [Google Scholar] [CrossRef] [Green Version]
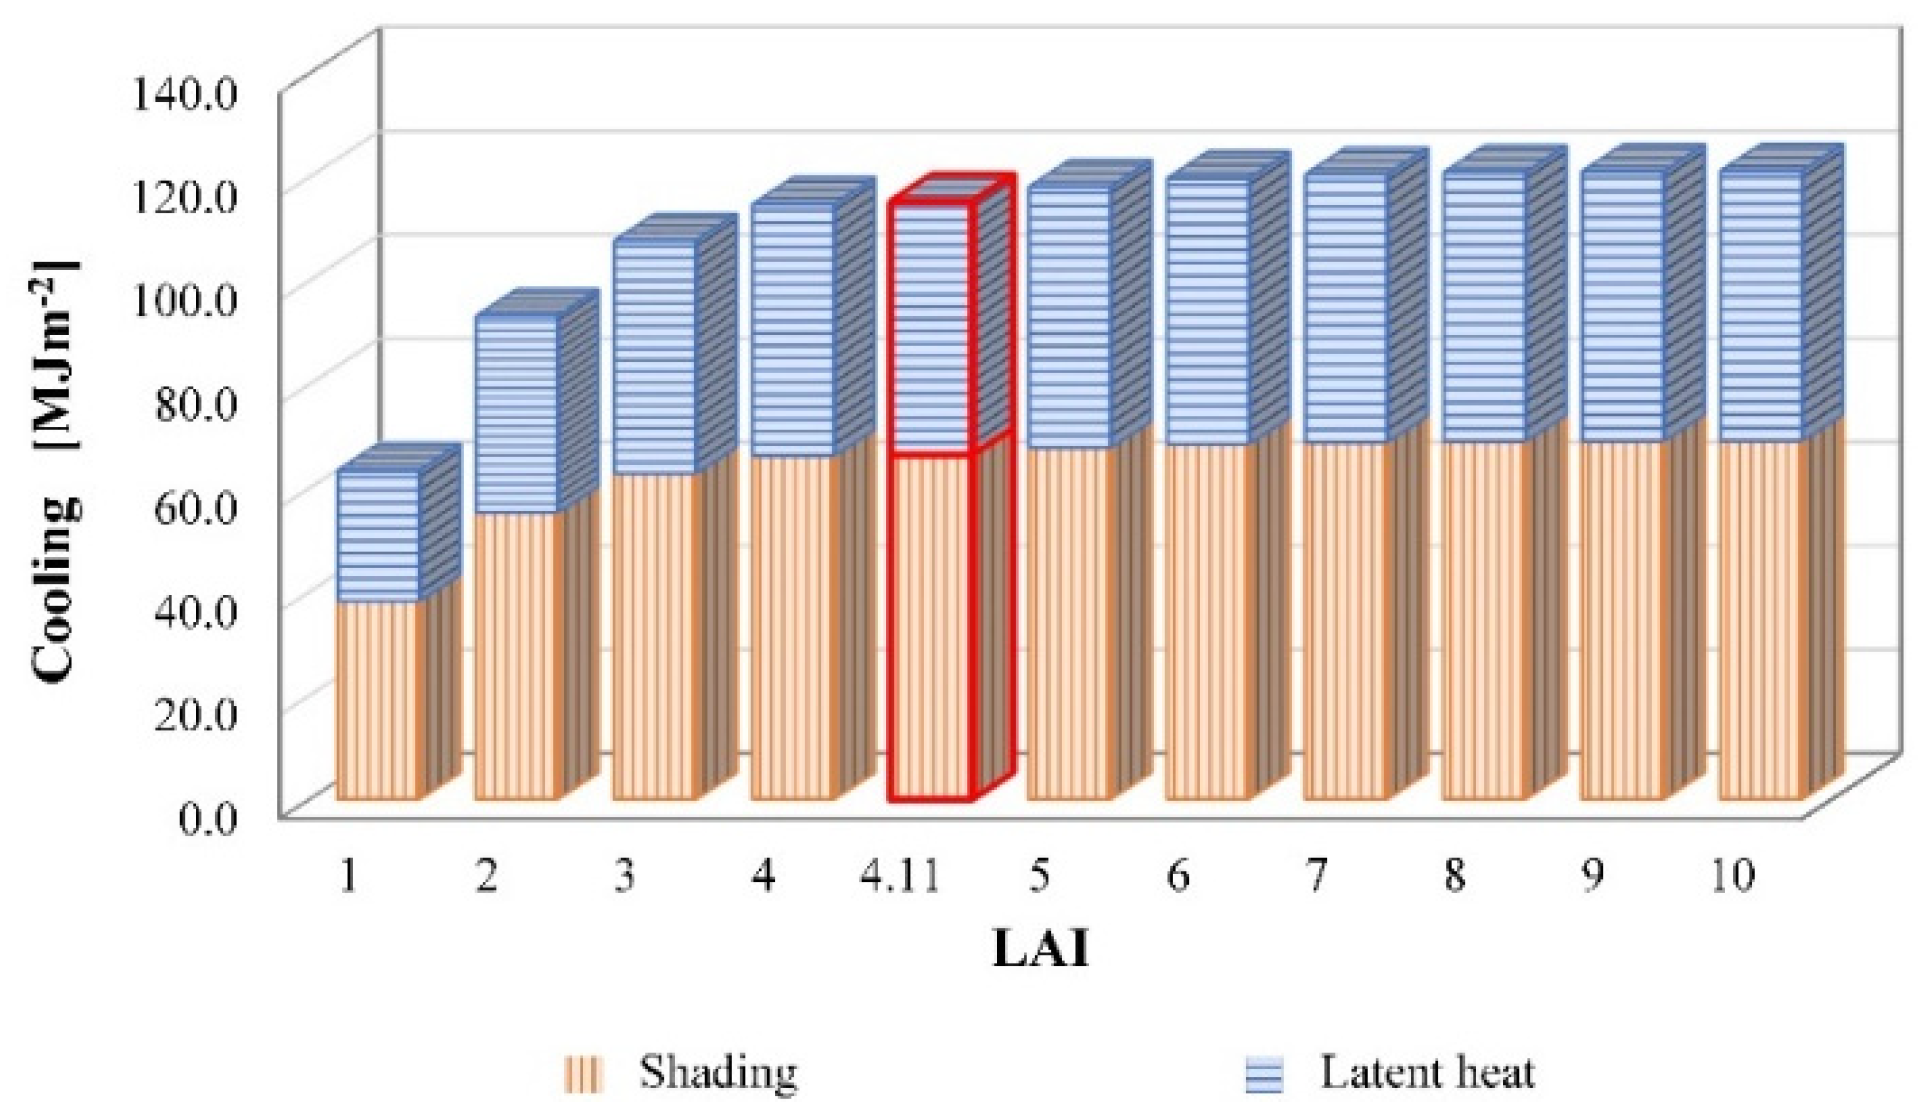
Figure 1. Experimental prototype at the University of Bari: south-facing wall with green facade and some sensors.
Sustainability 14 02966 g001
Figure 2. Solar radiation transmitted through the green layer simulated for the different LAI values (primary axis) and measured value of solar radiation on vertical surface (secondary axis), 9–15 August 2020.
Sustainability 14 02966 g002
Figure 3. Daily average values of the solar shading effect of the green layer for different LAI values, 9–15 August 2020. Real configuration of the experiment (LAI = 4.11) is represented with a red diamond.
Sustainability 14 02966 g003
Figure 4. Latent heat flux due to evapotranspiration of the green layer with different LAI values, 9–15 August 2020.
Sustainability 14 02966 g004
Figure 5. Daily average values of latent heat due to green layer evapotranspiration for different LAI values and percentage increase of latent heat for each LAI unit increase (secondary axis), 9–15 August 2020. Real configuration of the experiment (LAI = 4.11) is represented with a red triangle.
Sustainability 14 02966 g005
Figure 6. Overall cooling effect as combination of shading and latent heat exchange for the different LAI values, 9–15 August 2020. Real configuration of the experiment (LAI = 4.11) is represented with a red outline.
Sustainability 14 02966 g006
Table 1. Increases of daily average cooling effects for each LAI unit increase.
LAI Increase1→22→33→44→55→66→77→88→99→10
Cooling Increases [%]
by shading31.0512.335.332.031.110.520.250.120.06
by latent heat33.7315.607.453.611.770.870.430.210.10
overall32.0013.526.112.851.350.650.320.160.08
Table 2. Percentage contributions to the average overall cooling effect of solar shading and latent heat loss.
LAI12345678910
Contribution to the Overall Cooling [%]
shading65.3264.4163.5463.0162.7262.5662.4862.4462.4262.41
latent heat34.6835.5936.4636.9937.2837.4437.5237.5637.5837.59
Publisher’s Note: MDPI stays neutral with regard to jurisdictional claims in published maps and institutional affiliations.

