
Urban Gardens’ Potential to Improve Stormwater Management: A Comparative Analysis among Urban Soils in Sorocaba, São Paulo, Brazil

 ,
, 
Abstract
:1. Introduction
2. Materials and Methods
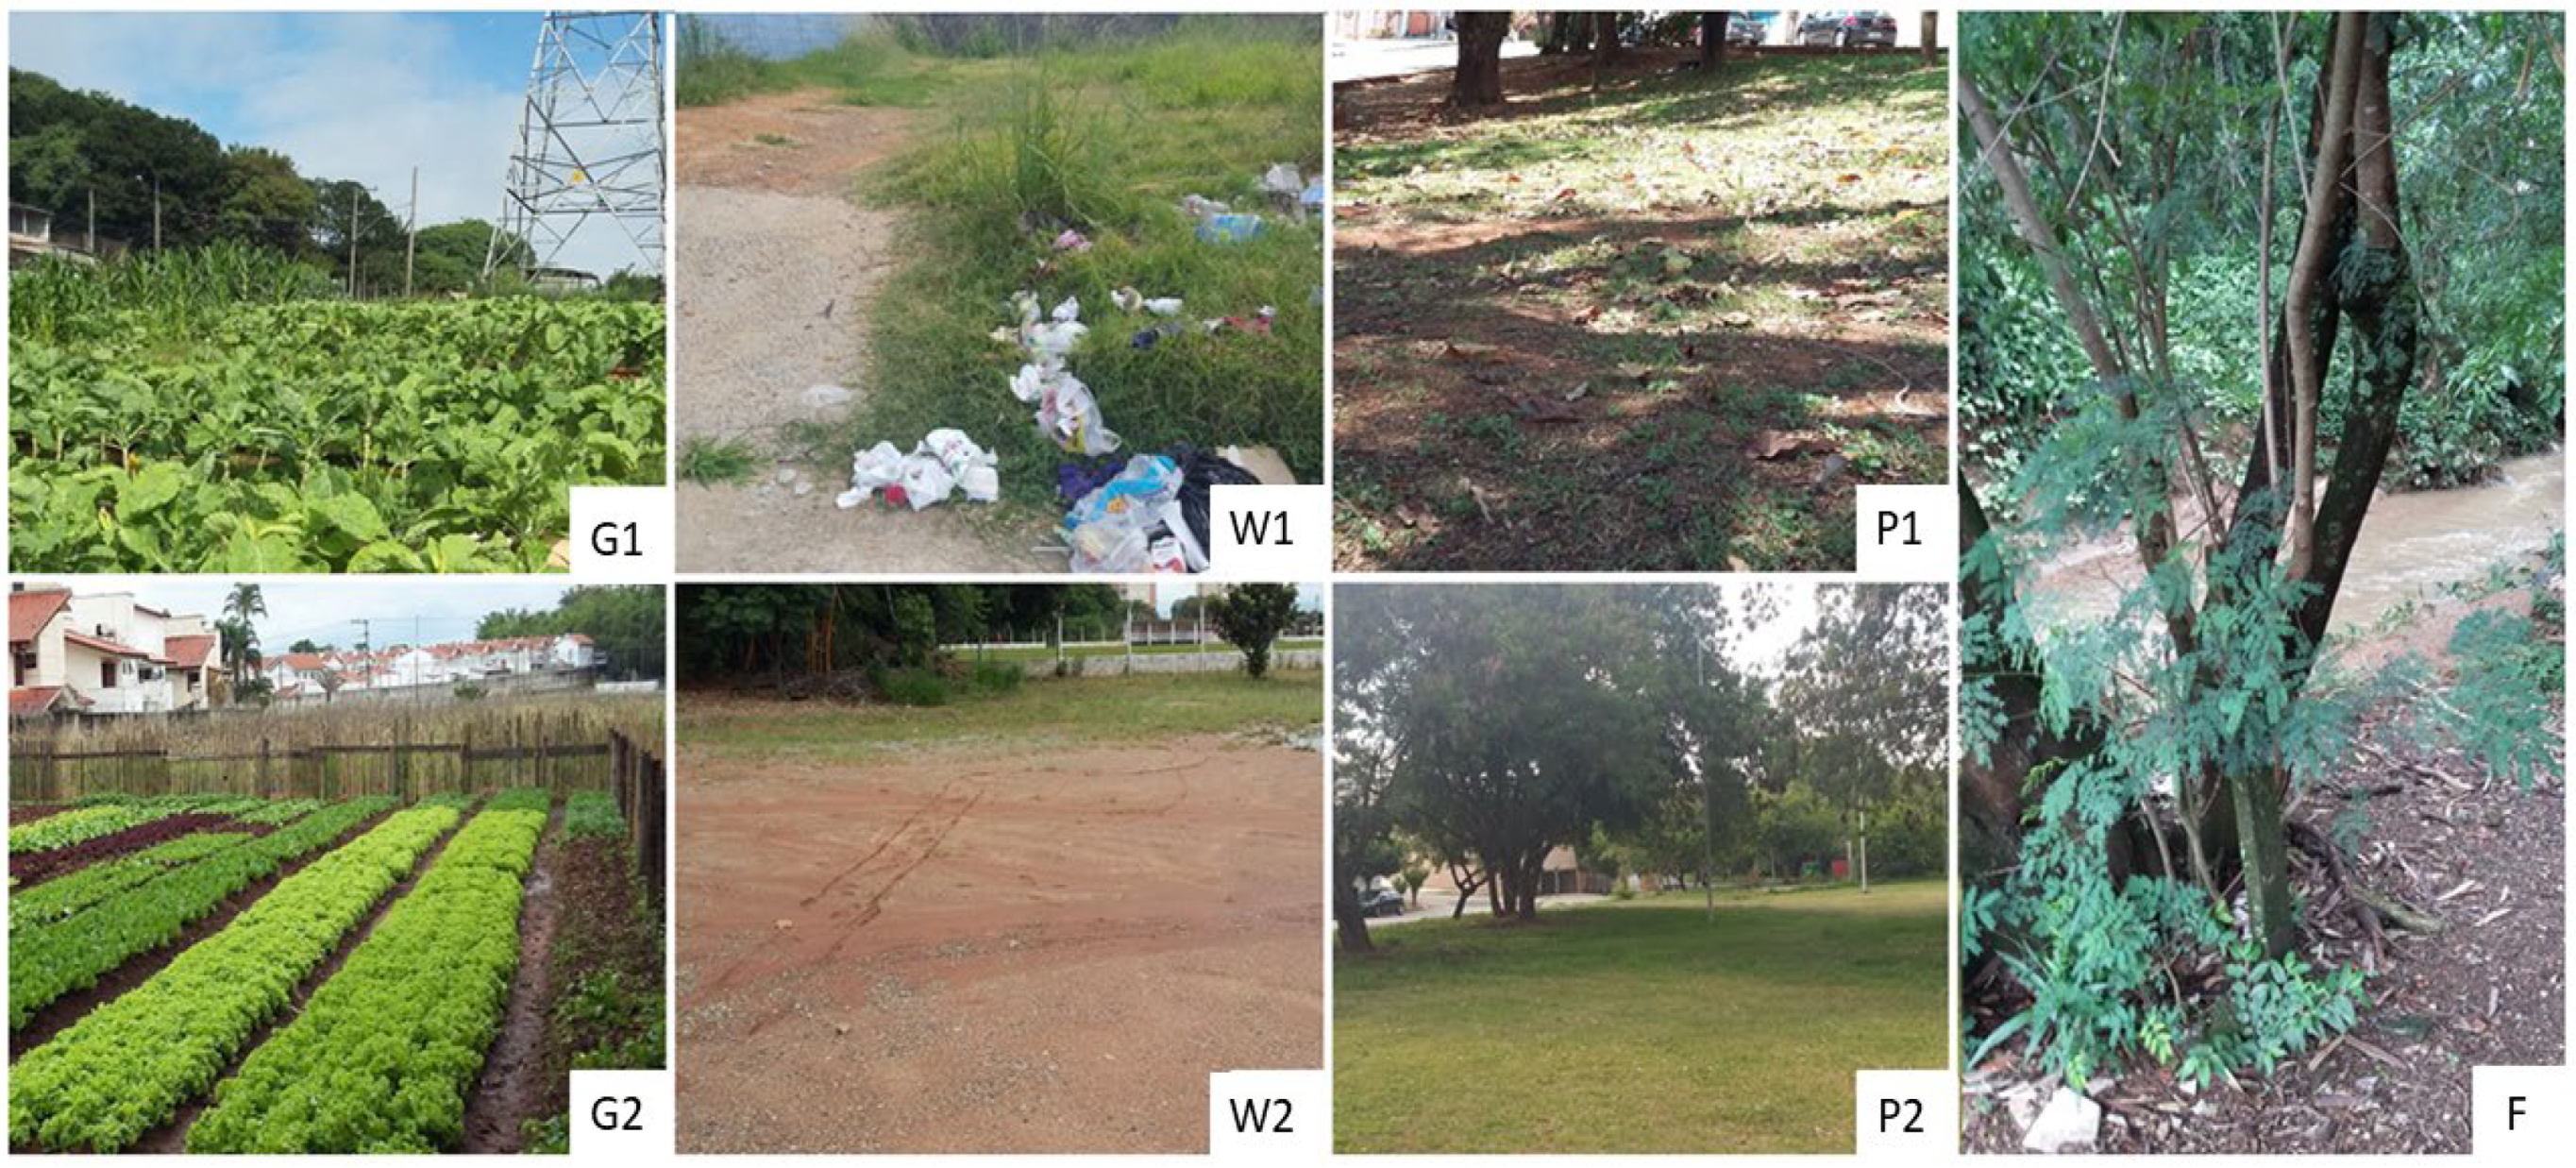
2.1. Study Area
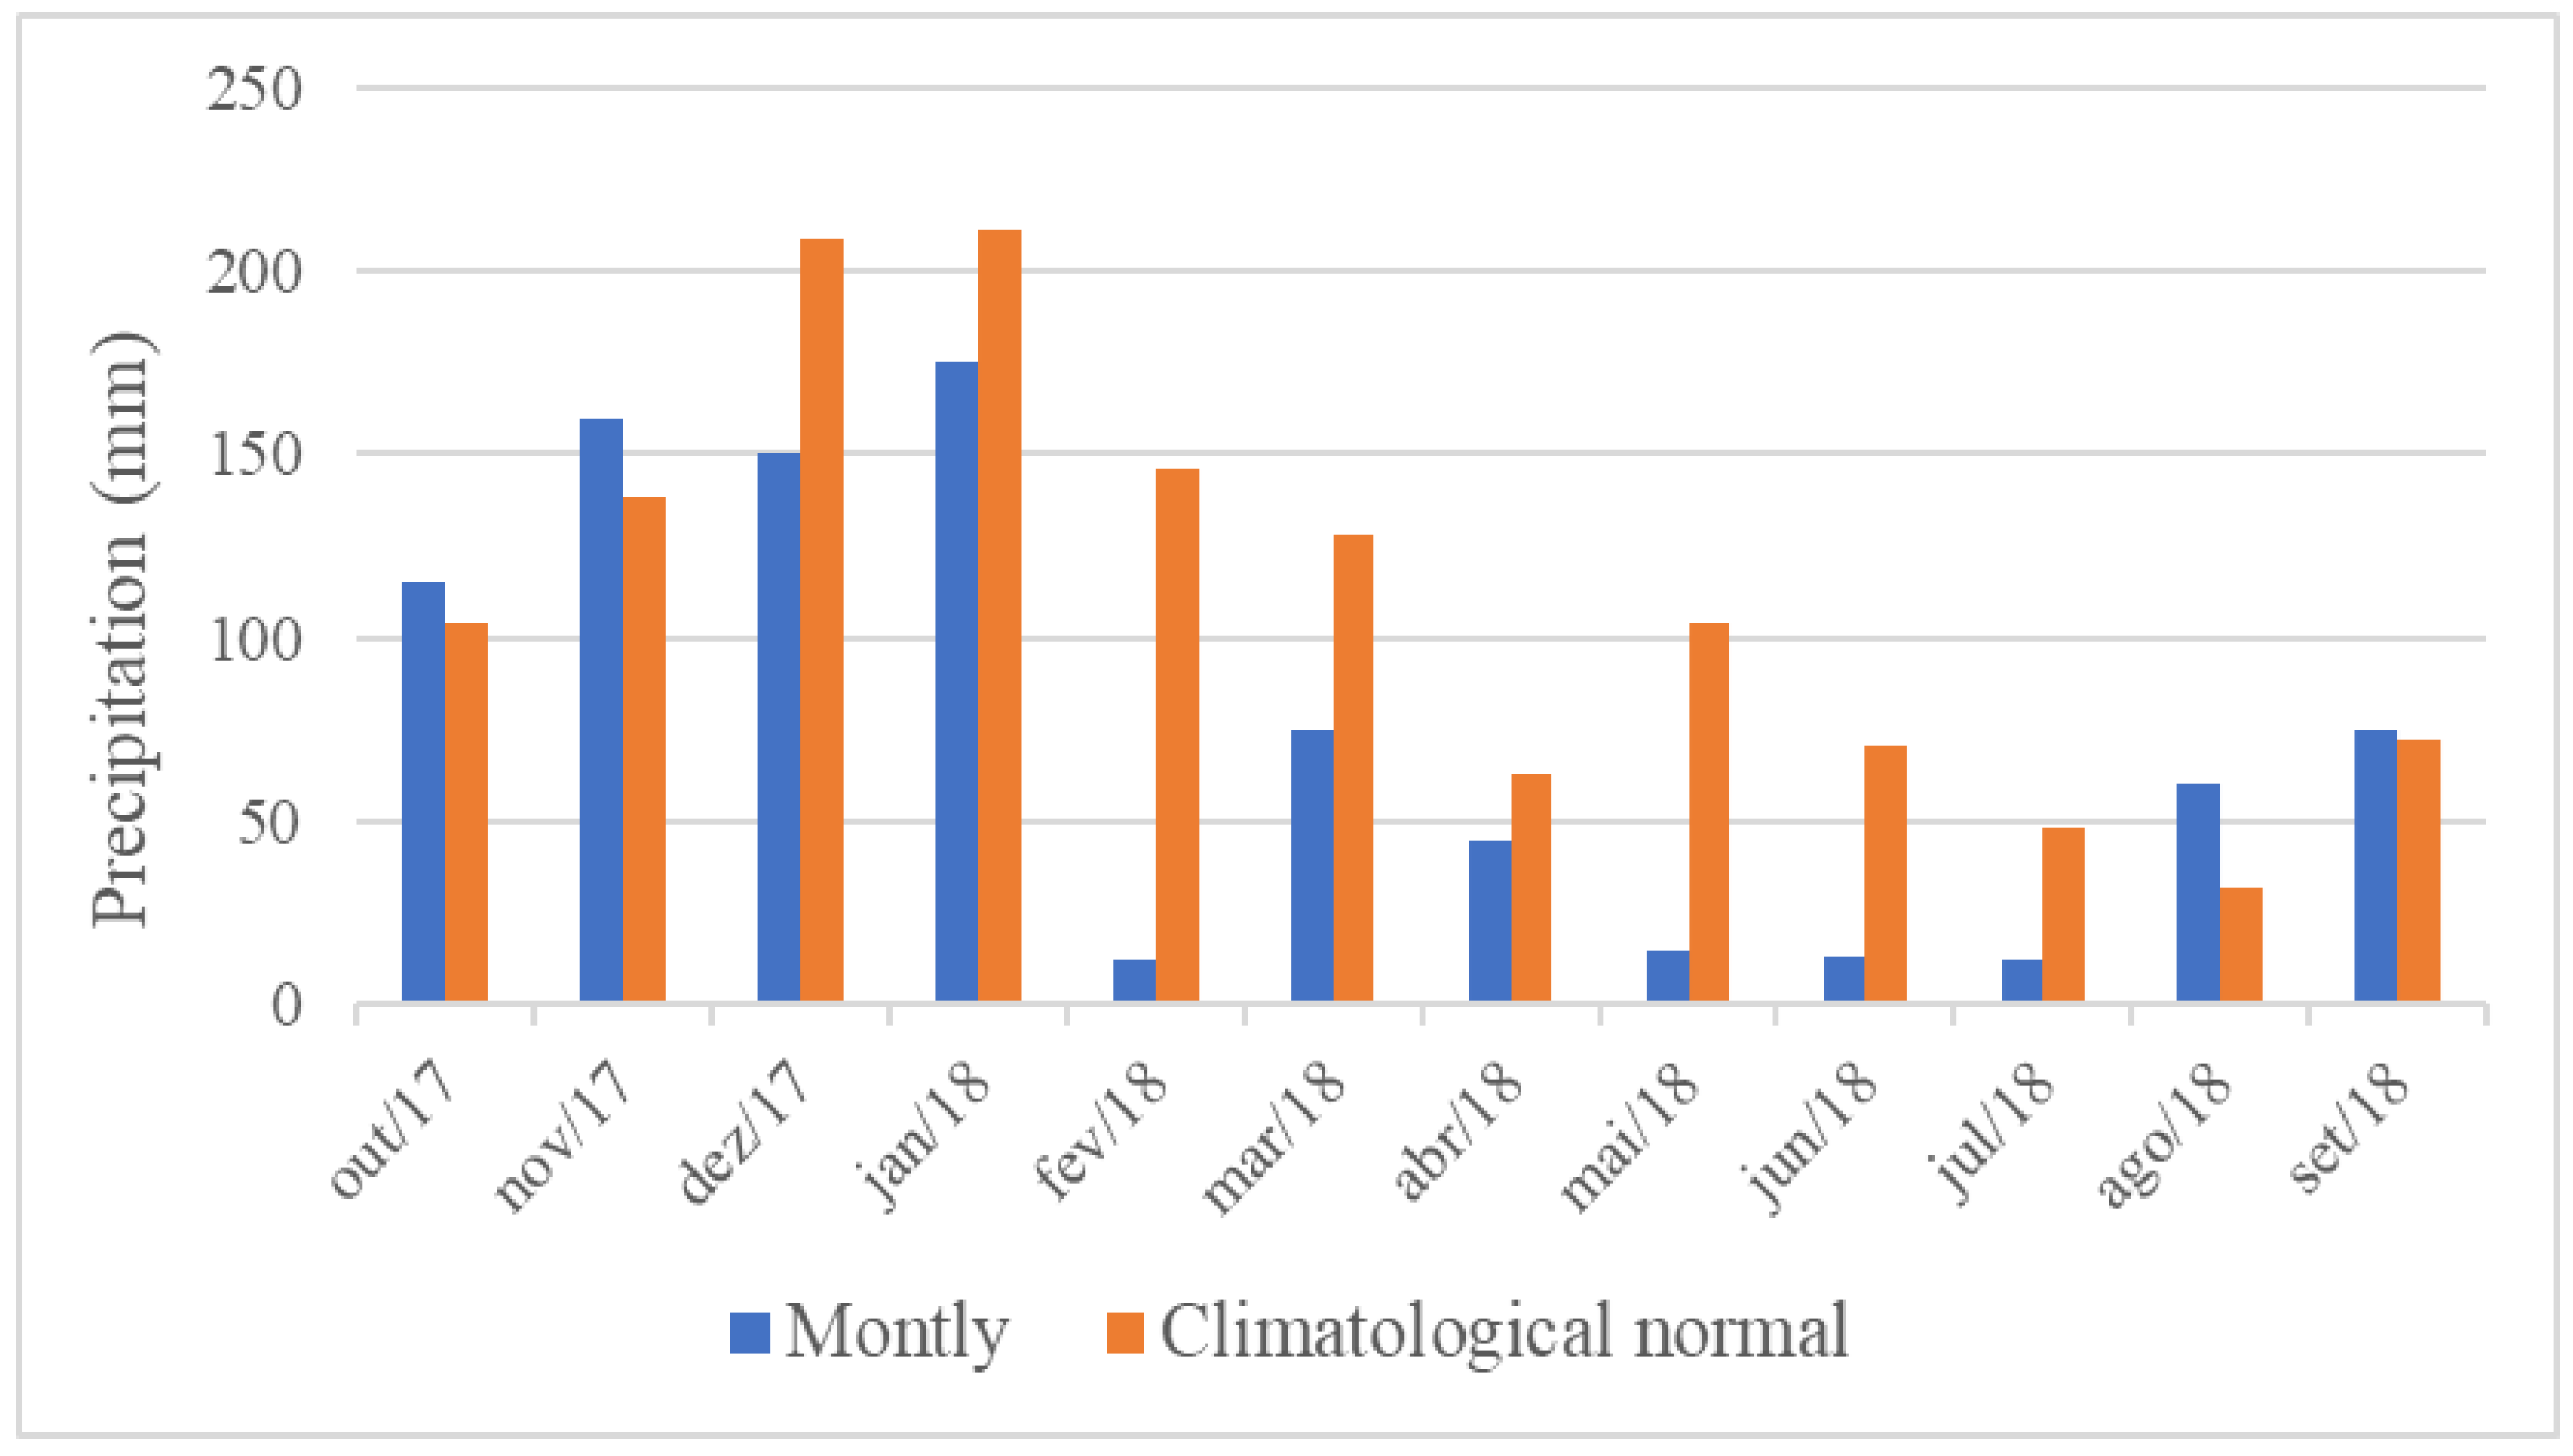
2.2. Precipitation
2.3. Soil Indicators
2.4. Data Analysis
3. Results
3.1. Bulk Density
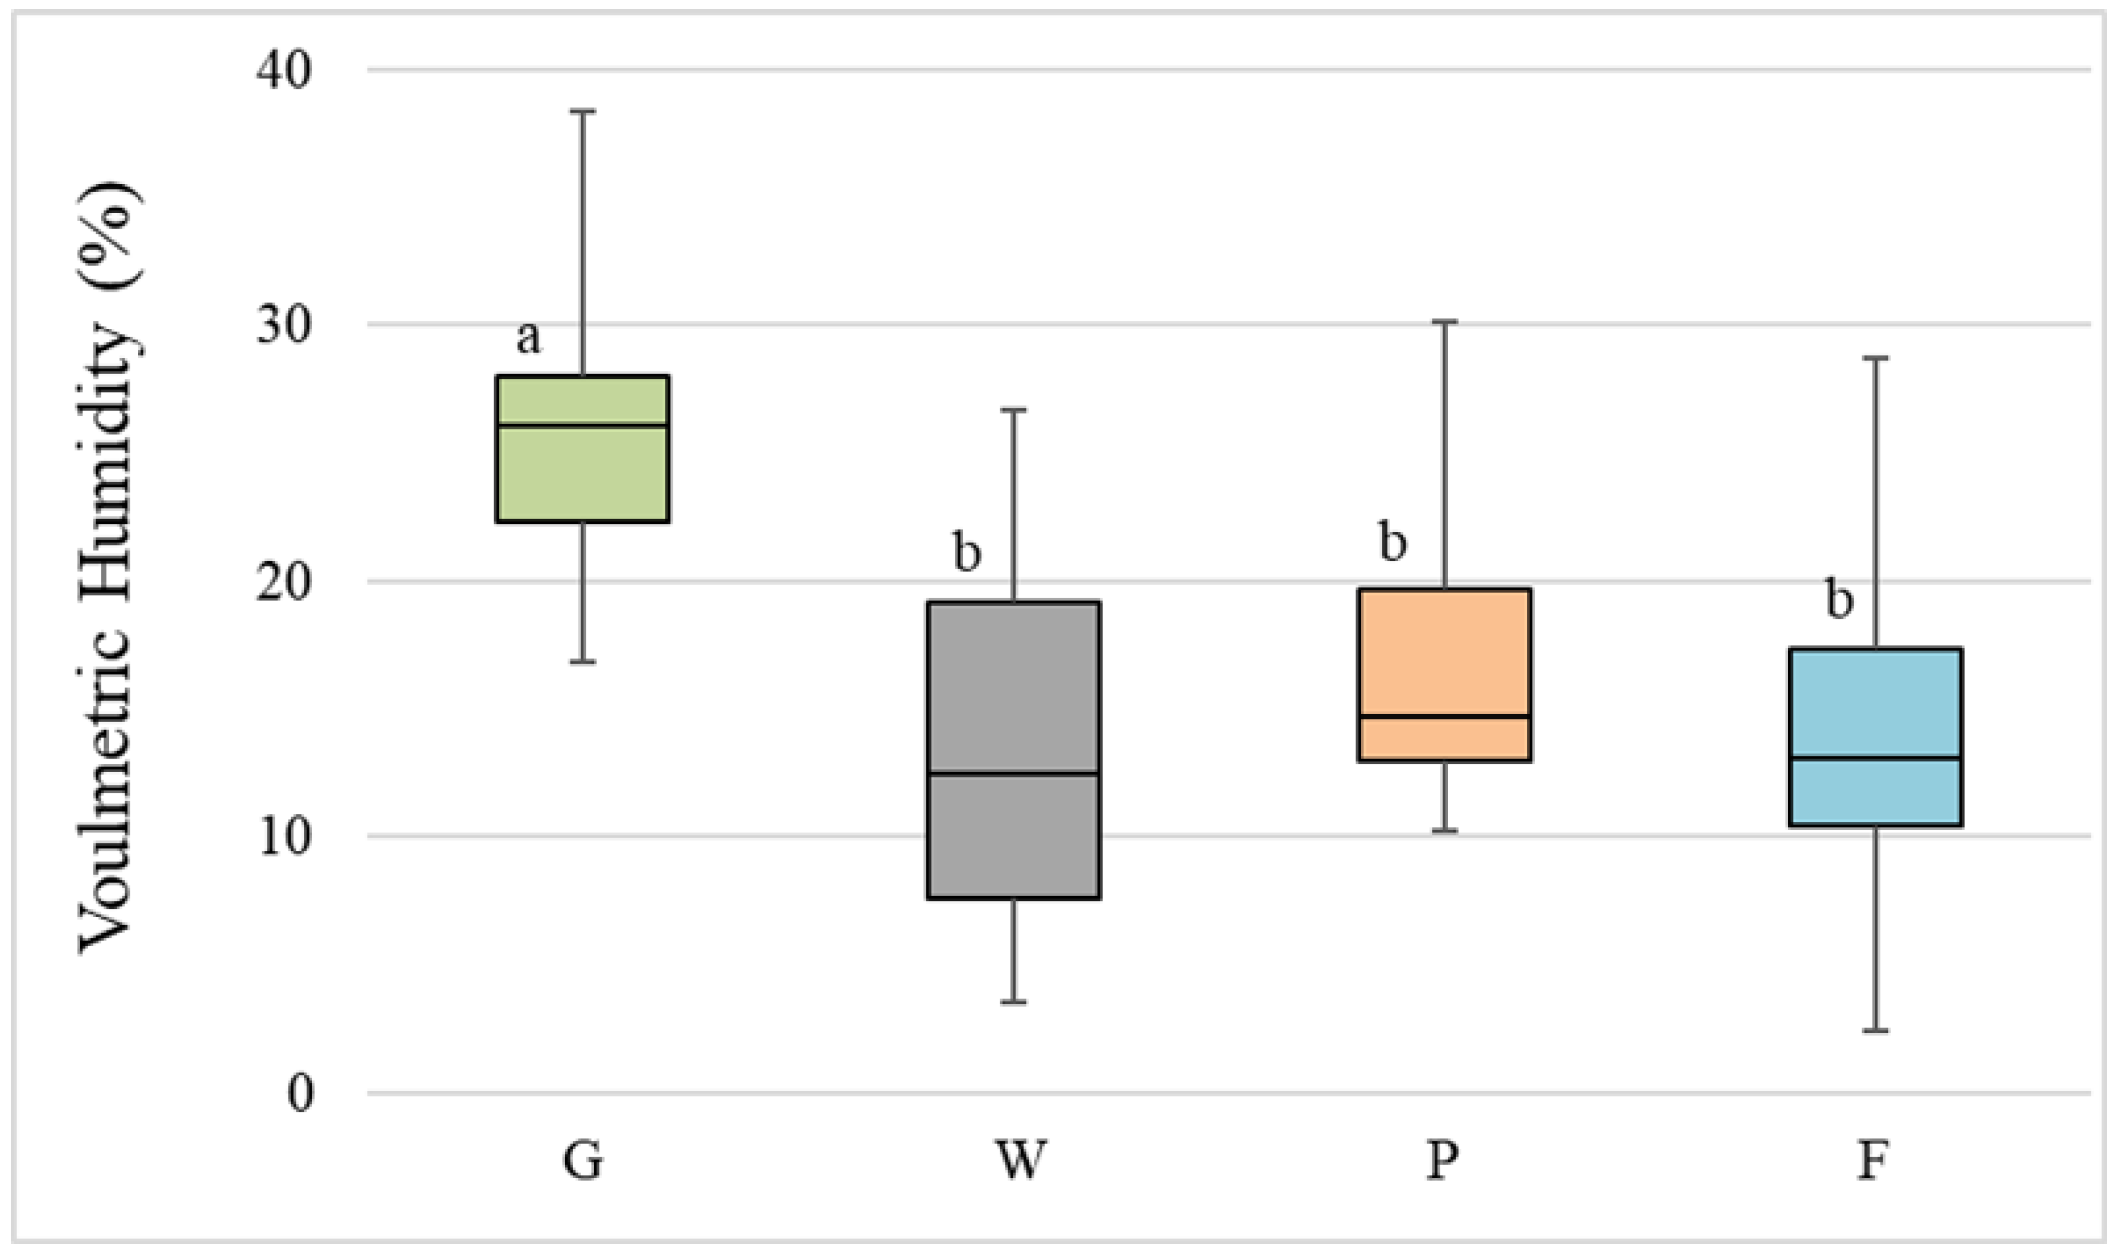
3.2. Volumetric Humidity
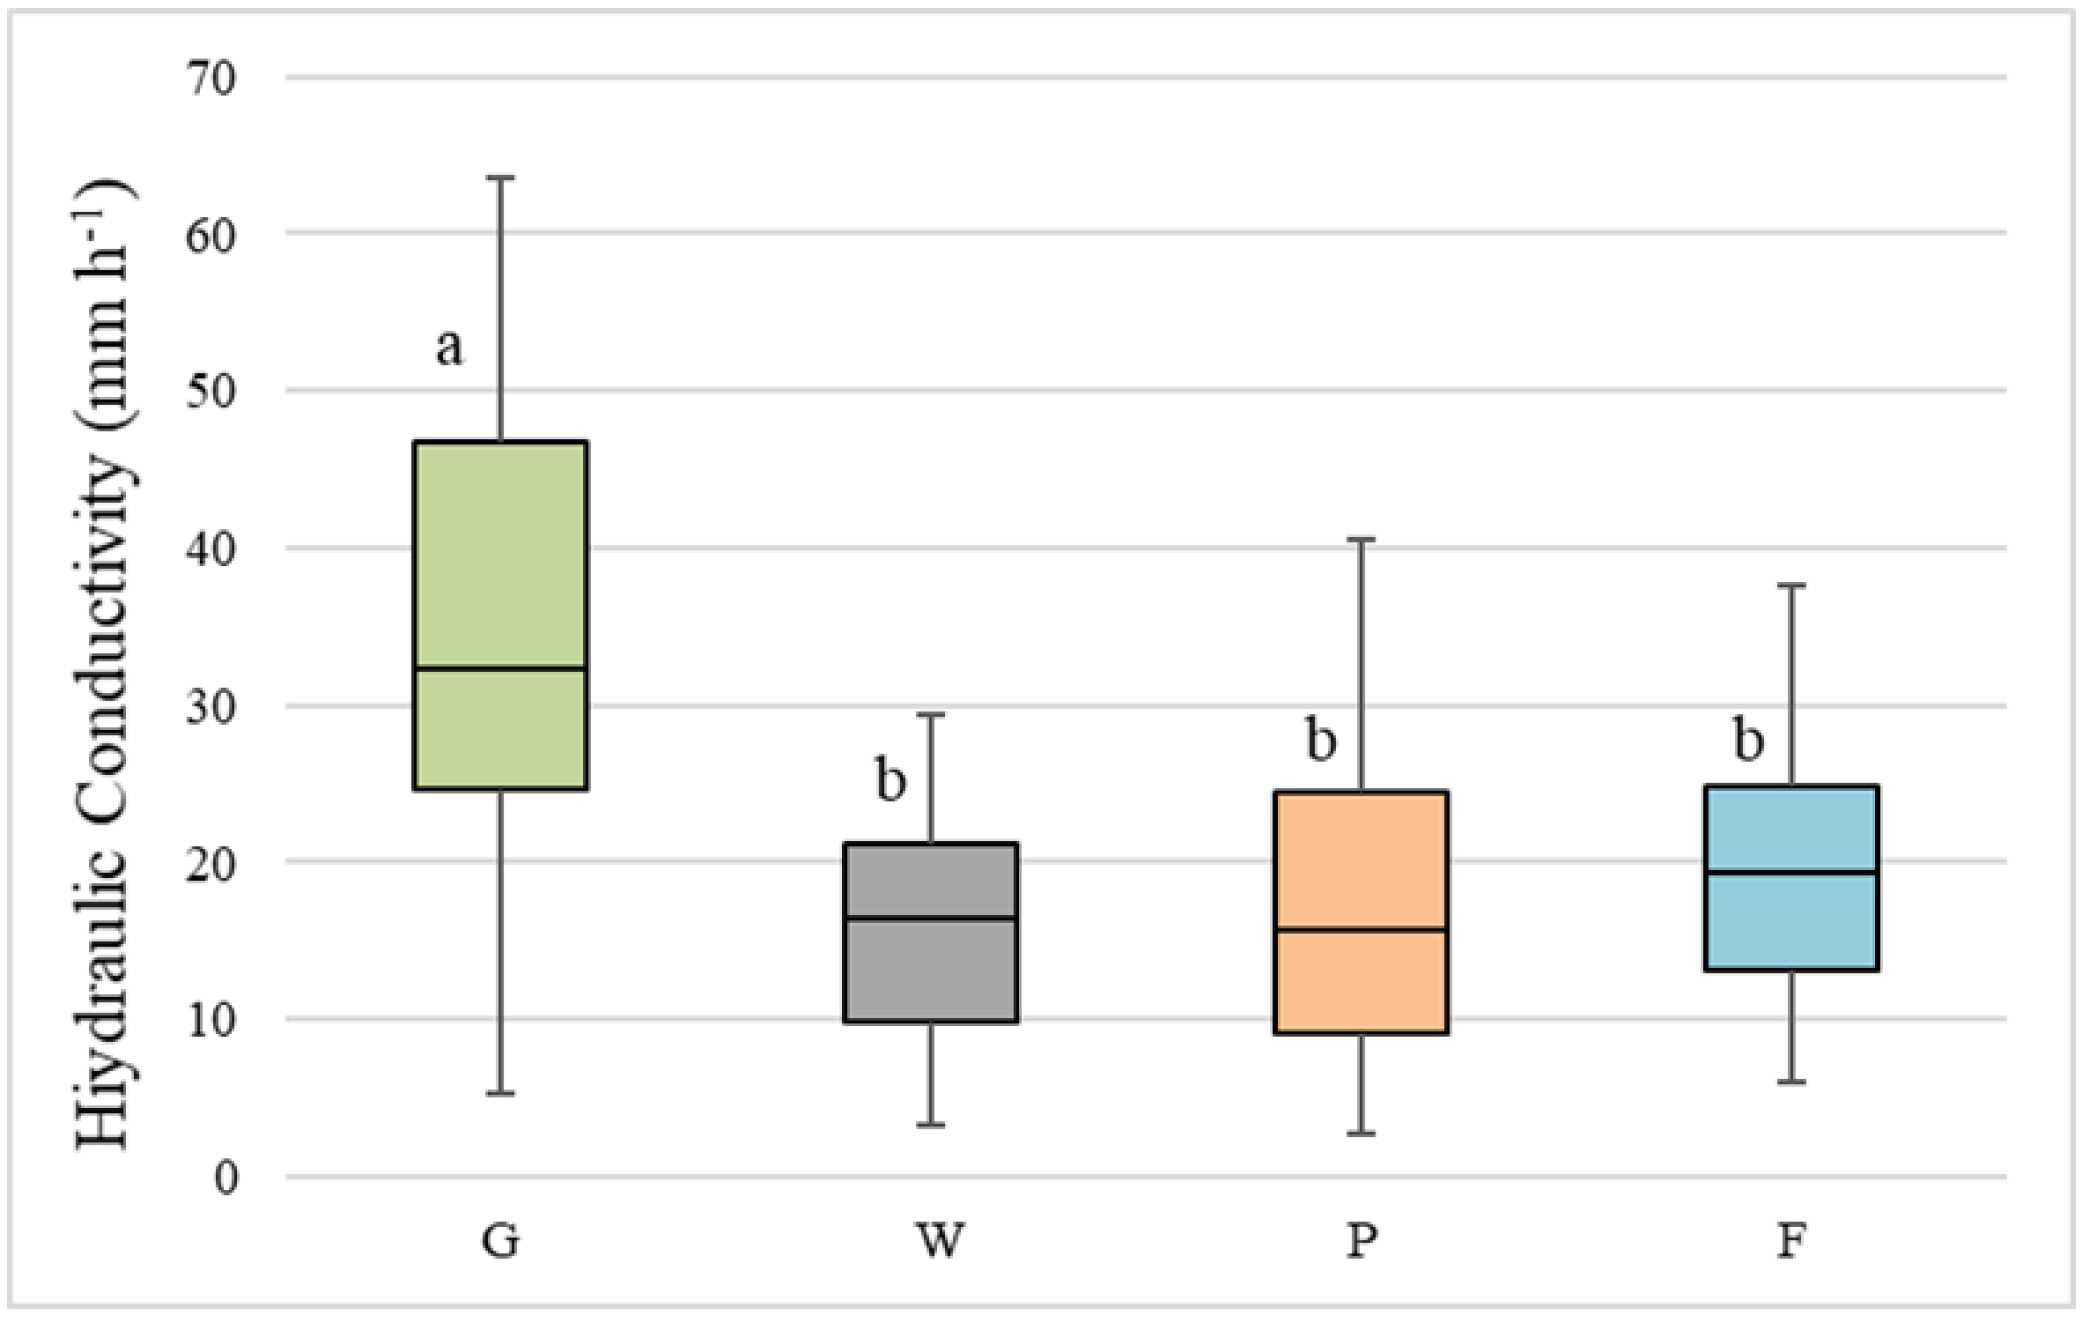
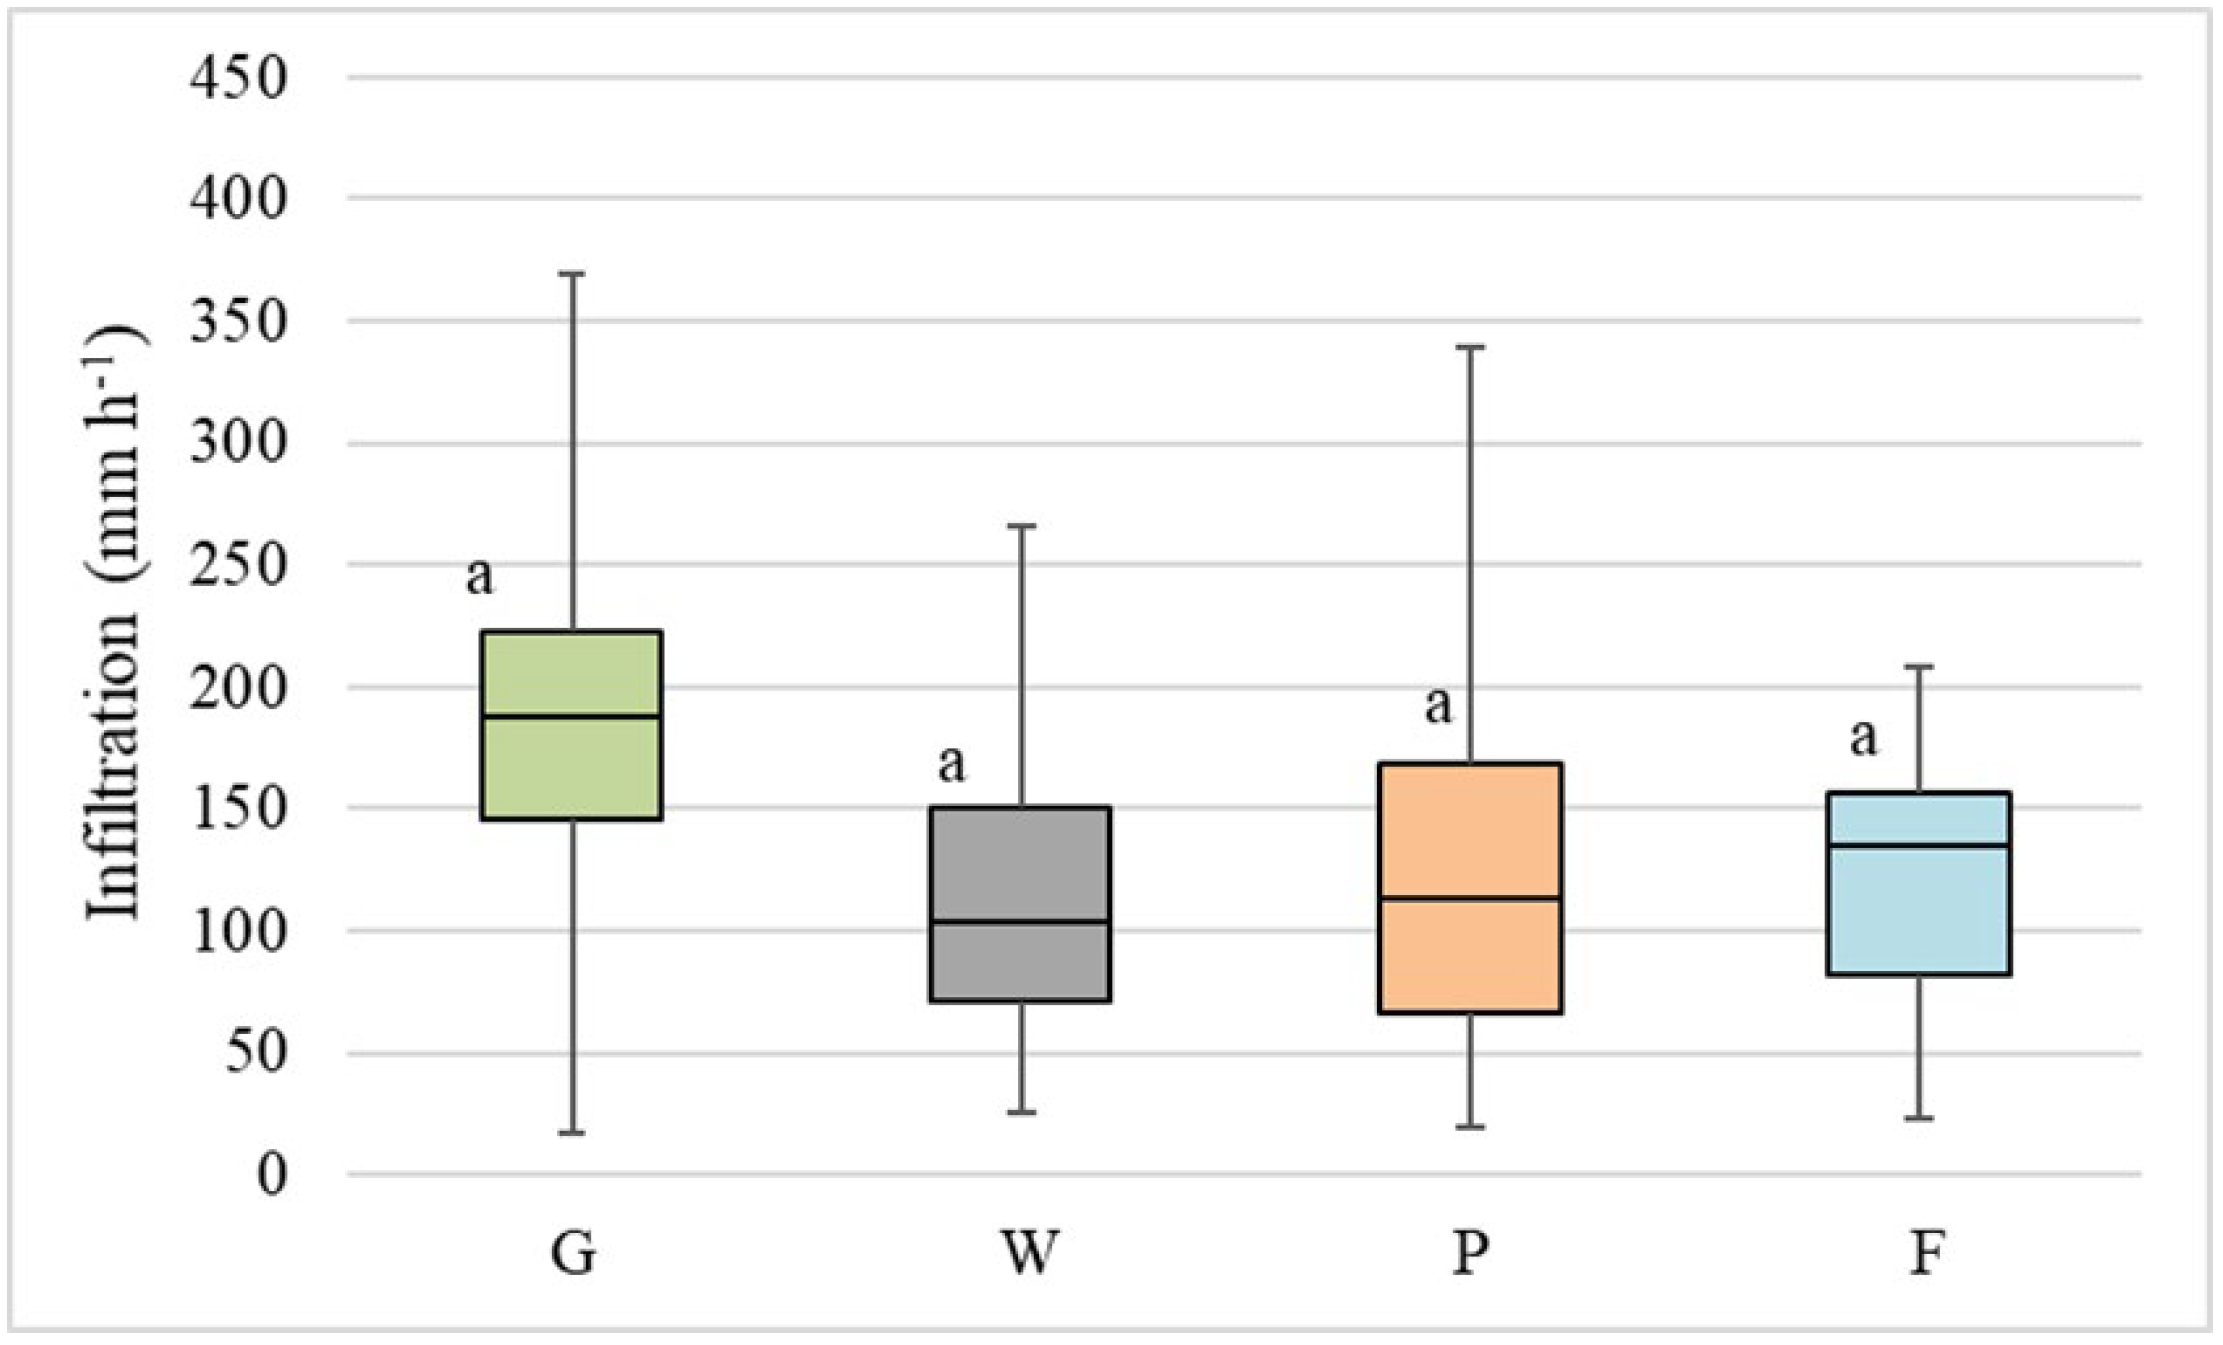
3.3. Hydraulic Conductivity and Infiltration Velocity
3.4. Soil Penetration Resistance
4. Discussion
5. Conclusions
Author Contributions
Funding
Institutional Review Board Statement
Informed Consent Statement
Data Availability Statement
Conflicts of Interest
References
- Chenoweth, J.; Anderson, A.R.; Kumar, P.; Hunt, W.F.; Chimbwandira, S.J.; Moore, T.L.C. The interrelationship of green infrastructure and natural capital. Land Use Policy 2018, 75, 137–144. [Google Scholar] [CrossRef]
- Hopkins, K.G.; Grimm, N.B.; York, A.M. Influence of governance structure on green stormwater infrastructure investment. Environ. Sci. Policy 2018, 84, 124–133. [Google Scholar] [CrossRef]
- Halecki, W.; Stachura, T. Evaluation of soil hydrophysical parameters along a semiurban small river: Soil ecosystem services for enhancing water retention in urban and suburban green areas. Catena 2021, 196, 104910. [Google Scholar] [CrossRef]
- Bonneau, J.; Fletcher, T.D.; Costelloe, J.F.; Burns, M.J. Stormwater infiltration and the ‘urban karst’—A review. J. Hydrol. 2017, 552, 141–150. [Google Scholar] [CrossRef]
- Douglas, I. The challenge of urban poverty for the use of green infrastructure on floodplains and wetlands to reduce flood impacts in intertropical Africa. Landsc. Urban Plan. 2018, 180, 262–272. [Google Scholar] [CrossRef]
- Li, C.; Yang, Z.; Chiang, P.-C.; Cai, Y.; Wang, X.; Peng, C. Mechanisms and applications of green infrastructure practices for stormwater control: A review. J. Hydrol. 2019, 568, 626–637. [Google Scholar] [CrossRef]
- Onuma, A.; Tsuge, T. Comparing green infrastructure as ecosystem-based disaster risk reduction with gray infrastructure in terms of costs and benefits under uncertainty: A theoretical approach. Int. J. Disaster Risk Reduct. 2018, 32, 22–28. [Google Scholar] [CrossRef]
- Richards, P.J.; Williams, N.S.G.; Fletcher, T.D.; Farrell, C. Can raingardens produce food and retain stormwater? Effects of substrates and stormwater application method on plant water use, stormwater retention and yield. Ecol. Eng. 2017, 100, 165–174. [Google Scholar] [CrossRef]
- Semeraro, T.; Pomes, A.; Del Giudice, C.; Negro, D.; Aretano, R. Planning ground based utility scale solar energy as green infrastructure to enhance ecosystem services. Energy Policy 2018, 117, 218–227. [Google Scholar] [CrossRef]
- Shackleton, C.M.; Blair, A.; De Lacy, P.; Kaoma, H.; Mugwagwa, N.; Dalu, M.T.; Walton, W. How important is green infrastructure in small and medium-sized towns? Lessons from South Africa. Landsc. Urban Plan. 2018, 180, 273–281. [Google Scholar] [CrossRef]
- Zhang, S.; Muñoz Ramírez, F. Assessing and mapping ecosystem services to support urban green infrastructure: The case of Barcelona, Spain. Cities 2019, 92, 59–70. [Google Scholar] [CrossRef]
- Zhang, K.; Chui, T.F.M. Linking hydrological and bioecological benefits of green infrastructures across spatial scales—A literature review. Sci. Total Environ. 2019, 646, 1219–1231. [Google Scholar] [CrossRef] [PubMed]
- Zölch, T.; Rahman, M.A.; Pfleiderer, E.; Wagner, G.; Pauleit, S. Designing public squares with green infrastructure to optimize human thermal comfort. Build. Environ. 2019, 149, 640–654. [Google Scholar] [CrossRef]
- Harrington, E.; Hsu, D. Roles for government and other sectors in the governance of green infrastructure in the U.S. Environ. Sci. Policy 2018, 88, 104–115. [Google Scholar] [CrossRef]
- Li, F.; Liu, Y.; Engel, B.A.; Chen, J.; Sun, H. Green infrastructure practices simulation of the impacts of land use on surface runoff: Case study in Ecorse River watershed, Michigan. J. Environ. Manag. 2019, 233, 603–611. [Google Scholar] [CrossRef] [PubMed]
- Herzog, C.P. A multifunctional green infrastructure design to protect and improve native biodiversity in Rio de Janeiro. Landsc. Ecol. Eng. 2016, 12, 141–150. [Google Scholar] [CrossRef]
- Berland, A.; Shiflett, S.A.; Shuster, W.D.; Garmestani, A.S.; Goddard, H.C.; Herrmann, D.L.; Hopton, M.E. The role of trees in urban stormwater management. Landsc. Urban Plan. 2017, 162, 167–177. [Google Scholar] [CrossRef] [PubMed] [Green Version]
- Trees and Permeable Paving: Future Symbionts. Available online: https://treenet.org/resources/trees-and-permeable-paving-future-symbionts/ (accessed on 5 July 2021).
- Trees. Available online: http://www.permavoid.co.uk/solutions/trees/ (accessed on 5 July 2021).
- Barwise, Y.; Kumar, P. Designing vegetation barriers for urban air pollution abatement: A practical review for appropriate plant species selection. NPJ Clim. Atmos. 2020, 3, 12. [Google Scholar] [CrossRef] [Green Version]
- Soak Up the Rain: Trees Help Reduce Runoff. Available online: https://www.epa.gov/soakuptherain/soak-rain-trees-help-reduce-runoff (accessed on 7 July 2021).
- Kirnbauer, M.C.; Baetz, B.W.; Kenney, W.A. Estimating the stormwater attenuation benefits derived from planting four monoculture species of deciduous trees on vacant and underutilized urban land parcels. Urban For. Urban Green. 2013, 12, 401–407. [Google Scholar] [CrossRef]
- Samara, T.; Tsitsoni, T. The effects of vegetation on reducing traffic noise from a city ring road. Noise Control Eng. J. 2011, 59, 68–74. [Google Scholar] [CrossRef]
- The Role of Urban Trees and Greenspaces in Reducing Urban Air Temperatures. Available online: https://www.forestresearch.gov.uk/documents/7125/FCRN037.pdf (accessed on 4 July 2021).
- Turner-Skoff, J.B.; Cavender, N. The benefits of trees for livable and sustainable communities. Plants People Planet 2019, 1, 323–335. [Google Scholar] [CrossRef]
- Ogueke, N.V.; Nwakanma, A.F.; Ngharamike, T. Energy-saving potentials of some local trees. Energy Effic. 2017, 10, 171–181. [Google Scholar] [CrossRef]
- Isaifan, R.J.; Baldauf, R.W. Estimating economic and environmental benefits of urban trees in desert regions. Front. Ecol. Evol. 2020, 8, 16. [Google Scholar] [CrossRef] [PubMed] [Green Version]
- Wang, X.; Gard, W.; Borska, H. Vertical greenery systems: From plants to trees with self-growing interconnections. Eur. J. Wood Wood Prod. 2020, 78, 1031–1043. [Google Scholar] [CrossRef]
- Mello, K.; Valente, R.A.; Randhir, T.O.; Santos, A.C.A.; Vettorazzia, C.A. Effects of land use and land cover on water quality of low-order streams in Southeastern Brazil: Watershed versus riparian zone. Catena 2018, 167, 130–138. [Google Scholar] [CrossRef]
- Aerts, R.; Dewaelheyns, V.; Achten, W.M.J. Potential ecosystem services of urban agriculture: A review. Potential Ecosyst. Serv. Urban Agric. 2016, 4, 2286v1. [Google Scholar] [CrossRef]
- Davis, A.Y.; Lonsdorf, E.V.; Shierk, C.R.; Matteson, K.C.; Taylor, J.R.; Lovell, S.T.; Minor, E.S. Enhancing pollination supply in an urban ecosystem through landscape modifications. Landsc. Urban Plan. 2017, 162, 157–166. [Google Scholar] [CrossRef] [Green Version]
- Rogers, C.M.; Hiner, C.C. Siting urban agriculture as a green infrastructure strategy for land use planning in Austin, TX. Chall. Sustain. 2016, 4, 39–53. [Google Scholar] [CrossRef] [Green Version]
- Pulighe, G.; Fava, F.; Lupia, F. Insights and opportunities from mapping ecosystem services of urban green spaces and potentials in planning. Ecosyst. Serv. 2016, 22, 1–10. [Google Scholar] [CrossRef]
- Correa, C.J.P.; Tonello, K.C.; Nnadi, E. Urban gardens and soil compaction: A land use alternative for runoff decrease. Environ. Process. 2021, 8, 1213–1230. [Google Scholar] [CrossRef]
- Hillel, D. Introduction to Soil Physics; Elsevier Academic Press: Amsterdam, The Netherlands, 1983. [Google Scholar]
- Hillel, D. Introduction to Environmental Soil Physics; Elsevier Academic Press: Amsterdam, The Netherlands, 2003. [Google Scholar]
- Silva, B.M.; Oliveira, G.C.; Serafim, M.E.; Silva, É.A.; Guimarães, P.T.G.; Melo, L.B.B.; Norton, L.D.; Curi, N. Soil moisture associated with least limiting water range, leaf water potential, initial growth and yield of coffee as affected by soil management system. Soil Tillage Res. 2019, 189, 36–43. [Google Scholar] [CrossRef]
- Purdy, A.J.; Fisher, J.B.; Goulden, M.L.; Colliander, A.; Halverson, G.; Tu, K.; Famiglietti, J.S. SMAP soil moisture improves global evapotranspiration. Remote Sens. Environ. 2018, 219, 1–14. [Google Scholar] [CrossRef]
- Singh, H.V.; Thompson, A.M. Effect of antecedent soil moisture content on soil critical shear stress in agricultural watersheds. Geoderma 2016, 262, 165–173. [Google Scholar] [CrossRef]
- Cui, G.; Zhu, J. Prediction of unsaturated flow and water backfill during infiltration in layered soils. J. Hydrol. 2018, 557, 509–521. [Google Scholar] [CrossRef]
- Villela, S.M.; Mattos, A. Applied Hydrology; McGraw-Hill: São Paulo, Brazil, 1975. [Google Scholar]
- Santos, T.E.M.; De Souza, E.R.; Montenegro, A.A.A. Modeling of soil water infiltration with rainfall simulator in different agricultural systems. Rev. Bras. Eng. Agríc. Ambient. 2016, 518, 513–518. [Google Scholar] [CrossRef]
- Loáiciga, H.A.; Johnson, J.M. Infiltration on sloping terrain and its role on runoff generation and slope stability. J. Hydrol. 2018, 561, 584–597. [Google Scholar] [CrossRef]
- Eekhout, J.P.C.; Vente, J. Global impact of climate change on soil erosion and potential for adaptation through soil conservation. Earth-Sci. Rev. 2022, 226, 103921. [Google Scholar] [CrossRef]
- Marcinkowskia, P.; Szporak-Wasilewskab, S.; Kardela, I. Assessment of soil erosion under long-term projections of climate change in Poland. J. Hydrol. 2022, 607, 127468. [Google Scholar] [CrossRef]
- Bungau, S.G.; Behl, T.; Lotfi, A.; Bourgeade, P.; Aloui-Sossé, B.; Purza, A.L.; Abid, A.; Samuel, A.D. Expatiating the impact of anthropogenic aspects and climatic factors on long term soil monitoring and management. Environ. Sci. Pollut. Res. 2021, 202, 30528–30550. [Google Scholar] [CrossRef] [PubMed]
- Map of Hydrographic Units for Water Resources Management. Available online: http://www.igc.sp.gov.br/produtos/ugrhi.html (accessed on 23 February 2021).
- Municipal Climates. Available online: http://www.cpa.unicamp.br/outrasinformacoes/clima_muni_228.html (accessed on 19 March 2020).
- Estimated Population. Available online: https://www.ibge.gov.br/estatisticas/sociais/populacao.html (accessed on 5 March 2020).
- Ministry of Science and Technology. Atlas of the Forest Remnants of the Atlantic Forest: 2008–2010 Period; SOS Atlantic Forest and National Institute for Space Research: São Paulo, Brazil, 2011.
- Brazilian Agricultural Research Corporation. Pedological Map of the State of São Paulo. Scale 1:500,000; EMBRAPA Soil: Rio de Janeiro, Brazil, 1999. [Google Scholar]
- Law n. 12651, Provides for the Protection of Native Vegetation. Available online: http://www.planalto.gov.br/ccivil_03/_Ato2011-2014/2012/Lei/L12651.htm (accessed on 20 April 2020).
- Climate. Available online: http://www.inmet.gov.br/portal/index.php?r=clima/graficosClimaticos (accessed on 14 March 2020).
- Brazilian Agricultural Research Corporation. Manual of Soil Analysis Methods, 2nd ed.; EMBRAPA Soil: Rio de Janeiro, Brazil, 2011. [Google Scholar]
- Van Genuchten, M.T. A closed-form equation for predicting the hydraulic conductivity of unsaturated soils. Soil Sci. Soc. Am. J. 1980, 44, 892–898. [Google Scholar] [CrossRef] [Green Version]
- Zhang, R. Determination of soil sorptivity and hydraulic conductivity from the disk infiltrometer. Soil Sci. Soc. Am. J. 1997, 61, 1024–1030. [Google Scholar] [CrossRef]
- Al-Shammary, A.A.G.; Kouzani, A.Z.; Saeed, T.R.; Lahmod, N.R.; Mouazen, A.M. Evaluation of a novel electromechanical system for measuring soil bulk density. Biosyst. Eng. 2019, 179, 140–154. [Google Scholar] [CrossRef]
- Li, S.; Li, Q.; Wang, C.; Li, B.; Gao, X.; Li, Y.; Wu, D. Spatial variability of soil bulk density and its controlling factors in an agricultural intensive area of Chengdu Plain, Southwest China. J. Integr. Agric. 2019, 18, 290–300. [Google Scholar] [CrossRef] [Green Version]
- Sone, J.S.; Oliveira, P.T.S.; Euclides, V.P.B.; Montagner, D.B.; Araujo, A.R.; Zamboni, P.A.P.; Vieira, N.O.M.; Carvalho, G.A.; Sobrinho, T.A. Effects of nitrogen fertilisation and stocking rates on soil erosion and water infiltration in a Brazilian Cerrado farm. Agric. Ecosyst. Environ. 2020, 304, 107159. [Google Scholar] [CrossRef]
- Allen, C.D.; Macalady, A.K.; Chenchouni, H.; Bachelet, D.; Mcdowell, N.; Vennetier, M.; Kitzberger, T.; Rigling, A.; Breshears, D.D.; Hogg, E.H.T.; et al. A global overview of drought and heat-induced tree mortality reveals emerging climate change risks for forests. For. Ecol. Manag. 2010, 259, 660–684. [Google Scholar] [CrossRef] [Green Version]
- Scheberl, A.L.; Scharenbroch, B.C.; Les, P.; Prater, J.R.; Fite, K.L. Evaluation of soil pH and soil moisture with different field sensors: Case study urban soil. Urban For. Urban Green. 2019, 38, 267–279. [Google Scholar] [CrossRef]
- Tian, Z.; Kool, D.; Ren, T.; Horton, R.; Heitman, J.L. Approaches for estimating unsaturated soil hydraulic conductivities at various bulk densities with the extended Mualem-van Genuchten model. J. Hydrol. 2019, 572, 719–731. [Google Scholar] [CrossRef] [Green Version]
- Wakode, H.B.; Baier, K.; Jha, R.; Azzam, R. Impact of urbanization on groundwater recharge and urban water balance for the city of Hyderabad, India. Int. Soil Water Conserv. Res. 2018, 6, 51–62. [Google Scholar] [CrossRef]
- Zhipeng, L.; Donghao, M.; Wei, H.; Xuelin, L. Land use dependent variation of soil water infiltration characteristics and their scale-specific controls. Soil Tillage Res. 2018, 178, 139–149. [Google Scholar] [CrossRef]
- Martín, M.Á.; Reyes, M.; Taguas, F.J. Estimating soil bulk density with information metrics of soil texture. Geoderma 2017, 287, 66–70. [Google Scholar] [CrossRef] [Green Version]
- Matsinhe, D.Z.; Pereira, S.B.; de Oliveira, R.A.; de Assis, I.R.; Oliveira, R.M. Use of PVC pipes to determine bulk density for irrigation management. Rev. Cienc. Agron. 2019, 50, 27–37. [Google Scholar] [CrossRef]
- Premrov, A.; Cummins, T.; Byrne, K.A. Bulk-density modelling using optimal power-transformation of measured physical and chemical soil parameters. Geoderma 2018, 314, 205–220. [Google Scholar] [CrossRef]
- Reichert, J.M.; Mentges, M.I.; Rodrigues, M.F.; Cavalli, J.P.; Awe, G.O.; Mentges, L.R. Compressibility and elasticity of subtropical no-till soils varying in granulometry organic matter, bulk density and moisture. Catena 2018, 165, 345–357. [Google Scholar] [CrossRef]
- Xiangsheng, Y.; Guosheng, L.; Yanyu, Y. Pedotransfer functions for estimating soil bulk density: A case study in the three-river headwater region of Qinghai province, China. Pedosphere 2016, 26, 362–373. [Google Scholar] [CrossRef]
- De Bonetti, J.A.; Paulino, H.B.; de Souza, E.D.; Carneiro, M.A.C.; Caetano, J.O. Soil physical and biological properties in an integrated crop-livestock system in the Brazilian Cerrado. Pesqui. Agropecu. Bras. 2018, 53, 1239–1247. [Google Scholar] [CrossRef] [Green Version]
- Fin, S.S.; Marchesan, E.; Gubiani, P.I.; Farenzena, J.A.P.; Murari, M.S.; Coelho, L.L.; Filho, A.C.; Aramburu, B.B. Duration of the effects of scarification and raised bed associated with vegetation cover on soybean yield on an Alfisol. Pesqui. Agropecu. Bras. 2018, 53, 1230–1238. [Google Scholar] [CrossRef]
- Levinski-Huf, F.; Klein, V.A. Organic matter and physical properties of a red latosol under an integrated crop-livestock-forestry system. Pesqui. Agropecu. Trop. 2018, 48, 316–322. [Google Scholar] [CrossRef] [Green Version]
- De Medeiros, A.S.; da Silva, T.S.; da Silva, A.V.L.; Barros, D.R.S.; Maia, S.M.F. Organic carbon, nitrogen and the stability of soil aggregates in areas converted from sugar cane to eucalyptus in the State of Alagoas. Rev. Árvore 2018, 42, e420404. [Google Scholar] [CrossRef]
- Silva, D.M.N.; Venturim, C.H.P.; Valory Capucho, M.E.O.; de Oliveira, F.L.; de Sá Mendonça, E. Impact of soil cover systems on soil quality and organic production of yacon. Sci. Hortic. 2018, 235, 407–412. [Google Scholar] [CrossRef]
- Martins, A.P.; de Costa, S.E.V.G.A.; Anghinoni, I.; Kunrath, T.R.; Cecagno, D.; Reichert, J.M.; Balerini, F.; Dillenburg, L.R.; de Carvalho, P.C.F. Soil moisture and soybean physiology affected by drought in an integrated crop-livestock system. Pesqui. Agropecu. Bras. 2016, 51, 978–989. [Google Scholar] [CrossRef] [Green Version]
- Wieder, W.; Shoop, S.; Barna, L.; Franz, T.; Finkenbiner, C. Comparison of soil strength measurements of agricultural soils in Nebraska. J. Terramech. 2018, 77, 31–48. [Google Scholar] [CrossRef]
- Samuel, A.D.; Brejea, R.; Domuta, G.; Bungau, S.G.; Cenușa, N.; Tit, M.D. Enzymatic indicators of soil quality. J. Environ. Prot. Ecol. 2017, 18, 871–878. [Google Scholar]
- Phillips, T.H.; Baker, M.E.; Lautar, K.; Yesilonis, I.; Pavao-Zuckerman, M.A. The capacity of urban forest patches to infiltrate stormwater is influenced by soil physical properties and soil moisture. J. Environ. Manag. 2019, 246, 11–18. [Google Scholar] [CrossRef] [PubMed]
- Lan, T.; Guo, S.W.; Han, J.W.; Yang, Y.L.; Zhang, K.; Zhang, Q.; Yang, W.; Li, P.F. Evaluation of physical properties of typical urban green space soils in Binhai Area, Tianjin, China. Urban For. Urban Green. 2019, 44, 126430. [Google Scholar] [CrossRef]
- Kranz, C.N.; McLaughlin, R.A.; Johnson, A.; Miller, G.; Heitman, J.L. The effects of compost incorporation on soil physical properties in urban soils—A concise review. J. Environ. Manag. 2020, 261, 110209. [Google Scholar] [CrossRef] [PubMed]
- Cherubin, M.R.; Chavarro-Bermeo, J.P.; Silva-Olaya, A.M. Agroforestry systems improve soil physical quality in northwestern Colombian Amazon. Agrofor. Syst. 2019, 93, 1741–1753. [Google Scholar] [CrossRef]
- Peng, Y.; Holmstrup, M.; Schmidt, I.K.; Schrijver, A.D.; Schelfhout, S.; Heděnec, P.; Zheng, H.; Bachega, L.R.; Yue, K.; Vesterdal, F. Litter quality, mycorrhizal association, and soil properties regulate effects of tree species on the soil fauna community. Geoderma 2022, 407, 115570. [Google Scholar] [CrossRef]
- Tresch, S.; Frey, D.; Bayon, R.L.; Rasche, F.; Fliessbach, A.; Moretti, M. Litter decomposition driven by soil fauna, plant diversity and soil management in urban gardens. Sci. Total Environ. 2018, 658, 1614–1629. [Google Scholar] [CrossRef] [Green Version]
- Martinkoski, L.; Vogel, G.F.; Jadoski, S.O.; Watzlawick, L.F. Soil physical quality under silvopastoral management and secondary forest. For. Environ. 2017, 24, e20160282. [Google Scholar] [CrossRef] [Green Version]
- Pereira, L.C.; Balbinot, L.; Matus, G.N.; Dias, H.C.T.; Tonello, K.C. Aspects of forest restoration and hydrology: Linking passive restoration and soil–water recovery in Brazilian Cerrado. J. For. Res. 2021, 32, 2301–2311. [Google Scholar] [CrossRef]
- Chai, L.; Huang, M.; Fan, H.; Wang, J.; Jiang, D.; Zhang, M.; Huang, Y. Urbanization altered regional soil organic matter quantity and quality: Insight from excitation emission matrix (EEM) and parallel factor analysis (PARAFAC). Chemosphere 2019, 220, 249–258. [Google Scholar] [CrossRef] [PubMed]
- Layman, R.M.; Day, S.D.; Mitchell, D.K.; Chen, Y.; Harris, J.R.; Daniels, W.L. Below ground matters: Urban soil rehabilitation increases tree canopy and speeds establishment. Urban For. Urban Green 2016, 16, 25–35. [Google Scholar] [CrossRef] [Green Version]
- Almeida, W.S.; Panachuki, E.; Oliveira, P.T.S.; Silva Menezes, R.; Sobrinho, T.A.; Carvalho, D.F. Effect of soil tillage and vegetal cover on soil water infiltration. Soil Tillage Res. 2018, 175, 130–138. [Google Scholar] [CrossRef]
- Wang, G.; Huang, W.; Mayes, M.A.; Liu, X.; Zhang, D.; Zhang, Q.; Han, T.; Zhou, G. Soil moisture drives microbial controls on carbon decomposition in two subtropical forests. Soil Biol. Biochem. 2019, 130, 185–194. [Google Scholar] [CrossRef]
- Chado, L.; Holanda, F.S.R.; Pedrotti, A.; Ferreira, O.J.M.; Filho, R.N.A.; Moura, M.M. Effect of vetiver roots on soil resistance to penetration in a typic fluvic neossol in the são francisco riverbank. Caatinga 2018, 31, 935–943. [Google Scholar]
- Mongil-Manso, J.; Navarro-Hevid, J.; Díaz-Gutiérrez, V.; Cruz-Alonso, V.; Ramos-Díez, I. Badlands forest restoration in central Spain after 50 years under a Mediterranean-continental climate. Ecol. Eng. 2016, 97, 313–326. [Google Scholar] [CrossRef]


Publisher’s Note: MDPI stays neutral with regard to jurisdictional claims in published maps and institutional affiliations. |
© 2022 by the authors. Licensee MDPI, Basel, Switzerland. This article is an open access article distributed under the terms and conditions of the Creative Commons Attribution (CC BY) license (https://creativecommons.org/licenses/by/4.0/).
Share and Cite
Corrêa, C.J.P.; Nnadi, E.O.; Mbanaso, F.U.; Tonello, K.C. Urban Gardens’ Potential to Improve Stormwater Management: A Comparative Analysis among Urban Soils in Sorocaba, São Paulo, Brazil. Sustainability 2022, 14, 2965. https://doi.org/10.3390/su14052965
Corrêa CJP, Nnadi EO, Mbanaso FU, Tonello KC. Urban Gardens’ Potential to Improve Stormwater Management: A Comparative Analysis among Urban Soils in Sorocaba, São Paulo, Brazil. Sustainability. 2022; 14(5):2965. https://doi.org/10.3390/su14052965
Chicago/Turabian StyleCorrêa, Carina Júlia Pensa, Ernest O. Nnadi, Fredrick U. Mbanaso, and Kelly Cristina Tonello. 2022. "Urban Gardens’ Potential to Improve Stormwater Management: A Comparative Analysis among Urban Soils in Sorocaba, São Paulo, Brazil" Sustainability 14, no. 5: 2965. https://doi.org/10.3390/su14052965
APA StyleCorrêa, C. J. P., Nnadi, E. O., Mbanaso, F. U., & Tonello, K. C. (2022). Urban Gardens’ Potential to Improve Stormwater Management: A Comparative Analysis among Urban Soils in Sorocaba, São Paulo, Brazil. Sustainability, 14(5), 2965. https://doi.org/10.3390/su14052965