Article

Comparative Study of Optimal PV Array Configurations and MPPT under Partial Shading with Fast Dynamical Change of Hybrid Load

1
Electrical Power and Machines Department, Faculty of Engineering, Cairo University, Giza 12613, Egypt
2
Department of Electrical Engineering, College of Engineering, Majmaah University, Al-Majmaah 11952, Saudi Arabia
*
Author to whom correspondence should be addressed.
Sustainability 2022, 14(5), 2937; https://doi.org/10.3390/su14052937
Submission received: 14 January 2022 / Revised: 11 February 2022 / Accepted: 24 February 2022 / Published: 2 March 2022

Abstract

:
The characteristics of photovoltaic (PV) are directly affected by partial shading (PS) conditions due to the non-uniform irradiance. The PV system can be compromised based on the shading pattern as well as the shading area. Thus, the need for a solution that can deal with non-uniform irradiance has increased significantly. Consequently, this paper proposes a thorough analysis of the impact of PS patterns on different PV array configurations such as SP, TCT, and BL. The five optimization algorithms PSO, DA, MLS-SPA, IGWO, and BWO, were used to tune the variable step of the conventional P&O technique to extract the maximum power point. The proposed PV array is 4 × 4 with a fixed location, yet changing electrical connections. The main objective and novelty of this paper is to locate the Global Maximum Power Point (GMPP) of a PV array while the occurrence of different PSC with fast change of hybrid load e.g., (resistive and pump load). The results showed the superior performance of the IGWO algorithm regarding the maximum power tracking and disturbance rejection.

1. Introduction

During the past decade, renewable energy has been grown rapidly around the globe as an essential resource for electricity. Mostly in the booming economies such as India, there is a demand for finding a clean resource for energy with less carbon emissions [1]. Generating energy from renewable resources requires various conversions from wind, hydro, solar, etc., however those resources are considered promising for countries seeking clean energy [2]. From the different types of renewable resources, solar or photovoltaic (PV) energy is the most common for electricity generation due to various merits such as reliability, low-cost maintenance, and zero polluting emissions [3,4]. Generating electricity from solar energy is performed using PV cells which have a non-linear current–voltage (I–V) relation along with Maximum Power Point (MPP) on power–voltage (P–V) characteristic curve [5]. As the PV system output power relies directly on the amount of solar irradiance and surrounding temperature, that creates a considerable limitation in the system efficiency [6]. PV module efficiency can be affected by the phenomenon of Partial Shading (PS). Partial shading can occur due to clouds, buildings, snow, and trees. PS occurrence has a direct effect on the (P–V) and (I–V) characteristics of PV modules [7]. The changing of solar irradiance on the module causes power losses within the system which affects the efficiency. In order to protect the PV cells from the effect of hot spots, diodes are used to change the connections of the PV modules based on Maximum Power Point Tracking (MPPT).
To reduce the partial shading losses, different PV array configurations are proposed such as Series (S), Parallel (P), Series-parallel (SP), and Total Cross Tied (TCT) [8]. Different studies focused on the impact of partial shading and the solutions to reduce the PS losses with various PV configurations and topologies. In [9] PV modules with polycrystalline and Copper Indium Gallium Selenide (CIGS) are tested to study the impact of PV modules faults regarding power losses. The authors in [10] utilized a simulation of nine PV array panels with configurations; SP, TCT, and Bridge-Linked (BL) to test the ideal and non-ideal switch conditions. The idea of the research was to minimize Mismatch Losses (ML) using the minimum number of switches between PV arrays and to harvest the maximum power.
The researchers in [11] proposed a dynamic topology reconfiguration based on a switching matrix aiming to reduce the ML. The approach was applied to different PV schemes including SP and TCT. To avoid the occurrence of peak points within a PV array, Ref. [12] presents a static shade dispersion physical array relocation (SD-PAR). The technique is tested on a 3 × 3 PV array to reduce the ML caused by PS conditions. The method used has proven that PV arrays with SDP can reach a higher maximum power than the one reached via conventional configurations.
Seeking lower cost and complexity, many other static reconfiguration techniques were proposed such as Su Do Ku puzzle-based shade dispersion, optimal Su Do Ku, and Competence Square (CS) [13,14].
A comprehensive review conducted by Dileep and Singh in [15] discusses the soft computing methods applied with MPPT controller. The review covered the advantages and drawbacks of various computing techniques such as Fuzzy Logic (FL), Artificial Neural Network (ANN), nonlinear predictor, Differential Evolution (DE), and metaheuristic optimization algorithms such as Particle Swarm Optimization (PSO), Gray Wolf Optimization (GWO), and Ant Colony Optimization (ACO). In the literature, many conventional techniques including Open-Circuit (OC) voltage, fractional Short Circuit (SC), and Perturb and Observed (O&P) were investigated based on their performance. For fractional SC and OC voltage methods, the solution mainly depends on the linear relation between the voltage and current which may lead to inaccurate MPP value [16,17]. Recognizing the stated limitations for the conventional algorithms, many researchers tried to apply artificial intelligence methods such as ANN for MPPT application, however, the results showed ANN requires a huge data set for training which in return consumes a relatively huge memory space. This disadvantage increases the complexity and total cost for such systems [18].
A different approach is followed in [19] to restructure the PV array dynamically. The authors used a Marine Predator Algorithm (MPA) along with a novel objective function instead of the conventional weighted objective functions. Different optimization algorithms such as PSO were used as reconfiguration techniques. For dynamic reconfiguration, Ref. [19] proposed an adaptive technique that separates the PV array into adaptive and fixed portions using switches. In [20], novel algorithms were proposed to mitigate the impact of PS as well as track the Global Maximum Power Point (GMPP). The authors applied Moth-Flame Optimization (MFO), GWO, Slap Swarm Algorithm (SSA), along with hybrid PSO-Gravitational Search Algorithm (PSO-GSA). Another study used a hybrid algorithm (HA-PSO) for the capacity configuration of PV array under PS conditions [21]. Fuzzy Logic Control (FLC) is also used to overcome the uncertainty of PV array caused by varying solar irradiance in [22]. Numerous meta-heuristic algorithms were used for MPPT as a solution for the PS such as in [23] where ACO was used with different control parameters as a convergence method.
Motivated by the findings from the conducted review, this research presents an approach to minimize the PS effects on solar PV modules based on the MPPT design strategy. The strategy involves applying multiple optimization algorithms including PSO, Dragonfly Algorithms (DA), MLS-SPA algorithm, Improved Gray Wolf Optimizer (IGWO), and Black Widow Optimization Algorithm (BWOA). The proposed methods aim to find the optimum way of PV array allocation to reverse the impact of PS by dynamically changing the array configuration under PS conditions. The implementation of optimization algorithms was essential in determining the optimum step size of the conventional P&O MPPT controller. The proposed controller is a hybrid metaheuristic P&O controller to reconfigure the PV array in the case of PS. The selected optimization algorithms have proven to have superior behavior in the field of optimization based on their computational ability and fast convergence [24]. Methods such as PSO and GWO have been proven to have a robust and adaptive behavior in Electrical Array Reconfiguration (EAR) to perform shade dispersion [25].
The remaining parts of the paper are organized as follows: Section 2 includes three subsections, Section 2.1, discusses the mathematical model of the proposed PV system based on single diode structure, Section 2.2 presents the main PV configuration used in this study, and Section 2.3 discusses the characteristics of the system under different PS conditions. Section 3 formulates the objective function for the system. Section 4 presents the applied optimization algorithms. Section 5 presents the performance indices to be used in the comparison. Section 6 is dedicated to the simulation process and results. Lastly, Section 7 discusses the conclusion and the potential for future work.

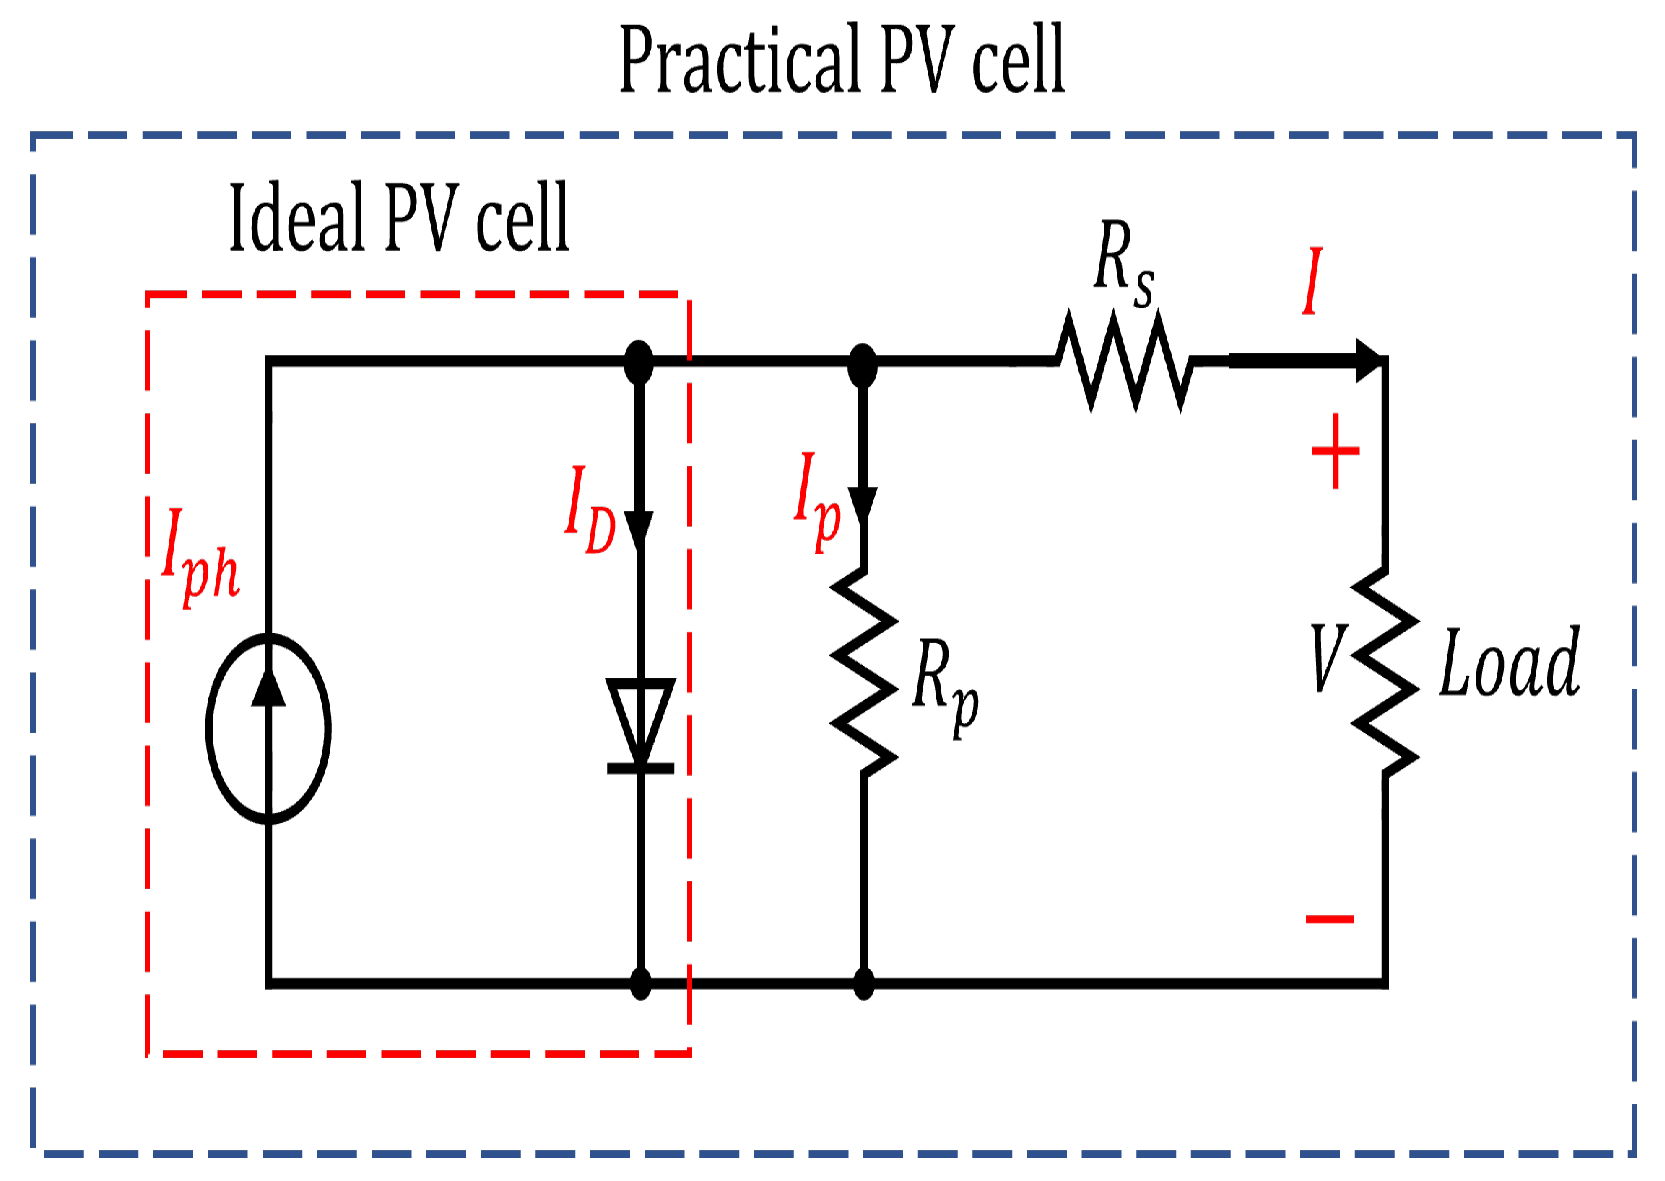
2. PV Module Modeling

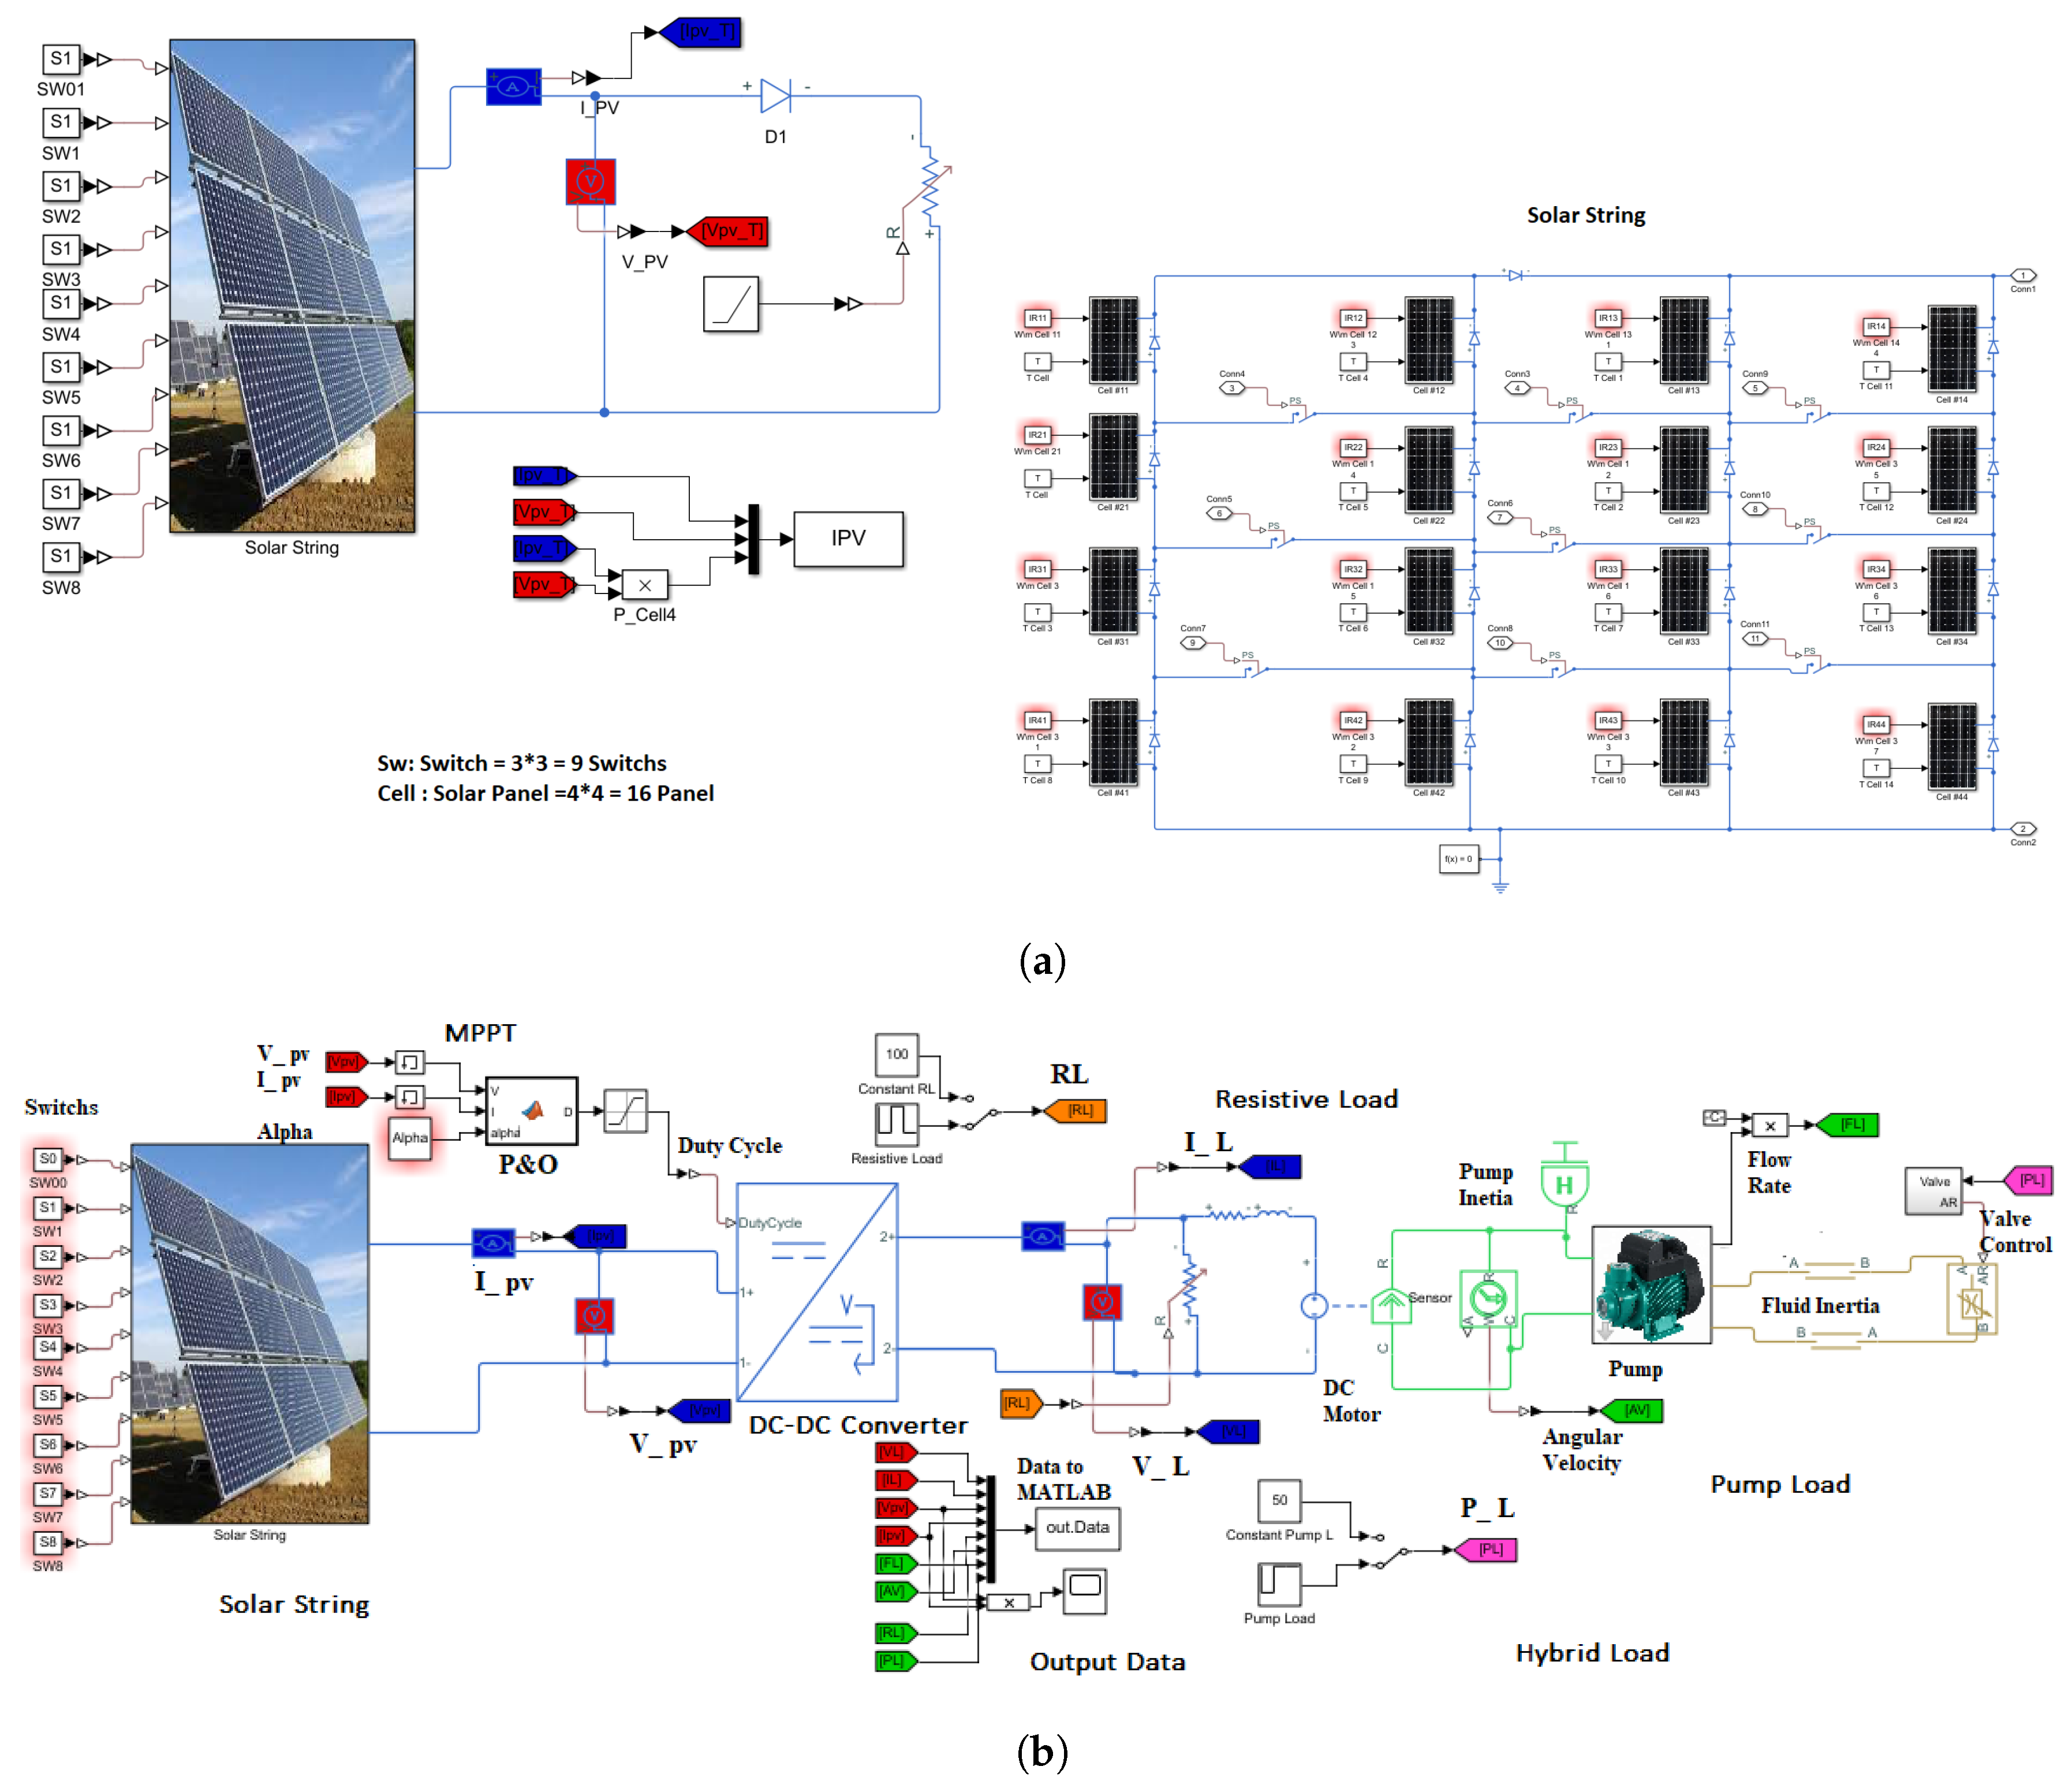
2.1. System Modeling

Obtaining an accurate model of a PV cell is crucial for improving the effectiveness of the PV system. Due to the nonlinearity of a PV cell, many researchers have proposed various modeling techniques to emulate the real-time behavior of the system [26]. In [27] the authors proposed a PV model using a single diode, in [28] a two-diode model is proposed which resorts to a more complicated model and different approach to obtain the main system parameters. In [29] a three-model PV model is used which has the highest complexity in estimating the system nine parameters, yet it is suitable for specific applications.
Here, the single-diode model is adopted due to its simplicity and accuracy in describing the nonlinear behavior of the system. A single-diode model contains one p-n junction diode connected in parallel with a current source I p h . The model also contains series and shunt resistances R s and R p , respectively [30]. The electrical circuit schematic diagram is shown in Figure 1.
By applying Kirchhoff’s current law to the equivalent circuit, the value of the output current from each PV model can be calculated as follows:
I = I p h I D I p
where I D is the current passing through the diode, I p h is the generated by the source, and I p is the current of flowing through the shunt resistance R p . The nonlinearity of the model can be described by substituting I D and I p with their equivalent equations as follows:
I = I p h I 0 [ exp V + I R s V t 1 ] V + I R s R p
where V t is the thermal voltage of the diode and I 0 is the leakage current. The thermal voltage of the diode can be calculated from the following formula:
V t = N s K T q
where K is the Boltzmann constant = 1.3805 × 10 23 J/K, N s is series connected cells, q is the electron charge, and T is the temperature of the cell in kelvin. As the total power of the PV cell depends on the environmental conditions, then the current of the PV source I p h is calculated as follows:
I p h = G G 0 [ I s c + K i ( T T 0 ) ]
where I s c is the short-circuit current in standard test conditions in which T = 25 °C, and G 0 = 1000 W/m2, K i is the current coefficient factor. G, and T are the actual vales of the irradiance and temperature, respectively. The reverse leakage current of the diode I 0 mainly relies on the temperature as given in Equation (5) [31].
I 0 = I s c + K i Δ T exp V O C + K v Δ T / a V t 1
where I s c is the short-circuit current, V O C is the open-circuit voltage at Standard Test Conditions (STC), and K v is the temperature coefficient of open-circuit voltage (V/kelvin).

2.2. Problem Formulation

The main focus of this study is the behavior of PV modules under PS cases and enhancing the MPPT under dynamical hybrid load change. The fault of PS is analyzed and studied on the PV module in Table 1. The system consists of a 4 × 4 PV cell array with initial SP interconnection. Each PV string is connected with switches to the next string and the optimized configuration will be based on the state of these switches. The initial topology of the system is simulated using MATLAB Simulink as shown in Figure 2. The configuration of the PV array will be changed based on the different PS cases to reach the optimum topology for the system. A comparison will be conducted between three main interconnection topologies: SP, BL, and TCT.
In SP configuration PV cells are connected together in series to form strings and strings are connected in parallel to generate the desired output voltage Figure 3. SP is considered an economical topology due to installation simplicity and minimization of redundant connections. The total current of the SP PV array is the summation of string current, and the array voltage is the same in the string current.
The BL configuration is similar to the SP connection regarding the PV string connections; however, BL topology can partially solve the main disadvantage of the SP connection. In SP PV connection, if one module experienced a malfunction or PS, the overall voltage of the array will drop drastically. To overcome this issue, in BL the series-connected modules have bridge rectifiers connected to them as shown in Figure 3. This topology is referred to as Bridge-Linked (BL) PV array.
In the Total Cross Tied (TCT) PV array, the connection approach between the modules is different as the cell or modules are originally connected in parallel to form rows. The rows are then connected in series as shown in Figure 3. This topology is considered one of the complex PV connections, yet one of the most reliable connections regarding minimizing power losses [32]. PV array configuration and interconnection have a direct impact on the generated total power as shown in Table 2.

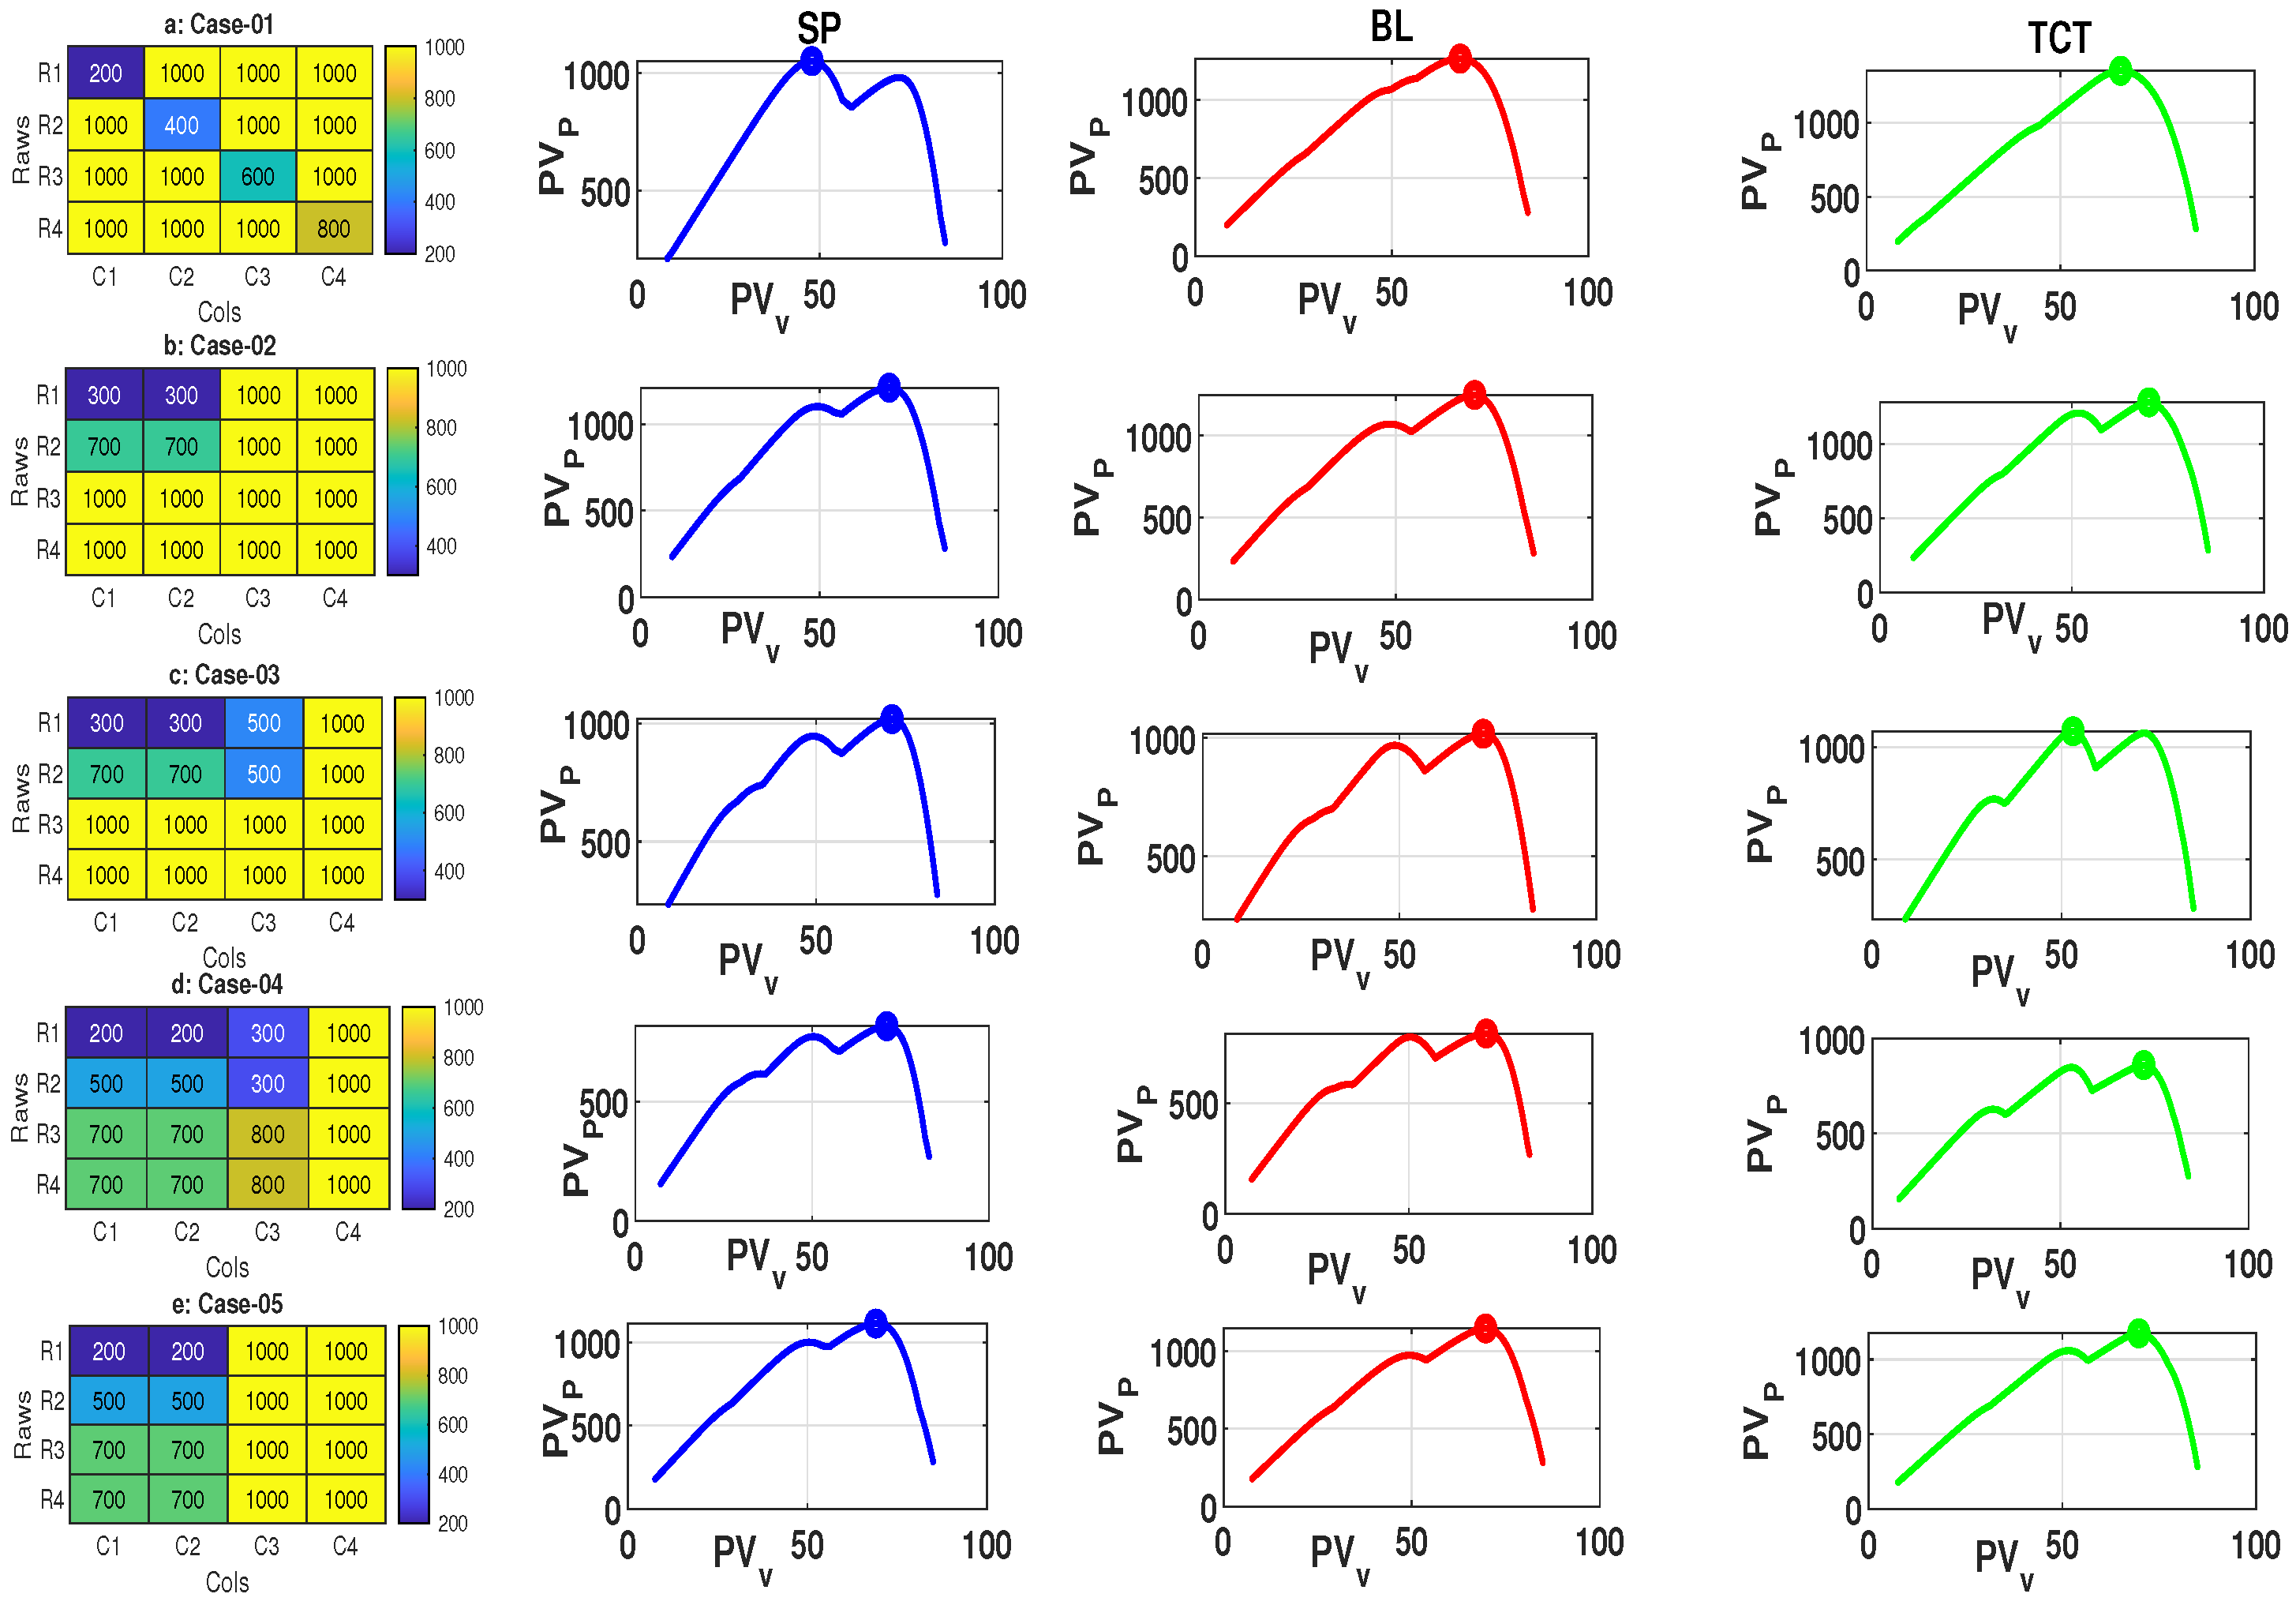
2.3. Partial Shading Conditions

The shading effect happens partially on the PV module and without any prior expectations, which causes power losses. Based on the number of shaded cells in the PV array, the condition of PS can be determined to be one of the following examples: diagonal shaded; short and narrow; short and wide; long and wide; long and narrow. The P–V characteristics for each of the mentioned cases are studied with the main three array configurations: SP, BL, and TCT.

2.3.1. Diagonal Shading (Case 01)

Four cells along the diagonal of the PV array are shaded in this condition. Each module is subjected to different solar irradiance values; 200, 400, 600, and 800 W/m2, as shown in Figure 4. The figure also shows the impact of the diagonal shading on SP, BL, and TCT PV configuration, respectively.

2.3.2. Short and Narrow Shading (Case 02)

In short and narrow partial shading conditions, the number of shaded strings and modules per string will be less than half the number of all modules and strings. Applying this case of shading, the modules in the PV array is categorized with different values of solar irradiance as shown in Figure 4. The array is divided into three groups with solar irradiance values of 300, 700, and 1000 W/m2.

2.3.3. Short and Wide Shading (Case 03)

This shading condition occurs when more than half of the strings are shaded along with two shaded modules in each string. In this condition solar irradiance values are 300, 500, 700, and 1000 W/m2. Figure 4 shows the PV array configuration under this shading condition.

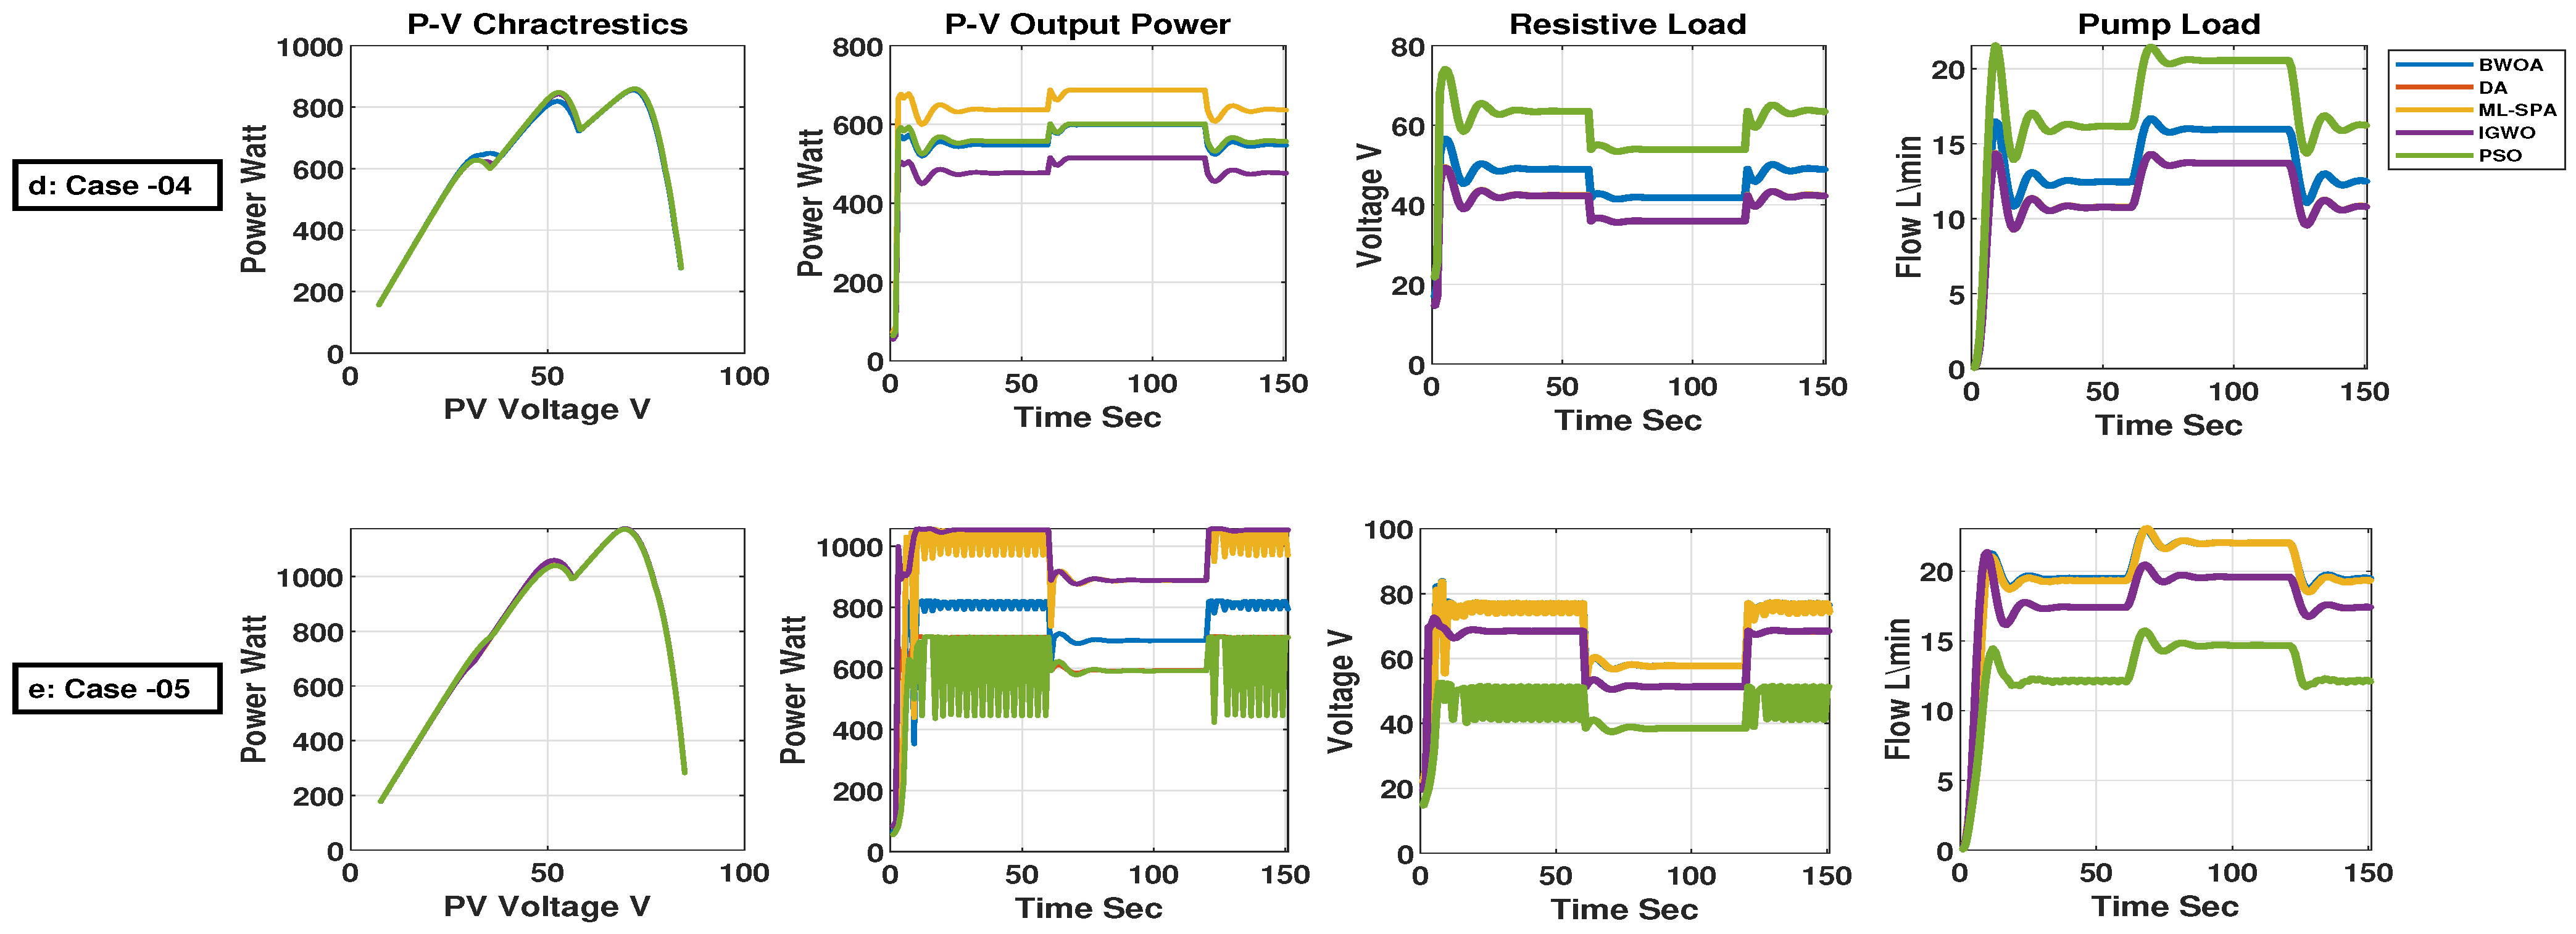
2.3.4. Long and Wide Shading (Case 04)

Three strings are shaded out of the total four and three modules in each string are shaded to represent the long and wide shading condition. In this case, solar irradiance on the PV modules has five values as shown in Figure 4.

2.3.5. Long and Narrow Shading (Case 05)

For this case, two strings out of four are shaded along with all the four modules in each string. The shading is long compared to the total length of the string and narrow compared to the number of modules in each string. The solar irradiance is categorized into four groups of values of 200, 500, 700, and 1000 W/m2 as shown in Figure 4.
The maximum power generated by the PV array under the different shading conditions is shown in Table 3.

3. Optimization Problem Formulation
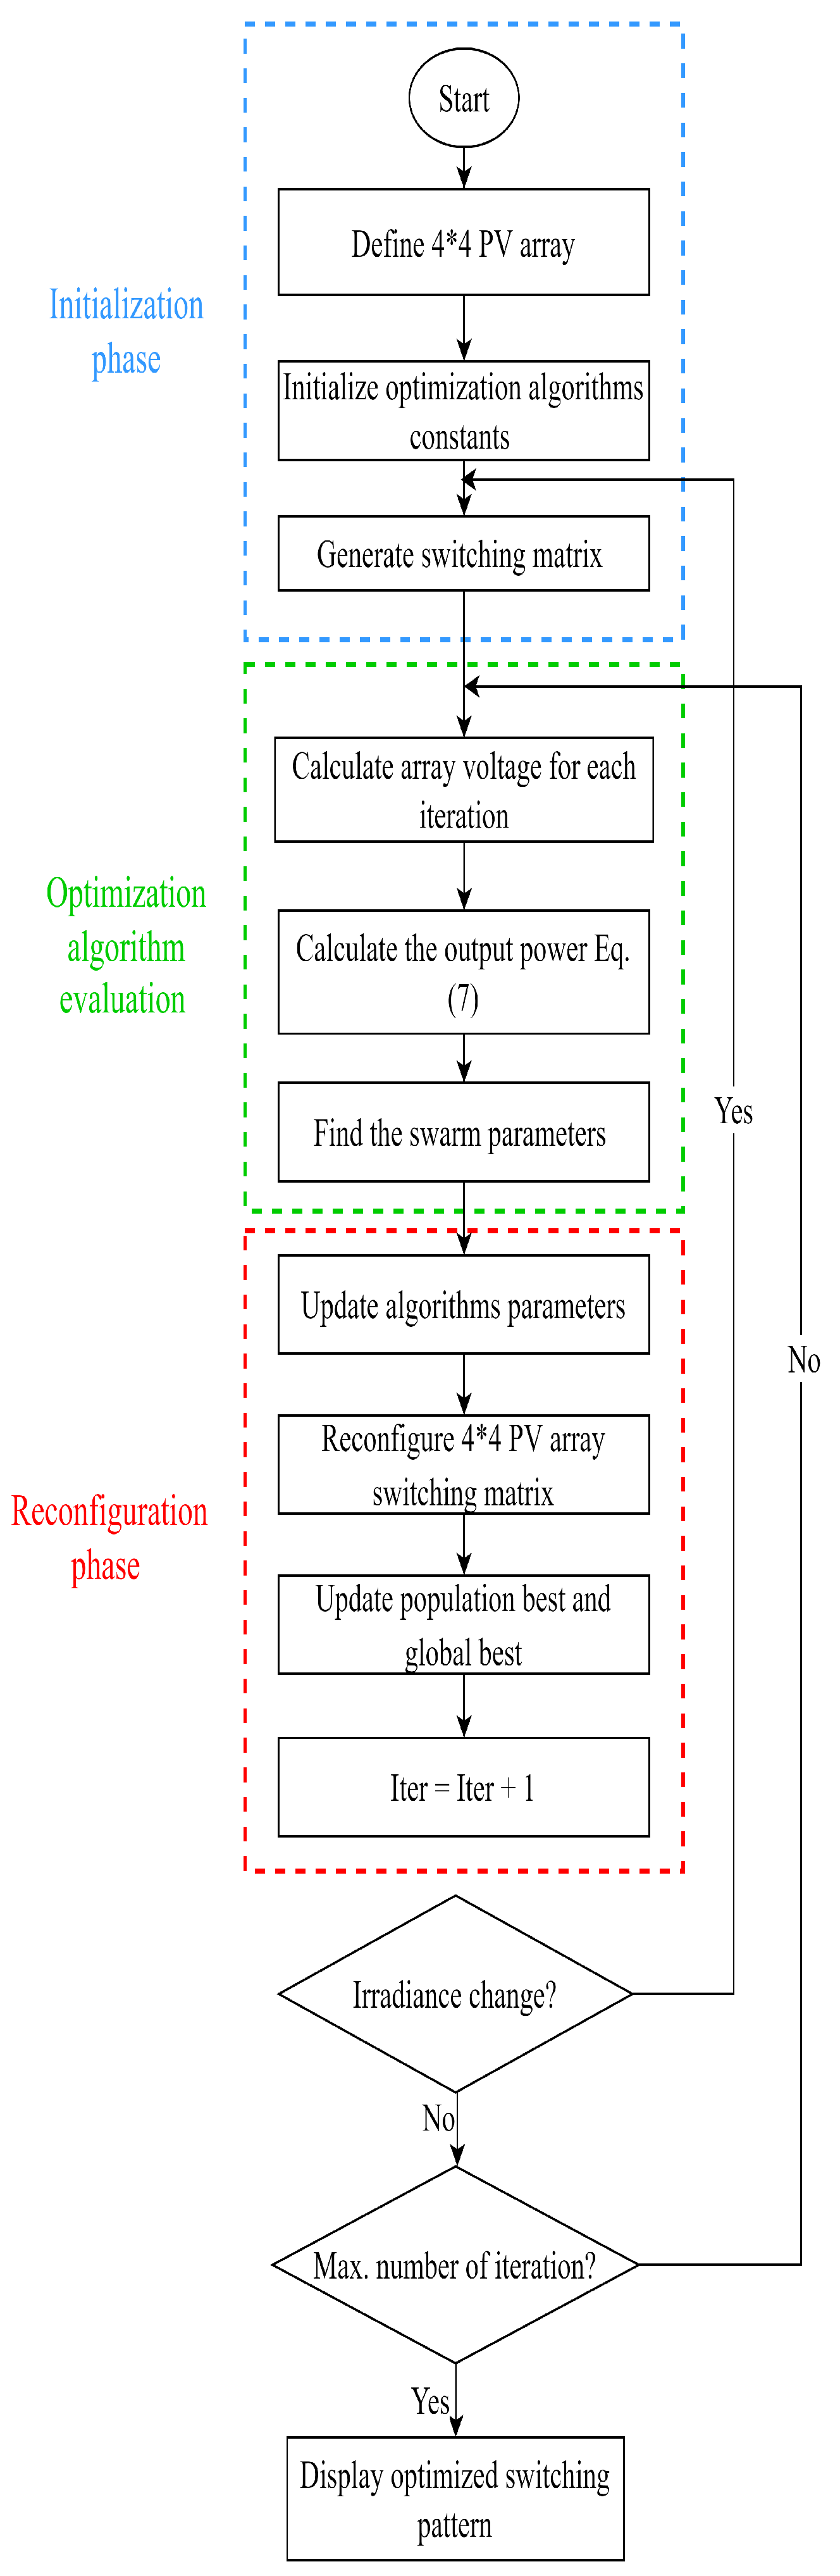
The main objective of is to locate the Global Maximum Power Point (GMPP) of a PV array while the occurrence of different PSC. Different optimization techniques have been used to enhance the maximum power tracking and reduce the power losses of partial shading effect. PV array current is considered as the design parameter, and the generated power is the main objective function. Equation (6) represents the terminal voltage of the triple junction PV array.
V a r r = m × n Cell i = 1 i = 3 n i K B T q ln I L i I I O i + 1 I × R S
where m and n Cell are the number of series modules and the number of cells per module, respectively. Equation (7) calculates the generated power by the array through both the terminal voltage and current. The equation represents the objective function which is maximizing the generated PV array power by configuring the panels.
The maximization approach is to search the value of voltage V to achieve MPP by changing the duty cycle of the boost converter. The methodology of P & O in [33] is illustrated in steps to achieve the maximum power point tracking with the hybrid load (resistive and pump parallel loads). The optimization objective consists of two main steps, it starts with assigning the shadow pattern on the array to the optimal configuration to get the maximum power. Then tune P & O MPPT to achieve the maximum power point tracking with the hybrid load by getting the optimal step of P & O ( α ).
P arr = V arr × I = m × n Cell i = 1 i = 3 n i K B T q ln I L i I I O i + 1 I × R S × I
The implementation of using bio-inspired optimization algorithms with PV array configuration has two main merits. The advantages can be described as the fast convergence to the optimum interconnection pattern that achieves the shades dispersion, the parallel computation that allows reaching the best solution in a short time period. The methodology of applying the mentioned optimization algorithms is shown in Figure 5 and detailed as follows:
Step 1:
Initialize PV array size ( 4 × 4 ), optimization algorithms constants.
Step 2:
Generate the switching matrix to determine the needed PV array configuration.
Step 3:
Start the iteration with calculating the voltage of the PV array from Equation (6)
Step 4:
Calculate the generated power from the array using Equation (7). Both array voltage and power are calculated based on irradiance.
Step 5:
Update the parameters of the different used optimization algorithms. The velocity and positions of each population will be updated based on the associated equations.
Step 6:
Reconfigure the PV array and the switching matrix. The algorithms will be reinitialized whenever there is a change in solar irradiance caused by PS conditions. The change in current and voltage of the array will indicate whether the interconnection needs to be updated or not.
Step 7:
The process will be repeated from steps 3 to 6 until the termination criterion is met.

4. Applied Optimization Algorithms

4.1. Particle Swarm Optimization

For solving nonlinear stochastic problems, PSO was proven one of the most powerful algorithms in optimization problems. PSO algorithms are mainly inspired by the behavior of swarms such as fishes, birds, etc. [34]. In this algorithm, an artificial particle searches for the optimum solution through sharing information with other particles in the swam x in n dimensional solution space [35]. In order to reach the optimum solution within the boundaries of the solution space, each particle is required to keep track of its best position denoted by p b e s t and the best position of the surrounding swarm S b e s t [36].

4.2. Dragonfly Optimization Algorithm

The Dragonfly Algorithm (DA) mimics the swarming behavior of the dragonfly insects. In the static swarming, a sub-group of dragonflies are formed as they fly around different areas for hunting which emulates the exploration phase in metaheuristic optimization. On the other hand, in dynamic swarming larger groups of dragonflies are formed to fly in the same direction which describes the exploitation phase [37]. Through the studying of swarm behaviors, there are five main followed principles for survival: separation alignment, cohesion, attraction to a food source, and distraction of outward enemies [38].
Using the same analogy used in PSO, the position of the artificial dragonfly is determined based on two vectors: step ( Δ X ) and position (X). The step vector and position vector can be calculated as in (8) and (9), respectively.
Δ X t + 1 = ( s S i + a A i + c C i + f F i + e E i ) + w Δ X t
X t + 1 = X t + Δ X t + 1
where s, a, and c are the separation weight, the alignment weight, and the cohesion weight, sequentially. f is the food factor and e is the enemy factors. w represents the inertia weight and t is the iteration counter. In case of the absence of a neighboring dragonfly, the position updating process is done using the Levy flight technique. Equation (10) shows the enhancement done to the searching process using Levy flight approach [39].
L e v y ( x ) = 0.01 × r 1 σ r 2 1 1.5
where r 1 and r 2 are two random numbers, and σ can be calculated as in [37].

4.3. MLSHADE-SPA Algorithm

4.4. Basic LSHADE

Differential Evolution (DE) is a numerical optimization for evolutionary algorithms in which the population can be represented as vectors x i = x 1 , , x D where i = 1 , , N as N is the population size, and D is the dimension of the problem [40]. Various enhancements have been done to DE to solve different multi-strategy and single-objective optimization problems. One of these enhancements is the success-history-based adaptive DE with linear population size reduction (LSHADE) [41].

4.5. MLS-SPA Description

Based on hybridization between CMA-ES and semi-parameter adaptation (LSHADE-SPA), a multi-strategy LSHADE (MLS-SPA) algorithm is developed to enhance population diversity based on weighted mutation strategy [42]. The developed algorithm enhances the search strategy of both the exploration and exploitation processes. The framework of the MLS-SPA algorithm can be effectively applied to multi-objective problems by selecting correlated dimensions to identify the problem mechanism. The framework of the MLS-SPA starts with the initialization of the following mutation strategies: Enhanced adaptive differential evolution (EADE), Adaptive DE with Novel Triangular Mutation Strategy (ANDE), Modified Multiple Trajectory Search (MMTS), and Semi-Parameter Adaptation (SPA). The framework computational resource m a x _ n f e s is divided into multiple rounds based on the application. The population-based algorithms (EAs) will be used during the first half of the rounds r o u n d _ n f e s and for the second half, the MMTS algorithm will be used. The algorithm LSHADE-SPA will use the available resources for the optimization during the first half of each round. For each round, the population performance will be calculated as follows:
ω a l g r = i = 1 n f ( x ) f ( u ) C C n f e s a l g r
where f is the fitness function calculated using a l g algorithm. The next step will be to use the population performance algorithm ω a l g r to calculate the improvement ratio i m p a l g r :
i m p alg r = max 0.1 , ω alg r a l g = 1 n alg ω alg r
The computational resource will be calculated using i m p a l g r as follows:
C C n f e s a l g r = ( 1 α ) C C n f e s a l g r 1 + α 0.5 E A n f e s r i m p a l g r 1
The population size for MLSHADE-PSA will be calculated based on linear population size reduction (LPSR) as follows:
N r + 1 = round N init N min 0.5 m a x _ n f e s n f e s + N init
where N init is the initial population size and N min = 20.

4.6. Improved Gray Wolf Optimizer

Improved Gray Wolf Optimizer (IGWO) is an algorithm inspired by the behavior of the gray wolf packs. The algorithm mimics the patterns of wolves pack while hunting as well as the social and leadership behaviors. The hunting process starts with encircling the prey, hunting, then attacking. The mathematical representation of the hunting steps along with the IGWO algorithm can be found in [43].

4.7. Black Widow Optimization Algorithm

Black Widow Optimization Algorithm (BWOA) is a bio-inspired optimization algorithm that mimics the mating behavior in black widow spiders. The most unique part of the mating behavior is the stage named cannibalism. Within this stage, the individuals with inappropriate fitness are neglected from the circle which leads to fast and early convergence. The algorithm starts with the initial population and goes through the cannibalism stage as a third step, then ends with convergence and updating the parameters. The mathematical representation for the algorithm can be found in [44].

5. The Proposed Performance Indices

In order to ensure the performance of the proposed optimization techniques with different PSC conditions and MPPT performance under fast dynamical hybrid load. The following indices have been used:

5.1. Shading Loss

The term shading loss can be defined as the difference between the maximum power generated from the PV array without any shading effect, and the summation of the module’s maximum power under PS. Shading loss is calculated as follows:
P shading loss = P max . u P max i

5.2. Mismatch Loss

Definition of mismatch loss is the difference between the summation of modules’ maximum power and the GMPP affected by PS conditions. Mismatch loss is calculated from:
P mismatch loss = P max P G M P P
where P mismatch loss is the mismatch loss, P max is the sum of the individual maximum power of the modules, and P G M P P is the global maximum power point under PS conditions.

5.3. Fill Factor

The Fill Factor (FF) concept is defined as the ratio between the global maximum power and the product of the open-circuit voltage and short circuit current under the PS conditions. The fill factor is given by:
F F = P G M P V O C × I s c
where P G M P is the global maximum power point under PS conditions, V O C open-circuit voltage of the array, and I s c is the short circuit current.

5.4. MPPT Performance

The expression for the MPPT efficiency is given by
η mppt = i P PV · Δ T i j P max · Δ T j
where P PV and Δ T i refer to the actual output power and its duration, respectively, and P max and Δ T j represent the theoretical maximum power and the duration with P max , respectively.

6. Simulation Results and Analysis

This section will represent the comparative analysis for the maximum powers generated under the PS cases with dynamical load variation. The simulation results have been performed with dynamical profile change of the hybrid load components (resistive and pump loads) as shown in Figure 6. The study consists of two main objectives, analysis of the solar array reconfiguration performance to get G M P P then MPPT performance and tracking efficiency. Simulation results have been demonstrated using MATLAB and the different optimization algorithms with the same condition of the load variations are shown in Figure 7 and Figure 8. Regarding the system’s reached G M P P from the PV-array reconfiguration, a comparison analysis is carried between the impact of the studied PS cases regarding the mismatch loss, shading loss, and fill factor. Additionally, regarding the MPPT performance analysis, average tracking time, response to load variations, and MPPT efficiency have been chosen as shown in Table 4.
The following results were obtained from analysis Figure 9 which shows the G m p p obtained from reconfiguration of PV- array using the different optimization algorithms and different PS cases:
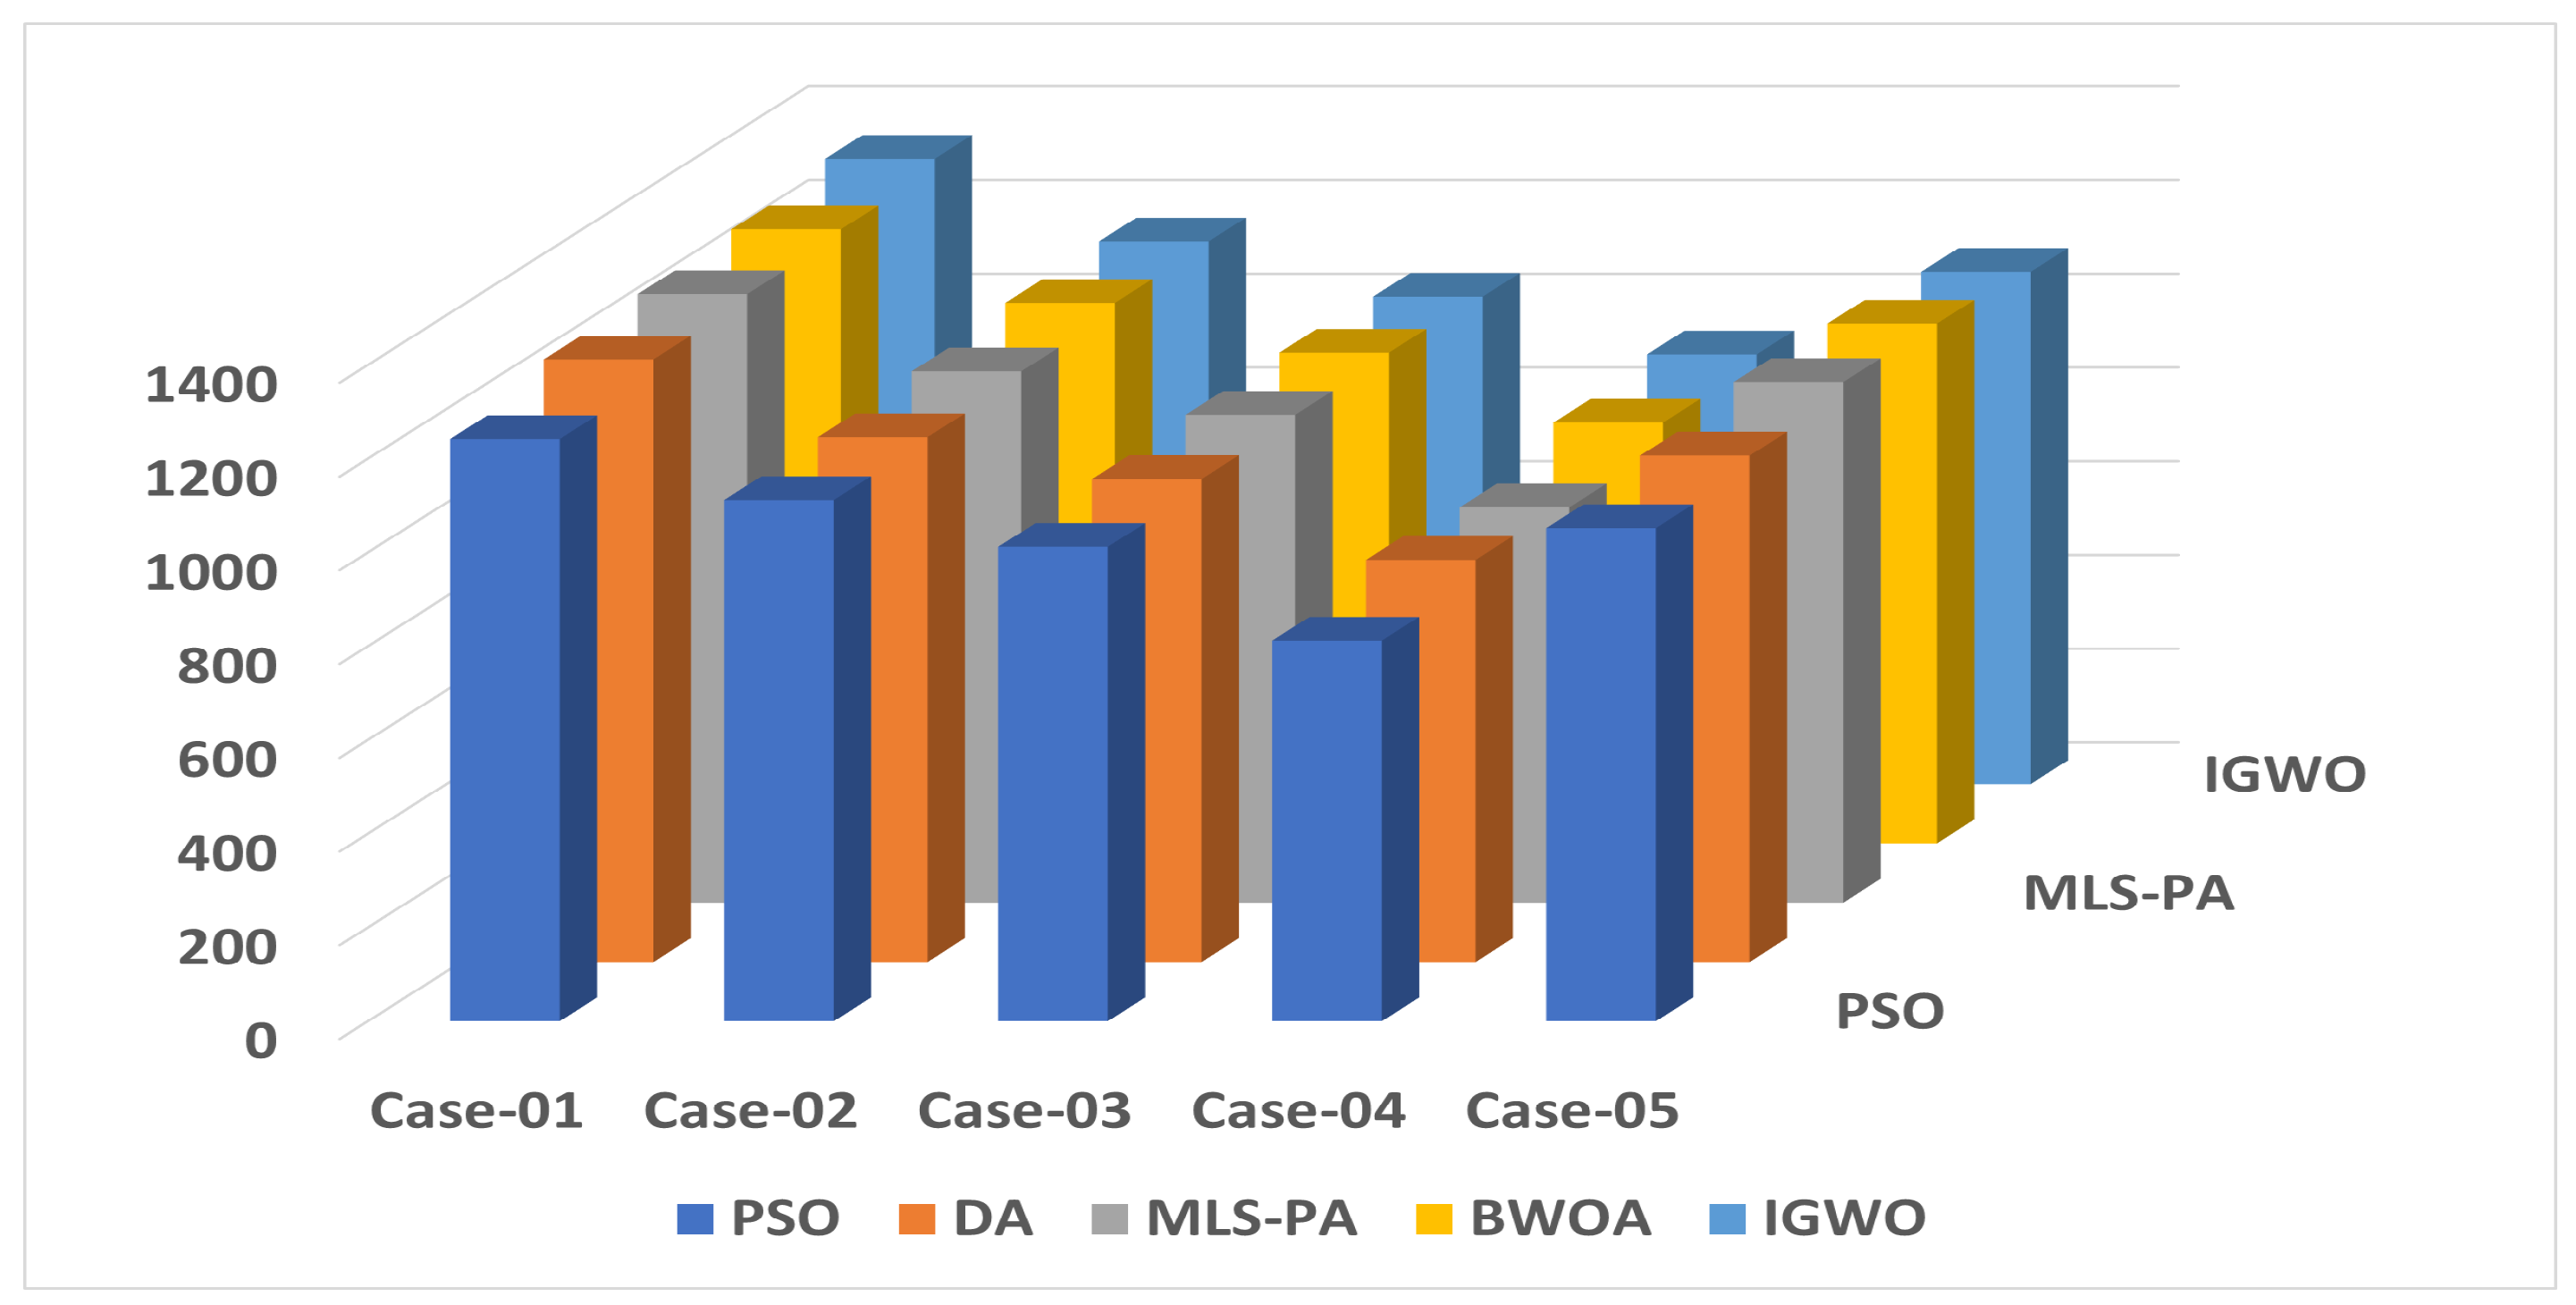
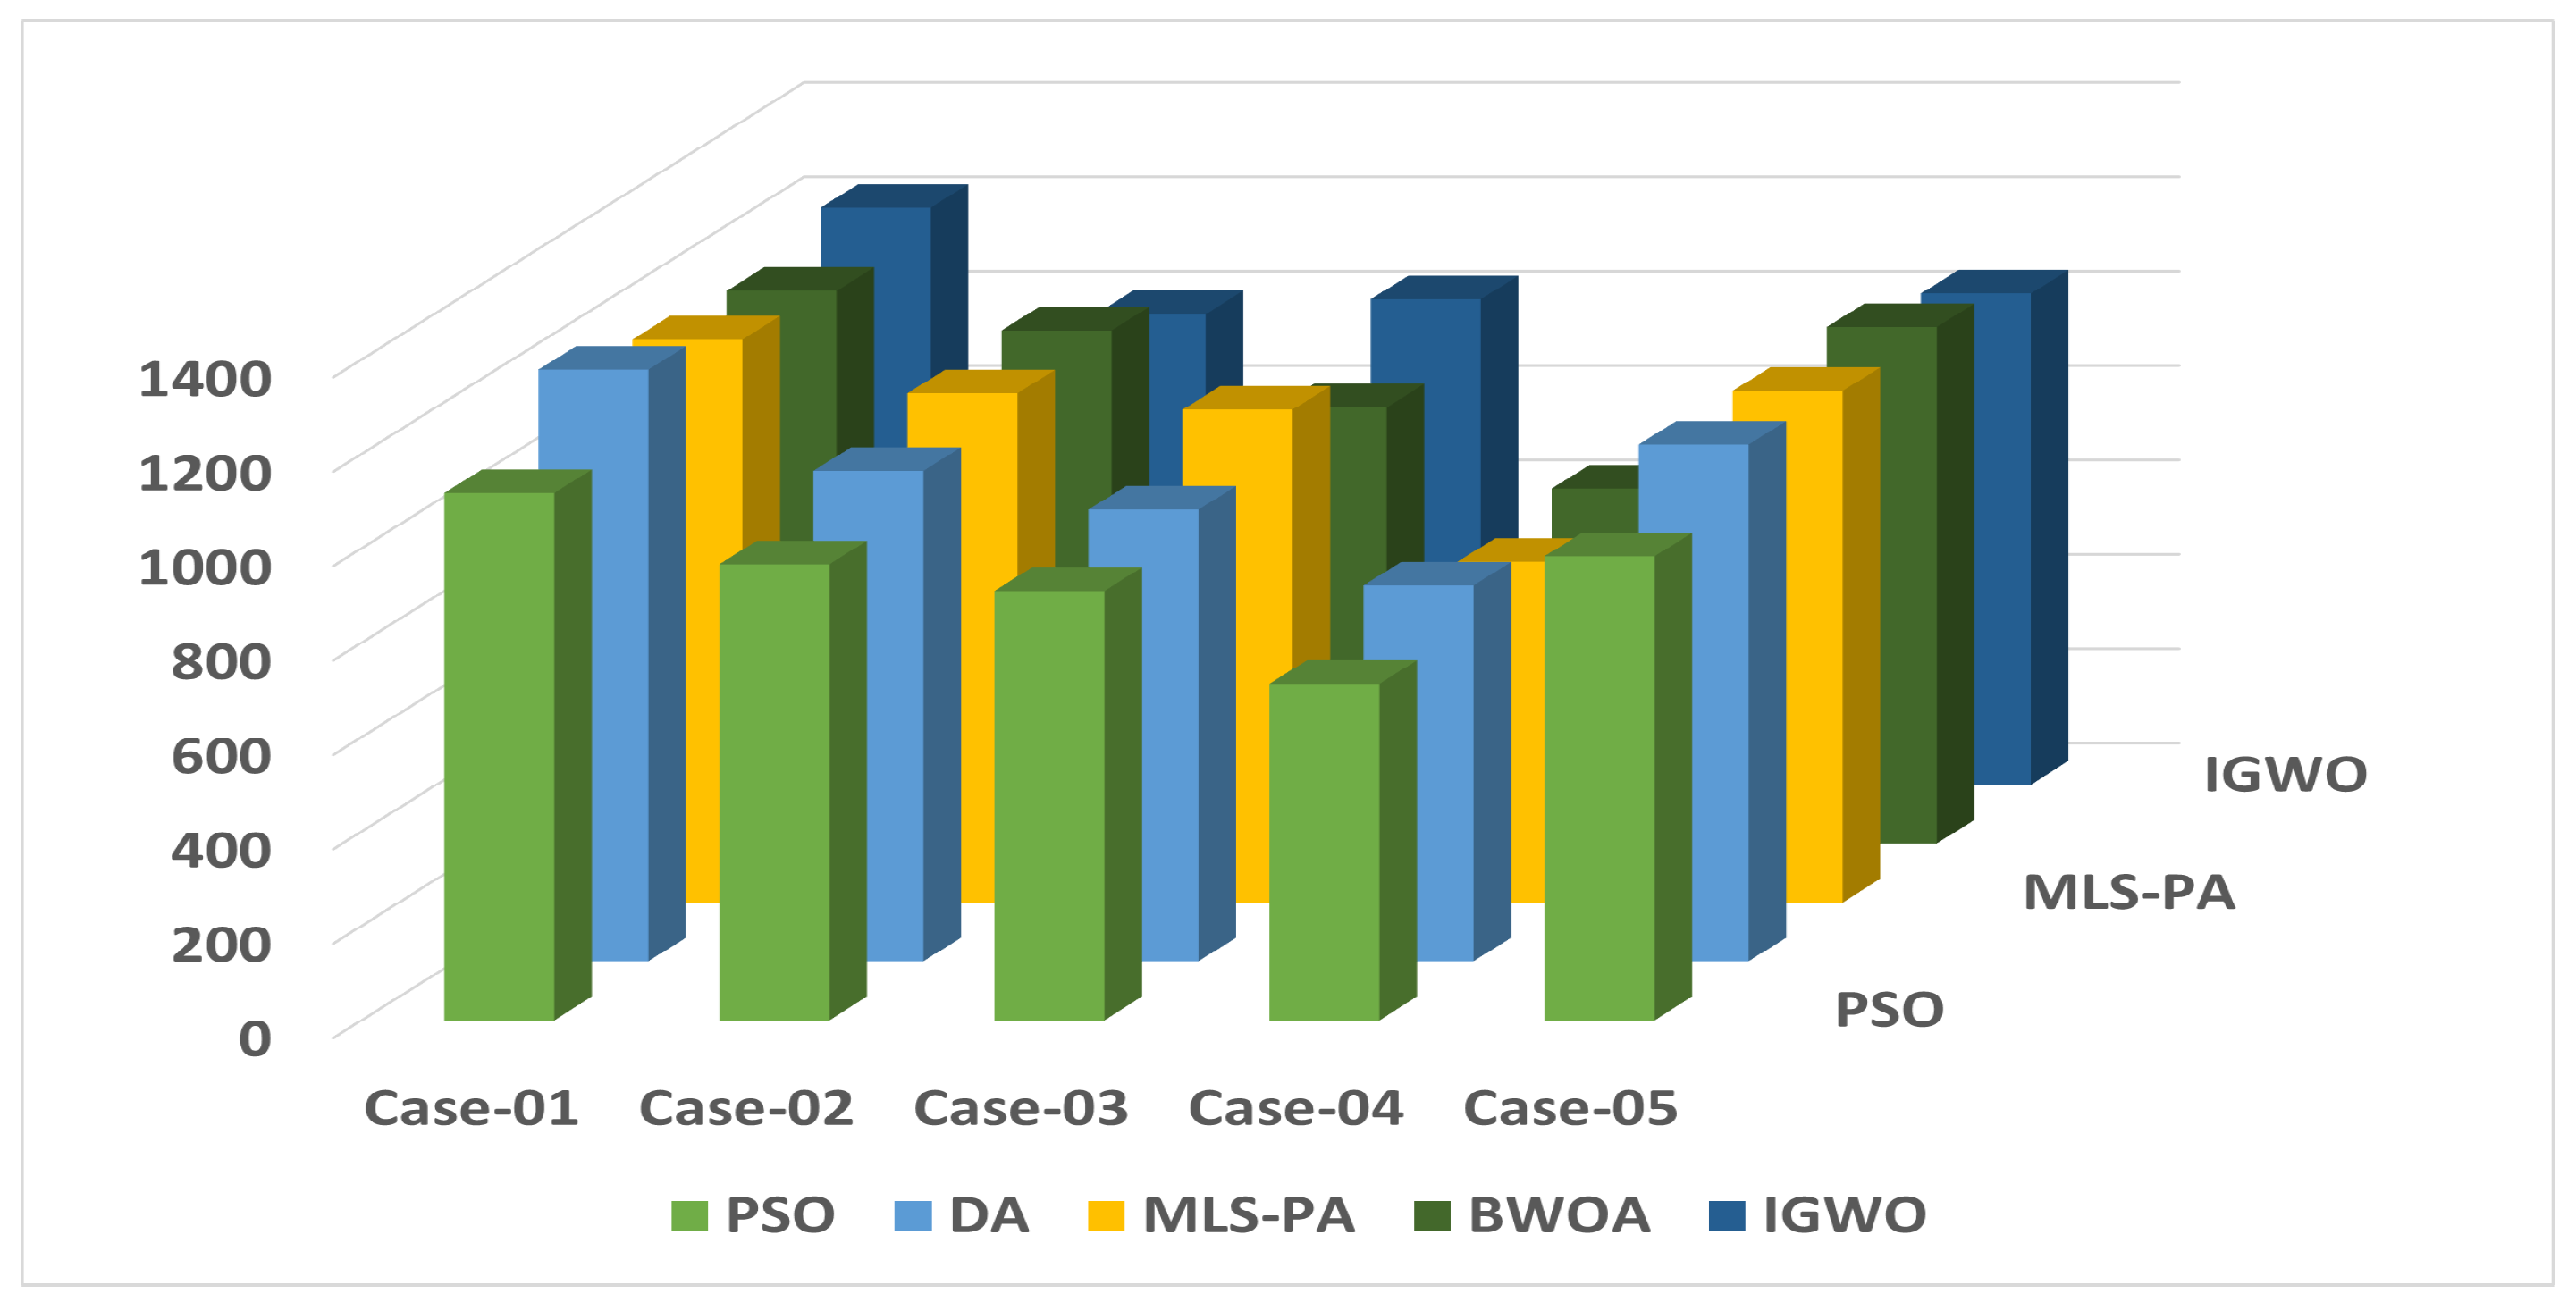
  • Case 01, IGWO configuration gives the highest maximum power ( 1342 W ). The BWOA configuration reached the second-best value of maximum power, yet the PSO configuration scored the lowest maximum power.
  • Case 02 and Case 05, approximately all the configurations have the approximated maximum power.
  • Case 03 and Case 04, IGWO algorithm generates the highest maximum power, in the second rank is the MLS-SPA.
Studying the shading cases, mismatch loss (%), shading losses, and fill factor values for all configurations are represented in Table 4. The results show the superior performance of the IGWO then BWOA over the other optimization techniques and the low performance of PSO. On the other hand of the compression regarding MPPT with load variations, the results shown in Figure 10 illustrates also the high performance of IGWO then BWOA in tracking the MPP and achieving the highest steady-state power at different PS cases. Additionally, Table 4 shows other different tracking indices and fast response of IGWO and BWOA to load variations and high MPPT average efficiency.

7. Conclusions

In this study, a comprehensive study has been carried out considering SP, TCT, and BL PV array topologies while using optimization techniques PSO, DA, MLS-SPA, BWOA, and IGWO under five PS cases with dynamical hybrid load change. A PV array 4 × 4 configuration experimental set has been implemented using MATLAB-Simscape for real-time physical simulation of the proposed system. The results were obtained through simulation for all the studied array configurations during the exposure to a variety of PS cases and dynamical load variations. Five different metaheuristics optimization techniques have been implemented using MATLAB in order to achieve the optimal configuration and MPPT from the proposed system.
The simulation results showed the superior performance of metaheuristics in achieving the optimum array configuration compared to conventional methods (SP, BL, and TCT) under the different shading cases. The comparison in Figure 10 states that the proposed algorithm consists of higher features in comparison with other metaheuristic algorithms used for MPPT.
Both the IGWO and BWOA configurations generated higher maximum power values compared to the other used algorithms regarding shading loss, mismatch loss, and fill factor for all the array configurations under PS cases. However, the lowest metaheuristics performance values were achieved by PSO.
Studying the system behavior, the conclusion is that the efficiency of PV array mainly relies on the used array configuration algorithm and MPPT. Additionally, other factors can affect the efficiency of the array such as shading cases and solar irradiation level. Future work will focus on the comparative analysis of more recent practical optimization technique implementation on other conventional PV systems.

Author Contributions

Conceptualization, T.A.B. and Y.E.K.; Formal analysis, Y.E.K. and A.A.; Funding acquisition, T.A.B., A.A. and M.M.S.; Methodology, T.A.B.; Project administration, M.M.S.; Software, Y.E.K.; Supervision, T.A.B. and M.M.S.; Visualization, A.A.; Writing—original draft, Y.E.K.; Writing—review & editing, M.M.S. and A.A. All authors have read and agreed to the published version of the manuscript.

Funding

This research received no external funding.

Institutional Review Board Statement

Exclude this statement.

Informed Consent Statement

Not applicable.

Data Availability Statement

Not applicable.

Conflicts of Interest

The authors declare no conflict of interest.

References

  1. Yang, B.; Yu, T.; Zhang, X.; Li, H.; Shu, H.; Sang, Y.; Jiang, L. Dynamic leader based collective intelligence for maximum power point tracking of PV systems affected by partial shading condition. Energy Convers. Manag. 2019, 179, 286–303. [Google Scholar] [CrossRef]
  2. Beltran, H.; Harrison, S.; Egea-Àlvarez, A.; Xu, L. Techno-economic assessment of energy storage technologies for inertia response and frequency support from wind farms. Energies 2020, 13, 3421. [Google Scholar] [CrossRef]
  3. Baba, A.O.; Liu, G.; Chen, X. Classification and evaluation review of maximum power point tracking methods. Sustain. Futur. 2020, 2, 100020. [Google Scholar] [CrossRef]
  4. Satpathy, P.R.; Sharma, R. Parametric indicators for partial shading and fault prediction in photovoltaic arrays with various interconnection topologies. Energy Convers. Manag. 2020, 219, 113018. [Google Scholar] [CrossRef]
  5. Winston, D.P.; Kumaravel, S.; Kumar, B.P.; Devakirubakaran, S. Performance improvement of solar PV array topologies during various partial shading conditions. Sol. Energy 2020, 196, 228–242. [Google Scholar] [CrossRef]
  6. Manjunath; Suresh, H.N.; Rajanna, S. Performance enhancement of Hybrid interconnected Solar Photovoltaic array using shade dispersion Magic Square Puzzle Pattern technique under partial shading conditions. Sol. Energy 2019, 194, 602–617. [Google Scholar] [CrossRef]
  7. Ramli, M.A.; Twaha, S.; Ishaque, K.; Al-Turki, Y.A. A review on maximum power point tracking for photovoltaic systems with and without shading conditions. Renew. Sustain. Energy Rev. 2017, 67, 144–159. [Google Scholar] [CrossRef]
  8. Yadav, A.S.; Pachauri, R.K.; Chauhan, Y.K.; Choudhury, S.; Singh, R. Performance enhancement of partially shaded PV array using novel shade dispersion effect on magic-square puzzle configuration. Sol. Energy 2017, 144, 780–797. [Google Scholar] [CrossRef]
  9. Ul-Haq, A.; Alammari, R.; Iqbal, A.; Jalal, M.; Gul, S. Computation of power extraction from photovoltaic arrays under various fault conditions. IEEE Access 2020, 8, 47619–47639. [Google Scholar] [CrossRef]
  10. Tubniyom, C.; Chatthaworn, R.; Suksri, A.; Wongwuttanasatian, T. Minimization of losses in solar photovoltaic modules by reconfiguration under various patterns of partial shading. Energies 2019, 12, 24. [Google Scholar] [CrossRef] [Green Version]
  11. Fang, X.; Yang, Q.; Yan, W. Switching Matrix Enabled Optimal Topology Reconfiguration for Maximizing Power Generation in Series–Parallel Organized Photovoltaic Systems. IEEE Syst. J. 2021, 1–11. Available online: https://ieeexplore.ieee.org/abstract/document/9395169 (accessed on 1 January 2022). [CrossRef]
  12. Satpathy, P.R.; Sharma, R.; Dash, S. An efficient SD-PAR technique for maximum power generation from modules of partially shaded PV arrays. Energy 2019, 175, 182–194. [Google Scholar] [CrossRef]
  13. Sagar, G.; Pathak, D.; Gaur, P.; Jain, V. A Su Do Ku puzzle based shade dispersion for maximum power enhancement of partially shaded hybrid bridge-link-total-cross-tied PV array. Sol. Energy 2020, 204, 161–180. [Google Scholar] [CrossRef]
  14. Dhanalakshmi, B.; Rajasekar, N. A novel competence square based PV array reconfiguration technique for solar PV maximum power extraction. Energy Convers. Manag. 2018, 174, 897–912. [Google Scholar] [CrossRef]
  15. Dileep, G.; Singh, S. Application of soft computing techniques for maximum power point tracking of SPV system. Sol. Energy 2017, 141, 182–202. [Google Scholar] [CrossRef]
  16. Baimel, D.; Tapuchi, S.; Levron, Y.; Belikov, J. Improved fractional open circuit voltage MPPT methods for PV systems. Electronics 2019, 8, 321. [Google Scholar] [CrossRef] [Green Version]
  17. Owusu-Nyarko, I.; Elgenedy, M.A.; Ahmed, K. Combined temprature and irradiation effects on the open circuit voltage and short circuit current constants for enhancing their related pv-mppt algorithms. In Proceedings of the 2019 IEEE Conference on Power Electronics and Renewable Energy (CPERE), Aswan, Egypt, 23–25 October 2019; pp. 343–348. [Google Scholar]
  18. Bouakkaz, M.S.; Boukadoum, A.; Boudebbouz, O.; Bouraiou, A.; Boutasseta, N.; Attoui, I. ANN based MPPT algorithm design using real operating climatic condition. In Proceedings of the 2020 2nd International Conference on Mathematics and Information Technology (ICMIT), Adrar, Algeria, 18–19 February 2020; pp. 159–163. [Google Scholar]
  19. Premkumar, M.; Subramaniam, U.; Babu, T.S.; Elavarasan, R.M.; Mihet-Popa, L. Evaluation of mathematical model to characterize the performance of conventional and hybrid PV array topologies under static and dynamic shading patterns. Energies 2020, 13, 3216. [Google Scholar] [CrossRef]
  20. Mohamed, M.A.; Diab, A.A.Z.; Rezk, H. Partial shading mitigation of PV systems via different meta-heuristic techniques. Renew. Energy 2019, 130, 1159–1175. [Google Scholar] [CrossRef]
  21. Almadhor, A.; Rauf, H.T.; Khan, M.A.; Kadry, S.; Nam, Y. A hybrid algorithm (BAPSO) for capacity configuration optimization in a distributed solar PV based microgrid. Energy Rep. 2021, 7, 7906–7912. [Google Scholar] [CrossRef]
  22. Hassan, T.u.; Abbassi, R.; Jerbi, H.; Mehmood, K.; Tahir, M.F.; Cheema, K.M.; Elavarasan, R.M.; Ali, F.; Khan, I.A. A novel algorithm for MPPT of an isolated PV system using push pull converter with fuzzy logic controller. Energies 2020, 13, 4007. [Google Scholar] [CrossRef]
  23. Phanden, R.K.; Sharma, L.; Chhabra, J.; Demir, H.İ. A novel modified ant colony optimization based maximum power point tracking controller for photovoltaic systems. Mater. Today Proc. 2021, 38, 89–93. [Google Scholar] [CrossRef]
  24. Ajmal, A.M.; Ramachandaramurthy, V.K.; Naderipour, A.; Ekanayake, J.B. Comparative analysis of two-step GA-based PV array reconfiguration technique and other reconfiguration techniques. Energy Convers. Manag. 2021, 230, 113806. [Google Scholar] [CrossRef]
  25. Yousri, D.; Babu, T.S.; Beshr, E.; Eteiba, M.B.; Allam, D. A robust strategy based on marine predators algorithm for large scale photovoltaic array reconfiguration to mitigate the partial shading effect on the performance of PV system. IEEE Access 2020, 8, 112407–112426. [Google Scholar] [CrossRef]
  26. Krishna, G.S.; Moger, T. Improved SuDoKu reconfiguration technique for total-cross-tied PV array to enhance maximum power under partial shading conditions. Renew. Sustain. Energy Rev. 2019, 109, 333–348. [Google Scholar] [CrossRef]
  27. Yousri, D.; Thanikanti, S.B.; Allam, D.; Ramachandaramurthy, V.K.; Eteiba, M. Fractional chaotic ensemble particle swarm optimizer for identifying the single, double, and three diode photovoltaic models’ parameters. Energy 2020, 195, 116979. [Google Scholar] [CrossRef]
  28. Babu, T.S.; Ram, J.P.; Sangeetha, K.; Laudani, A.; Rajasekar, N. Parameter extraction of two diode solar PV model using Fireworks algorithm. Sol. Energy 2016, 140, 265–276. [Google Scholar] [CrossRef]
  29. Allam, D.; Yousri, D.; Eteiba, M. Parameters extraction of the three diode model for the multi-crystalline solar cell/module using Moth-Flame Optimization Algorithm. Energy Convers. Manag. 2016, 123, 535–548. [Google Scholar] [CrossRef]
  30. Ibrahim, I.A.; Hossain, M.; Duck, B.C.; Fell, C.J. An adaptive wind-driven optimization algorithm for extracting the parameters of a single-diode PV cell model. IEEE Trans. Sustain. Energy 2019, 11, 1054–1066. [Google Scholar] [CrossRef]
  31. Pendem, S.R.; Mikkili, S. Modeling, simulation and performance analysis of solar PV array configurations (Series, Series–Parallel and Honey-Comb) to extract maximum power under Partial Shading Conditions. Energy Rep. 2018, 4, 274–287. [Google Scholar] [CrossRef]
  32. Pendem, S.R.; Mikkili, S. Modelling and performance assessment of PV array topologies under partial shading conditions to mitigate the mismatching power losses. Sol. Energy 2018, 160, 303–321. [Google Scholar] [CrossRef]
  33. Pilakkat, D.; Kanthalakshmi, S. An improved P&O algorithm integrated with artificial bee colony for photovoltaic systems under partial shading conditions. Sol. Energy 2019, 178, 37–47. [Google Scholar]
  34. Azar, A.T.; Ammar, H.H.; Ibrahim, Z.F.; Ibrahim, H.A.; Mohamed, N.A.; Taha, M.A. Implementation of PID controller with PSO tuning for autonomous vehicle. In Proceedings of the International Conference on Advanced Intelligent Systems and Informatics, Cairo, Egypt, 26–28 October 2019; pp. 288–299. [Google Scholar]
  35. Babu, T.S.; Ram, J.P.; Dragičević, T.; Miyatake, M.; Blaabjerg, F.; Rajasekar, N. Particle swarm optimization based solar PV array reconfiguration of the maximum power extraction under partial shading conditions. IEEE Trans. Sustain. Energy 2017, 9, 74–85. [Google Scholar] [CrossRef]
  36. Optimal Reconfiguration of Solar Photovoltaic Arrays Using a Fast Parallelized Particle Swarm Optimization in Confront of Partial Shading. Int. J. Eng. 2019, 32, 1177–1185. [CrossRef] [Green Version]
  37. Mirjalili, S. Dragonfly algorithm: A new meta-heuristic optimization technique for solving single-objective, discrete, and multi-objective problems. Neural Comput. Appl. 2016, 27, 1053–1073. [Google Scholar] [CrossRef]
  38. Reynolds, C.W. Flocks, herds and schools: A distributed behavioral model. In Proceedings of the 14th Annual Conference on Computer Graphics and Interactive Techniques, Anaheim, CA, USA, 27–31 July 1987; pp. 25–34. [Google Scholar]
  39. Vedik, B.; Kumar, R.; Deshmukh, R.; Verma, S.; Shiva, C.K. Renewable Energy-Based Load Frequency Stabilization of Interconnected Power Systems Using Quasi-Oppositional Dragonfly Algorithm. J. Control. Autom. Electr. Syst. 2021, 32, 227–243. [Google Scholar] [CrossRef]
  40. Tanabe, R.; Fukunaga, A.S. Improving the search performance of SHADE using linear population size reduction. In Proceedings of the 2014 IEEE Congress on Evolutionary Computation (CEC), Beijing, China, 6–11 July 2014; pp. 1658–1665. [Google Scholar]
  41. Hao, Q.; Zhou, Z.; Wei, Z.; Chen, G. Parameters Identification of Photovoltaic Models Using a Multi-Strategy Success-History-Based Adaptive Differential Evolution. IEEE Access 2020, 8, 35979–35994. [Google Scholar] [CrossRef]
  42. Wei, Z.; Huang, C.; Wang, X.; Zhang, H. Parameters identification of photovoltaic models using a novel algorithm inspired from nuclear reaction. In Proceedings of the 2019 IEEE Congress on Evolutionary Computation (CEC), Wellington, New Zealand, 10–13 June 2019; pp. 210–218. [Google Scholar] [CrossRef]
  43. Nadimi-Shahraki, M.H.; Taghian, S.; Mirjalili, S. An improved grey wolf optimizer for solving engineering problems. Expert Syst. Appl. 2021, 166, 113917. [Google Scholar] [CrossRef]
  44. Hayyolalam, V.; Pourhaji Kazem, A.A. Black Widow Optimization Algorithm: A novel meta-heuristic approach for solving engineering optimization problems. Eng. Appl. Artif. Intell. 2020, 87, 103249. [Google Scholar] [CrossRef]
Figure 1. Electrical circuit diagram of single-diode PV model.
Sustainability 14 02937 g001
Figure 2. The proposed PV system modeling in MATLAB Simulink with hybrid load. (a) The proposed 4 × 4 PV array with command switches. (b) Schematic overview for the proposed system structure.
Sustainability 14 02937 g002
Figure 3. (a) SP array configuration. (b) BL array configuration. (c) TCT array configuration.
Sustainability 14 02937 g003
Figure 4. Five cases of partial shading and their impact on PV array configurations.
Sustainability 14 02937 g004
Figure 5. Flowchart for optimization algorithms implemented on PV array configuration.
Sustainability 14 02937 g005
Figure 6. System simulation input load profiles.
Sustainability 14 02937 g006
Figure 7. System simulation results under Cases 01, 02, and 03 PS.
Sustainability 14 02937 g007
Figure 8. System simulation results under Cases 04 and 05 PS.
Sustainability 14 02937 g008
Figure 9. System P m p p output under different PS cases.
Sustainability 14 02937 g009
Figure 10. System P m p p output under load variations.
Sustainability 14 02937 g010
Table 1. PV module parameters used in the system.
ParameterVariableValue
Maximum power P max 100 W
Maximum power point voltage V mpp 17.5 V
Maximum power point current I mpp 5.71 A
Open circuit voltage V OC 21.8 V
Short circuit current I sc 6.52 A
Number of series cell N s 72
Temperature coefficient of Isc K i 0.105 % / C
Table 2. 4 × 4 PV array configurations power.
Configuration P max ( W ) V max ( V ) I max ( A )
SP 1452 82.5 . 1 17.6
BL 1480 80.1 . 1 18.47
TCT 1542 78.5 19.71
Table 3. The sum of individual maximum powers of the modules.
Cases P max   i
Case 01 1364.7718 W
Case 02 1291.0394 W
Case 03 1406.8610 W
Case 04 1396.7776 W
Case 05 1386.7776 W
Table 4. Simulation results of shading cases.
Bio-Inspired MPPT PSODAMLS-SPABWOAIGWO
Average tracking timeCase-012.5 s1.95 s2.1 s1.65 s1.52 s
Case-022.82 s1.86 s1.93 s1.75 s1.67 s
Case-033.1 s2.4 s2.17 s1.85 s1.71 s
Case-042.74 s1.95 s1.77 s1.32 s1.41 s
Case-051.88 s1.73 s1.43 s1.26 s1.22 s
Average2.608 s1.978 s1.88 s1.566 s1.506 s
Mismatch loss %Case-011.211.181.131.141.13
Case-022.381.412.311.361.42
Case-034.273.794.723.423.12
Case-042.199.028.034.322.85
Case-056.127.3412.353.784.17
Average3.2344.5485.7082.8042.538
Fill factorCase-010.240.710.630.760.74
Case-020.380.410.540.670.79
Case-030.420.610.680.740.77
Case-040.370.640.720.680.82
Case-050.450.570.690.810.83
Average0.3720.5880.6520.7320.79
Shading loss (W)Case-01168128131118121
Case-02142115105103104
Case-03126109102116101
Case-04166133114117102
Case-05125112988779
Average145.4119.4110108.2101.4
Response to load variationsSlowSlowAverageFastFast
MPPT average efficiency91.694.795.197.4198.23
Publisher’s Note: MDPI stays neutral with regard to jurisdictional claims in published maps and institutional affiliations.

