1. Introduction
The aging population in Europe is a significant problem that affects not only social and healthcare services but also economic resilience and food security. Since agriculture is the only provider of food inputs, the age mosaic of this sector is vital for continuous and unobstructed output generation.
Therefore, the European Union undertakes specific aids to foster generation renewal in rural Europe through Pillar II direct payments for the establishment of young farmers below 40 years old. The Young Farmers Scheme is an EU-wide policy measure that attempts to counter the shortage of young farmers and to secure long-term sustainability of the primary sector [
1]. At this point, Zagata and Sutherland (2015) [
2] separate young farmers from new entrants (in the form of farmers under 40 years old) and they argue that this shortage is mostly prevalent in countries with small-scale holdings such as Portugal, Italy, and Greece. The importance of generation renewal is recognized by European institutions as the related CAP measures attempt to assist new entrants to overcome entry barriers, secure farm sustainability, and achieve farm succession particularly for remote and rural areas [
3].
However, recent studies pinpoint generation renewal as a major problem for European agriculture and the factors that motivate young Europeans to become and remain farmers are widely examined [
4,
5,
6,
7,
8].
Although novel literature regarding the Young Farmers Scheme has been oriented toward success factors of the Scheme, a handful of scholars analyze the impact of the Scheme in rural growth both at national and regional levels. Benefits of the Scheme include farmers’ income increase [
5] and farm holding survival [
9], farm productivity [
10], multi-directional efficiency [
11], and social sustainability indicators such as employment [
12].
It is apparent that relevant literature neglects the wider economic effects of the Scheme and it concentrates on issues directly linked to the agricultural sector. As rural development policies do not explicitly target the primary sector but other non-farm agents that improve rural prosperity, multi-sectoral models are needed to capture the full economic impact of such policies [
13].
General equilibrium methodologies are the most commonly applied by scholars for– CAP impact analysis [
14], with input–output and CGE modelling being the most popular. The effects of CAP measures in rural Europe are examined by [
15], while other studies focus on inter-regional [
16] and regional economic activities [
17,
18,
19,
20] in Greece, particularly for output and income and employment growth.
In this study, the impact of the Young Farmers Scheme on rural growth in two Greek Regions (NUTS-2) is examined. Two input–output models were constructed for Thessaly, an agriculture-based economy in central Greece and Central Macedonia that is the largest agricultural producer in Greece, to assess the impact of Young Farmers Scheme payments on income and employment growth for the 2016–2021 implementation period.
The study includes an overview of the input–output model and its use for policy assessment in rural areas, the datasets used to construct the models, and the steps to do so. Next, the regions under study are presented, followed by the results section. Lastly, a discussion of the research outcomes is presented, and the concluding section summarizes findings of the paper and provides recommendations for further investigation.
This study attempts to fill a gap in the literature regarding the effect of Young Farmers Scheme payments on regional economic growth. Researchers so far have explicitly focused on sectoral impacts and the current paper aims to assess the wider economic effects of the policy measure for rural economies.
2. Materials and Methods
Impact assessment modelling adopts many perspectives that are either monothematic and focus on a single sector or that have a wider view that concentrates on the whole economy. The original input–output model introduced by Leontief utilizes National Accounts and household or employment data to estimate the distributional effects of an exogenous intervention (positive or negative) in the form of final demand (government spending, investment). This feature allows policy makers to have a spherical view of a targeted policy on an economy.
2.1. Input–output Overview and Multipliers
The symmetric Input–Output (I/O) table is the basis of the model and represents a square matrix where the rows stand for the distribution of output of each sector to the rest of the economy and the columns stand for the inputs required for each sector to produce its output. The economic production process is linked linearly to exogenous demand and it can be estimated through the Leontief inverse matrix [
21].
The classic Leontief inverse matrix is utilized as a benchmark for the calculation of multipliers [
22]:
where x is the vector of total gross output, (I – A)
−1 is the Leontief inverse matrix that illustrates the total requirements (direct and indirect) of an economy to produce its output, and y is the vector of total final demand.
The column sums of the Leontief inverse matrix account for the output multipliers.
The output multiplier estimates the change of total output of an economy as a result of a unit monetary change of final demand for a given sector j.
Income and employment multipliers, known as Type
I multipliers, can be estimated accordingly by involving the direct income and direct employment coefficients:
where
is the direct income coefficients vector,
Hj the household income vector, and
Xj the total output for a given sector
j.
The Type I income multiplier can be interpreted as the change of total income in the economy as a result of an exogenous change in the final demand of a given sector j. Likewise, the Type I employment multiplier can be estimated by substituting the income with an employment vector.
2.1.1. Input–Output Elasticities
However, as multipliers do not consider the relative size of each sector, which may mislead policymakers, input–output elasticities have been estimated [
23] to provide a complete outlook of the economic structure and the growth potential of a particular parameter (output, income, employment). Elasticities measure the effect of an exogenous shock in percentages; hence, the output elasticity estimates the percentage change of total output in the economy as a result of a 1% change in the final demand of a given sector
j. Output elasticity can be estimated according to the formula:
where
OExyj is the output elasticity for a given sector
j,
X is total output of the economy,
is the Leontief matrix element, and
Yj the final demand of a given sector
j. In this fashion, income and employment elasticities can be estimated as below:
where
IExyj is the income elasticity for a given sector
j,
Hi the household income of sector
j,
Xj total output for sector
j,
is the Leontief matrix element,
the direct income coefficient for sector
j,
Yj the final demand for sector
j, and X is the total output of the economy. As with output, income elasticity estimates the percentage change of total income in a study area as a result of a 1% change in the final demand of a given sector
j. The respective employment elasticity is estimated by substituting the income with employment elements.
2.1.2. Multipliers and Impact Analysis
The popularity of the input–output approach relies on the use of multipliers for impact assessment of exogenous shocks to the economy. In terms of CAP impacts and subsequently the Young Farmers payments, the post-multiplication of sectoral multipliers (output, income, employment) with respective change of the final demand provides estimations for total economic effects. The equation below indicates how to estimate such effects for total output generation in the study area as a result of a change in the final demand of a sector (in our case the payments of the Young Farmers Scheme):
where Δ
Χ is the total output of the economic change due to a change in the final demand of a given sector
j,
OMIj is the output multiplier for sector
j, and Δ
FDi is the change in the final demand of sector
j. Similarly, the effect on income and employment can be estimated by using the respective multipliers. The same process is followed for elasticities by substituting accordingly.
2.2. Regional I/O Model Construction and Dataset
As I/O tables are usually available at the national level, regional tables are mechanically constructed using primary and secondary data for calibration of the original I/O table. The GRIT technique combines survey and secondary data to convert national I/O tables and to produce representative regional tables [
24]. It is widely used as regionalization technique [
18,
20,
25,
26], especially for CAP impact analysis.
To apply the GRIT technique, a standard procedure has been developed by Mattas et al. (2009) [
27] that uses FLQ, an employment-based ratio. The FLQ ratio proposed by Flegg, Webber, and Elliott (1995) [
28] was utilized in this study as it is considered very efficient [
29,
30] since it incorporates, likewise to I/O elasticities, the size of the region under study.
The 2015 National I/O table for Greece, consisting of 64 sectors, is the most recently available and it was used to apply the GRIT technique. According to the magnitude of industries, the national table was aggregated to 30 sectors for Thessaly and 56 sectors for Central Macedonia. The employment data of each Region for 2019 were derived from the National Statistics Service to calibrate the national table and produce the two regional models. Data for the amount of payments for the Young Farmers Scheme for both Regions were obtained from the respective regional authorities for use in the impact analysis. The 2016 call and related payments were selected as they were already completed by the Ministry of Rural Development and Food.
2.3. Profiles of Study Areas
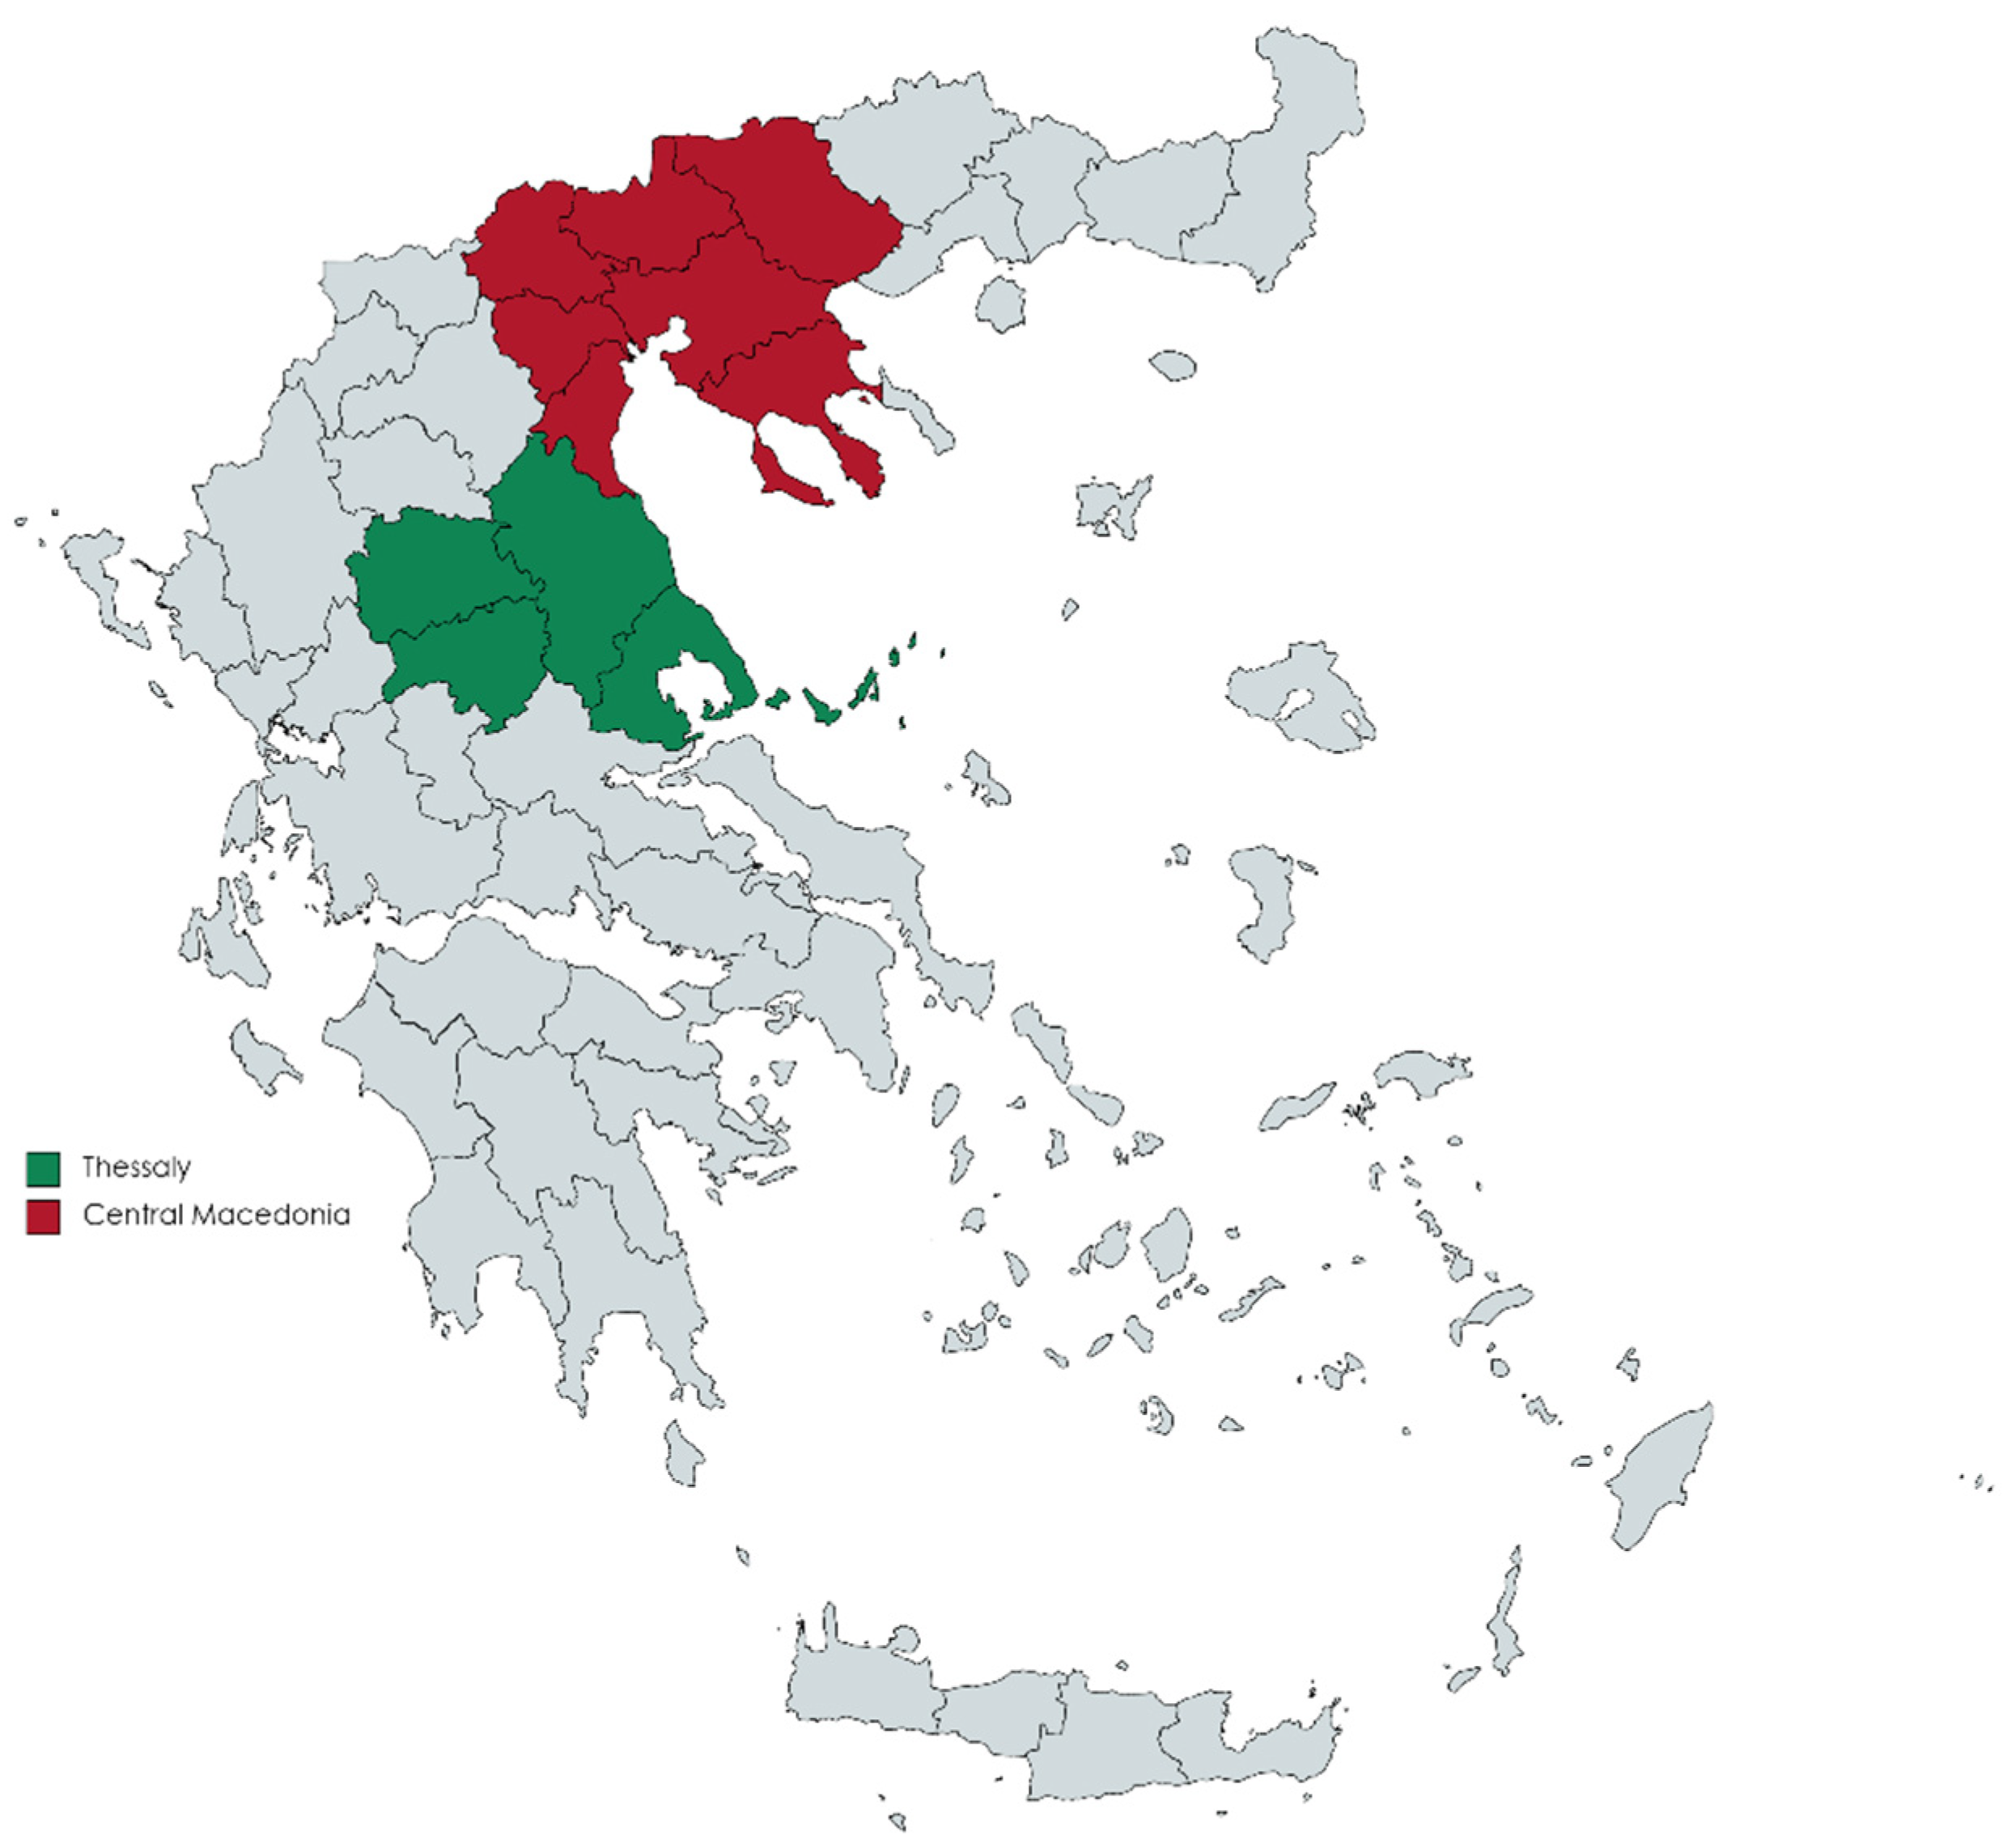
The two regions (NUTS-2 level) were selected as they share the largest amount of Greek agricultural output and the most entrants under the Young Farmers Scheme (see
Figure 1). Moreover, they were selected as a benchmark for the development of an agent-based tool funded by the Horizon2020 AGRICORE project that aspires to improve model policies dealing with agriculture in the European context.
Agriculture is a main employer in both regions with 20.8% of total employment being farmers in Thessaly and 12.9% of total employment being farmers in Central Macedonia. Especially for Thessaly, the primary sector accounts for almost 12% of total gross added value, while Central Macedonia reports a moderate 6.5%, still higher than the national average of 4.36% (see
Table 1).
The Region of Thessaly is one of the 13 administrative Regions of Greece and it produces 5% of the national GDP. It is an agriculture-based economy located in central Greece and it demonstrates significant output and added-value in the primary sector, which is three times higher than the national average. The most significant crops in terms of output are cotton, durum wheat, maize, fruit and vegetables, cattle, and sheep and goats [
32] (see
Table 2).
The Region of Central Macedonia is the second largest administrative area in Greece in terms of population and economic magnitude, and it produces 14.28% of the national GDP. Its agricultural structure is more or less similar to Thessaly, with minor deviations particularly for some crops such as rice and livestock breeding such as poultry and a demonstrated expertise in fresh fruit production (apples, peaches, apricots, cherries, etc.)
Both regions manifest an agricultural orientation that focuses mainly on dynamic cultivations such as fruit and vegetables, with a considerable share on cotton production. Animal output is less determinant in total agricultural output with poultry in Central Macedonia and sheep and goats in Thessaly leading production.
2.4. Young Farmers Scheme in Greece
The Young Farmers Aid Program aims to increase the competitiveness of agricultural holdings through age renewal and the creation of farmer entrepreneurs who, with the end of the support, will have adequate supplies and sustainable holdings. During the third period of implementation for the Young Farmers Scheme, since its initial launch in 2000, the Rural Program of Greece: Development of Agricultural Holdings and Businesses includes Measure 6.1: “Start-Up Aid for Young Farmers”. The first call was in 2016 (8837/14-10-2016) and it was later amended in 2018 (5824/5-7-2018). Up to this point, 16.900 applications have been submitted and 15576 have received approval [
32].
“New farmers” could be defined as a group that includes young farmers (under 35 or 40 years old) who are also new entrants in agriculture. In the current programming period 2014–2020, beneficiaries of the new entrants’ scheme must be: less than 40 years old, head of an agricultural holding for the first time, and possess the occupational skills for submitting and implementing a business plan for the development of their farming activity [
33].
Regional authorities for agricultural development (DAOK) are responsible for implementation and monitoring of the Measure. Business plans (3- or 4-year duration) are submitted by applicants and, should they be accepted according to criteria set by the MRDF, the local DAOK is responsible for the successful completion of the plan.
In Thessaly there are 1810 beneficiaries or new entrants for the 2016 call that received €34,043,000 in payments. Central Macedonia displays a larger amount of payments with €57,753,000 and 3383 beneficiaries [
34].
3. Results
Multipliers and elasticities of the key industries for each Region are presented in two separate sub-sections below and a third sub-section is dedicated to impact analysis of the Pillar II measure. The use of multipliers (
Table 3) implies a different perspective for the economic structure of both regions against the elasticities (
Table 4).
3.1. Multipliers and Elasticities for the Region of Thessaly
The results for the Region of Thessaly indicate an economy that is reliant on manufacturing for potential growth, especially for prosperity indicators such as income and employment.
Textiles and leather products are the most significant sector of the local economy with multipliers that generate four times more income (4.078) and almost three times more jobs (2.964) when an exogenous stimulus increases final demand by one million euros for these products. Furthermore, the petroleum, pharmaceuticals, and chemicals sector is another important industry for all economic indicators as expected, and it generates almost 3.5 times more income (3.490) and jobs (3.546). The food, beverages, and tobacco sector is also vital for the local economy as it generates almost double the output (1.827) in the whole economy and it provides almost four jobs per million euro spent in the sector.
Agriculture marks relatively low multipliers with 1.492 for output (ranked 19th), 1.839 for income (ranked 15th), and 1.223 for employment (ranked 24th) among all 30 sectors. However, the elasticities significantly change the potential for growth in Thessaly (see
Table 4) with the tertiary sectors emerging as the most prolific contrary to manufacturing industries.
Input–output elasticities reveal a different view of the economic potential of Thessaly and the key sectors that contribute to its development. Contrary to multipliers where manufacturing industries were dominant, the tertiary sector emerges as a notable factor for development with real estate, trade, accommodation and public administration services ranking as top-10 industries.
The food, beverages, and tobacco sector is the most balanced, and it ranks second in all three parameters. Therefore, a 1% increase of the final demand for the sector will induce a 0.047% increase of total output, a 0.098% increase of total income, and a 0.16% increase of total employment in Thessaly. Other remarkable sectors include real estate activities, ranking first among all 30 sectors, where a 1% demand expansion of the sector will provide an increase of 0.208% of total output, 0.206% of total income, and 0.294% of total employment in the study area. Petroleum, pharmaceuticals, and chemicals and the public administration sectors are among the most influential in the region.
Agriculture, in terms of elasticities, signifies a larger growth potential when an exogenous rise of final demand occurs. Total output in the economy increases by 0.052% (ranking 7th), total income by 0.065% (ranking 11th), and total employment by 0.063% (ranking 10th). This is a notable finding for the impact analysis presented in
Section 3.3.
3.2. Multipliers and Elasticities for the Region of Central Macedonia
Analogous deviations among multipliers and elasticities appear also in the Region of Central Macedonia (see
Table 5 and
Table 6.) The I-O multipliers are dominated by manufacturing industries but some tertiary sectors, particularly transportation, demonstrate high growth potential. It is noteworthy that I-O elasticities ranking in Central Macedonia is akin to those in Thessaly, namely the true growth potential lies in food, beverage and tobacco; real estate; and public administration services.
Since Central Macedonia is the second largest region in Greece and it produces almost 15% of the GDP (three times higher than Thessaly), it is less dependent on interregional imports than Thessaly and it demonstrates better economic efficiency. The petroleum, pharmaceuticals, and chemical sector is disaggregated here according to the national I/O table, as the region is more advanced and it incorporates more industries. Specifically, the presence of a petroleum refinery offers an advantage and it is present in the multiplier outcomes.
Computer, electronic, and optical products is another notable sector ranking first in terms of output generation (2.643), fifth in income expansion (4.489), and fourth in job creation (4.580). Agriculture is a significant contributor to income generation as it ranks 5th among all sectors with 2.713 million euros generated in the local economy when there is an increase of one million of final demand for its output.
Nonetheless, elasticities again depict a divergent aspect of the growth potential for Central Macedonia. Food, beverages, and tobacco is the most influential sector as when 1% of exogenous demand occurs, the sector increases the regional output by 0.132% and the regional income by 0.102%, and it creates 0.127% more jobs. Transport services present similar effects for social indicators with a 0.236% increase of total income for water transports and 0.159% for air transports.
It should be noted that in both regions, agriculture is not an important sector in terms of multipliers, but the consideration of elasticities provides a more robust perspective for decision-makers. Moreover, the food, beverage, and tobacco sector is directly linked to agricultural activities as it obtains inputs to produce its output, therefore enhancing the role of agriculture in the regional economy. The next section presents the socio-economic impacts of the Young Farmers Scheme payments for the local economies.
3.3. Impact Analysis of the Young Farmers Scheme
As previously stated, impact analysis is achieved through multiplier and elasticities utilization. The exogenous shock caused in the economy refers to the payments made to beneficiaries of the Young Farmers Scheme. The amounts for the 2016 call total €57,753,000 for Central Macedonia and €34,043,000 for Thessaly [
33]. The final demand for agricultural products was estimated at €786,102,220.8 for Thessaly and €971,816,914 for Central Macedonia, respectively. Total output, income, and employment in the study areas are presented in
Table 7 below:
An impact analysis based on multiplier effects indicates that the total output in Thessaly increased by €50,792,196, total income by €62,605,077, and 42 new jobs were created in the area. In this fashion, Central Macedonia benefited by €109,268,676 in total production, by €156,683,889 for total income, and 74 new jobs were created (see
Table 8).
The evidence for Thessaly and Central Macedonia regions suggests that the payments of the Young Farmers Scheme equal to 4.33% of final demand for Thessaly and 5.94% for Central Macedonia, respectively (
Table 7).
Consequently, I-O elasticities are interpreted as in
Table 9 where a 4.33% increase of final demand for agriculture in Thessaly increases total output by 0.225% in the regional economy. Following the same approach for the other elasticities, the effects of the Scheme are estimated.
Although total output for both Regions is similar to the multiplier results, income elasticities generate on average 86% less income for the study areas. However, employment is much higher as 477 new jobs were created in Thessaly versus just 42 based on the multiplier approach and 841 new jobs were available in Central Macedonia versus the 74 initially estimated by the multipliers.
As multipliers based on location quotients are overestimated [
35], I/O elasticities are more reliable in terms of identifying the key sectors in an economy [
23,
36], and they express the effect of final demand on the economy.
4. Discussion
Previous studies have assessed the economy-wide effects of CAP instruments on the Region of Central Macedonia [
20,
37], demonstrating divergence for multipliers and elasticities to the current study. Nonetheless, this is attributed to the use of the 2010 National I/O table and older employment data compared to this research that utilized the 2015 table and 2019 employment data. Certainly, the structural changes, final demand, household income, and employment rates are completely different in the new table as it is the first published in the post-crisis period for Greece. Moreover, CAP impact scenarios are different among studies as recent literature focuses on the cumulative effects of Pillars I and II rather than explicit assessment of a policy measure. It is noteworthy that agriculture in Central Macedonia is considered an important sector and it entails the largest distributional and cumulative effects [
17].
On the contrary, there is scarce evidence of a CAP impact analysis for the Region of Thessaly and scholars are either focused on parts of the Region [
38,
39], single sectors [
40,
41], or their focus is natural resource-oriented [
22,
25,
42]. Of those, Gkatsikos et al. (2022) [
22] provide an economy-wide view for Thessaly and study a Pillar II measure for irrigation advances. Findings in such papers corroborate the importance of agriculture in this rural economy, particularly for income and employment generation.
However, the economy-wide impacts of generation renewal measures are neglected in relevant literature even at a pan-European level, with just one study for the Polish economy present [
3]. Empirical evidence of a CGE model in Poland validates that Pillar II support to Young Farmers contributes to employment growth though at a lesser extent than Pillar Ι payments. The primary sector and the food industry benefited the most from the Young Farmers payments: regional employment increased by 0.17% for the primary sector and by 0.19% for the food sector, and positive effects on education (0.08% increase) and public administration (0.09%) were noted. Yet, the study does not segregate impacts on rural and urban areas.
The results of the current research imply that the Young Farmers Scheme is a critical contributor to regional growth, especially for output and employment. Payments from the Measure generated directly and indirectly €84,795,417.5 and 2287 new jobs for the Region of Thessaly and €167,746,774 and 4224 jobs for the Region of Central Macedonia.
In Thessaly, direct employment is equal to the beneficiaries (1810) and indirect jobs were estimated at 477 corresponding to 20.85% of total jobs created. The Region of Central Macedonia benefited from 3383 new farmers and an added 841 jobs created in the local area corresponding to 19.91% of total employment growth. The Scheme demonstrates a lesser effect on income generation for rural areas. Specifically, the Region of Thessaly benefited by €8,899,124.76 and Central Macedonia gained €23,235.672.42 for income in its local economy.
On average, Measure 6.1 "Establishment of Young Farmers" for the Rural Development Program 2014–2020 of Greece added 20% more jobs to the initial beneficiaries of the policy measure distributed to the rest of the economy and it has shown itself to be a significant tool for rural employment growth.
5. Conclusions
This research examined for the first time the socio-economic impacts of the Young Farmers Scheme policy in two regions in Greece. So far, literature has neglected the rural welfare effects of generation renewal policies which this paper attempted to address. Two regional I/O models were constructed to identify the key sectors of the study areas and to estimate multipliers and elasticities to assess the impacts of the policy measure. The empirical evidence suggests that generation renewal policies support rural economies notably for output production and employment increase, while income generation is benefited at a minor scale. Especially for rural Greece, the indirect jobs created in rural economies due to payments from the Scheme equal to 20% of the number of new entrants (beneficiaries).
Rural economies, especially those that endure depopulation, can benefit from this policy measure as it supports local GDP and it creates jobs not only for the agricultural sector but the whole economy. The study results confirm that the Young Farmers Scheme is a useful tool to create more jobs for regional, agriculturally oriented economies. It is suggested that an increased budget for the Scheme will bolster economic production, enhance regional employment, and revive rural populations.
Nonetheless, the study comes with the limitations of the input–output approach that does not capture dynamic changes as in a computed general equilibrium model. Income generation, including its circulation within the economy, is not fully addressed and it demonstrates poorer results in comparison with output and employment. The use of a Social Accounting Matrix (SAM) would assist policy makers to identify the total income generated in the economy and to estimate the distributional effects of Young Farmers Schemes, particularly at the regional level.
Author Contributions
Conceptualization, A.G.; methodology, A.G.; software, A.G.; validation, D.N., M.T. and A.P.; formal analysis, A.G.; investigation, A.G.; resources, A.G.; data curation, A.G.; writing—original draft preparation, A.G.; writing—review and editing, C.S., D.N., M.T. and A.P.; visualization, A.G.; supervision, K.M.; project administration, K.M.; funding acquisition, K.M. All authors have read and agreed to the published version of the manuscript.
Funding
This research was funded by H2020 AGRICORE project, grant number 816078.
Institutional Review Board Statement
Not applicable.
Informed Consent Statement
Not applicable.
Conflicts of Interest
The authors declare no conflict of interest. The funders had no role in the design of the study; in the collection, analyses, or interpretation of data; in the writing of the manuscript, or in the decision to publish the results.
References
- Rovný, P. The Analysis of Farm Population with Respect to Young Farmers in the European Union. Procedia-Soc. Behav. Sci. 2016, 220, 391–398. [Google Scholar] [CrossRef]
- Zagata, L.; Sutherland, L.A. Deconstructing the “young farmer problem in Europe”: Towards a research agenda. J. Rural Stud. 2015, 38, 39–51. [Google Scholar] [CrossRef]
- European Commission. Evaluation of the Impact of the CAP on Generation Renewal, Local Development and Jobs in Rural Areas; European Commission: Brussels, Belgium, 2021; Available online: https://ec.europa.eu/info/sites/default/files/food-farming-fisheries/key_policies/documents/ext-eval-cap-gene-renewal-study-report_2021_en.pdf (accessed on 6 February 2022).
- Coopmans, I.; Dessein, J.; Accatino, F.; Antonioli, F.; Bertolozzi-Caredio, D.; Gavrilescu, C.; Gradziuk, P.; Manevska-Tasevska, G.; Meuwissen, M.; Peneva, M.; et al. Understanding farm generation renewal and its influencing factors in Europe. J. Rural Stud. 2021, 86, 398–409. [Google Scholar] [CrossRef]
- Nordin, M.; Lovén, I. Is the setting up aid mitigating the generation renewal problem in farming? Eur. Rev. Agric. Econ. 2020, 47, 1697–1715. [Google Scholar] [CrossRef]
- May, D.; Arancibia, S.; Behrendt, K.; Adams, J. Preventing young farmers from leaving the farm: Investigating the effectiveness of the young farmer payment using a behavioural approach. Land Use Policy 2019, 82, 317–327. [Google Scholar] [CrossRef]
- Cavicchioli, D.; Bertoni, D.; Pretolani, R. Farm succession at a crossroads: The interaction among farm characteristics, labour market conditions, and gender and birth order effects. J. Rural Stud. 2018, 61, 73–83. [Google Scholar] [CrossRef]
- Kontogeorgos, A.; Michailidis, A.; Chatzitheodoridis, F.; Loizou, E. “New Farmers” a Crucial Parameter for the Greek Primary Sector: Assessments and Perceptions. Procedia Econ. Financ. 2014, 14, 333–341. [Google Scholar] [CrossRef] [Green Version]
- Pechrová, M.Š.; Šimpach, O. Do the Subsidies Help the Young Farmers? The Case Study of the Czech Republic. Acta Univ. Agric. Silvic. Mendel. Brun. 2020, 68, 255–262. [Google Scholar] [CrossRef] [Green Version]
- Pavić, L.; Turk, J.; Grgić, I.; Prišenk, J. Impact Analysis of the Young Farmers’ Support Program on Slovenian Dairy Sector Development Using Econometric Modeling Approach. Agronomy 2020, 10, 429. [Google Scholar] [CrossRef] [Green Version]
- Manevska-Tasevska, G.; Hansson, H.; Asmild, M.; Surry, Y. Exploring the regional efficiency of the Swedish agricultural sector during the CAP reforms—Multi-Directional efficiency analysis approach. Land Use Policy 2021, 100, 104897. [Google Scholar] [CrossRef]
- Bournaris, T.; Moulogianni, C.; Manos, B. A multicriteria model for the assessment of rural development plans in Greece. Land Use Policy 2014, 38, 1–8. [Google Scholar] [CrossRef]
- Mainar-Causapé, A.; Rueda-Cantuche, J.M.; Cardenete, A.; Fuentes-Saguar, P.; Delgado, C.; Santini, F.; Mary, S.; y Paloma, S.G. Estimating regional social accounting matrices to analyse rural development. Stat. Oper. Res. Trans. 2017, 41, 319–346. [Google Scholar] [CrossRef]
- Lillemets, J.; Fertő, I.; Viira, A.-H. The socioeconomic impacts of the CAP: Systematic literature review. Land Use Policy 2022, 114, 105968. [Google Scholar] [CrossRef]
- Psaltopoulos, D.; Thomson, K.J.; Efstratoglou, S.; Kola, J.; Daouli, A. Regional social accounting matrices for structural policy analysis in lagging EU rural regions. Eur. Rev. Agric. Econ. 2004, 31, 149–178. [Google Scholar] [CrossRef]
- Psaltopoulos, D.; Balamou, E.; Skuras, D.; Ratinger, T.; Sieber, S. Modelling the impacts of CAP Pillar 1 and 2 measures on local economies in Europe: Testing a case study-based CGE-model approach. J. Policy Model. 2011, 33, 53–69. [Google Scholar] [CrossRef]
- Maniati, A.; Loizou, E.; Psaltopoulos, D.; Mattas, K. The regional economy of Central Macedonia: An application of the social accounting matrix. Agric. Financ. Rev. 2021. [Google Scholar] [CrossRef]
- Karelakis, C.; Loizou, E.; Chatzitheodoridis, F.; Mattas, K. Assessing policy impacts on the economy of European insular rural regions: The case of the smaller Aegean islands programme. Eur. Plan. Stud. 2019, 28, 1771–1789. [Google Scholar] [CrossRef]
- Loizou, E.; Karelakis, C.; Galanopoulos, K.; Mattas, K. The role of agriculture as a development tool for a regional economy. Agric. Syst. 2019, 173, 482–490. [Google Scholar] [CrossRef]
- Lampiris, G.; Karelakis, C.; Loizou, E. Evaluation of the impacts of CAP policy measures on a local economy: The case of a Greek region. Land Use Policy 2018, 77, 745–751. [Google Scholar] [CrossRef]
- Miller, R.E.; Blair, P.D. Input–Output Analysis: Foundations and Extensions, 2nd ed.; Cambridge University Press: Cambridge, UK, 2009. [Google Scholar]
- Gkatsikos, A.; Mattas, K.; Loizou, E.; Psaltopoulos, D. The Neglected Water Rebound Effect of Income and Employment Growth. Water Resour. Manag. 2022, 36, 379–398. [Google Scholar] [CrossRef]
- Mattas, K.; Shrestha, C.M.S. A new approach to determining sectoral priorities in an economy: Input-output elasticities. Appl. Econ. 1991, 23, 247–254. [Google Scholar] [CrossRef]
- Jensen, R.C.; Mandeville, T.D.; Karunaratne, N.D. Regional Economic Planning: Generation of Regional Input-Output Analysis; Croom Helm: London, UK, 1979. [Google Scholar]
- Gkatsikos, A.; Mattas, K. The Paradox of the Virtual Water Trade Balance in the Mediterranean. Sustainability 2021, 13, 2978. [Google Scholar] [CrossRef]
- Bednaříková, Z. Evaluation of the impacts of rural development policy measures on the local economy in the Czech Republic. Prague Econ. Pap. 2015, 24, 416–433. [Google Scholar] [CrossRef]
- Mattas, K.; Loizou, E.; Tzouvelekas, V. Rural Development through Input–Output Modeling. In Advances in Modeling Agricultural Systems; Springer Optimization and Its Applications: Boston, MA, USA, 2009; pp. 273–295. [Google Scholar] [CrossRef]
- Flegg, A.T.; Webber, C.D.; Elliott, M.V. On the Appropriate Use of Location Quotients in Generating Regional Input—Output Tables. Reg. Stud. 1995, 29, 547–561. [Google Scholar] [CrossRef]
- Flegg, A.T.; Tohmo, T. Refining the Application of the FLQ Formula for Estimating Regional Input Coefficients: An Empirical Study for South Korean Regions. Univ. West Engl. 2016. [Google Scholar] [CrossRef]
- Kowalewksi, J. Regionalization of National Input–Output Tables: Empirical Evidence on the Use of the FLQ Formula. Reg. Stud. 2015, 49, 240–250. [Google Scholar] [CrossRef]
- ELSTAT. Gross Value Added by Industry. 2019. Available online: https://www.statistics.gr/en/statistics/-/publication/SEL12/- (accessed on 6 February 2022).
- ELSTAT. Hellenic Statistical Authority: Agriculture, Livestock, Fishery. 2020. Available online: https://www.statistics.gr/en/statistics/agr (accessed on 8 September 2020).
- Ministry of Rural Development and Food. Rural Development Programme 2014–2020: Establishment of Young Farmers. 2020. Available online: http://www.agrotikianaptixi.gr/el/content/ypometro-61-egkatastasi-neon-georgon (accessed on 6 February 2022). (In Greek).
- Ministry of Rural Development and Food. Rural Development Programme 2007–2013. Athens, Greece. 2014. Available online: http://www.minagric.gr/index.php/el (accessed on 6 February 2022).
- Flegg, A.T.; Mastronardi, L.J.; Romero, C.A. Empirical Evidence on the Use of the FLQ Formula for Regionalizing National Input-Output Tables: The Case of the Province of Córdoba, Argentina; Economics Working Paper Series: Bristol, UK, 2014; Available online: https://www2.uwe.ac.uk/faculties/BBS/BUS/Research/Economics Papers 2014/1406.pdf (accessed on 6 February 2022).
- Ciobanu, C.; Mattas, K.; Psaltopoulos, D. Structural Changes in Less Developed Areas: An Input-Output Framework. Reg. Stud. 2004, 38, 603–614. [Google Scholar] [CrossRef]
- Karelakis, C.D.; Lampiris, G.; Loizou, E. Assessment of the impact of Pillar I and II policy measures on the local economy: The case of the Central Macedonia region. Int. J. Sustain. Agric. Manag. Inform. 2020, 6, 214. [Google Scholar] [CrossRef]
- Giannakis, E.; Efstratoglou, S. An input-output approach in assessing the CAP reform impact of extensive versus intensive farming systems on rural development: The case of Greece. Agric. Econ. Rev. 2011, 12, 81–90. [Google Scholar]
- Efstratoglou, S.; Giannakis, E.; Psaltopoulos, D. Evaluating CAP alternative policy scenarios through a system dynamics approach in rural areas of Greece. In Evidence-Based Agricultural and Rural Policy Making: Methodological and Empirical Challenges of Policy Evaluation; EAAE: Ancona, Italy, 2011. [Google Scholar] [CrossRef]
- Petsakos, A.; Rozakis, S.; Tsiboukas, C. Risk optimal farm plans in the context of decoupled subsidy payments: The case of cotton production in Thessaly. J. Farm Manag. 2009, 13, 467–483. Available online: https://www.iagrm.com/content/large/journals/jofm/volume_13/jofm-vol13-no7-pages-498-514.pdf (accessed on 6 February 2022).
- Manos, B.; Bournaris, T.; Papathanasiou, J.; Chatzinikolaou, P. Evaluation of tobacco cultivation alternatives under the EU common agricultural policy (CAP). J. Policy Model. 2009, 31, 225–238. [Google Scholar] [CrossRef]
- Kampas, A.; Petsakos, A.; Vasilaki, A.; Stefopoulou, A. Rapid assessment of irrigation full cost: An application for the Pinios Local Organization for Land Reclamation, Greece. Water Resour. Econ. 2014, 6, 58–73. [Google Scholar] [CrossRef]
| Publisher’s Note: MDPI stays neutral with regard to jurisdictional claims in published maps and institutional affiliations. |
© 2022 by the authors. Licensee MDPI, Basel, Switzerland. This article is an open access article distributed under the terms and conditions of the Creative Commons Attribution (CC BY) license (https://creativecommons.org/licenses/by/4.0/).


 ,
, 

