Article

Selecting Disaster Waste Transportation Routes to Reduce Overlapping of Transportation Routes after Floods

1
Department of Fire and Disaster Prevention Engineering, Changshin University, Changwon 51352, Korea
2
Department of Safety Engineering, Dongguk University-Gyeongju, Gyeongju 38066, Korea
3
School of Architectural, Civil, Environmental and Energy Engineering, Kyungpook National University, Daegu 41566, Korea
*
Author to whom correspondence should be addressed.
Sustainability 2022, 14(5), 2866; https://doi.org/10.3390/su14052866
Submission received: 24 January 2022 / Revised: 22 February 2022 / Accepted: 25 February 2022 / Published: 1 March 2022
(This article belongs to the Section Sustainability in Geographic Science)

Abstract

:
Disasters have been a major subject of research considering damages caused in terms of losses of lives and properties and the functionality of critical services in cities. Floods generate large amounts of waste, causing several functional deteriorations, such as disrupted transportation, water supply, and wastewater management. Hence, it is necessary to establish an effective plan to secure urban resilience during the disaster response and recovery phases. This study proposes a method to reduce overlaps between disaster waste transportation routes and other emergency response activities after floods in the response and recovery phases. The network analysis of a geographic information system was used to analyze the supplying routes of evacuation, rescue/aid, hospital transportation, and police services for each disaster phase to reduce the overlapping of routes. The results showed that by using the proposed method, the average length of the disaster waste transportation routes increased by 25.29% and 9.80% in the response and recovery phases, respectively, whereas the length of the sections overlapping with the routes providing critical services decreased by 47.49% and 55.57% in the response and recovery phases, respectively. We believe that the proposed method identifies new corresponding key issues to establish disaster waste management plans to secure urban resilience after a disaster.

1. Introduction

Disasters not only cause losses of lives and properties in the region of damage, but also deteriorate the functions of critical activities in the city. In particular, floods generate large amounts of waste, which causes a variety of functional deteriorations, such as disrupted transportation, water supply, wastewater management, and electrical power services [1]. Therefore, disaster waste management is essential to response and recovery activities after a disaster [2,3,4]. As establishing an effective plan is crucial to prepare for a disaster [3,5], researchers have studied several effective management methods for various disasters. Previous studies on disaster waste transportation routes [4,6,7,8] have focused primarily on transportation efficiency; planning a short waste transportation distance is important for waste management and securing a city’s resilience after a disaster. Irrespective of whether the purpose was to select a disaster waste transportation route, some previous studies have considered the road network a primary analytic element for establishing an operation strategy to analyze the disruption of roads caused by disasters and to minimize or optimize the transportation cost or distance for the disaster waste collection and disposal processes. Cheng et al. [9] evaluated the reliability of each route in the road network and proposed a two-stage framework to estimate the overall reliability and failure of the disaster waste management system. Hu et al. [10] proposed a multi-objective linear program to minimize the total logistics costs in post-storm debris removal, which included economic costs (debris transportation and sweeping and urgent recruitment of trucks and people), traffic impacts (blockage and congestion caused by debris), and psychological impacts (perceived by communities). Pramudita and Taniguchi [11] modeled a debris collection operation pertaining to the issue of blocked road links caused by debris. Hu and Sheu [12] presented a reverse logistics system to reduce the risk and psychological cost of post-disaster debris.
In addition to road blocks, post-disaster traffic congestion significantly affects humanitarian logistics and rapid evacuation [13]. According to Liu et al. [14], “Emergency response activity relies on transportation networks”. Delays in waste management and transportation can disrupt services provided to disaster victims, such as shelter, food, medical care, and communication [15]. While previous studies on disaster waste transportation routes have focused mainly on the efficiency of the disaster waste disposal process, this approach is not sufficient for urban disaster management considering urban systems are interconnected. Parizi et al. [16] state, “Cities are dynamic entities and their components are constantly changing”. The connectivity between different urban elements is one of the important components of urban physical resilience. Increase in connectivity leads to a parallel increase in the points of the contact and exchange of urban elements, thereby facilitating the movement of people and goods [16]. Therefore, disaster waste disposal processes should consider the continuity of various critical services to secure resilience after a disaster. From this perspective, Sahin et al. [15] focused on providing rapid emergency relief supplies and developed a mathematical model to minimize earthquake waste transportation costs to solve congestion in traffic networks. Berktaş et al. [17] tested mathematical models and heuristic algorithms to develop a disaster waste removal methodology to provide effective and fast relief routes in the disaster response phase.
Going one step further from the aforementioned studies, this study focused on securing urban resilience during the disaster response and recovery phases based on the assumption that fewer overlaps between the disaster waste transportation routes and the routes used for supplying critical services to the city after a disaster will contribute to urban resilience. After a disaster, complete waste removal from damaged areas can be delayed until the recovery phase; however, the routes to such areas must be cleared of debris in the response phase [15]. In previous studies, waste removal was performed mainly by assuming the recovery phase. This study, however, considered both the response and recovery phases. Therefore, considering the routes used for supplying critical services may vary depending on the type and phase of the disaster, this study proposed a method to reduce the overlaps between the disaster waste transportation routes and other emergency response activities after floods in the response and recovery phases.

2. Literature Review

2.1. Critical Facility and Emergency Response Activities

The welfare and security of nations depend on the continuous flow of essential goods (energy, food, and water) and services (banks, health care, and public administration) provided by a series of systems called critical infrastructures or critical facilities. According to the Federal Emergency Management Agency:
“Critical facilities commonly include all public and private facilities that a community considers essential for the delivery of vital services and for the protection of the community. They usually include emergency response facilities (fire stations, police stations, rescue squads, and emergency operation centers [EOCs]), custodial facilities (jails and other detention centers, long-term care facilities, hospitals, and other health care facilities), schools, emergency shelters, utilities (water supply, wastewater treatment facilities, and power), communications facilities, and any other assets determined by the community to be of critical importance for the protection of the health and safety of the population”.
[18]
Considering the importance of infrastructure in maintaining the quality of urban life, improving urban resilience is of crucial concern for planners and policy makers [19]. The inability or destruction of critical facilities significantly affects the health, safety, security, economy, and social welfare of communities [20]. Cimellaro et al. [21] observed that the function of physical infrastructures significantly affects the recovery process after a disaster and is highly essential in resilient communities. In addition to direct flood damages (loss of lives and property), the disruption of public services can severely impact the community, even if for a short term [22]. Owing to the broad range of critical services for the critical functions of cities, this study focused on critical services that are closely related to the preservation and safety of human lives. Evacuees may get injured or require rescuing immediately after flooding or during the evacuation process. Furthermore, given that evacuation facilities are group accommodation facilities, they are at risk for contagious diseases after evacuation, requiring emergency/medical services depending on the health conditions of the evacuees. Therefore, securing the safety and security of evacuees in shelters after a disaster is a serious problem that needs to be addressed [23]. Hino et al. [23] revealed that after the Great East Japan Earthquake in March 2011, most evacuees staying at shelters became victims of crimes in shelters or were afraid of getting robbed in their homes. Furthermore, it was found that long-term stays at shelters cause conflicts among evacuees for shelter-related resources [23,24,25]. A survey conducted in 2005 reported that 22% of the evacuees from Houston during Hurricane Katrina received threats of violence whereas 34% of the evacuees at the Superdome or the New Orleans Convention Center were threatened with violence [26,27].

2.2. Flood Impact on People and Vehicles in Experimental Research

Several studies have estimated the loss caused by flooding, depending on the damage size, including the development of a mortality rate function [28]. However, very few have evaluated evacuation conditions where human lives were threatened by floods. Studies on the direct impact of floods on walking evacuees [29,30,31,32,33,34,35] have mainly focused on the depth and velocity of flood water [36]. DEFRA and the Environment Agency [30] stated that it is necessary to classify flood hazards in flood hazard mapping for the development of guidance and, hence, proposed a risk estimation equation based on the flood depth and flow rate. Ishigaki [31] and Ishigaki et al. [32] conducted experimental studies on evacuation from underground spaces in the event of urban flooding. The results showed that a water depth of 0.3 m is critical for evacuating people from underground spaces. Dias et al. [35] measured the walking speed in ankle, knee, and waist deep water depths during floods and found that the average walking speed decreased by 22% and 41% at water depths of 0.08 m (ankle) and 0.90 m (waist), respectively. Bernardini et al. [34] conducted experiments with over 200 participants and found that the evacuation speed decreased when the flooding depth increased in the water depth range of 20–70 cm. Furthermore, they emphasized the role of personal characteristics (age, height, and gender) in the evacuation speed. However, very few studies have demonstrated changes in walking speed based on the water depth and flow rate in the Republic of Korea. Kang [29] conducted walking experiments by using the flow rate and water depth as variables in a straight concrete water channel with a width, depth, and length of 0.75 m, 0.60 m, and 30 m, respectively, and suggested that less than or equal to 0.55 m is an appropriate water depth for evacuation. Lee et al. [33] conducted experiments with 32 subjects (20 males and 12 females) and stated that the ideal time to evacuate during a flood is when the water depth is less than 40 cm.
The effects of inundation on traffic have not attracted much attention so far. Previous studies have focused on the operability of vehicles based on the flood depth. DEFRA and the Environment Agency [30] summarized the following reasons for facing difficulties in operating vehicles during floods: the presence of water stops the engine from functioning, the vehicle floats, and the vehicle becomes difficult to control. Furthermore, they observed that vehicles may stop and float at a relatively shallow depth of about 0.5 m. Pregnolato et al. [37] examined empirical, simulation, and experimental results on the effects of extreme weather to explain the impact of flooding on road traffic congestion. Based on the observation and driving tests, they suggested 30 cm as the maximum critical depth for safe driving, stopping, and steering (without the loss of control). Smith et al. [38] conducted experiments under flood conditions for two classes of vehicles and suggested 30 cm and 50 cm as the maximum critical depths for small passenger cars and large four wheel drive (4WD) vehicles, respectively. Kramer et al. [39] performed flume experiments and suggested 0.3 m and 0.6 m as the recommended safety criteria for passenger cars and emergency vehicles, respectively. They also recommended that roads in the danger zone and with a flood depth of 0.5 m or more be closed for civil traffic.

3. Material and Methods

Many metropolitan areas worldwide experience high traffic congestion, which indicates that urban traffic systems are already under stress [40]. In such conditions, even the smallest changes in traffic flow can cause broad disruptions, spatially considering traffic systems are very non-linear [41]. Previous studies have demonstrated that even if some parts of roads are closed due to flooding, congestion can spread throughout the network and cause a delay in the travel time [42]. Furthermore, according to Kasmalkar and Suckale [41], the inundation of major roads due to flooding can cause traffic to spread to nearby areas, potentially leading to a spike in accident rates.
Therefore, this study focused on the overlaps caused by various activities to secure urban functions after a disaster. Considering the demand of victims for critical urban functions can vary during the response and recovery processes, this study classified the temporal range into the response and recovery processes. Furthermore, we assumed that the spatial points where the victims’ demands occurred were mainly inundated buildings and evacuation facilities in the response and recovery processes, respectively. In other words, as shown in Table 1, critical services are required during the response process to approach from critical facilities to inundated buildings due to flooding. Conversely, because critical services are required at evacuation facilities, critical services approach from critical facilities to evacuation facilities during the recovery process. In both processes, the transportation routes of disaster wastes move from the temporary disaster waste management site (TDWMS) in the area to inundated buildings.
This study used the network analysis of the geographic information system (GIS) to analyze the routes providing critical services and the transportation routes of disaster wastes. Table 2 summarizes the restrictions in the movement of people and vehicles owing to inundation situations in the response and recovery processes. Furthermore, we assumed that small and large vehicles were used to provide rescue/aid and police services and remove and transport wastes, respectively. Furthermore, we set the critical inundation depths for the passages of small (30 cm) and large vehicles (50 cm) based on the findings of Smith et al. [38] and Kramer et al. [39]. Previous studies on the walking speed depending on the flood depth have suggested 30–55 cm as the critical inundation depth range, which varied depending on the personal characteristics (age, height, and gender). Because personal characteristics were not taken into consideration in this study, we set the critical inundation depth for walking evacuation as 30 cm, which was the smallest value of the critical inundation depth. Figure 1 shows the flow of analysis of this study. In the GIS network analysis, “barriers”, which are feature classes in the network analysis layers that restrict or alter the costs of the underlying edges and junctions of the associated network dataset, can be set [43].
We selected Gangnam and Seocho districts in Seoul, South Korea, as one of the habitual inundation areas for the case study, considering this area has many past inundation histories and is densely populated with people and critical facilities, which made it suitable for the disaster waste transportation route selection method proposed in this study (Figure 2).
As shown in Figure 1, the first analysis is the “overlay analysis” stage, which requires flood simulation results or flood maps to analyze the waste discharging areas and road inundation depths, depending on the flood. We used the EPA storm water management model and the FLO-2D software to derive the flood simulation results, shown in Figure 3. The waste discharging areas and the inundation depths of the roads were analyzed by performing overlay analysis using the building and road data, as well as the flood simulation results for the research target area.
The second stage of the analysis is the “closest facility (1)” stage, which analyzes the routes providing critical services while considering the classification of the mobility of people and vehicles depending on the inundation circumstance in each disaster phase (the restrictions are summarized in Table 2). We set the “restrictions”, depending on the flood depth for the route analysis of the vehicle operation and evacuation on the critical service provision routes. Restriction line barriers were used to prohibit operation at every point that intersects with the network. The analysis results were extracted in the form of “lines”.
The third stage of the analysis is the “closest facility (2)” stage, which determines the waste disaster transportation routes for each disaster phase. In this stage, the restrictions summarized in Table 2 were applied, depending on the disaster phase. Based on the assumption that the priority was to supply critical services to secure the safety and health of victims, we derived the shortest-path-based disaster waste transportation routes; however, we assigned “2” to the “Scaled Cost” in the analysis result (“line”) of the second stage to reduce the sections overlapping with the travel routes of critical services. Scale cost line barriers were used to model the extra time required to pass through the set zone, which incurs a specified cost. Figure 4 shows the distribution of critical facilities in the research target area.

4. Results

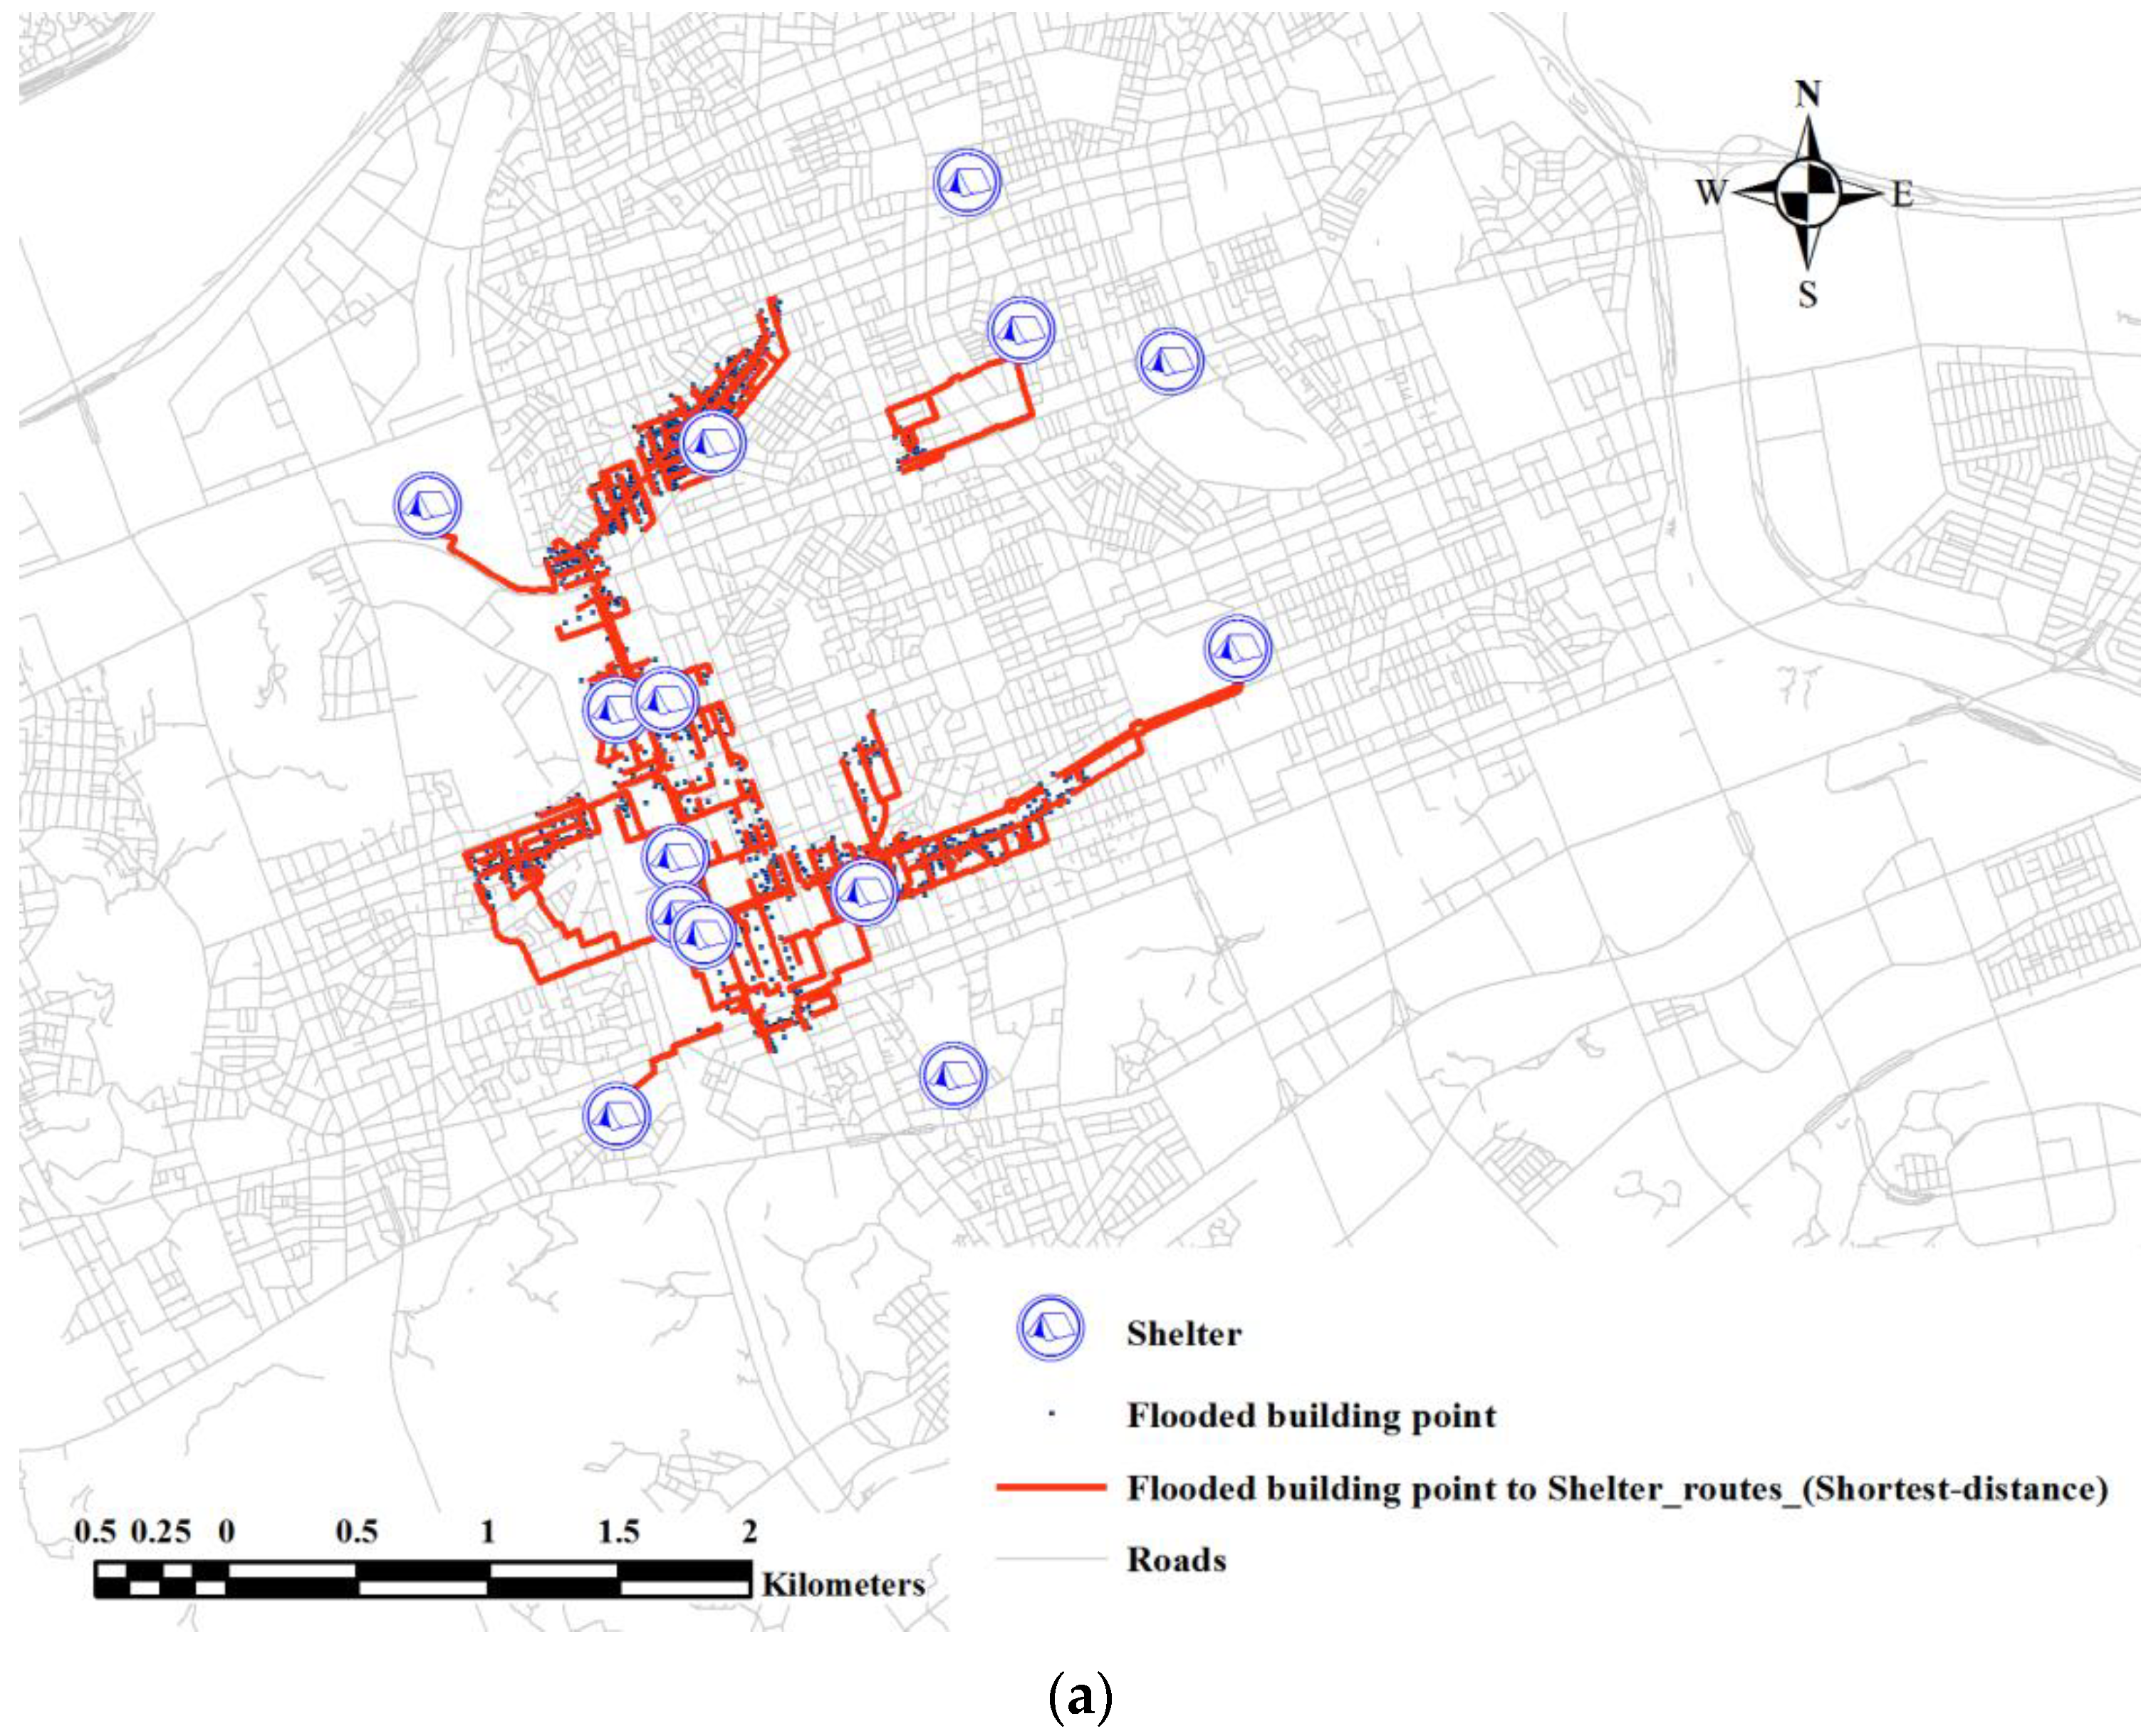
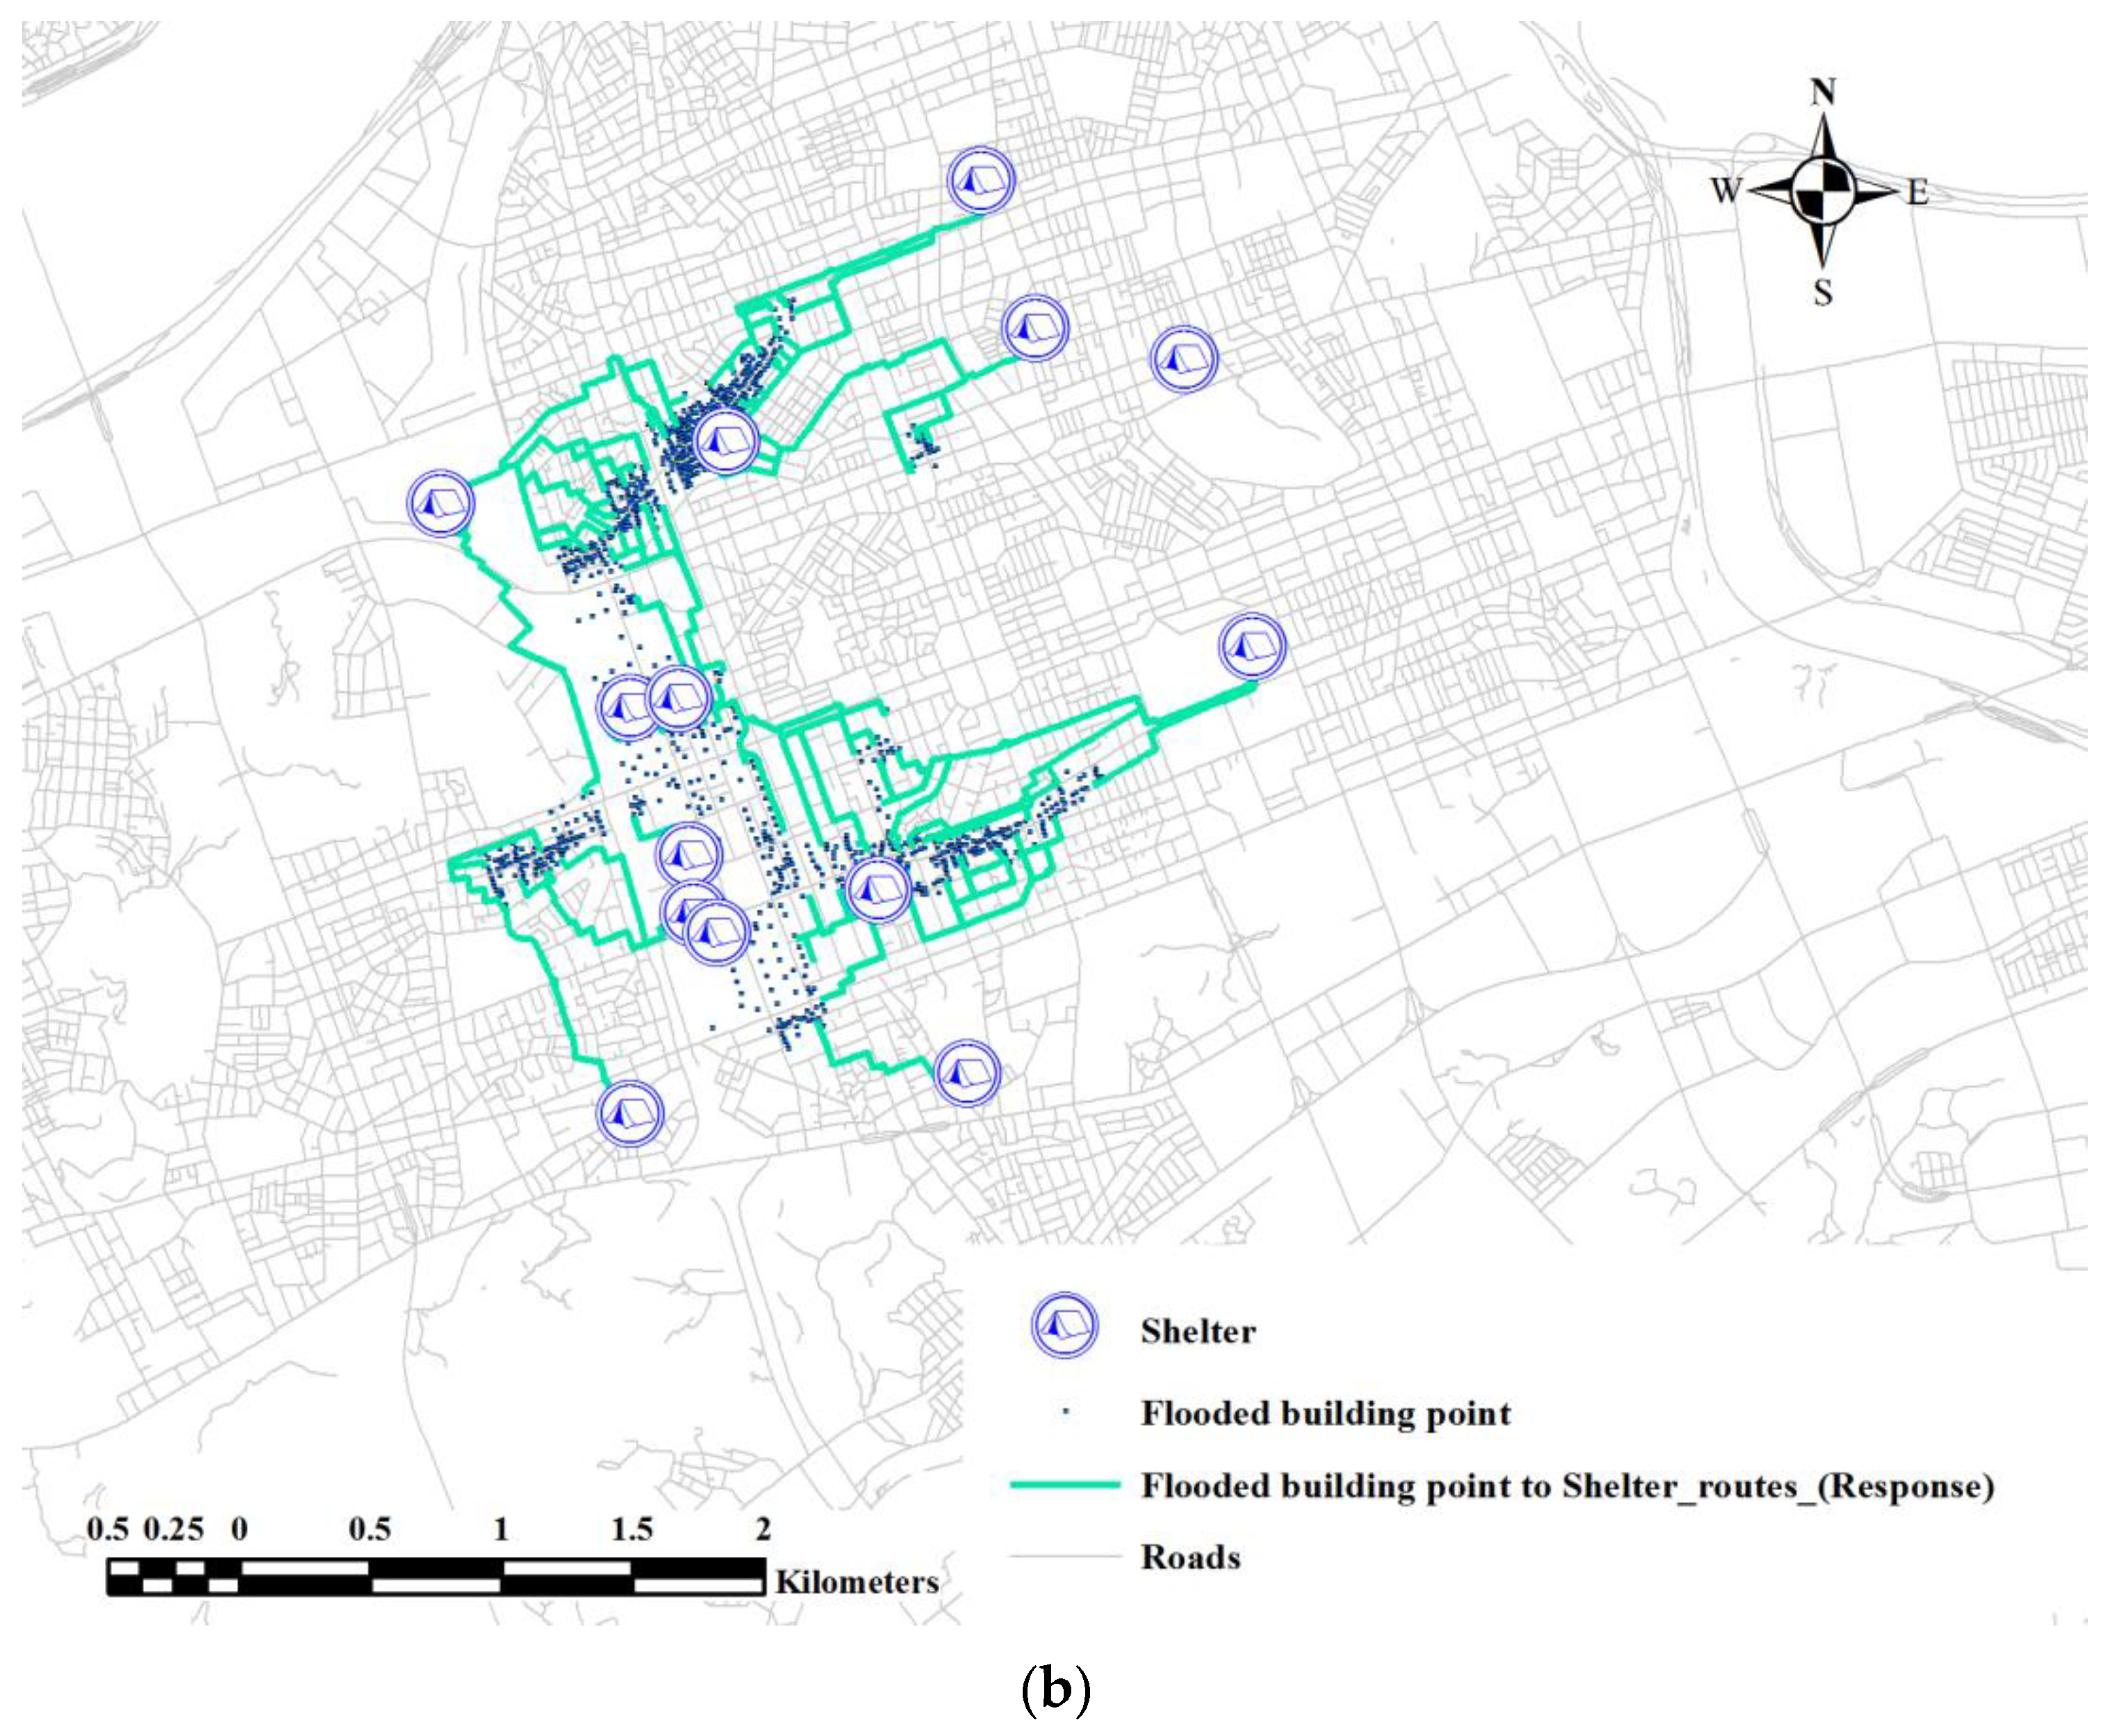
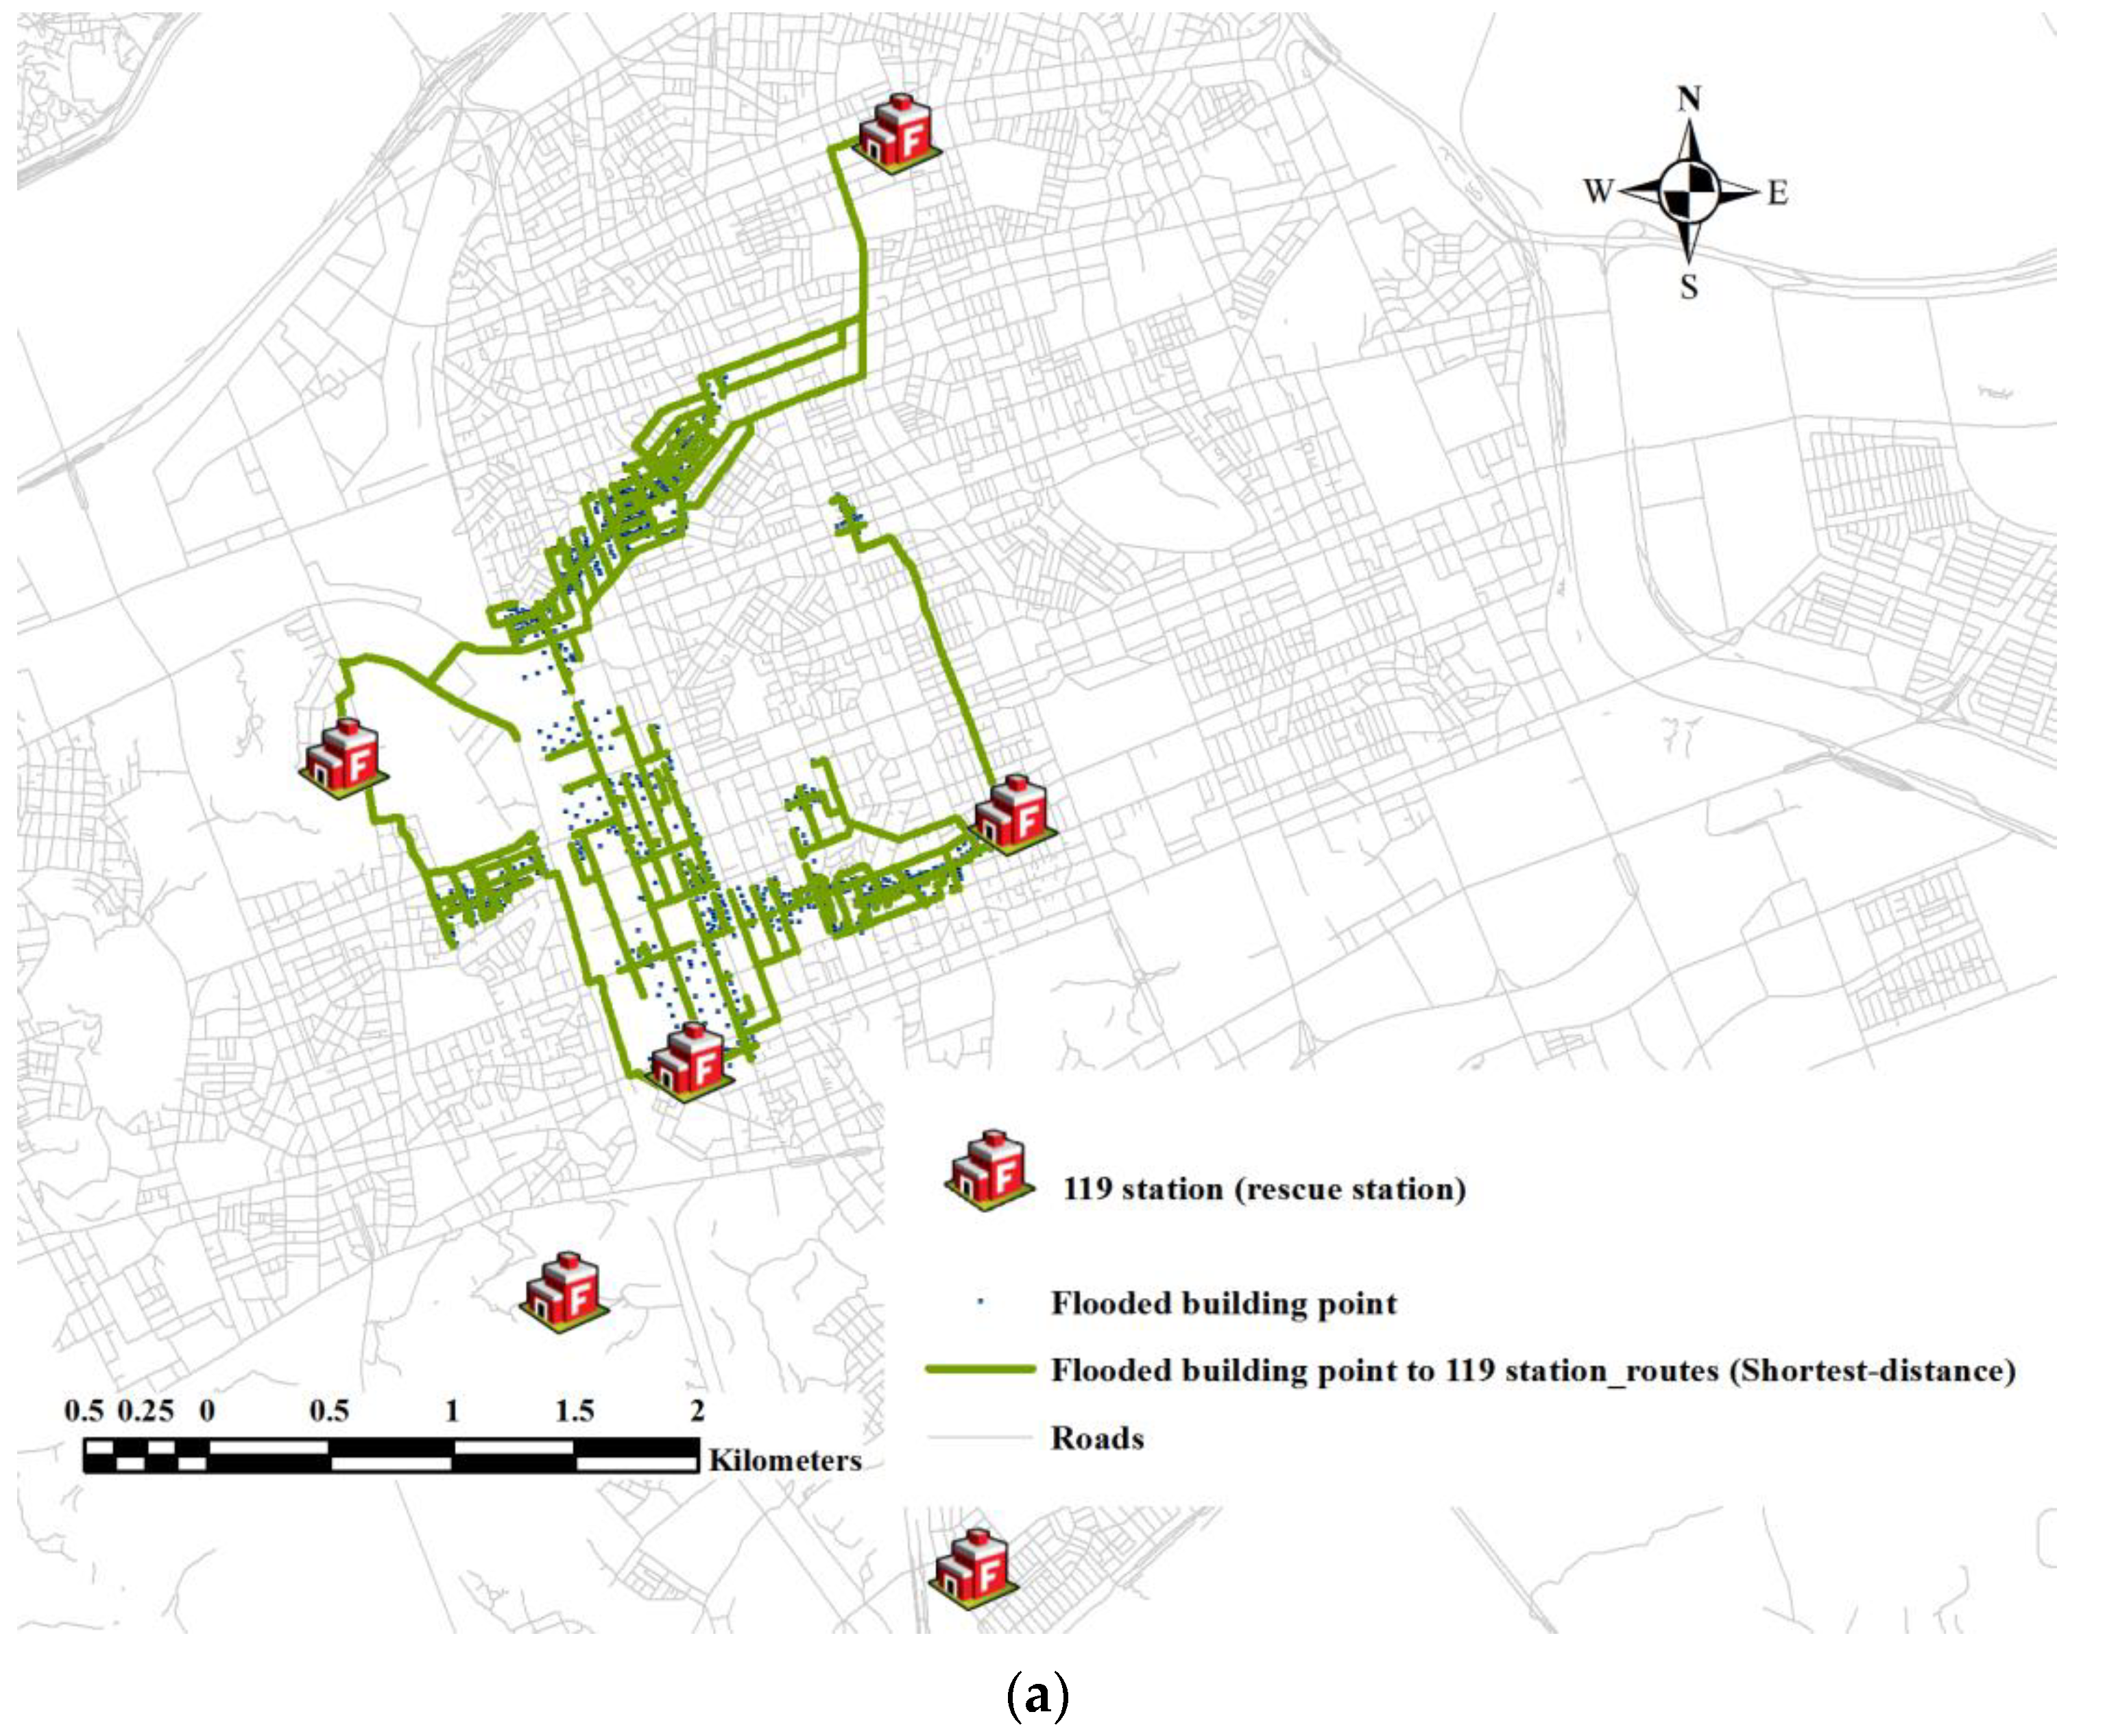
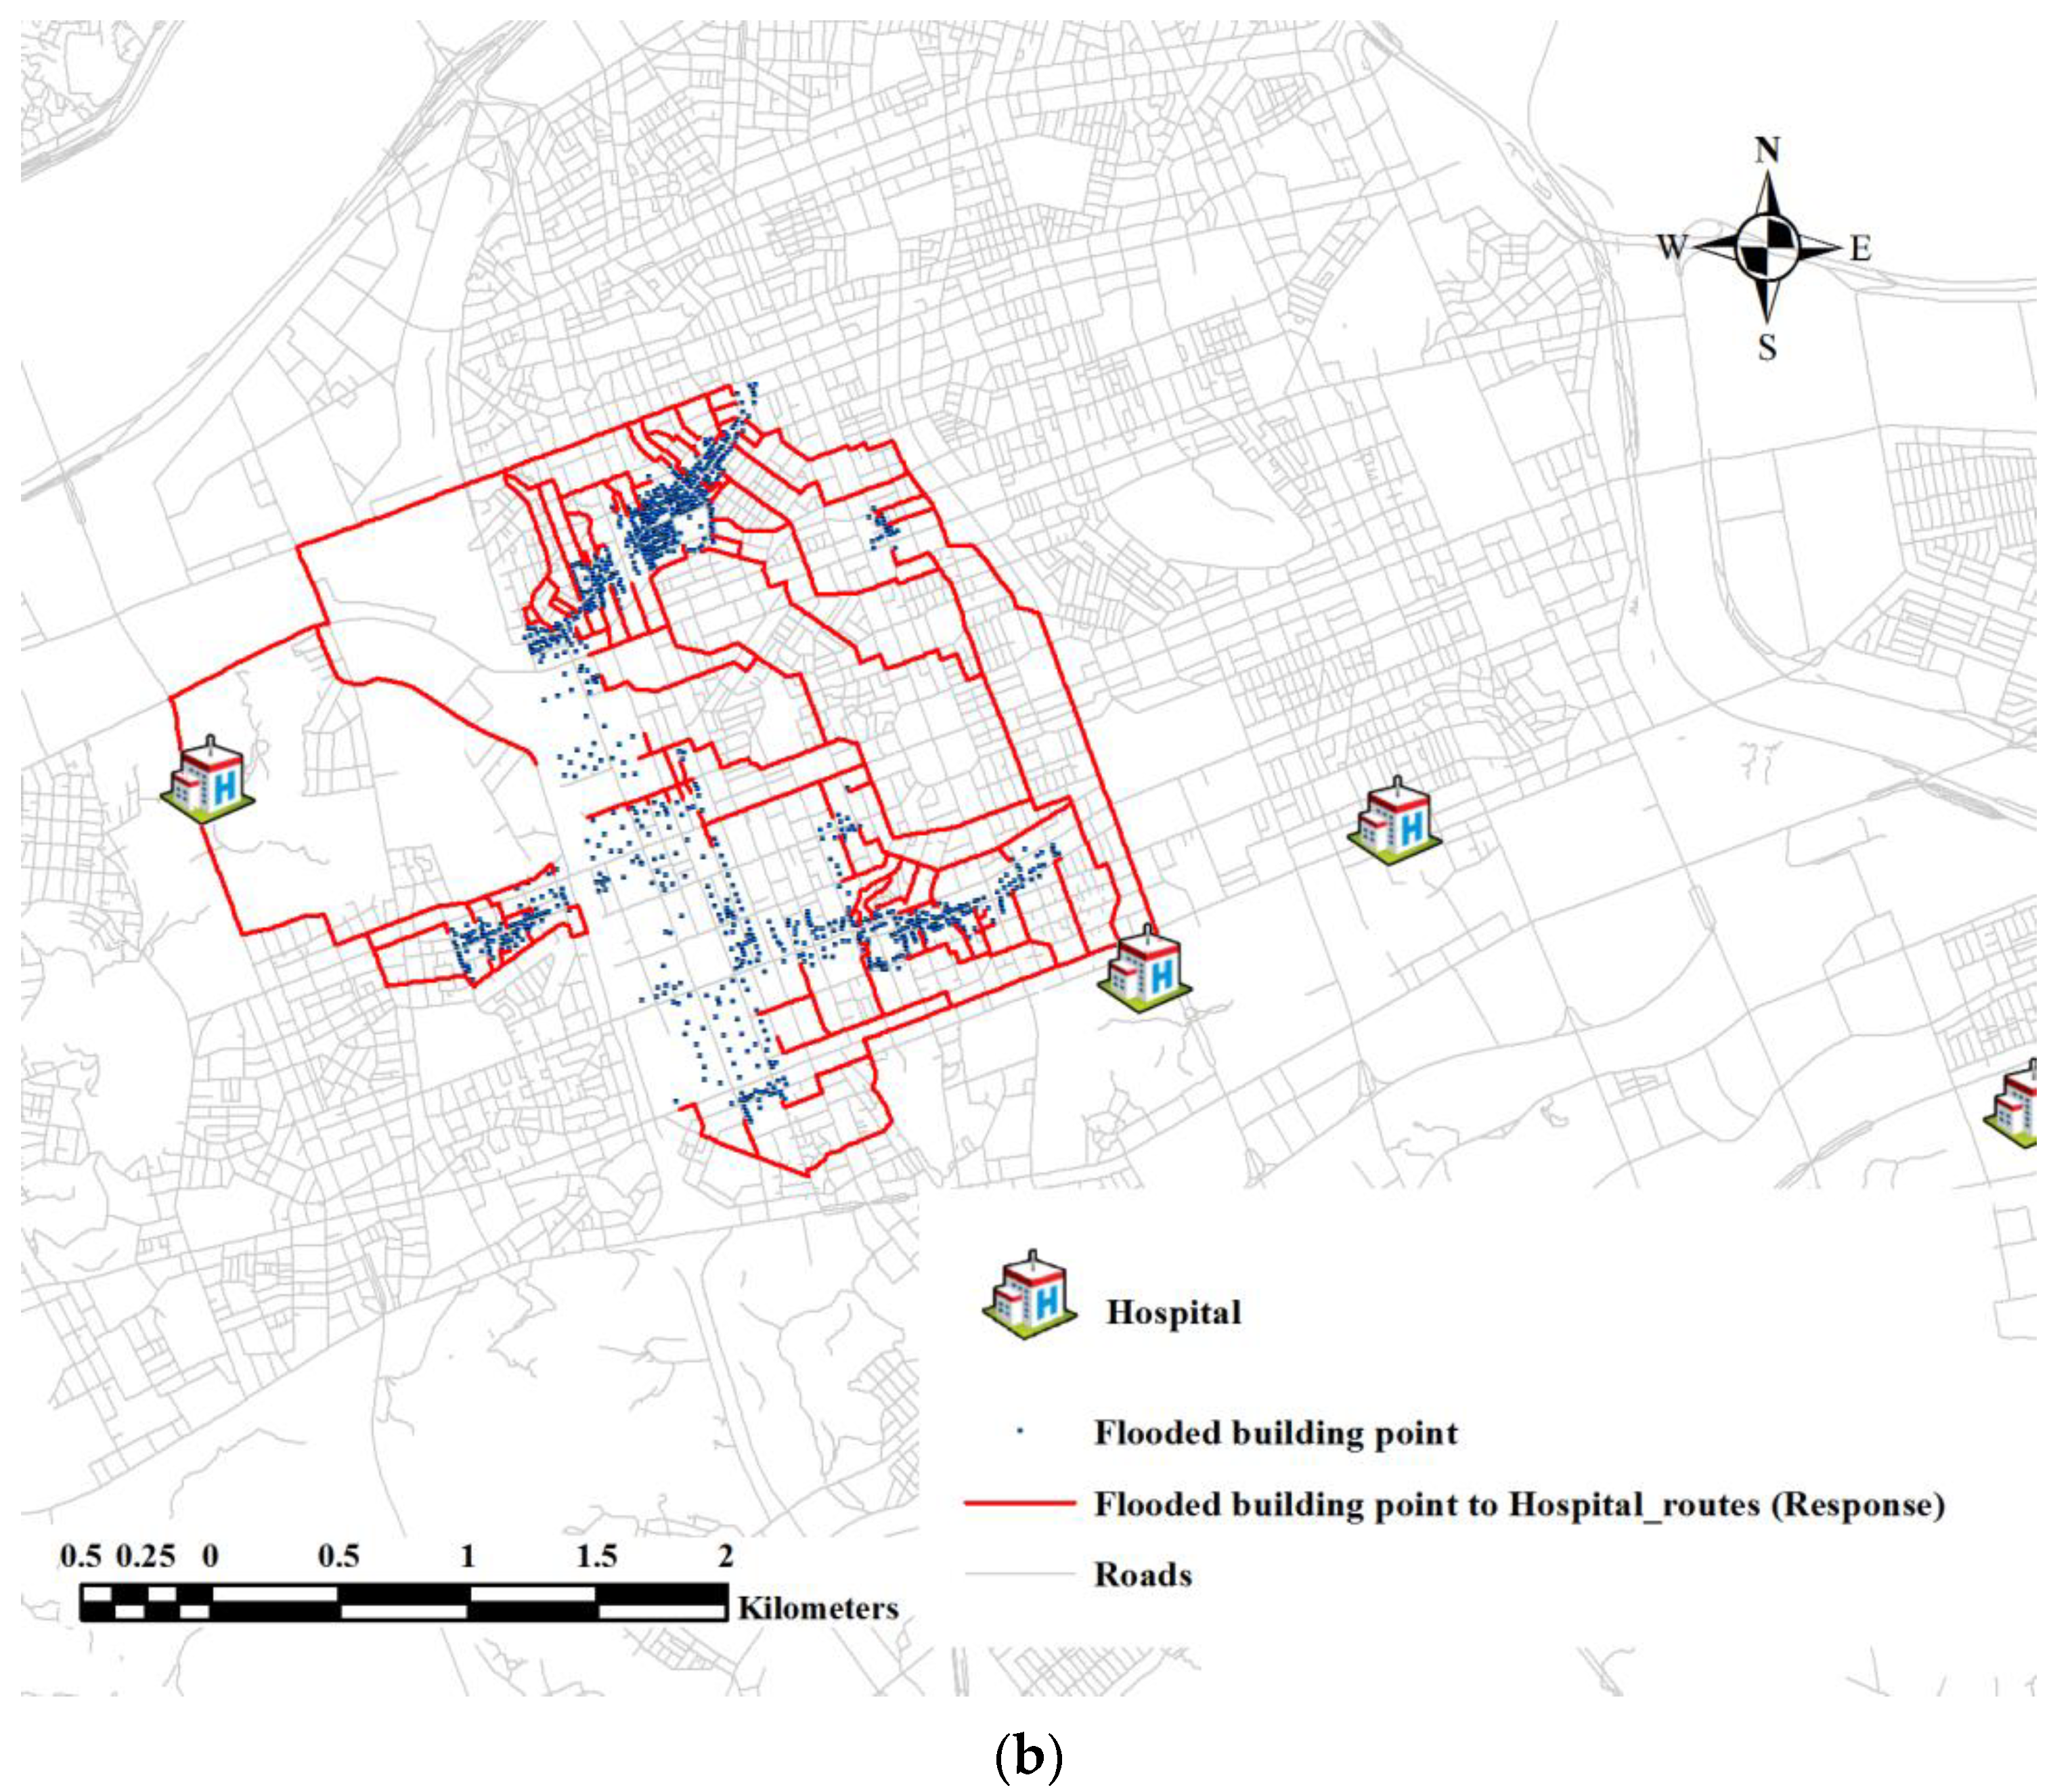
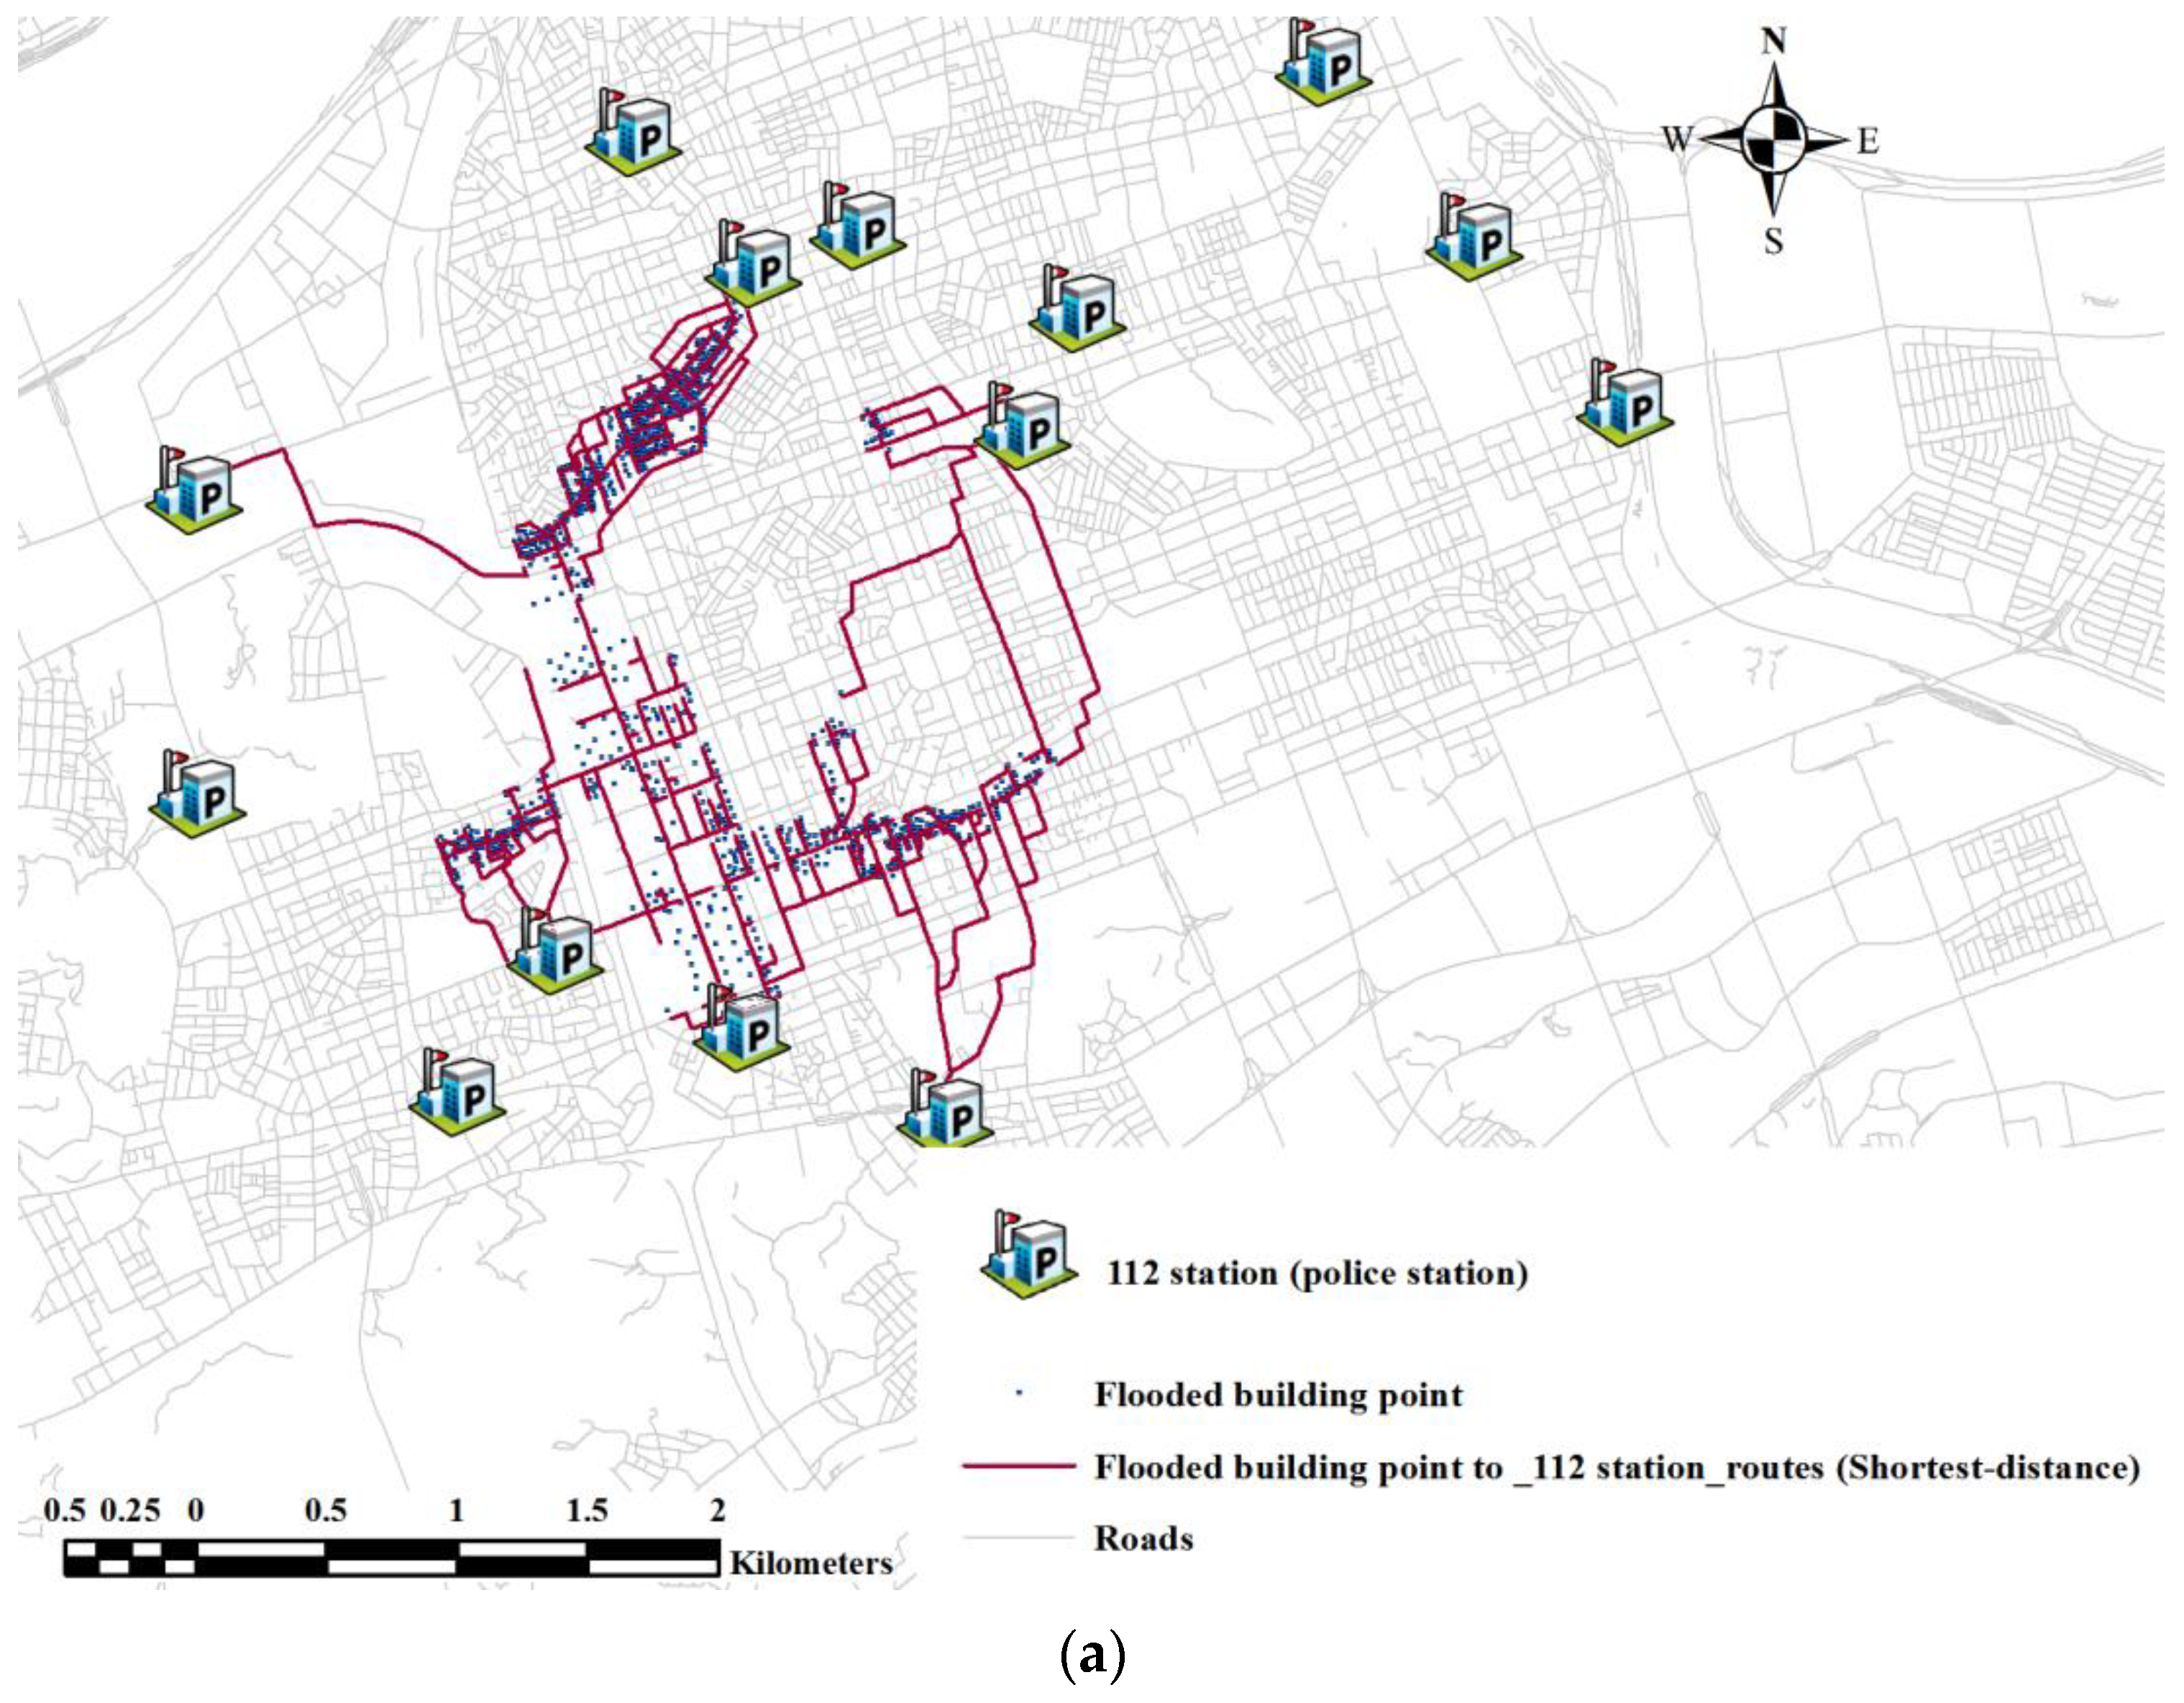
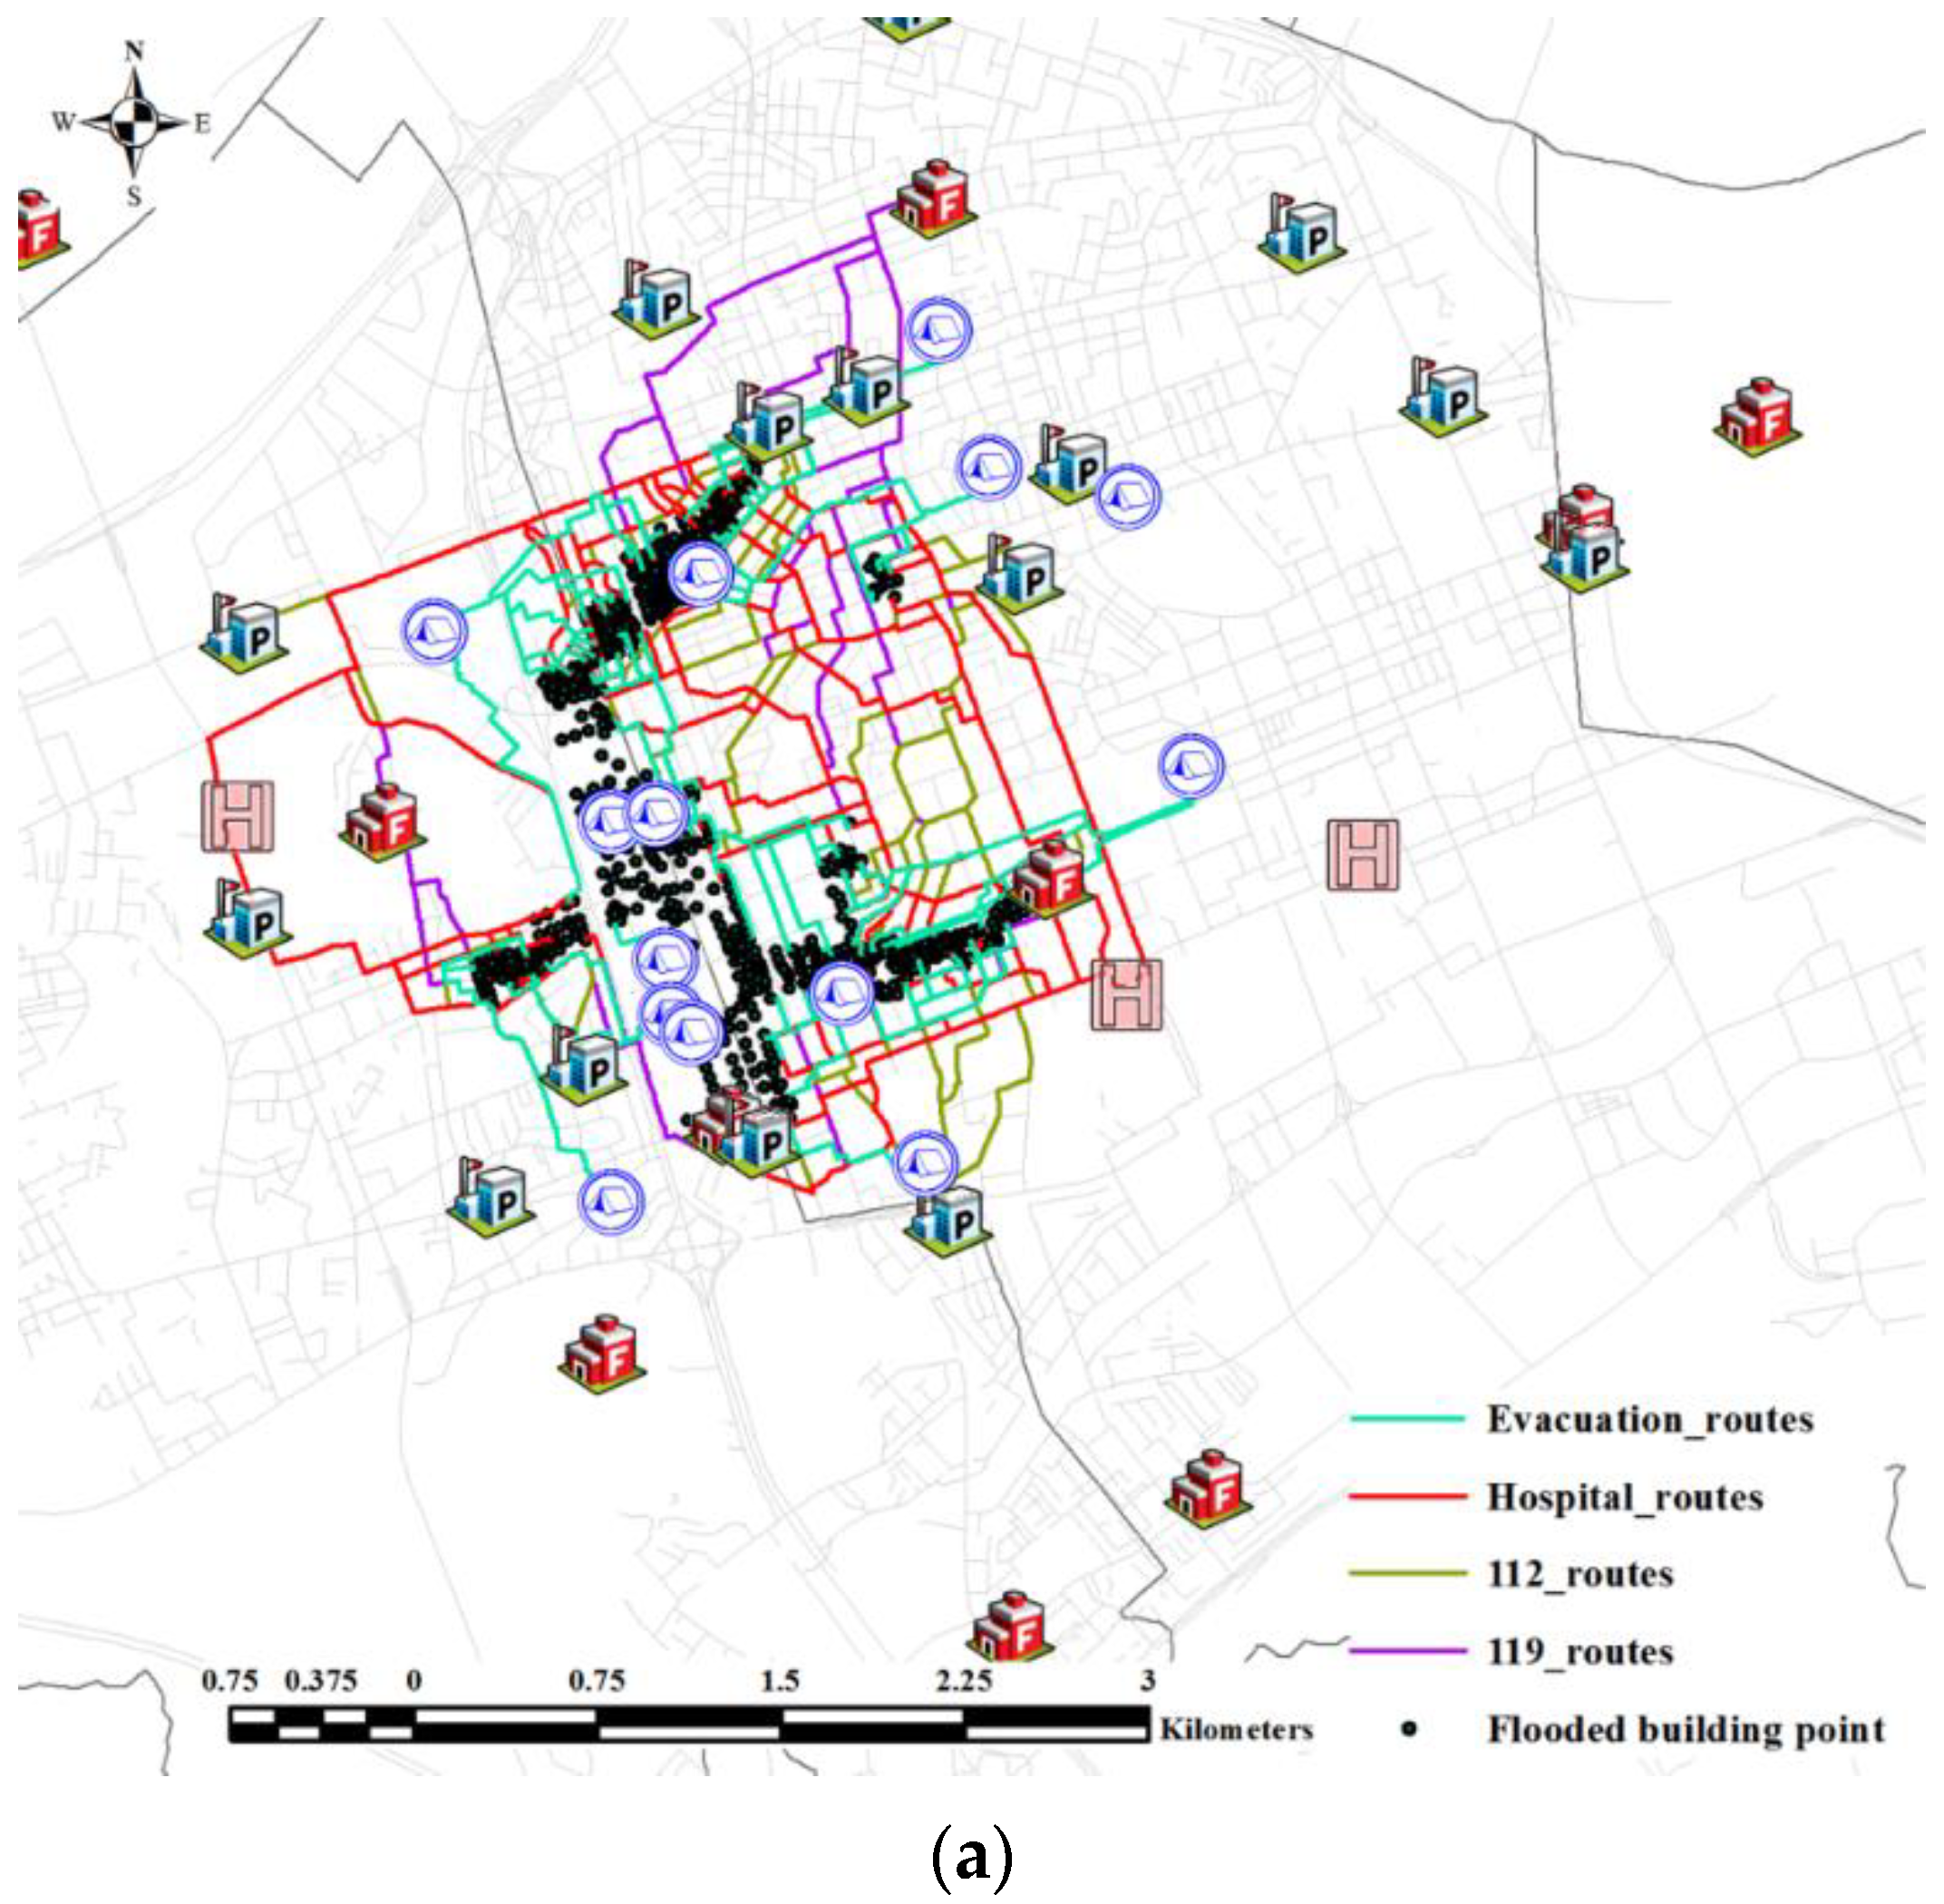
4.1. Disaster Waste Transportation Routes in the Response Phase

Delays in the disposal of disaster wastes in the disaster response phase can cause difficulties in maintaining various urban functions. In particular, the evacuation, rescue/aid, hospital transfer, and police service of victims should be ensured. As mentioned in Section 3, we analyzed the shortest-distance-based critical service provision routes (“closest facility (1)”) provided by shelters, 119 stations (rescue), 112 stations (police), and hospitals, as shown in Figure 4. In the response phase, we assumed that it is impossible to operate vehicles on roads where the flood depth is greater than or equal to 30 cm based on the flood simulation results of a situation where flood water is quite deep.
Furthermore, in the “closest facility (2)” stage of the analysis, we derived the shortest distance of the disaster waste transportation routes while reducing the overlapping between roads and routes providing critical services, as shown in Figure 5a. We derived routes shown in Figure 5b. In the response phase, we assumed that it is impossible to operate waste transportation vehicles on roads where the flood depth is 50 cm or deeper and set it as a “restriction”. Furthermore, we assigned “2” to the “Scaled Cost” on the critical service provision routes (Figure 5a) to reduce sections from the overlapping with the travel routes of critical services.
Figure 6 and Table 3 compare the results with and without the “Scaled Cost” to reduce the overlapping sections with the critical service provision routes. On deriving the shortest route without considering the critical service provision routes, the shortest distance was found to be 7659.33 m on average. When the “Scaled Cost” was applied, the shortest distance of disaster waste transportation routes was found to be 10,252.60 m on average. When detours were selected to reduce the overlapping sections with the critical service provision routes, the length of the transportation route increased by an average of 25.29%.
Conversely, when transporting disaster wastes on the shortest routes, a total of 256,626.49 m overlapped with the critical service provision routes. However, when the proposed method was applied, the overlapping decreased by approximately 47.69% (only 134,758.91 m overlapped).

4.2. Disaster Waste Transportation Routes in the Response Phase

We assumed that the flood water was very shallow in the recovery phase and hence had no impact on vehicles and people walking. Figure 7a shows the results of analyzing the shortest-distance-based critical service provision routes (“closest facility (1)”) provided by shelters, 119 centers, 112 centers, and hospitals, as mentioned in Section 3. Considering the routes providing critical services in the recovery phase were set to be approaching routes from critical facilities to evacuation facilities, the critical service provision routes were analyzed relatively simply, unlike those shown in Figure 5a.
As described in Section 4.1, we proceeded with the “closest facility (2)” stage to derive the disaster waste transportation routes of the shortest distance while reducing overlaps with the critical service provision routes, as shown in Figure 8. To reduce the section overlapping, we assigned “2” to the “Scaled Cost” on the critical service provision routes (Figure 7a). In the recovery phase, no zone was set with a “restriction” considering we assumed a situation with very shallow or no flood water. Figure 7b shows the results of analyzing the disaster waste transportation routes in the recovery phase.
Figure 8 and Table 4 compare the results with and without the “Scaled Cost” to reduce the overlapping sections with the critical service provision routes. When the shortest routes were derived without considering the critical service provision routes, the shortest distance was found to be 5976.14 m on average. When the “Scaled Cost” was applied, the average length of the disaster waste transportation routes was found to be 6625.14 m. When detours were chosen to reduce the overlapping sections, the length of the transportation route increased by an average of 9.80%.
Conversely, when transporting disaster wastes on the shortest routes, a total of 525,859.53 m overlapped with the critical service provision routes. However, when the proposed method was applied, only 233,657.63 m overlapped, indicating a decrease of approximately 55.57%.

5. Discussion

5.1. Routes of Dispatching Services to Secure Urban Functions in Each Disaster Phase

The research on road disruption prediction after a disaster has attracted wide attention. Research has been ceaselessly conducted on disasters that cause direct or indirect damage to road facilities, such as floods [44,45], earthquakes [15,46,47,48], bushfires [49], and storms [10,49]. This study predicted the disruptions in roads, depending on the flood prediction results (expected flood depth). Appendix A (Figure A1, Figure A2, Figure A3 and Figure A4) details the difference between shortest-distance-based critical service approach routes and road disruption prediction-based critical service approach routes. On applying the findings to the research target area, which is a habitual flooding area, it was found that the travel distance for supplying critical services in the response phase increased by approximately 15.96–168.50% when the maximum flood depth was assumed (see Figure A5). However, the discussions on the overlapping sections with the critical service provision routes, as in this study, were very limited. Therefore, this study derived transportation routes to provide critical services to victims and proposed a method of reducing the overlapping sections with these routes when deriving disaster waste transportation routes. When applied to the target area, detours were selected to reduce the overlapping sections with the critical service provision routes; as a result, the length of the transportation routes in the response and recovery phases increased by 25.29% and 9.80% on average, respectively. Conversely, the length of the sections overlapping with the critical service provision routes in the response and recovery phases decreased by 47.49% and 55.57%, respectively. According to Cutter et al. [45], “Improved disaster-risk management and resilience is essential for sustainable societies”. It is important to plan short distances to transport disaster wastes to improve urban physical resilience after a disaster. However, in this study, we assumed that the priority was to supply critical services to secure the safety and health of victims. The results of this study may vary significantly, depending on the selection of priorities or the importance of critical services for maintaining urban functions. The proposed method can be enhanced to analyze the importance between the supply of critical services and the disposal of disaster wastes in the event of a disaster.

5.2. Research Limitations and Future Research Directions

This study proposed a method of reducing the overlapping of routes for various emergency response activities in disaster-affected areas to contribute to securing urban resilience. Urban resilience, however, is a multifaceted concept that involves sociocultural, economic, institutional–organizational, environmental, and physical dimensions [16]. This study focused on physical resilience (especially various functional components and connectivity) among multiple dimensions that constitute urban resilience. The community of disaster risk researchers is small and divided into areas focused on a single natural disaster [45]. This presents many unresolved challenges to the analysis of urban resilience. The limitations of this study and future research directions are as follows.
The first issue is traffic resilience after flooding. Urban areas can be greatly affected by the disrupted flow of important resources [50]. Therefore, disaster managers should strive to secure critical functions of the city for urban disaster management. Although the proposed method can minimize the overlaps with the routes providing critical functions to secure the resilience of a road network, it can only partially provide resilience focusing on travel efficiency considering it is still difficult to quantify traffic resilience due to the complex characteristics of traffic systems [41]. Generally, road connectivity refers to the density of connections and the directness of links in the urban road network to simplify the movement between origins and destinations [51]. In other words, a road network with better connectivity can minimize the travel distance between the origin and the destination by contributing to more road selections and direct routes. Kasmalkar et al. [42] stated that areas with dense road networks are more resilient to flood-related travel time delays, considering the capacity of alternate roads that can offset the increase in potential traffic is sufficient. Although this study does not consider the density or directness of the road network, additional road disruptions that can occur after a disaster should be evaluated by analyzing the density of connections and the directness of links in the road network.
The second issue is route optimization for emergency response activities after flooding. In this study, the walking evacuation of victims and the movement of vehicles after flooding were determined according to the water depth in the response and recovery phases, respectively. This methodology cannot be seen as the optimization of route selection and needs to be supplemented with optimization technologies, such as mathematical modeling. In addition, the critical depth was classified based on experimental values for the effects of the flood depth on people and vehicles, but the speed reduction for a flood depth lower than the critical depth was not considered. Meanwhile, the speed reduction of vehicles according to the rainfall intensity can be found in observational studies [52,53,54,55]. The methodology proposed in this study needs to be supplemented through an integrated analysis of the walking evacuation of victims and the movement of vehicles over time after flooding. The optimal road width for enhancing urban resilience may vary, depending on the geometric structure, land-use intensity of the area, disaster type, and disaster risk management phase [56]. Although this study did not consider the traffic or road width to supply critical services of the city, it should be considered when analyzing optimal routes for the smooth operation of vehicles.
The final issue is the continuity of the functions of critical facilities after flooding. This study focused on the blockage of transportation networks due to flooding but did not consider possible damage to emergency response facilities. In future research, possible damage to emergency response facilities in the event of a disaster and the possibility of maintaining their functions must be considered simultaneously to maintain the functions of a city in the event of a large-scale disaster.

6. Conclusions

This study proposed a method for selecting the shortest disaster waste transportation routes by focusing on the disruption prediction of roads after a disaster and the overlapping routes used to supply critical services in the city. The GIS network analysis was used to analyze the supplying routes of evacuation, rescue/aid, hospital transportation, and police services for each disaster phase to in turn reduce the parts where the disaster waste transportation routes and critical service supply routes overlap. Furthermore, we conducted a case study wherein the proposed method was applied to Gangnam and Seocho Districts in Seoul, South Korea, which are habitual flooding areas. The results showed that the average length of the disaster waste transportation routes increased by 25.29% and 9.80% in the response and recovery phases, respectively, compared to the shortest path. Conversely, the length of the sections overlapping with the routes providing critical services decreased by 47.49% and 55.57% in the response and recovery phases, respectively.
Urban resilience is a common approach to reducing long-term urban vulnerabilities [50], considering the design of the road network has a long-term impact on urban resilience owing to its long lifespan. Nevertheless, the resilience of the road network has not been sufficiently explored [56]. In particular, discussions on the overlapping sections with critical service provision routes for predicting disruptions on roads are very limited. Therefore, we believe that the proposed method identifies new corresponding key issues to establish disaster waste management plans for securing urban resilience after a disaster. Furthermore, the proposed method can be used to establish an appropriate strategy for providing critical services to secure urban functions after a disaster and increase the resilience of disaster waste management systems.

Author Contributions

All authors contributed extensively to the work. Y.-H.L. and Y.-C.K. conceptualized and designed the study. Y.-H.L., Y.-C.K., and H.S. produced the data required to apply the methodology to the study area and conducted the analysis, validation, and writing of the original draft preparation. Y.-H.L. and H.S. analyzed the results and drafted and edited the manuscript. Y.-H.L. supervised the project and acquired the funding. All authors have read and agreed to the published version of the manuscript.

Funding

This research was supported by Basic Science Research Program through the National Research Foundation of Korea (NRF) funded by the Ministry of Education (No. 2020R1I1A1A01075037).

Institutional Review Board Statement

Not applicable.

Informed Consent Statement

Not applicable.

Data Availability Statement

Not applicable.

Conflicts of Interest

The authors declare no conflict of interest.

Appendix A

Figure A1. (a) Shortest-distance-based evacuation routes; (b) road disruption prediction-based evacuation routes.
Sustainability 14 02866 g0a1aSustainability 14 02866 g0a1b
Figure A2. (a) Shortest-distance-based rescue service approach routes; (b) road disruption prediction-based rescue service approach routes.
Sustainability 14 02866 g0a2aSustainability 14 02866 g0a2b
Figure A3. (a) Shortest-distance-based medical service approach routes; (b) road disruption prediction-based medical service approach routes.
Sustainability 14 02866 g0a3aSustainability 14 02866 g0a3b
Figure A4. (a) Shortest-distance-based police service approach routes; (b) road disruption prediction-based police service approach routes.
Sustainability 14 02866 g0a4aSustainability 14 02866 g0a4b
Figure A5. Comparison between the average distances of the shortest-distance-based critical service approach routes and the road disruption prediction-based critical service approach routes.
Sustainability 14 02866 g0a5

References

  1. Jha, A.K.; Bloch, R.; Lamond, J. Cities and Flooding: A Guide to Integrated Urban Flood Risk Management for the 21st Century; The World Bank: Washington, DC, USA, 2012. [Google Scholar]
  2. Brown, C.; Milke, M.; Seville, E. Disaster waste management: A review article. Waste Manag. 2011, 31, 1085–1098. [Google Scholar] [CrossRef] [PubMed] [Green Version]
  3. Hayes, J.L.; Wilson, T.M.; Brown, C.; Deligne, N.I.; Leonard, G.S.; Cole, J. Assessing urban disaster waste management requirements after volcanic eruptions. Int. J. Disaster Risk Reduct. 2021, 52, 101935. [Google Scholar] [CrossRef]
  4. Cheng, C.; Zhu, R.; Costa, A.M.; Thompson, R.G.; Huang, X. Multi-period two-echelon location routing problem for disaster waste clean-up. Transp. A Transp. Sci. 2021, 1–31. [Google Scholar] [CrossRef]
  5. Crowley, J. A measurement of the effectiveness and efficiency of pre-disaster debris management plans. Waste Manag. 2017, 62, 262–273. [Google Scholar] [CrossRef]
  6. Takeda, T.; Mori, Y.; Kubota, N.; Arai, Y. A route planning for disaster waste disposal based on robot technology. In Proceedings of the 2014 IEEE Symposium on Robotic Intelligence in Informationally Structured Space (RiiSS), Orlando, FL, USA, 9–12 December 2014; pp. 1–6. [Google Scholar]
  7. Amal, L.; Chabchoub, H. SGA: Spatial GIS-based genetic algorithm for route optimization of municipal solid waste collection. Environ. Sci. Pollut. Res. 2018, 25, 27569–27582. [Google Scholar] [CrossRef] [PubMed]
  8. Cheng, C.; Zhu, R.; Costa, A.M.; Thompson, R.G. Optimisation of waste clean-up after large-scale disasters. Waste Manag. 2021, 119, 1–10. [Google Scholar] [CrossRef]
  9. Cheng, C.; Zhang, L.; Thompson, R.G. Reliability analysis of road networks in disaster waste management. Waste Manag. 2019, 84, 383–393. [Google Scholar] [CrossRef] [PubMed]
  10. Hu, Z.H.; Sheu, J.B.; Wei, C.; Hu, S.L. Post-storm debris removal considering traffic and psychological impacts. Transp. A Transp. Sci. 2019, 15, 1145–1174. [Google Scholar] [CrossRef]
  11. Pramudita, A.; Taniguchi, E. Model of debris collection operation after disasters and its application in urban area. Int. J. Urban Sci. 2014, 18, 218–243. [Google Scholar] [CrossRef]
  12. Hu, Z.H.; Sheu, J.B. Post-disaster debris reverse logistics management under psychological cost minimization. Transp. Res. Part B Methodol. 2013, 55, 118–141. [Google Scholar] [CrossRef]
  13. Gao, X.; Cao, C. Multi-commodity rebalancing and transportation planning considering traffic congestion and uncertainties in disaster response. Comput. Ind. Eng. 2020, 149, 106782. [Google Scholar] [CrossRef]
  14. Liu, Y.; Yuan, Y.; Shen, J.; Gao, W. Emergency response facility location in transportation networks: A literature review. J. Traffic Transp. Eng. 2021, 8, 153–169. [Google Scholar] [CrossRef]
  15. Sahin, H.; Kara, B.Y.; Karasan, O.E. Debris removal during disaster response: A case for Turkey. Socio-Econ. Plan. Sci. 2016, 53, 49–59. [Google Scholar] [CrossRef] [Green Version]
  16. Parizi, S.M.; Taleai, M.; Sharifi, A. Integrated methods to determine urban physical resilience characteristics and their interactions. Nat. Hazards 2021, 109, 725–754. [Google Scholar] [CrossRef]
  17. Berktaş, N.; Kara, B.Y.; Karaşan, O.E. Solution methodologies for debris removal in disaster response. EURO J. Comput. Optim. 2016, 4, 403–445. [Google Scholar] [CrossRef] [Green Version]
  18. Federal Emergency Management Agency. Design Guide for Improving Critical Facility Safety from Flooding and High Winds: Providing Protection to People and Buildings; FEMA: Washington, DC, USA, 2007.
  19. Alizadeh, H.; Sharifi, A. Assessing resilience of urban critical infrastructure networks: A case study of Ahvaz, Iran. Sustainability 2020, 12, 3691. [Google Scholar] [CrossRef]
  20. Nan, C.; Sansavini, G. A quantitative method for assessing resilience of interdependent infrastructures. Reliab. Eng. Syst. 2017, 157, 35–53. [Google Scholar] [CrossRef]
  21. Cimellaro, G.P.; Renschler, C.; Reinhorn, A.M.; Arendt, L. PEOPLES: A framework for evaluating resilience. J. Struct. Eng. 2016, 142, 04016063. [Google Scholar] [CrossRef]
  22. Yin, J.; Yu, D.; Liao, B. A city-scale assessment of emergency response accessibility to vulnerable populations and facilities under normal and pluvial flood conditions for Shanghai, China. Environ. Plan B Urban Anal. City Sci. 2021, 48, 2239–2253. [Google Scholar] [CrossRef]
  23. Hino, K.; Tanaka, Y.; Schneider, R.H. Characteristics of fear of crime in evacuation shelters after the Great East Japan Earthquake. Environ. Hazards 2018, 17, 456–469. [Google Scholar] [CrossRef]
  24. Bolin, R.; Stanford, L. Shelter, housing and recovery: A comparison of U.S. disasters. Disasters 1991, 15, 24–34. [Google Scholar] [CrossRef]
  25. Rahill, G.J.; Ganapati, N.E.; Clérismé, J.C.; Mukherji, A. Shelter recovery in urban Haiti after the earthquake: The dual role of social capital. Disasters 2014, 38, S73–S93. [Google Scholar] [CrossRef] [PubMed]
  26. Brodie, M.; Weltzien, E.; Altman, D.; Blendon, R.J.; Benson, J.M. Experiences of Hurricane Katrina evacuees in Houston shelters: Implications for future planning. Am. J. Public Health 2006, 96, 1402–1408. [Google Scholar] [CrossRef] [PubMed]
  27. Farmer, A.K.; Zelewicz, L.; Wachtendorf, T.; DeYoung, S.E. Scared of the shelter from the storm: Fear of crime and hurricane shelter decision making. Sociol. Inq. 2018, 88, 193–215. [Google Scholar] [CrossRef]
  28. Matsuo, K.; Natainia, L.; Yamada, F. Flood and evacuation simulations for urban flooding. In Proceedings of the 5th International Conference on Flood Management, Tokyo, Japan, 27–29 September 2011; pp. 391–398. [Google Scholar]
  29. Kang, S.-H. Study on refuge behavior and its critical inundation depth in low area. KSCE 2003, 23, 561–565. [Google Scholar]
  30. DEFRA and the Environment Agency. R&D Outputs: Flood Risks to People. Phase 2. FD2321/TR1 The Flood Risks to People Methodology; Department for Environment Food and Rural Affairs and the Environment Agency: London, UK, 2006.
  31. Ishigaki, T. Evacuation criteria during urban flooding in underground space. In Proceedings of the 11st ICUD, Scotland, UK, 31 August–5 September 2008. [Google Scholar]
  32. Ishigaki, T.; Baba, Y.; Toda, K.; Inoue, K. Experimental study on evacuation from underground space in urban flood. In Proceedings of the Korea Water Resources Association Conference, Iksan, Korea, 20–21 May 2005. [Google Scholar]
  33. Lee, H.K.; Hong, W.H.; Lee, Y.H. Experimental study on the influence of water depth on the evacuation speed of elderly people in flood conditions. Int. J. Disaster Risk Reduct 2019, 39, 101198. [Google Scholar] [CrossRef]
  34. Bernardini, G.; Quagliarini, E.; D’Orazio, M.; Brocchini, M. Towards the simulation of flood evacuation in urban scenarios: Experiments to estimate human motion speed in floodwaters. Saf. Sci. 2020, 123, 104563. [Google Scholar] [CrossRef]
  35. Dias, C.; Abd Rahman, N.; Zaiter, A. Evacuation under flooded conditions: Experimental investigation of the influence of water depth on walking behaviors. Int. J. Disaster Risk Reduct. 2021, 58, 102192. [Google Scholar] [CrossRef]
  36. Lee, Y.H.; Keum, H.J.; Han, K.Y.; Hong, W.H. A hierarchical flood shelter location model for walking evacuation planning. Environ. Hazards 2021, 20, 432–455. [Google Scholar] [CrossRef]
  37. Pregnolato, M.; Ford, A.; Wilkinson, S.M.; Dawson, R.J. The impact of flooding on road transport: A depth-disruption function. Transp. Res. Part D Transp. Environ. 2017, 55, 67–81. [Google Scholar] [CrossRef]
  38. Smith, G.P.; Modra, B.D.; Tucker, T.A.; Cox, R.J. Vehicle Stability Testing for Flood Flows; UNSW Water Research Laboratory: Sydney, Australia, 2017. [Google Scholar]
  39. Kramer, M.; Terheiden, K.; Wieprecht, S. Safety criteria for the trafficability of inundated roads in urban floodings. Int. J. Disaster Risk Reduct. 2016, 17, 77–84. [Google Scholar] [CrossRef] [Green Version]
  40. Falcocchio, J.C.; Levinson, H.S. Road Traffic Congestion: A Concise Guide; Springer: Berlin/Heidelberg, Germany, 2015; Volume 7. [Google Scholar]
  41. Kasmalkar, I.; Suckale, J. Traffic accidents and delays present contrasting pictures of traffic resilience to coastal flooding in the San Francisco, Bay Area, USA. Urban Clim. 2021, 37, 100851. [Google Scholar] [CrossRef]
  42. Kasmalkar, I.G.; Serafin, K.A.; Miao, Y.; Bick, I.A.; Ortolano, L.; Ouyang, D.; Suckale, J. When floods hit the road: Resilience to flood-related traffic disruption in the San Francisco Bay Area and beyond. Sci. Adv. 2020, 6, eaba2423. [Google Scholar] [CrossRef] [PubMed]
  43. Esri. Barriers. Available online: https://desktop.arcgis.com/en/arcmap/latest/extensions/network-analyst/barriers.htm (accessed on 21 January 2022).
  44. Lee, Y.H.; Kim, Y.C.; Lee, H.K. Framework for selection of temporary disaster waste management sites for post-flood recovery in Seoul, South Korea. Int. J. Disaster Risk Reduct. 2022, 71, 102832. [Google Scholar] [CrossRef]
  45. Cutter, S.; Ismail-Zadeh, A.; Alcántara-Ayala, I.; Altan, O.; Baker, D.N.; Briceño, S.; Gupt, H.; Holloway, A.; Johnston, D.; McBean, G.A.; et al. Global risks: Pool knowledge to stem losses from disasters. Nature 2015, 522, 277–279. [Google Scholar] [CrossRef]
  46. Francini, M.; Artese, S.; Gaudio, S.; Palermo, A.; Viapiana, M.F. To support urban emergency planning: A GIS instrument for the choice of optimal routes based on seismic hazards. Int. J. Disaster Risk Reduct. 2018, 31, 121–134. [Google Scholar] [CrossRef]
  47. Artese, S.; Achilli, V. A gis tool for the management of seismic emergencies in historical centers: How to choose the optimal routes for civil protection interventions. ISPRS Ann. Photogramm. Remote Sens. Spat. Inf. Sci. 2019, 42, 99–106. [Google Scholar] [CrossRef] [Green Version]
  48. Nguyen, D.T.; Shen, Z.J.; Truong, M.H.; Sugihara, K. Improvement of Evacuation Modeling by Considering Road Blockade in the Case of an Earthquake: A Case Study of Daitoku School District, Kanazawa City, Japan. Sustainability 2021, 13, 2637. [Google Scholar] [CrossRef]
  49. Kocatepe, A.; Ulak, M.B.; Kakareko, G.; Ozguven, E.E.; Jung, S.; Arghandeh, R. Measuring the accessibility of critical facilities in the presence of hurricane-related roadway closures and an approach for predicting future roadway disruptions. Nat. Hazards 2019, 95, 615–635. [Google Scholar] [CrossRef]
  50. Salimi, M.; Al-Ghamdi, S.G. Climate change impacts on critical urban infrastructure and urban resiliency strategies for the Middle East. Sustain. Cities Soc. 2020, 54, 101948. [Google Scholar] [CrossRef]
  51. Molaei, P.; Tang, L.; Hardie, M. Measuring walkability with street and physical activity: A case study in Iran. World 2021, 2, 4. [Google Scholar] [CrossRef]
  52. Hooper, E.; Chapman, L.; Quinn, A. Investigating the impact of precipitation on vehicle speeds on UK motorways. Meteorol. Appl. 2014, 21, 194–201. [Google Scholar] [CrossRef]
  53. Chung, Y. Assessment of non-recurrent congestion caused by precipitation using archived weather and traffic flow data. Transp. Policy 2012, 19, 167–173. [Google Scholar] [CrossRef]
  54. Smith, B.L.; Byrne, K.G.; Copperman, R.B.; Hennessy, S.M.; Goodall, N.J. An investigation into the impact of rainfall on freeway traffic flow. In Proceedings of the 83rd Annual meeting of the Transportation Research Board, Washington, DC, USA, 11–15 January 2004; Citeseer: Princeton, NJ, USA. [Google Scholar]
  55. Sabir, M.; van Ommeren, J.; Koetse, M.; Rietveld, P. Welfare Effects of Adverse Weather through Speed Changes on Car Commuting Trips; Vu University: Amsterdam, The Netherlands, 2008. [Google Scholar]
  56. Sharifi, A. Resilient urban forms: A review of literature on streets and street networks. Build. Environ. 2019, 147, 171–187. [Google Scholar] [CrossRef]
Figure 1. Analysis flow of this study.
Sustainability 14 02866 g001
Figure 2. Case study area: Seocho and Gangnam Districts, Seoul, South Korea.
Sustainability 14 02866 g002
Figure 3. Flood simulation results.
Sustainability 14 02866 g003
Figure 4. Distribution of critical facilities in the target area.
Sustainability 14 02866 g004
Figure 5. (a) Critical service provision routes in the response phase; (b) disaster waste transportation route analysis results in the response phase.
Sustainability 14 02866 g005aSustainability 14 02866 g005b
Figure 6. Comparison of the disaster waste transportation route analysis results in the response phase.
Sustainability 14 02866 g006
Figure 7. (a) Critical service provision routes in the recovery phase; (b) disaster waste transportation route analysis results in the recovery phase.
Sustainability 14 02866 g007aSustainability 14 02866 g007b
Figure 8. Comparison of the disaster waste transportation route analysis results in the recovery phase.
Sustainability 14 02866 g008
Table 1. Assumptions for the critical service provision routes and disaster waste transportation routes in each disaster phase.
Disaster CircumstanceMajor Routes for Providing Critical ServicesDisaster Waste Transportation Routes
Response phaseA situation where the flood water is quite deepMovement from critical facilities to flooded buildingsMovement between flooded buildings and the temporary disaster waste management site (TDWMS)
Recovery phaseA situation where the flood water has receded and the inundation depth is shallow or almost zeroMovement from critical facilities to evacuation facilitiesMovement between flooded buildings and the TDWMS
Table 2. Classification of the mobility of people and vehicles, depending on the inundation situation in each disaster phase.
PeopleVehicles
Response phaseEvacuation is assumed to be difficult, when the inundation depth is greater than or equal to 30 cm.Operating vehicles * is considered difficult for rescue/aid and police services, when the inundation depth is greater than or equal to 30 cm.
Operating vehicles * is considered difficult to remove and transport wastes, when the inundation depth is greater than or equal to 50 cm.
Recovery phaseThe flood water is assumed to have receded, no longer affecting walking.The flood water is assumed to have receded, no longer affecting the vehicle operation.
* It is assumed that small vehicles are used to provide rescue/aid and police services whereas large vehicles are used to remove and transport wastes.
Table 3. Comparison of the disaster waste transportation route analysis results in the response phase.
MinimumMaximumMeanLength of Overlap Sections with Critical Service Provision Routes
Shortest distance4354.43 m8984.94 m 7659.33 m256,626.49 m
Shortest distance of the routes with the minimum overlaps4354.43 m21,619.68 m 10,252.60 m134,758.91 m
Increasing/decreasing rate (%)0.00▲58.44▲25.29▼47.49
▲: Increasing, ▼: Decreasing.
Table 4. Comparison of the disaster waste transportation route analysis results in the response phase.
MinimumMaximumMeanLength of Overlap Sections with Critical Service Provision Routes
Shortest distance4354.43 m7449.11 m5976.14 m525,859.53 m
Shortest distance of the routes with the minimum overlaps4699.97 m12,089.68 m6625.14 m233,657.63 m
Increasing/decreasing rate (%)▲7.35▲38.38▲9.80▼55.57
▲: Increasing, ▼: Decreasing.
Publisher’s Note: MDPI stays neutral with regard to jurisdictional claims in published maps and institutional affiliations.

