1. Introduction
Internationally, road traffic crashes have become the major public health challenge of the 21st century. Every year more than 1.35 million people lose their lives due to road crashes, making it one of the leading causes of death worldwide [
1]. Road crashes have become the 8th leading cause of death worldwide for all age groups and the 1st leading cause of death among children and young adults aged 5–29. Globally, the burden of road crashes is disproportionately borne by vulnerable road users living in low- and middle-income countries (LMICs), where the growing number of deaths is aggravated by increasingly motorized transport [
2]. It was observed that between 2013 and 2016, there was no reduction in the number of crashes in LMICs [
1,
2,
3,
4].
With a population of close to 1.37 billion people, India now faces the worst ever road congestion in most cities and towns, and Indian roads have become more vulnerable to road crashes. As per the report published by the Ministry of Road Transport and Highways, 151,417 persons were killed and 469,418 injured in road traffic crashes in India in 2018 [
5]. The number of crash-related fatalities has increased by 6–8% per year since 2004 [
3,
6]. Every hour, there are 15 fatalities and 53 injuries associated with road crashes in India. The roads, which were constructed during the pre-liberalization era, are not able to support the ever-increasing traffic load. One other point of concern is the mixing of heavy vehicles with daily commuting vehicles on the road [
6]. There has been a construction boom in India due to rapid urbanization. Consequently, the plying of heavy vehicles is a common sight nowadays to support the logistic demand of the construction sector. In, India, the total number of vehicle fleets has increased exponentially, from 12.77 billion to 23 billion from 2009 to 2016, respectively [
5]. With the addition of six million new motor vehicles every year, it is expected that India will have the maximum number of vehicles on the road by 2050 [
7].
The government of India has proposed a National Urban Transport policy to improve transportation planning in Indian cities [
8]. It stresses the need to prioritize the movement of people and not vehicles in the cities. Furthermore, it proposes to create adequate road space for sustainable transport modes, such as walking, cycling and public transport. The guidance envisages creating safe, reliable and sustainable transport modes and argues for participatory decision making involving relevant stakeholders such as town planners, transport providers and commuters. As such, the national government has taken cognizance of the country’s road safety situation due to the increased number of crash fatalities in recent years. It acknowledges that road crashes have become a major public health threat of the 21st century. In view of this, the government of India has come up with a National Road Safety Policy, which aims to reduce mortality and morbidity resulting from road crashes. The key policy statements of the National Road Safety Policy are: (1) raise awareness about road safety issues; (2) establish a road safety information database in the future; (3) ensure safer road infrastructure; (4) safer vehicles; (5) safety of vulnerable road users; (6) road traffic safety education and training; (7) enforcement of safety laws [
9]. The expansion of the road network in India is not in pace with the exponential growth in motorization in the last two decades. The total number of vehicles in India was 295.8 million in 2019. With an estimated 37 million motorcycles, India is home to the largest number of motorized two-wheelers in the world [
5].
India’s transportation system follows a federal decision-making structure, and most of the country’s transport decisions are made by the national ministries and government departments, particularly the Ministry of Housing and Urban Affairs (MoHUA) and Ministry of Road Transport and Highways of India (MoRTH) [
5,
10,
11,
12]. The largest budgetary allocation and political power rest in the hands of the MoRTH, along with the Ministry of Urban Development, NITI Aayog and various state and local transport corporations and road development corporations. A significant part is played by the different implementation agencies, such as local, national and international contractors, consulting firms and donor agencies. In addition, technical and research institutions and advocacy organizations have a significant role in formulating future policies and building consensus among stakeholders for their implementation. Each of the actors or agencies is continuously influencing each other actions. The complexity in the number of agencies involved and difficulty in coordinating across them impedes the decision-making process and subsequent work on the ground. The proposed sustainable transport policy will also minimize the existing delayed decision-making process in the current bureaucratic system and ensure a better coherent approach. For instance, cities with a population of one million or above are expected to establish a “Unified Metropolitan Transport Authority” and an “Urban Transport Fund” to manage financial resources for all transportation projects. This will ensure that each agency coordinates and follows an identical vision [
8,
12].
Globally, the developing countries account for more than half of motorized two-wheelers (MTWs). For example, Dandona et al. [
13] stated that while the percentage of MTWs in developed countries such as the USA is around 2%, it stands at 95% in Vietnam. Furthermore, they contribute to about 28% of the total fatalities associated with road crashes [
1]. In India, motorized two-wheelers comprise 70% of the total vehicle population, and motorcycle users are considered the most vulnerable road users. Out of the total fatal road crashes, 68% of them consist of vulnerable road users, i.e., motorized two-wheelers in India [
7]. Empirically, this is also reflected in the studies conducted by Singh et al. [
3] and Mohan et al. [
6], who found that the MTWs are more vulnerable to road crashes as evidenced by their vulnerability to hazards of road conditions and weather. It can be well-argued that a two-wheeler rider is more vulnerable to road crashes as their bodies are exposed directly to an obstacle or another vehicle [
4]. The issues related to road safety in India are very diverse. They range from individual, environmental, infrastructure, poor implementation of laws and the absence of a graduated driving licensing programmes [
10]. Essentially, the trends, patterns and causes of road crashes can be unique depending upon the environment, population distribution and law enforcement. It should be noted that India is the 7th largest country in the world with unique diversities in the environment, geographical features, population distribution, road condition, public awareness and law enforcement. These factors all make the trends, patterns and causes of road crashes in India unique in their own way [
10,
11].
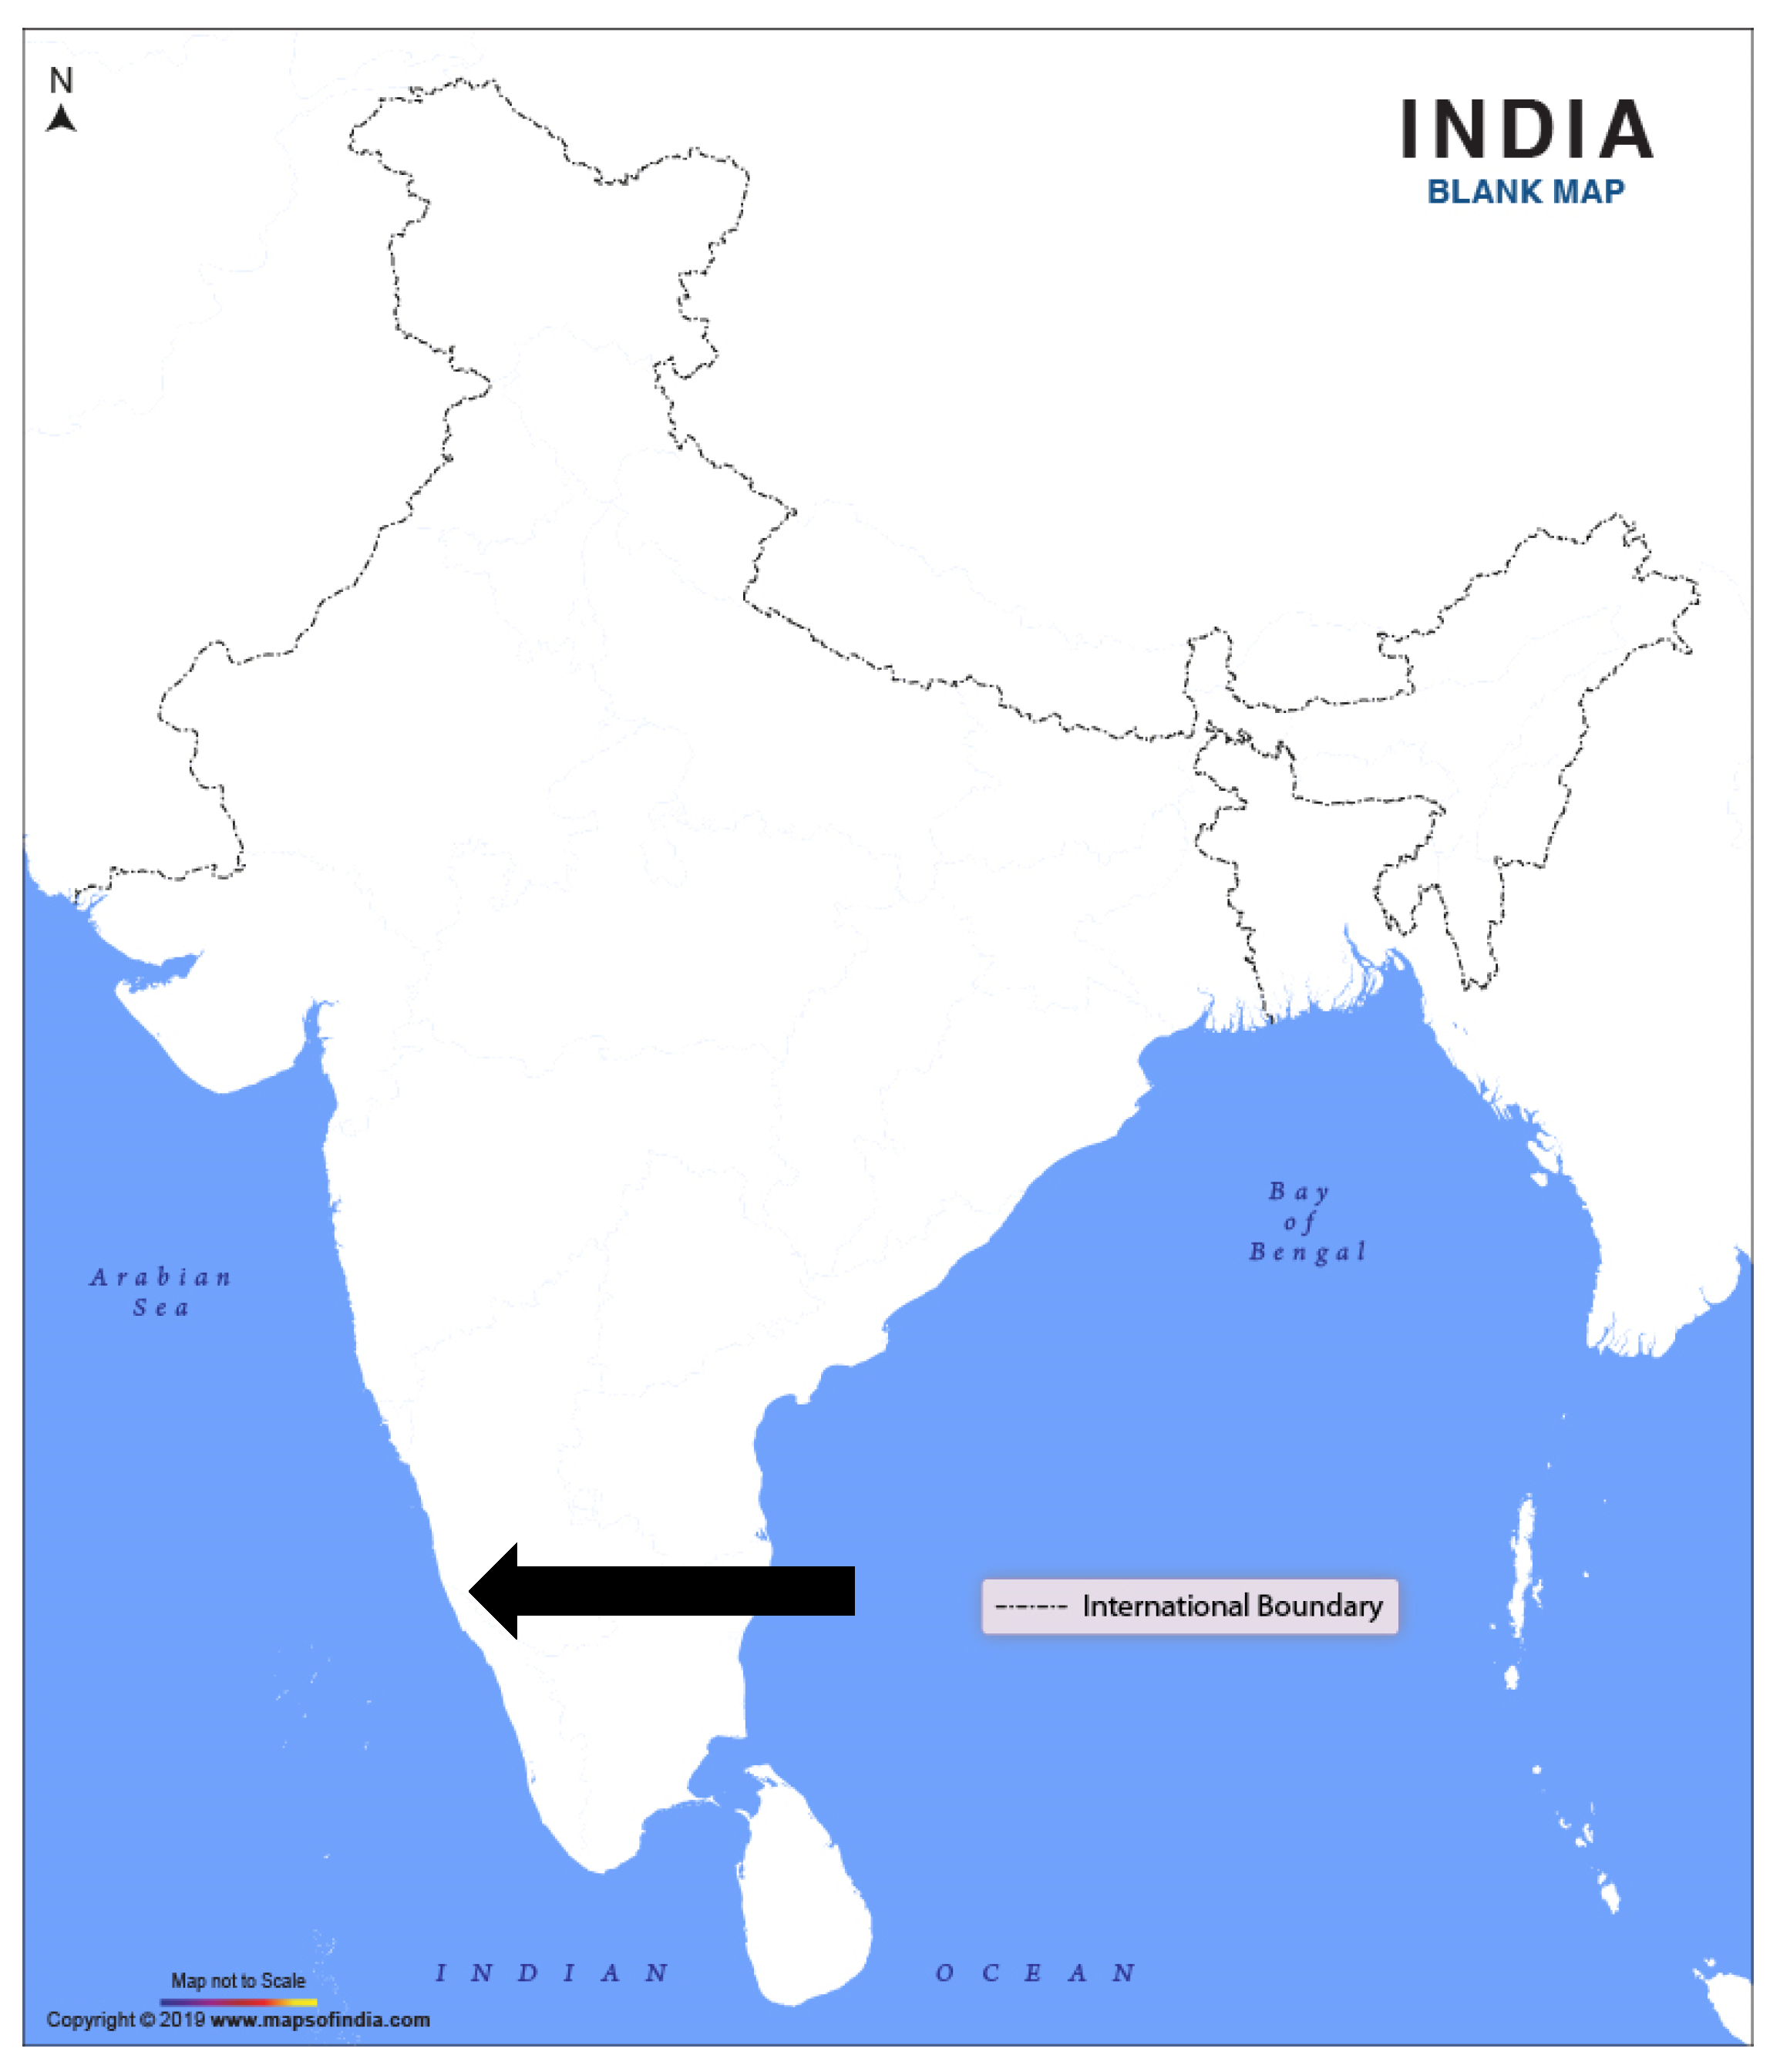
The study is based in Manipal, which is situated on the southwest coast of India bordering the Arabian Sea in the state of Karnataka. This coastal town receives a prolonged annual average rainfall of 2893 mm spread from May to October. Manipal is home to the Manipal Academy of Higher Education (MAHE) and it hosts approximately 30,000 young students from all across India and 60 countries all over the world. The study setting is different in its own way due to varied demographical characteristics and climatic conditions. The student population in Manipal is a floating population as they mostly stay for a duration of 4–6 years. Due to this demographical characteristic, they intend to drive as they do in their native settings, which may be substantially different from the current setting. Furthermore, the study setting is a popular tourist destination that attracts tourists from all over India, making the roads congested and prone to road crashes [
14]. It is noteworthy to mention that from the last decade, more university towns have been coming up in other parts of India where this study can be replicated on the same analysis variables, including time series for subsequent evidence generation and planning interventions.
Furthermore, the study highlights the existing deficiencies in the crash recording system as many places in India do not have computerized road crash recording units and, therefore, the crash storage and retrieval systems are quite poor. In the majority of the states, it is recorded manually on some register, and only one person is responsible for keeping the records. Moreover, the uniformity in recording crash data is not maintained. Few states in India publish their annual crash statistics in a comprehensive way, which is essential from a road safety point of view for the in-depth understanding of characteristics of crashes such as information about crash-prone locations and exact circumstances in which crashes happen. As mentioned, the government of India has planned to establish a “National Road Safety Information System” to improve the quality of crash reporting and subsequent investigation [
5]. Furthermore, the awareness about the utility of the existing crash statistics is deficient, and there is a lack of trained, skilled personnel for this work. As the data is not computerized, hardly any meaningful crash analysis is performed to find vulnerable road users, the age and socio-economic background of drivers and other road users involved in crashes and causes of crashes, which are factors that are of paramount importance for providing leads in taking preventive measures. To sum up, in India, road crash data is hardly used for taking appropriate traffic enforcement measures [
15]. In view of the above-mentioned contexts, the applicability of the current study is twofold: (1) utilization of existing crash data to generate informed evidence to reduce fatal road crashes in university towns of India and (2) emphasizing the importance of improving the existing crash recording system in India, so that much more detailed analysis and informed evidence can be generated in the future.
Several previous studies in the urbanized township of India have reported the vulnerability of young drivers for road crashes [
3,
8,
13]. Reasons for this increased vulnerability in young drivers are likely to resemble those related to young car drivers. In a study conducted by Robbins et al. [
16], it was reported that young people are more prone to crashes due to two factors, i.e., experience and age. Firstly, crash risk is higher for young drivers due to lack of experience, for instance, in comprehending, assessing and responding to hazards [
11,
17]. Secondly, age related, risky driving amongst young drivers has been theoretically explained by neurocognitive evidence that suggests an imbalance between the development of the social-affective brain and the cognitive control system during the transition period from child to adult [
18]. The brain’s socio-emotional reward system shows early adolescent remodelling while the cognitive control system (e.g., inhibitory control, working memory, mental flexibility and planning) matures more gradually, well into people’s 20s. This maturational gap between both brain systems makes it difficult for youngsters to self-regulate impulsive responses, which is even more profound in males than in females. A possible explanation for this sex difference is that male road users, compared with female road users, prioritize the benefits of risk-taking over the costs associated with it [
16,
18].
The proposed study is an attempt to highlight the importance of understanding the characteristics of fatal road crashes in the university towns of India with a substantial young student population. Furthermore, it will provide valuable leads for initiating specific intervention programmes with a multi-sectoral approach targeting the causes of crashes and sensitizing the local authorities for priority-based actions. The findings of the current proposed study will generate evidence for the local policymakers to reduce crash risk in Manipal. The objectives of the study are (1) to explore the characteristics of fatal road crashes in Manipal from 2008–2018 and (2) to forecast the number of fatal road crashes for the upcoming years using time series analysis. The remaining part of this paper is structured as follows:
Section 2 elaborates on the literature review;
Section 3 provides an overview on the methodology;
Section 4 presents the results of the current study. Furthermore, in
Section 5, the study findings are discussed in detail in
Section 5, followed by limitations and future research, recommendations and conclusions in
Section 6,
Section 7 and
Section 8.
2. Literature Review
With respect to age and gender distribution for fatal crashes, in the Indian setting, young adults in the age group of 18–45 years account for nearly 69.3% of total crash victims [
5]. Furthermore, most of the studies have reported that it is basically the youth population in India who are vulnerable to crashes [
4,
10]. Young drivers are more prone to road crashes primarily due to two inter-correlated factors, i.e., age and experience [
11]. Crash risk is higher among young road users due to perceived difficulty in comprehending, assessing and responding to hazards [
16,
19,
20]. Furthermore, crash risk among the young drivers has been theoretically explained by neurocognitive evidence that suggests an imbalance between the development of the social-affective brain and the cognitive control system during the transition period from child to adult [
18]. Moving to gender distribution, previous studies have highlighted the vulnerability of males for fatal road crashes as compared with females [
3,
4]. Men contributed to 85.6% of total fatal crashes in India in 2019 [
5]. It is argued that male drivers prioritize the benefits of risk-taking over the cost associated with it as compared with their female counterparts [
16].
With respect to the causes of fatal crashes, over-speeding happens to be the leading cause of road crashes, contributing to 71.1% of total crash [
5]. Previous studies have identified speeding as the main cause for fatal road crashes in India, too [
4,
6,
10,
21]. Speeding can be either excessive (driving beyond the lawful limit) or inappropriate (driving within limits but too fast for the traffic condition), and it poses a significant risk for fatal crashes [
22]. Speeding is influenced by several psychological factors such as beliefs and perceptions associated with speeding; intentions for speeding include impression management, risk-taking and sensation-seeking [
23]. The contributions of other causes of road crashes, such as driving under the influence of alcohol, were found to be less compared with speeding [
24,
25]. Furthermore, “hit and run” accounted for the largest share, 19.4% of total persons killed in 2019 [
5]. Previous studies have reported similar findings [
10,
24].
Finally, the literature review for crash prediction highlights the importance of the time series analysis prediction technique. This technique is used for forecasting future events based on past data. The utility of time series analysis for crash forecasting has been explained by several previous studies [
26]. Furthermore, time series analysis has demonstrated its effectiveness in the right prediction for crashes [
27,
28]. The results of the few studies conducted in India forecast an increase in the number of road crashes. For instance, Sunny et al. [
29] in Kerala predicted an increase in the number of crashes for the upcoming years. Other studies also [
28] forecasted and reported that there will be an overall increase in the number of road crashes in their respective study setting. For instance, Rakesh and Suman [
28] pointed out the upsurge in mixing heavy vehicles with daily commuting vehicles on the road due to rapid urbanization, subsequently making the roads vulnerable to crashes in their study setting.
5. Discussion
The current study was based in the university town of Manipal, which is unique in its own way, due to ostensibly varied demographical characteristics and climatic conditions. The study setting has a high concentration of floating young students. Because of this demographical characteristic, they intend to drive as they do in their native settings, which may differ from the current setting. The proposed study is novel in its own way due to unique demographical and driving conditions. The study aimed to explore the characteristics of fatal road crashes in Manipal from 2008–2018. Furthermore, it also aimed to forecast the number of fatal road crashes for the upcoming years using time series analysis. The results show that most of the fatal crashes are due to exceeding the lawful speed limit, followed by driving under the influence of alcohol (
Figure 5). Moreover, drivers in the age range of 18–25 years contribute 54% of total fatal crashes. With respect to vehicle involvement, motorcycles contribute 45% of total fatal crashes, followed by scooters (
Figure 6). The highest proportion of fatal crashes have occurred on national highways (55.60%), followed by state highways (25.34%) and other roads (19.06%). Finally, the highest proportion of crashes was observed on weekends (
Figure 7). With the time series analysis, the number of fatal crashes was forecasted until the year 2025, and it was found that there will be an increase in the number of fatal road crashes by 4.5% (
Table 1). This research contributes to the existing literature regarding the possible use of crash data in understanding the characteristics of fatal road crashes in a study setting with some unique demographical and driving conditions.
There is a paucity of information on the real extent of the problem about trends, patterns, distributions and outcomes of crash fatalities in India. As the data is not computerized, hardly any meaningful crash analysis is conducted to find out factors that are associated with higher crash risks [
4,
15]. However, to be able to design informed road safety programmes, understanding the underlying causes of crashes is essential. In order to improve road safety, the availability of crash data and an understanding of the circumstances that lead to crashes are of vital importance. For instance, detailed crash data and its subsequent analysis can provide evidence for the authorities to detect black spot treatments and in designing appropriate improvement measures [
32]. It is noteworthy to mention the European Union policy for road safety management emphasizes road safety inspections (RSI) based on crash analysis as an effective technique in reducing crash risk [
33]. The government of India has taken cognizance of the situation due to the increased number of crash fatalities in recent years. It acknowledges that road crashes have become a major public health threat of the 21st century. In view of this, the government of India has proposed establishing a “Road Safety Information Database” in the future to improve the quality of crash investigation and data collection, transmission and analysis.
The crash data analysis indicates an upswing in the number of fatal crashes in Manipal in the last few years. The findings related to the increase in fatal crashes are consistent with the study results conducted in several studies across India [
3,
21]. It was reported by Singh et al. [
3] that road crash fatalities have increased by 5% from 2003 to 2013. Furthermore, in a study conducted by Sivasankaran et al. [
21] in Tamil Nadu, the number of road crashes has doubled in the last five years. With respect to the current data analysis, the majority of fatal crashes is due to speeding beyond the lawful limit, followed by driving under the influence of alcohol and going ahead and overtaking (
Figure 5), which confirms the report published by the Ministry of Road Transport and Highways, government of India [
5] and several previous studies [
11,
21].
The present study reported that out of the total crashes, the majority of the fatal crashes were reported in the age group of 18–25 years, followed by the 26–40 year-old age group and drivers who are above 40 years old, respectively. This finding indicates that ultimately it is the young drivers in the age range of 18–25 years who are the major victims of fatal crashes. This aligns with the findings of several previous studies in the Indian context [
10,
25]. Furthermore, it also aligns with the findings of some studies conducted in Southeast Asia [
34,
35]. For instance, Pervez et al. [
35] in Pakistan and Bhalla et al. [
34] in Sri Lanka reported the vulnerability of young drivers in the age range of 18–25 years for fatal crashes. Furthermore, in detail, the results indicate that with increasing age, crash severity decreases, which is in line, for example, with Singh et al. [
3], Rhodes et al. [
36], Nguyen et al. [
37] and Damani and Vedagiri [
38]. At first glance, it can be argued that with increasing age, crash severity increases due to increased frailty and visible decrease in certain driving abilities and performance. Furthermore, it is evident that from the last two decades, crash fatalities among motorcyclists aged 40–60 years have increased in several regions across the world (United States, Canada, Europe and Australia). Puac-Polanco et al. [
39] referred to this phenomenon as the “baby-boomer cohort effect”. It is noteworthy to mention frailty prevalence is associated with age groups of 65 years old and older, with further increase in prevalence in the 65–75 age group and 85+ group [
40,
41]. Opposite that, in the current study, more than three fourths of the population involved in fatal crashes are in the age range of 18–40 years, with just 14% of the recorded cases being for drivers aged more than 40 years. This somewhat explains why increasing age in the current study is not associated with increased crash severity. Undoubtedly, the question which arises here is why with increasing age crash severity decreases. Is it that with increasing age the adherence to use protective equipment such as helmet increases, or do they drive responsibly due to family liabilities? This all warrants further exploration.
For the type of vehicle, the present study’s analysis shows that motorcyclists contribute to the maximum amount of fatal crashes, followed by scooters (
Figure 6). This is in confirmation with earlier studies that report on the high contribution of motorcyclists to fatal road crashes [
38,
39]. For instance, Bhalla et al. [
42] reported 44% motorcyclists’ involvement in their study in northern India. This result might also be transferred to other countries of Southeast Asia with traffic and road safety situations similar to India. In a study conducted by Pervez et al. [
35] in Pakistan, it was reported that 74% of the total registered vehicles were motorcycles and that motorcyclists’ involvement is maximum for fatal crashes. Similar results were reported by Nguyen et al. [
37] in Hanoi, Vietnam, where the share of motorcyclists for crashes was 44%.
As for the causes of crash, speeding the vehicle beyond the lawful limit is the most common cause of fatal crash, which is similar to the findings of several previous studies [
3,
4,
21,
24]. This is also reflected in the report published by the Ministry of Road Transport and Highways, where it is stated that over-speeding is the leading cause of fatal road crashes, accounting for 71.1% of total crash [
5]. The tendency for speeding can be discussed by citing the work of Sharma et al. [
43] in Bangalore, where “liking for chasing and competing”, “sense of power and control” and “relief from anger” were identified as the main correlates. Looking at it from a psychological perspective, speeding behaviour is strongly predicted by social norms and negative attitudes towards respecting speed limits [
44]. It is noteworthy to mention speeding behaviour may not always be intentional. Unintentional speeding may occur due to, for example, lack of awareness of the current speed limit/travelling speed and not paying regular attention to the speedometer on the vehicle [
45]. For the next major cause of fatal crash, i.e., driving under the influence of alcohol, the analysis revealed that it contributes to almost one-fifth of the total fatal crashes. This is in alignment with the MoRTH annual report (2019) [
5] and with some previous studies [
24]. Here, it should be noted that in addition to driving under the influence of alcohol, the role of other factors such as vehicle and environment should also be given importance in future investigations.
For the distribution of fatal crashes according to the days of the week, the study analysis reported that fatal crashes are more prevalent on weekends (
Figure 7). Crashes are more common on Saturday evenings, probably due to driving under the influence of alcohol after the weekend parties and getting together. Furthermore, the study setting is one of India’s most prominent student towns and hosts close to 30,000 young students in the age range of 18–25 years. This corroborates the findings from the WHO Global status report on alcohol and health, which reported increased instances of crashes under the influence of alcohol among young drivers due to weekend get-togethers [
1]. Additionally, it is also in alignment with the MoRTH annual report (2019) [
5] and with some previous studies [
11,
24].
As for gender, males accounted for more than four times the number of fatal crashes compared with their female counterparts. This confirms the results reported in previous studies carried out in India, such as those by Pal et al. [
11]. However, valid justifications between gender and fatal crash are inconclusive as increased crash severity has also been reported among females [
46,
47]. For the distribution of fatal crashes according to the types of roads, the study reported that the highest proportion of fatal crashes have occurred on national highways, followed by state highways and other roads. This is in alignment with the MoRTH annual report (2019) [
5] and also with some other previous studies [
48].
With respect to crash location, maximum fatal crashes have occurred near the educational institute, followed by a recreation centre’s vicinity (
Figure 8). This aligns with the fact mentioned in
Section 1 that the study setting is a university town with a predominantly student population. Around one-fifth of total fatal crashes occur near the recreation centre’s vicinity. One possible explanation is that watching movies is immensely popular among the youth, including students in this part of India, and they regularly visit movie theatres for recreation [
49]. As for the distribution of fatal crashes with respect to the local weather conditions, most fatal crashes were found to occur during heavy rains followed by light rain. It is noteworthy to mention the study setting is one of the wettest places in India, receiving a prolonged annual average rainfall of 2893 mm spread from May to October. The brief monsoon season damages the roads, reduces visibility and makes the road riskier for users [
50].
For the distribution of fatal crashes per vehicular defects, defective brakes, worn-out tyres and defective lighting systems contribute to around 60% of the total share of fatal crashes. This is in accordance with the work of Singh et al. [
3] and Ponnaluri et al. [
51]. For instance, Ponnaluri et al. [
51] pointed out that vehicular defects account for 20% to 40% of total crashes. One possible explanation for that in the current study setting, which is a university town, is that the students receive limited pocket money from their parents/guardians. It is noteworthy to mention vehicle maintenance may be less prioritized for students in a university town due to limited pocket money. To the best of our knowledge, there is no empirical evidence to substantiate this claim. This warrants further exploration.
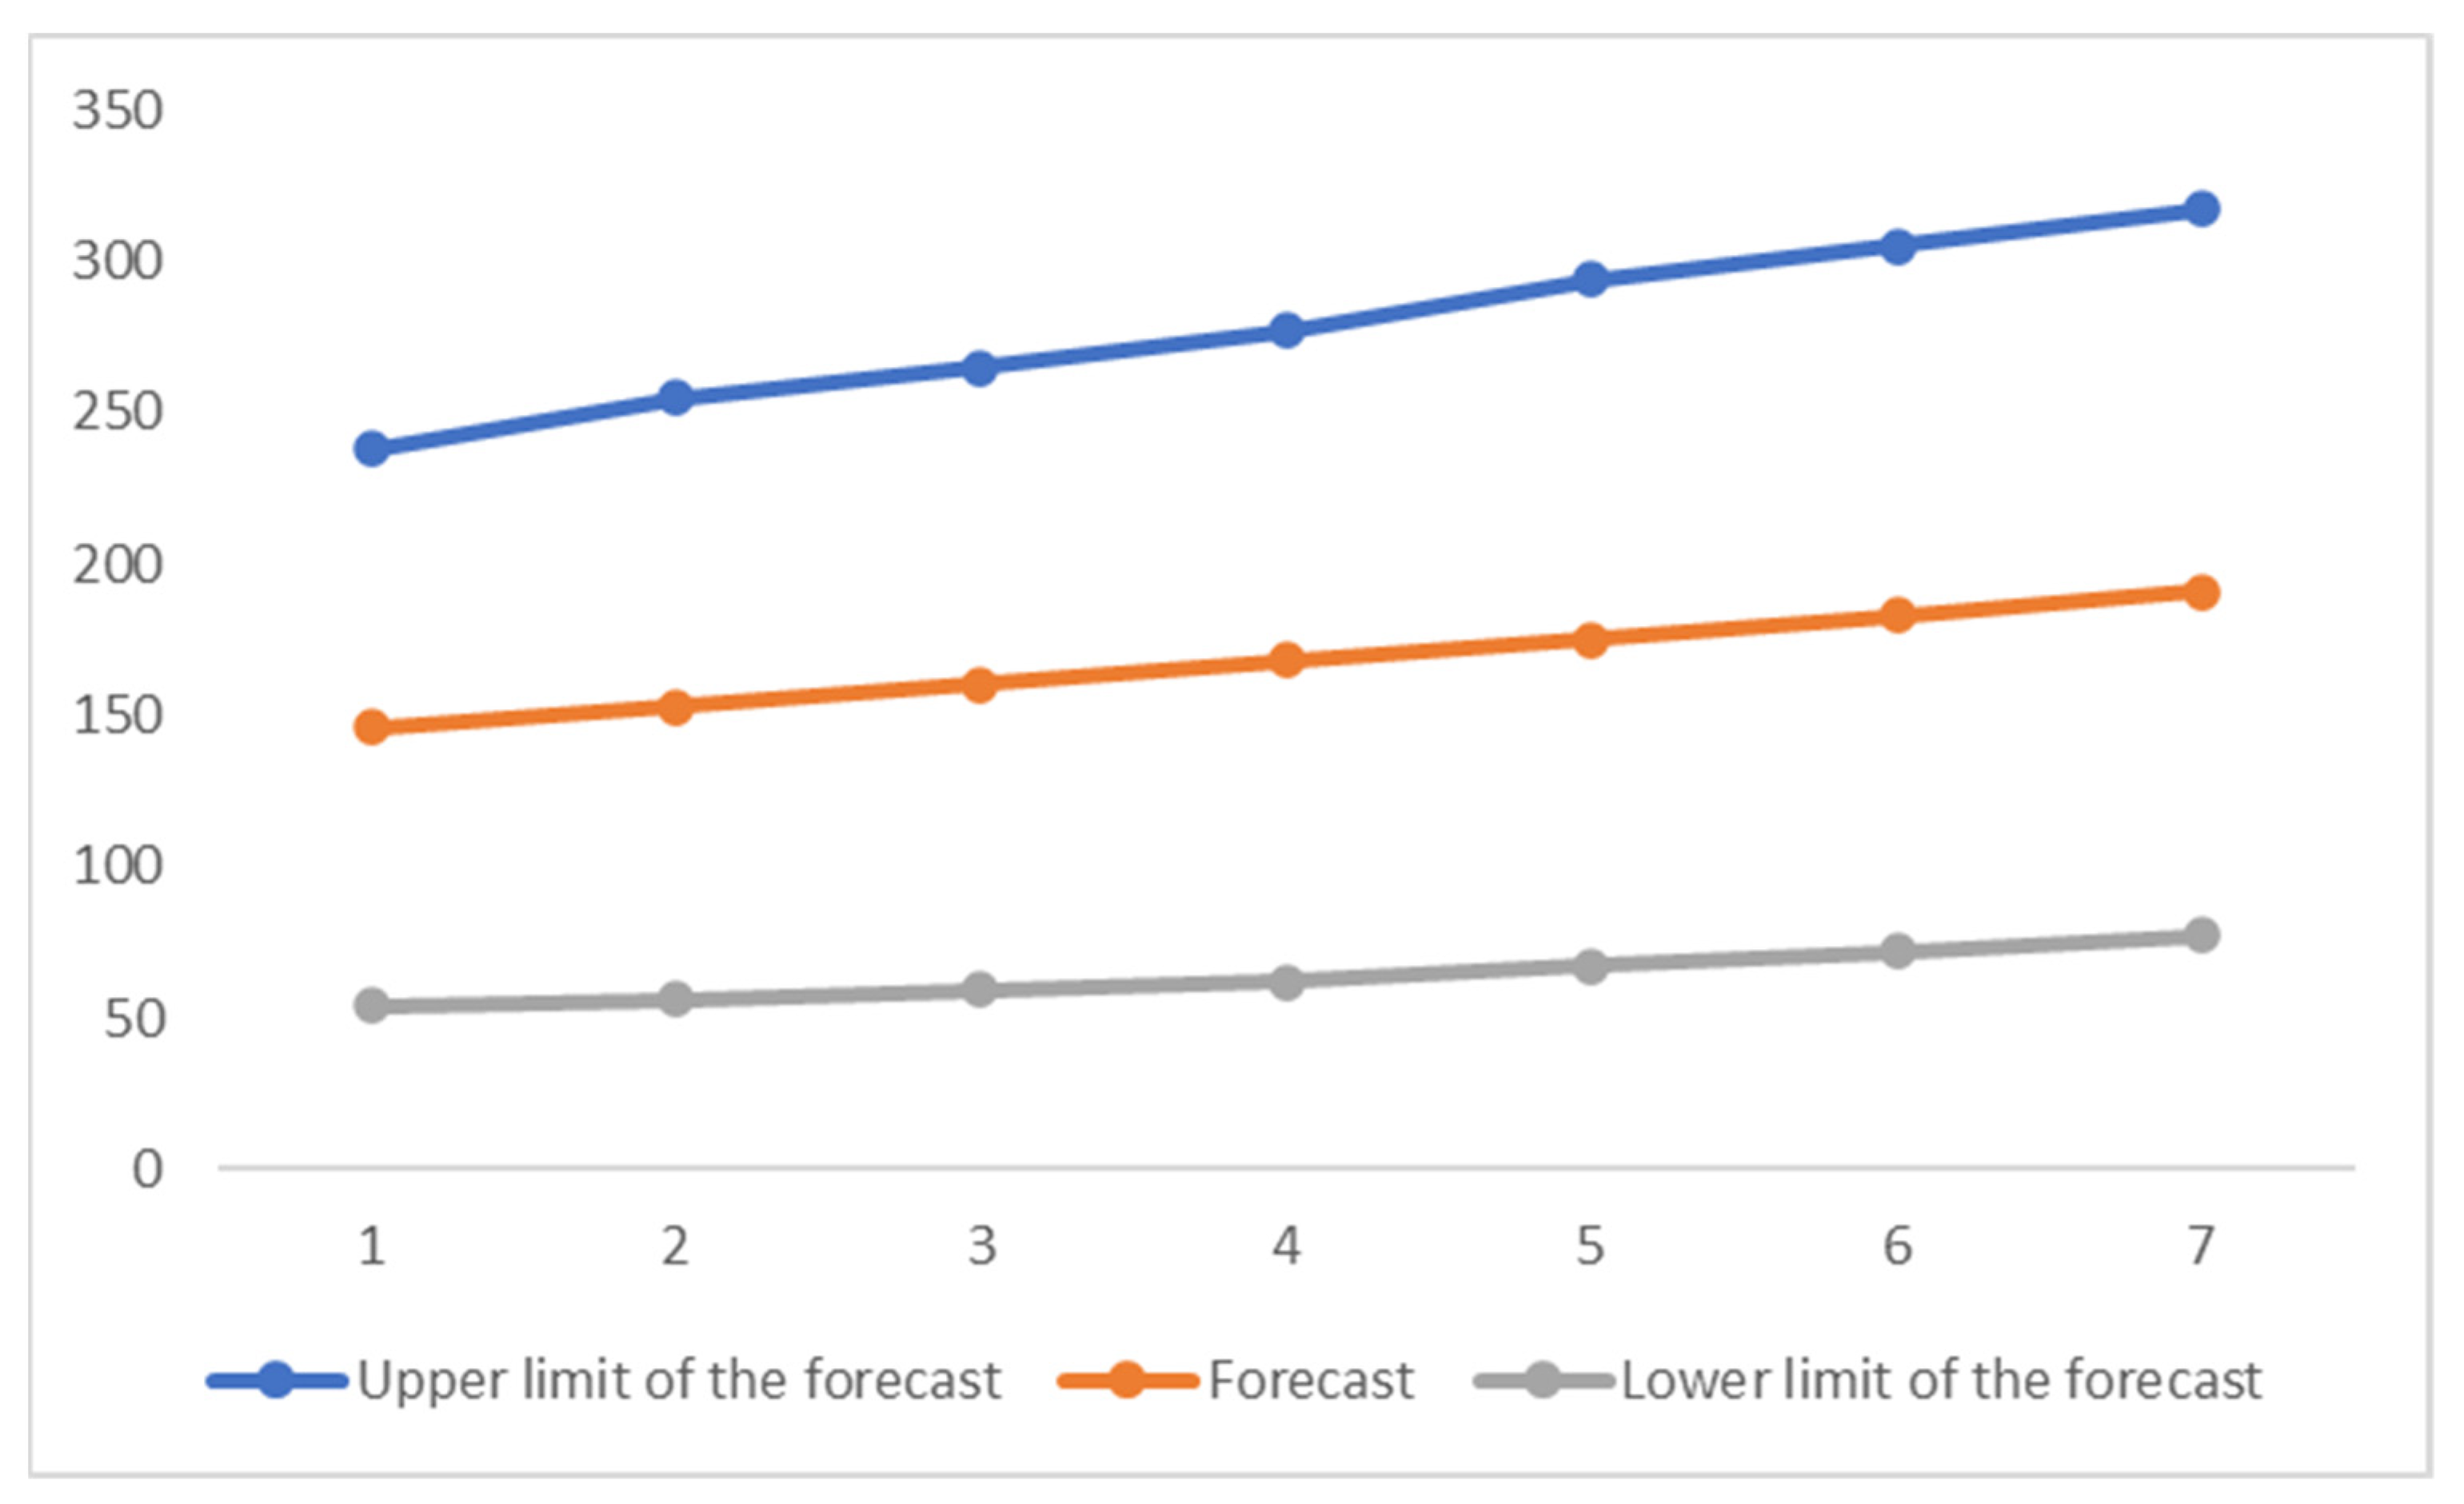
Finally, crash prediction was performed for the upcoming years using time series analysis forecasting by the Holt–Winters method (
Table 1). The results from the analysis predict that there will be an overall increase in the number of fatal crashes for the upcoming years by 4.5%. In a similar study conducted by Sunny et al. [
29] in Kerala, using Holt–Winters exponential smoothing, an increased number of crashes was predicted for the upcoming years in that region. Furthermore, other studies also [
28] have forecasted and reported that there will be an overall increase in the number of road crashes in their respective study settings. It is noteworthy to mention, even this increase, i.e., 4.5% in the number of fatal road crashes, can have a substantial impact, as around 75% of the city population comprises young adults. It is well known that the loss of an individual at an early age due to road crashes can cause immense socio-economic loss to the country [
4,
5,
42]. Several reasons at the local level can be attributed to the increase in road crashes. The city has witnessed an exponential rise in the youth population and the number of vehicles on the road that can be attributed to an increase in the number of crashes (personal communication, 5 May 2020). One other possible explanation for the potential surge in the number of crashes is that there is very minimal or no improvement in the road safety infrastructure, with the primary focus of the authorities remaining on controlling infectious disease [
11]. Finally, there is the future scope of comparing the actual data (if accessible in the future) with the predicted data to further validate the model as previously reported by Jha et al. [
52].
7. Recommendations
Local policymakers can use the findings from this study to reduce crash risk in Manipal, India. There has been a sharp increase in the number of road crashes in the last decade, and police authorities should prioritize traffic management and enforcement apart from their law-and-order responsibility. The local authorities should also think about improving the safety systems. It is noteworthy to mention here the concept of “safe system approach”. The safe system is based on well-established safety principles of the known tolerance of the human body to crash forces, speed thresholds for managing crash impact energies to survivable levels and the capacities of vehicles and forgiving infrastructure to reduce crash impact energy transfers to humans. Furthermore, the safe system approach—a core feature of the WHO Decade of Action for Road Safety —recognizes that road transport is a complex system and places safety at its core. It also recognizes that humans, vehicles and the road infrastructure must interact in a way that ensures a high level of safety [
53]. In continuation of the above-mentioned approach, it can be recommended that road infrastructure can be improved by structural designs that convert a part of kinetic energy into deformation energy, minimizing excessive deceleration while guiding and reorienting vehicle movements to avoid excessive impact forces. This kind of road design is required on roads prone to crashes [
37,
54]. Furthermore, adequate lighting systems are required to improvise visibility, particularly during the daytime [
55].
Interestingly, as per the government of India guidelines, all new motorcycles and scooters that roll into the market need to feature “Automatic Headlamp ON” (AHO) from 1 April 2017 onwards. AHO is required to improve visibility during day and at dawn and dusk [
55]. For owners of vehicles that came out before 1 April 2017, policymakers can organize programmes to raise the awareness level about the utility of AHO among the local population and strategies to incorporate it in older vehicles. Furthermore, this recommendation fits in quite well in the study setting, as it experiences prolonged monsoon seasons with significantly reduced visibility. However, in a middle-income country such as India, users are reluctant to exchange their old running vehicles or pay to incorporate AHO. There is undoubtedly a cost component involved with it. Furthermore, a mix of new vehicle technologies/or telematics with existing infrastructure are a more economical solution to reduce road crashes [
56]. In this regard, there is substantial evidence suggesting that advanced rider assistance systems (ARAS) such as anti-lock braking systems (ABS), assist and slipper clutches (A&S clutch), adaptive cruise controls (ACC), airbags and collision warning systems can reduce crash risk with acceptance and adherence from the drivers [
9,
57]. It is noteworthy to mention that the current study reported defective braking systems as one major vehicular defect responsible for crashes. However, as mentioned in the case of AHO and the underlying cost component involved, it will be arduous for all these technologies to percolate in the Indian automobile industry.
Enforcements of strict measures to follow speed limits can reduce the number of crashes due to speeding [
3,
4]. Since crashes are more common on Saturday evenings [
24], random checkpoints to check for drunk driving and reckless driving can be installed [
11]. The current findings thus provide valuable leads for initiating specific intervention programmes targeting the causes of crashes and sensitizing the local authorities to priority-based actions.
It is essential for a country such as India with a significant burden of fatal crashes to incorporate a transport policy in the future. The current study’s findings highlight the importance of implementing the proposed National Road Safety Policy by the government of India. Adoption of such a system will raise awareness about road safety issues and ensure safer road infrastructure and road traffic education and training, which is currently lacking in India [
5,
8]. Awareness about the utility of the existing crash statistics is deficient, and there is a lack of trained, skilled personnel for this work. The government of India has planned to establish a “National Road Safety Information System” to improve the quality of crash investigation and of data collection, transmission and analysis [
5]. However, due to the ongoing COVID-19 pandemic, the entire focus of the government has shifted towards it, and it will not be easy for LMICs such as India in the immediate future to invest in the National Road Safety Information System.
Awareness programmes targeting risky behaviours such as reckless driving, speeding and driving under the influence of alcohol should be initiated at the local level. Furthermore, policymakers are advised to pay sufficient attention to underlying determinants that guide those driving behaviours. For instance, age and gender are significant determinants for speeding and reckless driving [
3,
4]. The policymakers can initiate targeted intervention programmes considering these determinants for a specific risky driving behaviour. The current study findings have highlighted the vulnerability of motorcyclists for road crashes. Previous studies have highlighted the importance and effectiveness of self-protective measures such as helmets and protective clothing [
58] in reducing crash-related fatalities. In addition, the policymakers should implement strict regulations for drivers driving underage or without a proper valid license, because unless the licensing procedure in India is regulated and closely monitored, the quality of the driver will be questionable [
59]. Graduated driving license programmes for better driving skills that already exist in the European Union and Australia [
60] are the need of the hour in a country such as India as well. Finally, the local authorities are advised to improve monitoring at crash-prone locations of the study setting, such as near educational institutes and near recreation centre’s vicinity.


 ,
, 


