Article

Towards the Development of Smart and Sustainable Transportation System for Foodservice Industry: Modelling Factors Influencing Customer’s Intention to Adopt Drone Food Delivery (DFD) Services

by
Noor Islam Jasim
1,*,
Hairoladenan Kasim
2 and
Moamin A. Mahmoud
3
1
College of Graduate Studies, Universiti Tenaga Nasional, Jalan Ikram-Uniten, Kajang 43000, Malaysia
2
College of Computing and Informatics, Universiti Tenaga Nasional, Jalan Ikram-Uniten, Kajang 43000, Malaysia
3
Institute of Informatics and Computing in Energy, Universiti Tenaga Nasional, Jalan Ikram-Uniten, Kajang 43000, Malaysia
*
Author to whom correspondence should be addressed.
Sustainability 2022, 14(5), 2852; https://doi.org/10.3390/su14052852
Submission received: 1 October 2021 / Revised: 2 November 2021 / Accepted: 3 November 2021 / Published: 1 March 2022

Abstract

:
While the attempts to deploy drones in the foodservice industry focus on the technical aspects, research studies from behavioral perspectives that support service substantially are still in their infancy. When new technology-based services are introduced, it is crucial to examine and understand consumers’ perceptions by identifying a set of actions that influence acceptance and fulfilling their target. Therefore, service providers of drone food delivery (DFD) services need to identify significant factors that influence potential consumers to use drone delivery. Although a few existing models are significant, these models lack a comprehensive basic theory that addresses factors which influence consumers’ intention and behavior. To overcome this limitation and propose a more comprehensive model, relevant research studies from the domain of drone delivery services and other emerging technology such as IoT, Autonomous Vehicles, and Mobile Banking are identified, reviewed, and analyzed, and ten potential factors are subsequently extracted. This study’s data were collected from 209 participants who regularly order food online for delivery and were analyzed using SPSS. Descriptive statistics, reliability, Pearson correlation, regression analysis, r-squared, and standardized beta coefficient analyses are carried out to present the study’s findings. The results show that there is a significant relationship between behavioral intention and the user behavior of DFD. Although the participants in this study are yet to experience drone technology in the foodservice domain, the identified factors explain around 32.9% of the variation in the use behavior of DFD services. In the early stage of adoption, it is highly recommended for stakeholders to conduct marketing campaigns through media channels such as television and different social media platforms to bring awareness of this technology.

1. Introduction

Emerging technologies offer opportunities for new players to transform and reform industries to come up with a new product that triggers a significant surge in demand which is known as “disruption technology” or “innovation shocks” [1]. Nevertheless, forecasting the growth of emerging technologies is a challenge for new players and stockholders [2]. Regardless, players must deal with it to explore new opportunities. Recently, drone technology has received a great deal of attention due to its high mobility, low cost, and flexible deployment. It is anticipated that drones will be part of our daily life, just as smartphones have [3,4]. According to [4], the emerging drone technology market value in 2020 is $30.0 billion and is expected to reach $54.6 billion by 2025 with an annual growth rate of 12.7%. The technology promises to boost up innovation and disrupt current technologies [3].
The business implementation model has been dramatically changed due to the wide acceptance of new technologies. This includes the industry of hospitality and tourism. One prominent example of this, the technology of self-service using digital kiosks that is widely accepted by various domains such as self-check-in and check-out in hotel, airport, and, recently, restaurants, to enhance service quality by automating the process [5,6]. Recently, drone technology has received significant attention, and it is expected that drones will be part of our daily life, just like smartphones [3,7]. The drone can autonomously fly or be remotely controlled based on embedded software and integrated hardware such as computers, sensors, cameras, and GPS [8].
Drones are categorized according to the type such as single-rotor, multi-rotor, and Fixed-Wing [9], autonomy degrees such as partial automation, conditional automation, and full automation, the size and weight, and the power source such as fuel cell, batteries, and solar cell [10,11]. Previously, drones were expensive and exclusively utilized in the military domain; however, this created a basis to use a drone in the public market. Nowadays, many industries have begun using this technology for public use, and it becomes increasingly inexpensive and available for purchase by public consumers [12]. According to some statistics released in 2015, the use of drones in the military was 72%, followed by the commercial sector with 23%, and 5% in the civil sector [13,14]. However, based on the findings of Balaban et al. [15], it is expected that the use of the drone will grow the most in the civil sector. Although the use of drones in public is a new experience to human society, the possible applications of the drone can be seen in various domains such as Military, Entertainment, Services, Environmental, Security, and others. Besides, drones attached with different payloads have several potential applications such as rescue operations by carrying water, food, and medicine for rescue, and delivery services such as food and retail delivery [16].
The emergence of the drone delivery idea can be traced back to December 2013 when Amazon disclosed their initiative of experimenting with the deployment of drones as an alternative to traditional delivery methods [17]. Since then, big corporations such as Mercedes-Benz, United Parcel Service, and DHL have launched similar initiatives by adopting drones for delivery purposes [18]. The use of drones in delivery has received increasing attention from the industry, and research communities in recent years have redirected their attention to the broad features of speed, flexibility, security, and cost [19,20]. Moreover, it is environmentally friendly in comparison to the traditional means such as motorbikes, cars, and trucks [20]. In general, drone delivery is mainly used in three healthcare domains to deliver medicines and vaccines or retrieve medical samples from remote or otherwise inaccessible regions [21], and the food delivery service, utilizing smartphone apps and postal to deliver documents utilizing fingerprint and eye-recognition systems [22]. Among alternatives, drones are expected to have a significant contribution to food delivery services as they save time, cost, the environment, and peoples’ lives by reducing traffic congestion, wages, carbon emission, and accidents respectively.
Delivery attempts by drones have been made in many countries. For example, in Australia, a mission of rescue was carried out by a drone that dropped floating equipment and saved two boys [23]. In Korea, a drone has succeeded in delivering mail weighing 8 kg to a small island about 4 km away from land in 10 min compared to ships that take about two hours [24]. In the foodservice industry, drone delivery has received great attention due to the high growth of this domain. According to GrabFood Malaysia, Food delivery has never been as popular as it is now [25], and this trend will keep rising. Moreover, according to a report by Google and Temasek, by 2025, online food delivery in the South-East Asian region is projected to reach over US $8 billion (RM24bil) in market size. This is because more than 90% of the people in the region are connected to the internet, primarily through smartphones. Consequently, drone technology is expected to be the disruption of technology in this domain. Several attempts have been successfully made in ensuring drone food delivery (DFD) services in countries such as New Zealand. Domino’s Pizza has successfully delivered Pizza using a drone to a customer about 32 km away within 5 min [16]. In Dubai, Costa Coffee, located on Jumeirah Beach Road, had difficulty serving certain kinds of beverages such as ice coffee on the sandy beach, but after using the drone, serving became much more convenient [26]. In Korea, a delivery company called Yogiyo made a successful first test flight in delivering food using an auto-piloting drone [27]. In Malaysia, a drone company has successfully tested the use of drones in the foodservice industry. The service first started in 2019 in Cyberjaya, the most technologically advanced town in Malaysia [28]. In America, Uber was awarded the right to test commercial food delivery via drone. In Singapore, a drone developed by the F-drones company delivered 2 kg of vitamins to a customer in a ship within seven minutes over 2.7 km. According to the report, the use of drones will save up to 80% of the cost compared to the current practice using small boats and helicopters [29]. Drones are predicted to have a substantial impact on food delivery services, as Asia Economy reported [30]. Every year, 1500 people are injured, and around 30 are killed and 50% of those injured/killed are young, under the age of 29 [30]. Therefore, drones are important and promising in the foodservice industry [16]. However, current studies lack a comprehensive research model investigating factors influencing consumers’ intention to accept drone delivery in the foodservice industry, although the commercialization of such services is foreseeable. Therefore, it will be imperative to identify consumers’ influential factors in DFD services adoption.
Several models in the literature have addressed the drone delivery services in general [14,31,32,33]; however, in the context of food delivery, studies are very limited [5], despite the importance of this domain, as highlighted earlier. The models developed by [31] and [5] are highly relevant to this study. Yoo et al. [31] investigated factors affecting the public’s attitude and intention to adopt drone delivery in the U.S using the Theory and Technology Acceptance (TAM) model and Diffusion of Innovation Theory (DOI). In contrast, Hwang & Choe [5] investigated motivated consumer innovativeness in drone food delivery services by extending TAM (perceived ease of use, perceived usefulness) with Motivated Consumer Innovativeness (MCI) theory by adding hedonic and social motivations. Both studies extended TAM because it was found that TAM has been utilized by almost all drone delivery services studies. However, although TAM has been validated in different fields, many previous studies have attempted to extend TAM to ensure better outcomes, e.g., [34,35,36]. Based on theories such as MCI [37,38] and the DOI [39], a comprehensive guiding model is therefore needed to investigate the adoption of an emerging technology among individuals. To this end, the Unified Theory of Acceptance and Use of Technology (UTAUT) proposed by [40] is adopted. UTAUT integrates other models and theories such as TAM, TRA, TPB, DOI, and TAM2 to constitute a comprehensive model. However, according to [41], most previous theories and models (e.g., TAM and UTAUT) were proposed for an organizational context. Due to differences between the customers and the organizational perspectives, there is an urgent need for new theoretical framework development that reflects the consumer’s side [41,42]. Due to this limitation, the extended Unified Theory of Acceptance and Use of Technology (UTAUT2), a newer version of UTAUT, was proposed to account for the consumer’s intention and behavior regarding adopting new technology. Through the review of literature in diverse fields, the UTAUT2 model has proven its validity and usability in explaining factors that affect consumers’ intention towards adopting new technology [42,43].
This study proposes an adoption model associated with the utilization of drone technology in the foodservice industry. The model will empirically be tested to identify significant factors that affect the acceptance of drones by customers of online food delivery. Subsequently, decision-makers can exploit the findings of this study to enhance the customers’ acceptance. Besides, this study indirectly supports the realization of Industry 4.0 by utilizing drones to automate the food delivery process instead of manual delivery. Finally, to ensure social and physical contact amid COVID-19, drone food delivery, besides being reportedly profitable, could be used as a potential alternative solution to reduce unnecessary contact between people.

2. Literature Review

In this section, we review and discuss the theoretical foundations that support the development of the conceptual model. Several theories have been used by the literature to study user intention and behavior to adopt new technology such as TAM, MCI, DOI, UTAUT, and the more recent version of UTAUT called UTAUT 2. Among these, TAM and UTAUT2 are selected as guiding theories to understand and measure how consumers adopt new technologies. Although several models have been proposed to predict and explain consumers’ behavior to adopt new technologies such as drone delivery services, the TAM is, as of yet, the most deployed theory in examining technology acceptance [31,44,45,46,47]. In TAM theory, there are two significant factors: perceived ease of use and perceived usefulness, which determine the attitude, which in turn motivate and affect behavioral intentions positively and finally leads to the actual usage by consumers. The first factor of attitude is perceived usefulness, which refers to what extent this new system or technology will help people to perform their jobs efficiently. It is worth noting that perceived usefulness is related to practical and efficient aspects. The second variable is perceived ease of use, which means using the new technology by individuals would be easy to learn and free of effort [48].
However, many studies have reported that TAM theory is insufficient to explain the variation in user’s acceptance. To overcome this problem, the UTAUT was proposed by Venkatesh et al. [40]. UTAUT integrates other models and theories findings such as TAM, TRA, TPB, DOI, and TAM2 to constitute a comprehensive model. Generally, the UTAUT model has four primary constructs that were proposed as direct determinants of customers’ intention towards new technology: performance expectancy (PE), effort expectancy (EE), social influence (SI), and facilitating conditions (FC). However, according to [41], most previous theories and models (e.g., TAM and UTAUT) were particularly proposed for organizational context. Due to a difference between the customers and the organizational perspectives on which, and how, factors are influencing an individual’s intention and behavior towards new technology, there is a strong need for developing a theoretical framework that reflects the consumer’s side [41,42]. Due to this limitation, the extended Unified Theory of Acceptance and Use of Technology (UTAUT2), a newer version of UTAUT, was proposed to explain the consumer’s intention and behavior regarding adopting new technology. Through reviewing many studies in diverse fields [42,43,44], the UTAUT2 model has proven its validity and usability for explaining the factors that affect consumers’ intention towards adopting new technology. According to Venkatesh et al. 2016, the extended version of the original UTAUT was developed by integrating three new factors: hedonic motivation, price value, and habit. The factor perceived usefulness in TAM is similar to the performance expectancy in UTAUT2 [16,31,41]. In addition, the factor ease of use in TAM is similar to the effort expectancy in UTAUT2 [16,31,41].
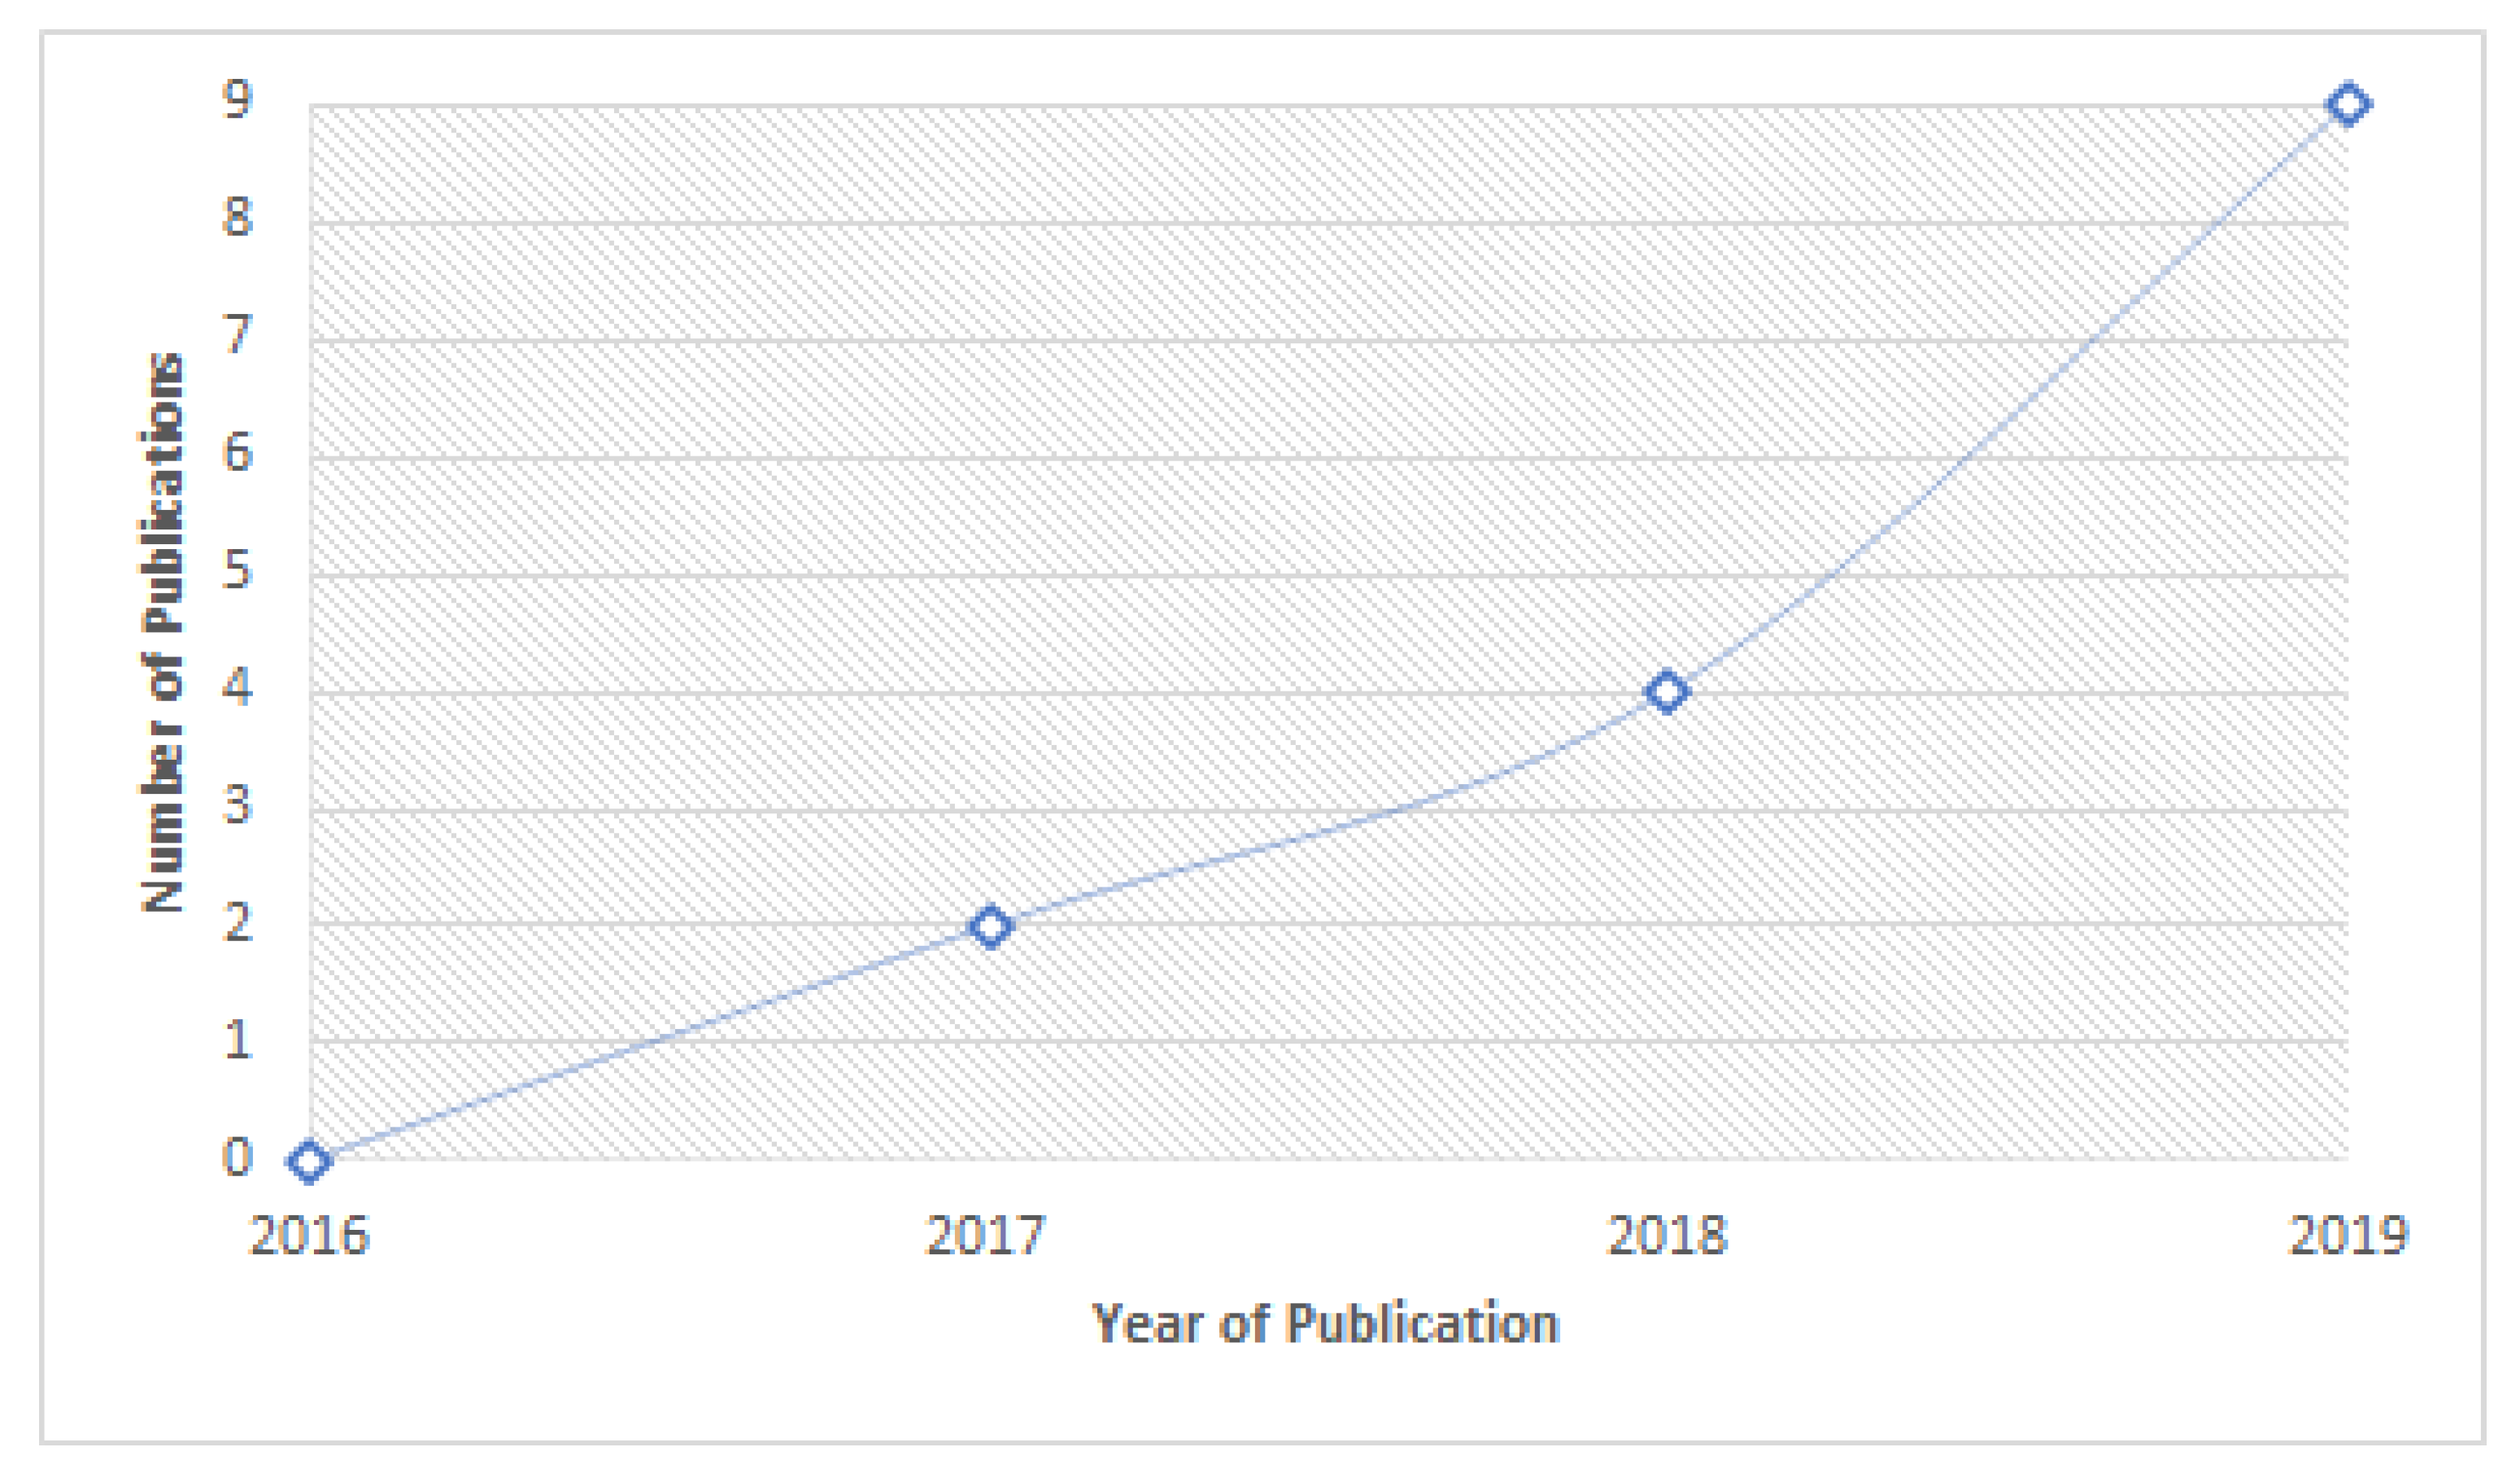
Table 1 shows a summary of the existing conceptual/developed models in drone delivery adoption. The table gives information about the author’s name, year of publication, country, independent variables of the study, dependent variable, methodology, and findings. The table includes the nine studies that we found from our search of the main databases, Google Scholar and Science Direct, using the search term ((Drone AND Delivery) OR Services); to our knowledge, these are the only studies available on the area of drone delivery service. Figure 1 shows the number of publications each year. The figure reveals increased interest in this emerging technology.

3. Conceptual Model Development

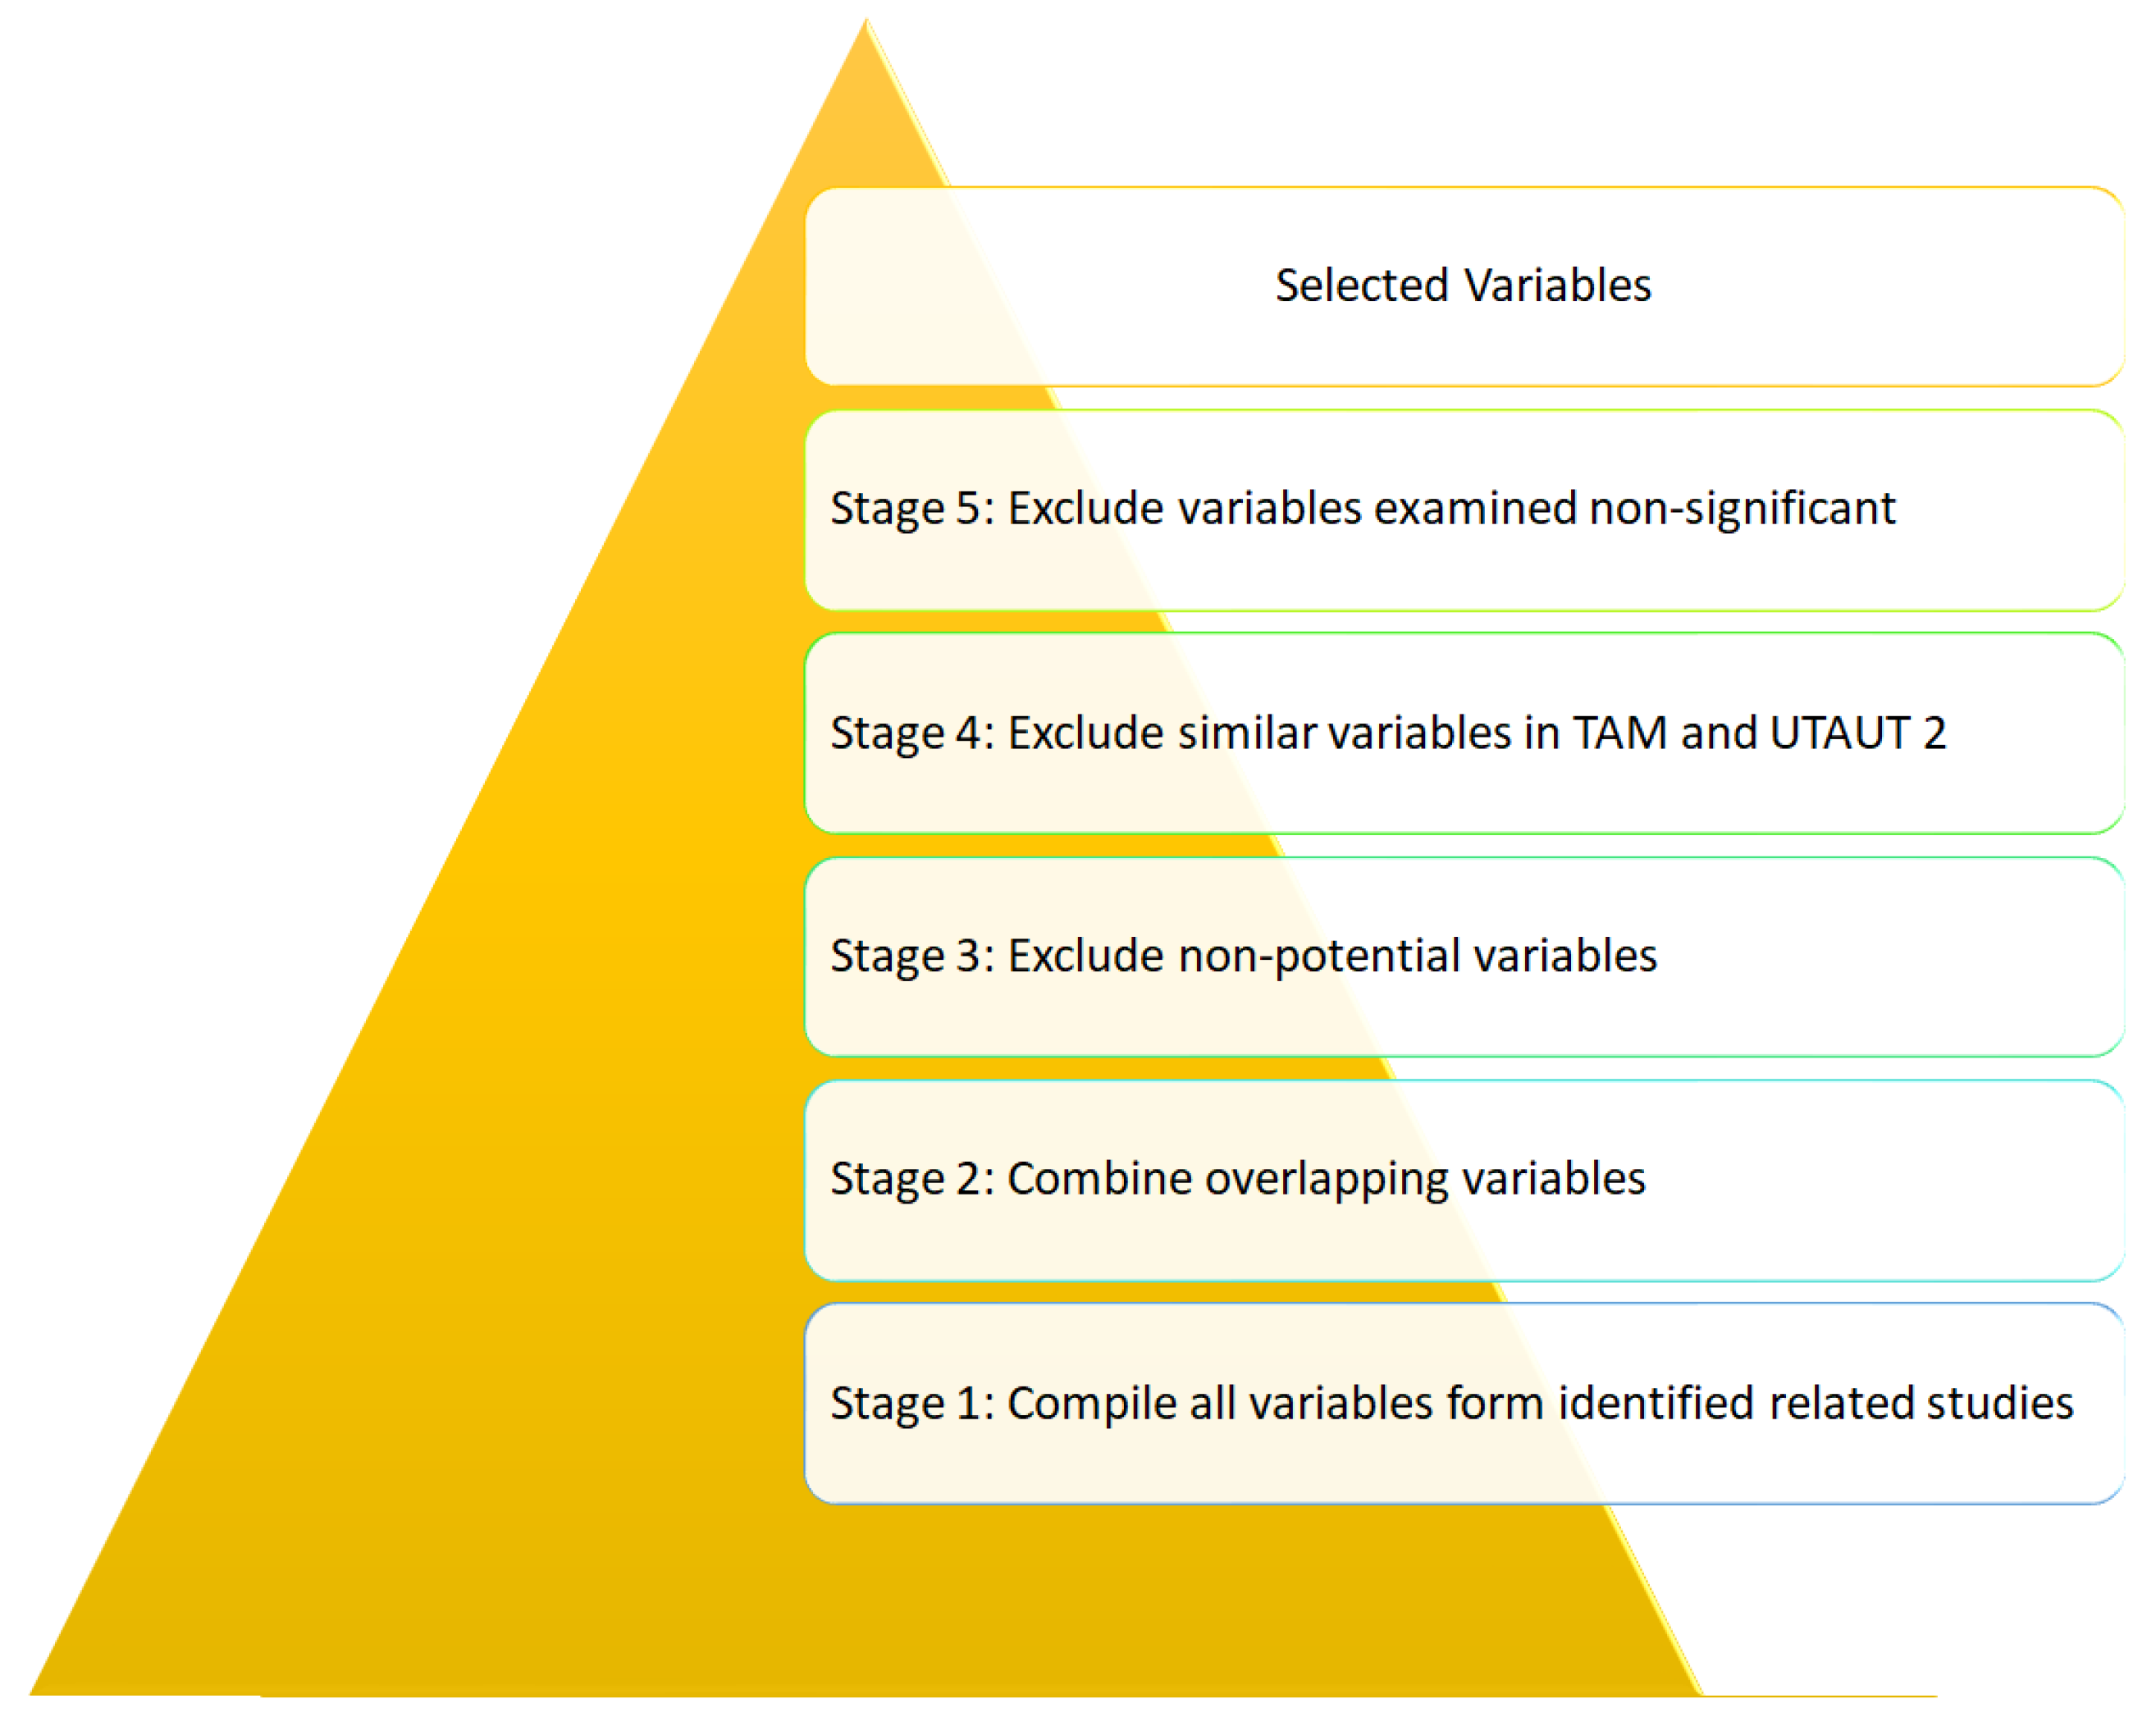
In this section, we discuss the selection procedure to identify the potential variables to be included in the conceptual model of this study. As shown in Figure 2, stage 1 compiles all variables from all identified studies, and stage 2 combines overlapping variables. Since only five studies have examined their variables, stage 3 excludes non-potential variables. In stage 4, we study the context of each variable and exclude those similar to variables in TAM or UTAUT2 (the basic theories of this study). Finally, stage 5 excludes those variables examined as non-significant by other studies.
When we applied this procedure to the selected studies, as shown in Figure 3, the initial number of variables was 38, which then shrank to 26, was subsequently reduced to 16, then 8, and finally reached 3. The following sub-sections explain in detail the process and outcome of each stage.
  • Stage 1—compile all variables: this stage compiles all variables discussed by the selected studies. As shown in Table 2, the total number of variables is 38, from nine studies.
  • Stage 2—combine overlapping variables: in this stage, variables that hold the same definition are combined in one variable. As shown in Table 3, there are 17 variables in the highlighted cells, after combination, which became five only (Performance risk, Privacy risk, Personal innovativeness, Safety Concerns, Environmental Concerns), which means 12 variables are excluded. The remaining variables count 26 after combing overlapped variables.
  • Stage 3—exclude non-potential variables: to ensure high reliability and accuracy, stage 3 excludes studies that have discussed variables but could not verify their significance value due to several reasons stated in Table 4.
  • Stage 4—exclude similar variables in TAM and UTAUT 2: after excluding the non-potential variables, this stage excludes variables with similar constructs in TAM or UTAUT 2, as shown in Table 5.
  • Stage 5—exclude variables determined to be non-significant: in this stage, a variable that is examined and found not significant by the majority of the related studies was excluded in this study. For example, a variable µ is tested by four literature studies and three of them found it not to be significant, we follow the majority and exclude it from this study.
Table 6 presents a summary of the factors and their frequencies that have been extracted from the selected studies.
Finally, to ensure the inclusion of potential factors and gain a deeper understanding of consumers’ attitudes and usage intention towards new technology, we conduct a quick review of existing adoption models in similar emerging technologies such as an autonomous vehicle, mobile banking, and the internet of things. From the review of several models [42,51,52,53,54,55,56], we found one potential variable that is worth being included in this study due to its relevancy to the drone domain and that it was found critical and significant by reviewed studies; the factor is Trust. Trust is considered one of the most important factors that have been examined and added to TAM, UTAUT2, and other well-established models [42,53,54].
This study adopts variables from four resources, TAM, UTAUT 2, existing models on DFD, and other studies in similar emerging technologies. As shown in Table 7, Ease of Use (EU) and Perceived Usefulness (PU) are adopted from TAM and Social Influence (SI), Facilitating Condition (FCON), Hedonic Motivation (HM), and Price Value (PV) are taken from UTAUT2. However, drone food delivery is still in the stage of technology introduction, and consumers have yet to evaluate its benefits and price [57]. Thus, in the context of drone delivery, the construct was modified to Price Sensitivity (PS). Another three variables, Privacy Risk (PRR), Personal Innovativeness (PI), and Performance Risk (PER), have been adopted from the existing studies on DFD [14,31,33], respectively. The remaining variable, Trust (T), has been adopted from the work of Gefen et al. [55].
In Table 8, we conduct a comparison between the selected variables in this study and the benchmark studies used in this work. The table shows that this study has addressed new potential variables.
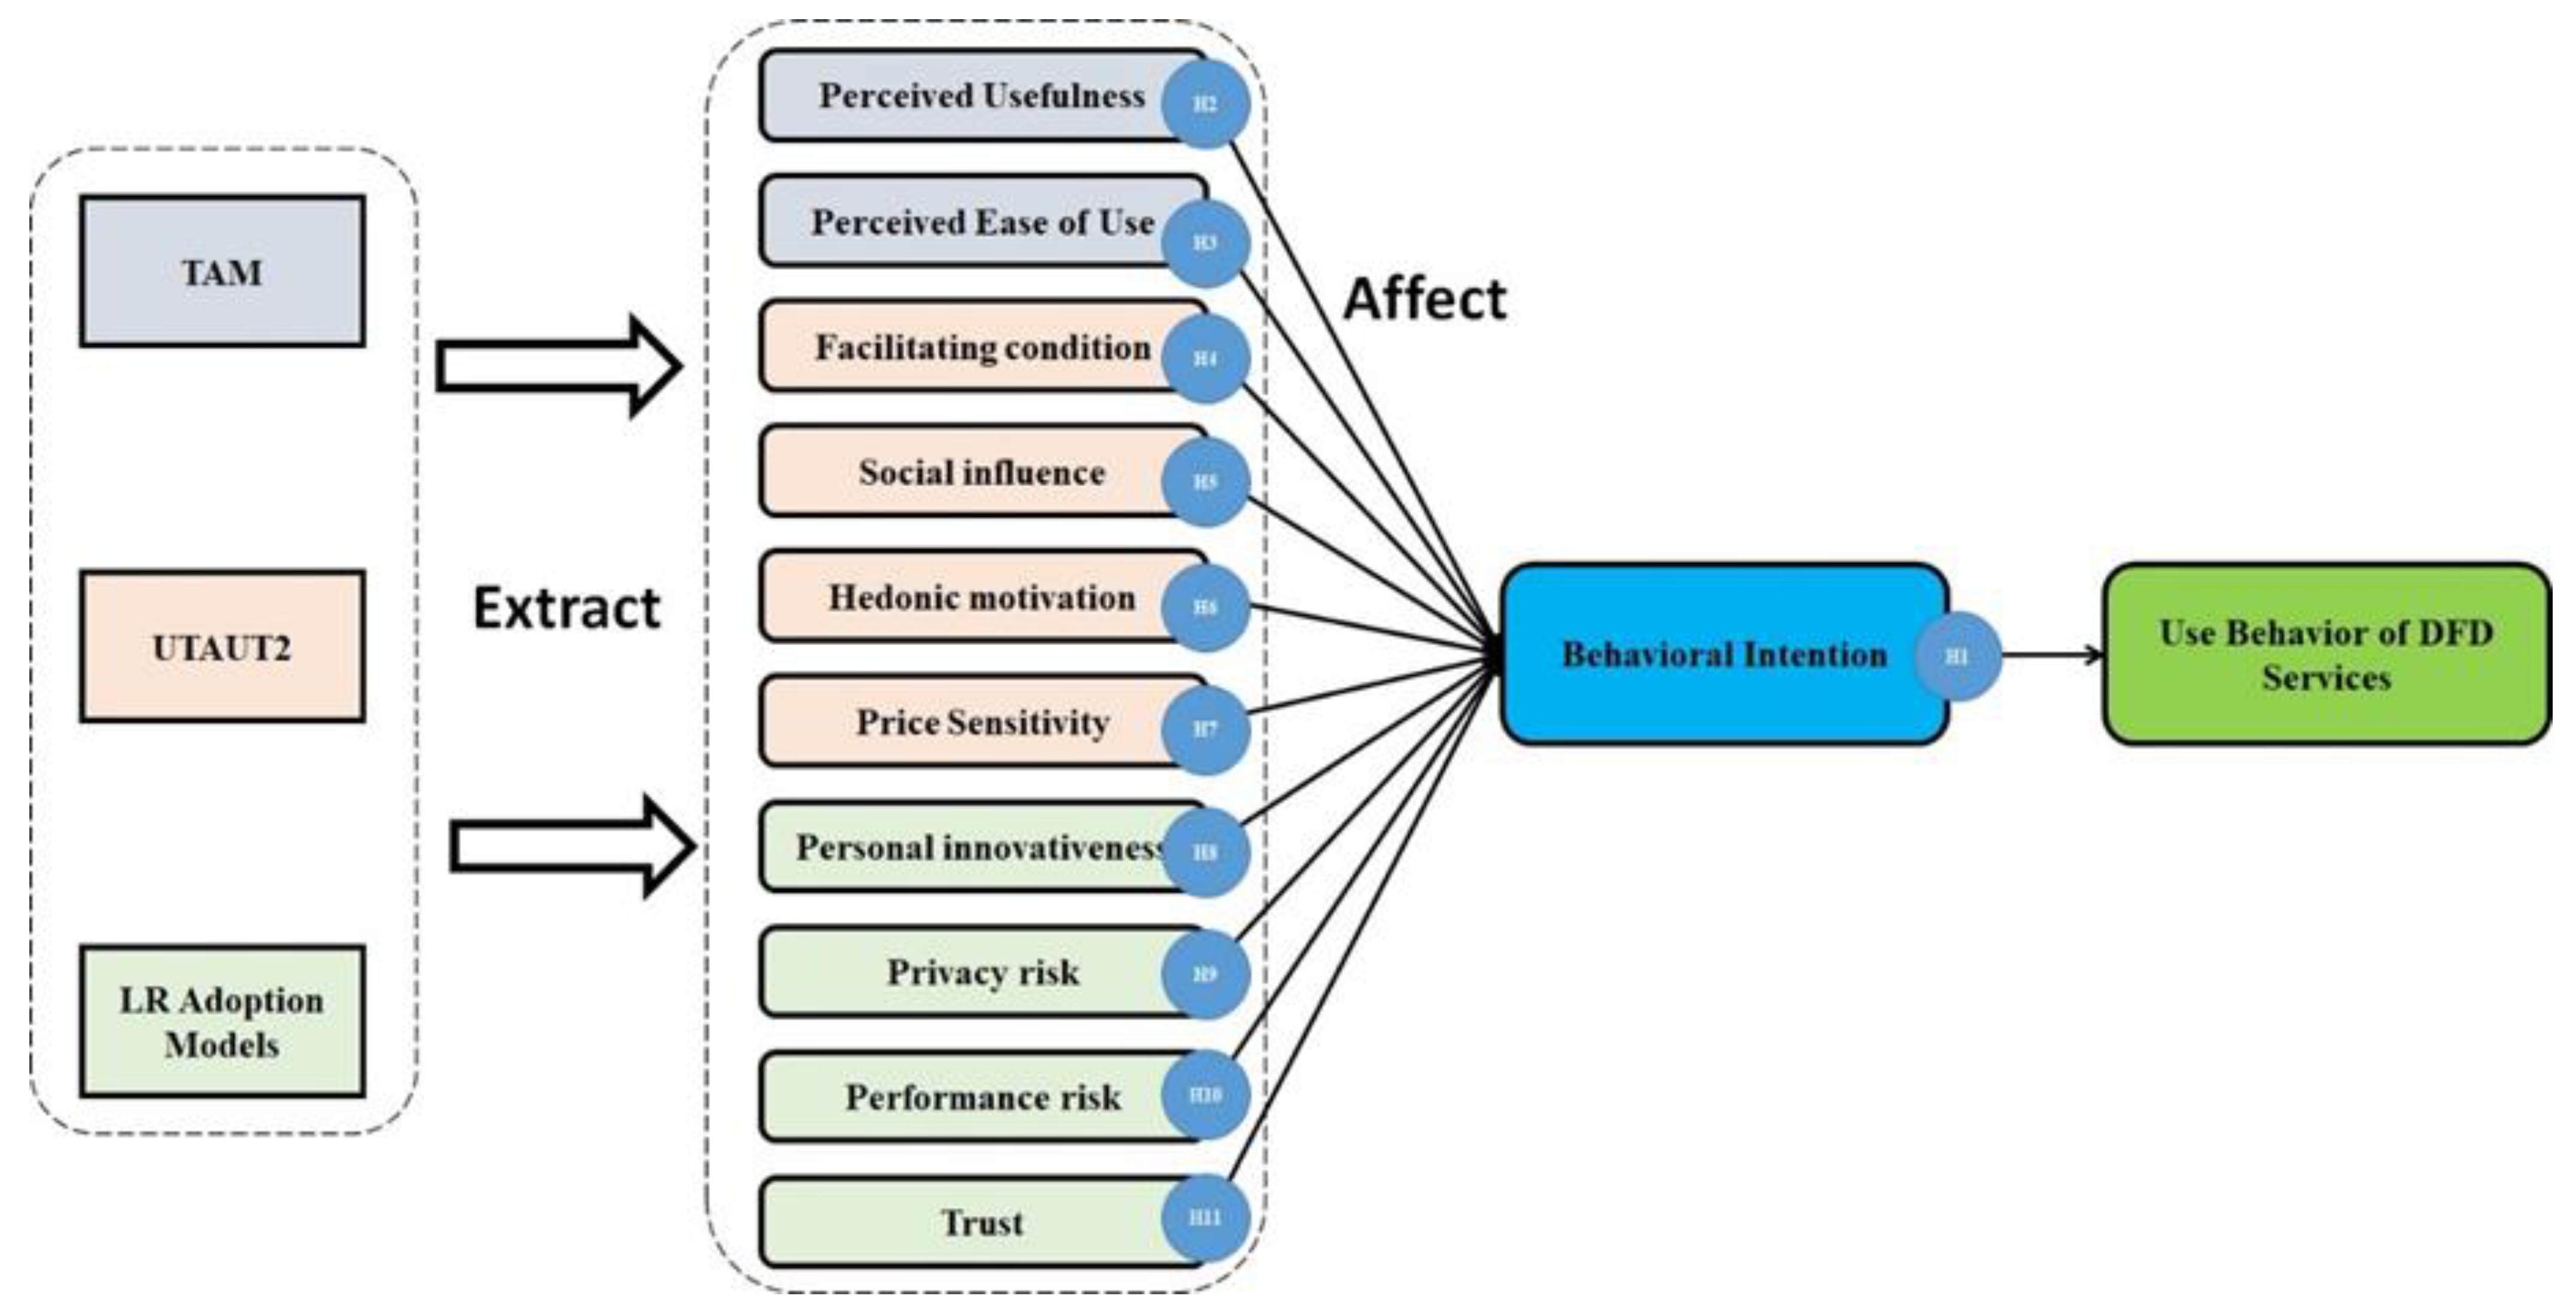
In this study, the conceptual model is developed based on the literature studies of drone delivery adoption and the conceptualization of TAM and UTAUT2. The conceptual model shown in Figure 1 encompasses 10 independent constructs that were elicited from the reviewed papers and theories as presented in the previous section.
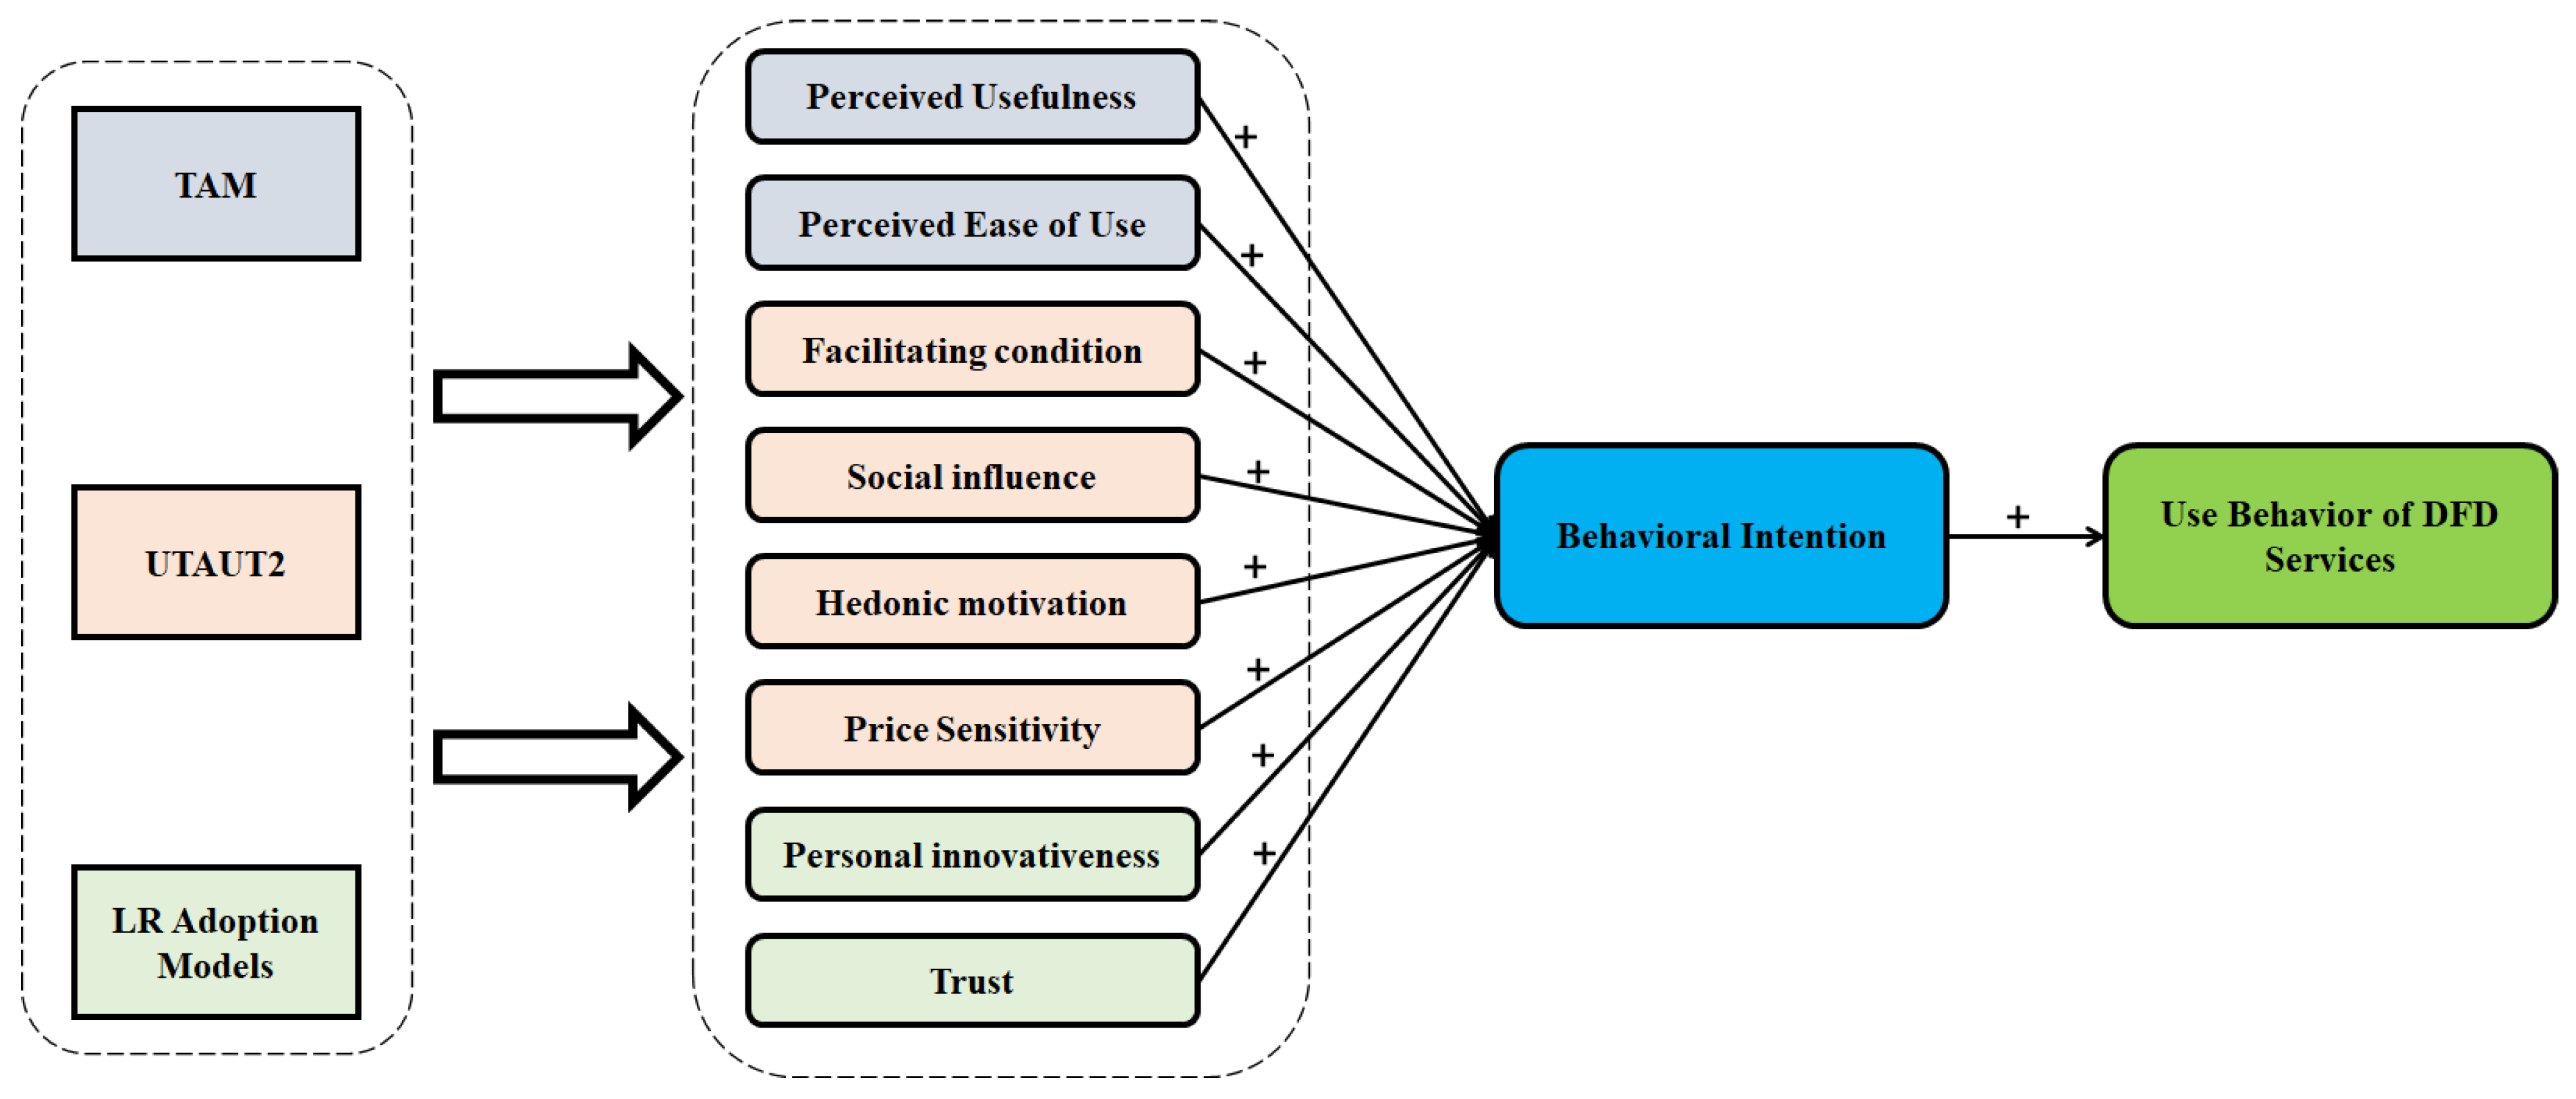
As shown in Figure 4, six variables are extracted from two main theories in the literature, TAM, and UTAUT2 that are adopted by many studies in the literature to understand the relationship between behavioral intention and adoption of emerging technology such as Drones. In addition, the remaining four variables are extracted from existing studies that revealed a positive relation with behavioral intention. Table 9 shows each variable and the associated hypotheses.

4. Methodology

To measure each concept, multi-item scales adopted from Siron and Tasripan’s (2012) study were used. Table 10 shows each scores ranges with its corresponding interpretation. In this study, the measurements are fully adopted from other studies with minor modifications made to be more suitable and acceptable for this study. Table 11 presents the source of the measurement. The table also shows the variables, number of the items, and the source of the measurement.
In the context of emerging technology research, researchers and practitioners have strongly emphasized that youth are keener to use new technologies than old people [16,48,59,60,61,62]. Such a population of university students in previous studies that investigated technology adoption justified this by high personal innovativeness of youth, limited time, living-in hostels, transportation issues in the urban area, cost of dine-in restaurants, heavy workload, limited time, and busy schedules [33,58,59,60].
To obtain high-quality outcomes and ensure that the questions are accurately and clearly stated, and understandable by respondents, a pilot study needs to be conducted. Questionnaires were distributed via emails to 30 respondents to find whether the questions were understood easily as well as whether the wording was clear enough. The target respondents are students of Universiti Tenaga Nasional. Students tend to order food due to the issues of cost, time, and transportation. Each respondent has the opportunity to give his/her opinion and provide his/her feedback. A total of 24 participants in this pilot study returned their questionnaires without any comments on the clarity of the questions. Data collection was conducted through an online questionnaire by using Google Docs tools. The questionnaire was distributed in the English language. Since this study addresses a new technology, participants were requested to watch a short video to help them understand how this new technology. More than 357 respondents, undergraduate and postgraduate students, received the invitation via Emails, WhatsApp, UNITEN students’ Telegram channel, and Facebook groups to answer the questionnaire. The response period given for respondents to answer the questionnaire was three weeks. As a result, a total of 209 usable and complete questionnaires are returned with a response. Based on [63], a number of responses between 30 and 500 are acceptable and adequate for any scientific research.

5. Data Analysis

To endure a clear and meaningful presentation, descriptive statistics are utilized to analyze data that describe the information of the respondents and the variables. A summary of the result of respondents’ demographic information is shown in Table 12.
Among the respondents, more than half of the respondents, 56.5% (118 participants), are 25 years of age or below. The total of male respondents is 56.9% (119), while the total of female respondents is 43.1% (90). This indicates that the majority of the study’s population are males. The highest number of respondents came from Bachelor’s students, with a rate of 60.8% (127) followed by 20.6% (43) Ph.D. students, Masters students representing 13.9% (29), and Diploma students representing 4.8% (10). More than 60 respondents use online food delivery regularly. For instance, 5.3% (11) of respondents use it daily, 18.2% (38) receive their foods several times per week, 10.5% (22) once per week, and 26.3% (55) embraced it several times per month. In contrast, below 40% use it less often. The results showed that 40.7% (85) of the respondents are aware of DFD services, while 59.3% (124) do not know about it.
Cronbach’s alpha assesses the internal consistency or reliability of the measurements or ratings [63]. It indicates how reliable the responses to a survey are. It has a range of values between 0.00 and 1.00, and higher values reflect higher reliability [63]. Table 13 shows the variables, number of items, Cronbach’s Alpha, and the status or the interpretation. As shown in Table 13, the results of variables reliability are greater than the recommended value of 0.7, which indicates that all the values are reliable.
Pearson correlation is a technique used for assessing the linear relationship between two variables and the strength of the association between them. The Pearson correlation’s value range is always between −1 to +1. A value closer to +1 indicates that there is a positive linear relationship between the two variables. While a value closer to −1 indicates that there is a negative relationship between the two variables. In contrast, when the Pearson correlation’s value equals zero, there is no relationship between the two variables. Moreover, Pallant [46] pointed out that the correlation between variables must be less than 0.90 to avoid multicollinearity. Table 14 presents the Pearson correlation coefficient, which ranges between the variables, which are less than 0.90 and not greater than 0.90, indicating no multicollinearity.
Regression analysis is considered one of the prominent statistical methods in defining a functional relationship among variables. In other words, it can explain and/or forecast the relationship between a dependent variable and an independent variable. It also has numerous areas of application such as economics, finance, psychology, engineering, et cetera. Thus, using regression analysis, the causal effect between dependent and independent variables can be measured, and, subsequently, the hypothesis of this study can be tested. The results are shown in Table 15.
Hypothesis testing is conducted in this section. Consequently, the hypothesis is accepted or rejected based on the p-value. For example, if the p-value is less than 0.05, then the related hypothesis is accepted. However, if the p-value is greater than 0.05, the related hypothesis is rejected. As shown in Table 4, the results of the examined hypotheses are as follows:
More specifically, use behavior was significantly affected by BI (β = 0.697, p < 0.05), PU (β = 0.344, p < 0.05), EU (β = 0.271, p < 0.05), SI (β = 0.517, p < 0.05), FCON (β = 0.365, p < 0.05), HM (β = 0.265, p < 0.05), PS (β = 0.208, p < 0.05), PI (β = 0.469, p < 0.05), and T (β = 0.509, p < 0.05). Thus, Hypotheses H1, H2, H3, H4, H5, H6, H7, H8, and H11 were supported. However, Hypotheses H9 and H10, which proposed the effect of PRR and PER on behavioral intentions, were not supported: (β = −0.115, p > 0.05) and (β = −0.042, p > 0.05). Based on the regression analysis results, the final model of this study is presented in Figure 4 and Figure 5. Drawing the final model of this study after excluding insignificant variables to fulfill the third objective.

6. Discussion and Recommendation

The use of drones in delivery has received increasing attention from the industry, and research communities in recent years have redirected their attention to the broad features of speed, flexibility, security, and cost [19,20]. Moreover, amid the Covid-19 pandemic, delivery drones could be used to ensure social and physical distancing. However, it is unknown whether customers are willing to adopt it despite its advantages such as delivery speed and environmental friendliness in comparison to the traditional means such as motorbikes, cars, and trucks [20]. The functional results show that there is a significant relationship between behavioral intention and the user behavior of DFD. The results also show that social influence has the most substantial impact on behavioral intention, followed by trust, personal innovativeness, facilitating conditions, usefulness, ease of use, hedonic motivation, and price sensitivity. In contrast, privacy risk and performance risk are not significant factors in accepting DFD.
The first hypothesis assumes that behavioral intention has a significant and positive effect on the use behavior of the DFD services by customers. In line with that, the regression analysis results confirmed the assumption that behavior plays an important role in forming the DFD behavior. The findings of previous studies support this result [40,48]. The second hypothesis on the behavioral intention to use the services of DFD was examined and a significant effect was confirmed, as predicted. Consumers will be more motivated to use the services of DFD as they perceived that DFD service is useful and could enhance the performance of their job. The previous literature confirmed the positive impact of usefulness on behavioral intention. [16,31,33]. The third hypothesis is expected to be significant and positive on the behavioral intention of the DFD services. The result shows that this factor is crucial in shaping the behavioral intention of the services of DFD. Similar findings were reported by previous studies [16,31,33,41]. The fourth hypothesis addresses social influence, which is expected to have a significant positive impact. The outcome of the regression analysis for this factor confirmed this assumption. It revealed a great effect on customers’ behavioral intention. This means that people could be more motivated if they have a certain level of encouragement provided by colleagues, family, and friends surrounding them, which has an essential effect on their awareness and their intention toward technology. This finding is in line with the outcome of other studies. An interesting finding by [40,57] pointed out that the importance of social influence is high in the early stages of adopting new technology by individuals. Over time, it becomes less significant with sustained usage.
The fifth hypothesis of this study predicted that the facilitating conditions significantly and positively form DFD services’ behavior intention. Thus, providing accessible resources such as prior knowledge, peer support, facilities, and skills plays an important role in a user’s behavior intention to use DFD services. The previous literature that focuses on adopting a new technology supports the significant role of facilitating customer behavioral intention conditions. Such findings are also reported in different fields, such as mobile health adoption, Massive Open Online Courses (MOOCs) among teachers, VR systems, and autonomous delivery vehicles [57,64]. This study’s sixth hypothesis predicted that the hedonic motivation factor is positively and significantly forming behavior intention to use DFD services. The results indicated that the hedonic motivation construct is influential on the behavior intention to use DFD services. When it is perceived that interaction with this new delivery mean is enjoyable, customers will be more encouraged to use this delivery service. Other studies are in line with this finding [57,65].
The seventh hypothesis of this study assumed that price sensitivity has a significant negative influence on the behavioral intention to use DFD. Opposite to the prediction, price sensitivity positively and significantly influences customers to accept and use DFD. The customers disagree with the statements, and they are willing to pay more to use this new technology. This finding is in line with the findings of previous studies that addressed the new technology adoption, such as in [66]. The result of the eighth hypothesis demonstrated that personal innovativeness is a significant predictor of behavioral intention to use DFD services. In other words, individuals with high personal innovativeness are more willing to try new information technology such as DFD services. Many previous studies confirmed this causal relationship between personal innovativeness and behavioral intention towards the adoption of new technology [33,49,67].
This study’s ninth hypothesis expected that privacy risk construct negatively and significantly affects the customer’s behavioral intention to use DFD services. However, the result of the data analysis found that privacy risk is not significant in the acceptance and use of DFD services. The outcome is reasonable since this study has set a condition to include only respondents who have experienced traditional food delivery services. The traditional method requires the customer to give his/her full information such as name, phone, delivery address, time, and online payment transaction in most cases. Thus, they would not see privacy as a risk in drone delivery since the drone would require similar information to the traditional delivery means to deliver the food. Although this finding is not in line with many studies on emerging technology that stressed the importance of privacy risk on the user’s acceptance, some other studies reported similar findings, such as Liu et al. [68]. Choi and Ji [53] have justified that the high effect of trust might erase the effect of privacy risk (or any other risk e.g., performance) on behavioral intention. Another justification is that some of these studies found privacy risk to be significant. Their study was conducted in a high-risk area where the drone is mainly used for military purposes such as [14], and in Pakistan and Ramadan et al. [32] in Lebanon. However, a study conducted by [5] explored perceived risk types associated with using DFD.
This study’s 10th hypothesis proposed that performance risk has a significant and negative effect on the behavioral intention to use DFD services. Similar to the previous privacy risk results, the performance risk has no significant influence on behavioral intention to use DFD services. Hence, the hypothesis is rejected. The empirical findings show that respondents are not sensitive about DFD performance to deliver their food orders. Such findings have proven that DFD services are compatible with a prior level of confidence and certainty, similarly to other previously adapted technologies have been used (e.g., ATM, kiosk, internet banking). Lastly, DFD performance might not affect the consumers’ opinion because food orders might not be valuable compared with other orders that need a high level of performance to be delivered safely. This outcome is inconsistent with previous studies that have proven that performance risk is a crucial factor in shaping consumers’ intentions towards new technology [5,69,70]. In contrast, other studies claim that perceived risk is not a significant factor in shaping consumers’ intentions [53,68]. The eleventh and last hypothesis proposed in this study is trust. It is assumed to have a significant positive effect on the behavioral intention to use DFD services. According to the data analysis outcome, the hypothesis is significant. It is clearly shown that respondents agree with the statement related to trust. A high level of trust could enhance customers’ desire to depend on the drone to get their food daily. The outcome is compatible with other literature studies that included trust as a steady predictor to measure new technology acceptance [42,53] reported similar findings. Based on the earlier discussion, we, here, provide a list of recommendations (see Table 16) to stakeholders to adopt drones in food-industry services.

7. Conclusions

This study aims to identify factors that influence consumers’ intention to use drone food delivery services in Malaysia. A comprehensive model was proposed by reviewing the literature and integrating TAM and UTAUT2 models with personal innovativeness, privacy risk performance risk, and trust. A total of 11 hypotheses were proposed to investigate the consumer’s intention and adoption of DFD services. This study’s data were collected from 209 participants, who regularly order online food delivery, and analyzed using SPSS. The descriptive analysis findings showed that 88.6% of the participants had experienced online food delivery services regularly. In comparison, 40.7% of them have heard about drone food delivery (DFD) services. Moreover, the result shows that most respondents are younger than 25 years, and over 60% of respondents are Bachelor’s students. The mean score value shows that the values of the variables scored by the respondents are between moderate and agreement levels. The reliability analysis shows that all the values are reliable. Pearson correlation indicates no collinearity between the variables, and the correlation is within the recommended range. More importantly, the regression analysis shows that social influence has the highest influence on behavioral intention, followed by trust, personal innovativeness, facilitating conditions, usefulness, ease of use, hedonic motivation, and price sensitivity. While privacy risk and performance risk are not significant factors in accepting DFD. This study’s variables can explain 32.9% of the variation in the use behavior of DFD services. However, there are a set of limitations that should be considered carefully in future works. First of all, the respondents of this study did not have previous experience with DFD. However, a short video was added in the first section of the online survey to understand this emerging technology better. Their attitudes toward drone food delivery and intention to use might be different after actual use. Another limitation is that this study only examined consumers opinions; thus, future studies may include online food suppliers as a participant for further organizational information. Moreover, due to the Covid-19 pandemic, we could not have a mixed approach of data collection to obtain higher responses to better understand consumers’ behavioral intentions and enhance the explanatory power of the model. Lastly, a qualitative study is highly recommended for future work.

Author Contributions

Conceptualization, N.I.J.; methodology, H.K.; validation, M.A.M.; formal analysis, N.I.J.; investigation, N.I.J.; writing—original draft preparation, H.K.; writing—review and editing, N.I.J. All authors have read and agreed to the published version of the manuscript.

Funding

This work is sponsored by Universiti Tenaga Nasional (UNITEN) under the Bold Research Grant Scheme No. J510050002.

Institutional Review Board Statement

Not applicable.

Conflicts of Interest

The authors declare no conflict of interest.

References

  1. Argyres, N.; Bigelow, L.; Nickerson, J.A. Dominant designs, innovation shocks, and the follower’s dilemma. Strateg. Manag. J. 2015, 36, 216–234. [Google Scholar] [CrossRef]
  2. Dedehayir, O.; Steinert, M. The hype cycle model: A review and future directions. Technol. Forecast. Soc. Chang. 2016, 108, 28–41. [Google Scholar] [CrossRef] [Green Version]
  3. Li, Y.; Liu, C. Applications of multirotor drone technologies in construction management. Int. J. Constr. Manag. 2019, 19, 401–412. [Google Scholar] [CrossRef]
  4. McWilliams, A. Drone Technology and Global Markets; BCC Publishing: Bristol, UK, 2020. [Google Scholar]
  5. Chen, C.; Choi, H.S.; Charoen, D. An Interdisciplinary Approach to Examining the Adoption of Drone Delivery Services. In Proceedings of the Conference on Information Systems Applied Research, Norfolk, VA, USA, 31 October–3 November 2018; Information Systems & Computing Academic Professionals: Wilmington, NC, USA, 2018; Volume 2167, p. 1508. [Google Scholar]
  6. Sethu, H.S.; Saini, B. Customer Perception and Satisfaction on Ordering Food via Internet, a Case on Foodzoned.Com, in Manipal. In Proceedings of the Seventh Asia-Pacific Conference on Global Business, Economics, Finance and Social Sciences (AP16Malaysia Conference), Kuala Lumpur, Malaysia, 15–17 July 2016; J. A. Alpha Business Research & Publishers Pvt. Ltd.: Chennai, India, 2016; pp. 15–17. [Google Scholar]
  7. Liu, C.; Hung, K. Self-Service Technology Preference During Hotel Service Delivery: A Comparison of Hoteliers and Customers. In Information and Communication Technologies in Tourism 2020; Springer: Cham, Switzerland, 2020; pp. 267–279. [Google Scholar]
  8. Giones, F.; Brem, A. From toys to tools: The co-evolution of technological and entrepreneurial developments in the drone industry. Bus. Horiz. 2017, 60, 875–884. [Google Scholar] [CrossRef]
  9. Snead, J.; Seibler, J.M.; Inserra, D. Establishing a Legal Framework for Counter-Drone Technologies; Heritage Foundation: Washington, DC, USA, 2018. [Google Scholar]
  10. Boukoberine, M.N.; Zhou, Z.; Benbouzid, M. Power Supply Architectures for Drones—A review. In Proceedings of the IECON 2019 45th Annual Conference of the IEEE Industrial Electronics Society, Lisbon, Portugal, 14–17 October 2019; Institute of Electrical and Electronics Engineers: Piscataway, NJ, USA; Volume 1, pp. 5826–5831. [Google Scholar]
  11. Vagia, M.; Rødseth, Ø.J. A Taxonomy for Autonomous Vehicles for Different Transportation Modes. J. Phys. Conf. Ser. 2019, 1357, 012022. [Google Scholar] [CrossRef]
  12. Wang, C.; He, X.; Liu, Y.; Song, J.; Zeng, A. The small single-and multi-rotor unmanned aircraft vehicles chemical application techniques and control for rice fields in China. Asp. Appl. Biol. 2016, 132, 73–81. [Google Scholar]
  13. Teal Group Corporation. UAV Production Will Total $93 Billion. 2015. Available online: https://www.tealgroup.com/index.php/pages/press-releases/34-uav-production-will-total-93-billion (accessed on 20 January 2021).
  14. Khan, R.; Tausif, S.; Javed Malik, A. Consumer acceptance of delivery drones in urban areas. Int. J. Consum. Stud. 2019, 43, 87–101. [Google Scholar] [CrossRef] [Green Version]
  15. Balaban, M.A.; Mastaglio, T.W.; Lynch, C.J. Analysis of Future UAS-Based Delivery. In Proceedings of the 2016 Winter Simulation Conference (WSC), Arlington, VA, USA, 11–14 December 2016; Institute of Electrical and Electronics Engineers: Piscataway, NJ, USA, 2016; pp. 1595–1606. [Google Scholar]
  16. Hwang, J.; Kim, H.; Kim, W. Investigating motivated consumer innovativeness in the context of drone food delivery services. J. Hosp. Tour. Manag. 2019, 38, 102–110. [Google Scholar] [CrossRef]
  17. Soffronoff, J.; Piscioneri, P.; Weaver, A. Public Perception of Drone Delivery in the United States (RARC-WP-17-001). Retrieved from US Postal Service Office of In-spector General. 2016. Available online: https://www.uspsoig.gov/document/public-perception-drone-delivery-united-states (accessed on 13 April 2021).
  18. Torabbeigi, M.; Lim, G.J.; Kim, S.J. Drone delivery scheduling optimization considering payload-induced battery consumption rates. J. Intell. Robot. Syst. 2020, 97, 471–487. [Google Scholar] [CrossRef]
  19. Joerss, M.; Schröder, J.; Neuhaus, F.; Klink, C.; Mann, F. Parcel Delivery: The Future of Last Mile. Retrieved from McKinsey&Company. 2016. Available online: https://www.mckinsey.com/industries/travel-transport-and-logistics/our-insights/how-customer-demands-are-reshaping-last-mile-delivery (accessed on 17 March 2021).
  20. Rose, C. Amazon’s Jeff Bezos Looks to the Future. CBS News. 1 December 2013. Available online: https://www.cbsnews.com/news/amazons-jeff-bezos-looks-to-the-future/ (accessed on 29 November 2017).
  21. Raptopoulos, A. No Roads? There’sa Drone for That. In Proceedings of the 2013 TED Global Conference, Edinburgh, UK, 10–14 June 2013. [Google Scholar]
  22. Björsell, K.; Hedman, J. Future Impacts of Self-Driving Vehicles: A Case Study on the Supply Chain of E-Commerce to Identify Important Factors for the Transport Administrators of Sweden; Luleå University of Technology: Luleå, Sweden, 2018. [Google Scholar]
  23. The Straits Times. Australia Life-Saving Drone Rescues Two Boys in Rough Seas. 2018. Available online: http://www.straitstimes.com/asia/australianz/australia-lifesaving-drone-rescues-two-boys-in-rough-seas (accessed on 20 February 2021).
  24. Hankyoreh. Korea Post Makes First Delivery of Mail via Drone. 2017. Available online: http://english.hani.co.kr/arti/english_edition/e_national/821283.html (accessed on 15 January 2021).
  25. Thestar. Food Delivery Will Continue to be a Big Trend in 2020. 2020. Available online: https://www.thestar.com.my/food/food-news/2020/01/04/food-delivery-will-continue-to-be-a-big-trend-in-2020 (accessed on 11 December 2020).
  26. Lifestyle. Watch: Drone Delivers Costa Coffee on Kite Beach in Dubai. 2017. Available online: https://www.thenational.ae/lifestyle/food/watch-drone-delivers-costa-coffee-on-kite-beach-in-dubai-1.661444 (accessed on 13 March 2021).
  27. Ajudaily. Food Delivery Drone Makes Successful First Test Flight in S. Korea. 2016. Available online: http://ajudaily.com/view/20161124153220660 (accessed on 22 December 2020).
  28. NST. Food Delivery via Drones in Cyberjaya by End of the Month. 2019. Available online: https://www.nst.com.my/lifestyle/bots/2019/06/497157/food-delivery-drones-cyberjaya-end-month (accessed on 15 January 2021).
  29. Todayonline. Singapore Launches First Drone Delivery Service. 2020. Available online: https://www.todayonline.com/singapore/singapore-launches-first-drone-delivery-service (accessed on 10 February 2021).
  30. AsiaEconomy.Stop Fast Now: Every Year 1548 Food Deliveries, Dead or Injured During Delivery. 2017. Available online: http://www.asiae.co.kr/news/view.htm?idxno=2017092611430473709 (accessed on 24 March 2021).
  31. Yoo, W.; Yu, E.; Jung, J. Drone delivery: Factors affecting the public’s attitude and intention to adopt. Telemat. Inform. 2018, 35, 1687–1700. [Google Scholar] [CrossRef]
  32. Ramadan, Z.B.; Farah, M.F.; Mrad, M. An adapted TPB approach to consumers’ acceptance of service-delivery drones. Technol. Anal. Strateg. Manag. 2017, 29, 817–828. [Google Scholar] [CrossRef]
  33. Chen, C.; Choi, H.; Charoen, D. Drone Delivery Services: An Evaluation of Personal Innovativeness, Opinion Passing and Key Information Technology Adoption Factors. J. Inf. Syst. Appl. Res. 2019, 12, 4. [Google Scholar]
  34. Hwang, J.; Choe, J.Y.J. Exploring perceived risk in building successful drone food delivery services. Int. J. Contemp. Hosp. Manag. 2019, 31, 3249–3269. [Google Scholar] [CrossRef]
  35. Abdullah, F.; Ward, R. Developing a General Extended Technology Acceptance Model for E-Learning (GETAMEL) by analysing commonly used external factors. Comput. Hum. Behav. 2016, 56, 238–256. [Google Scholar] [CrossRef]
  36. Park, E.; Baek, S.; Ohm, J.; Chang, H.J. Determinants of player acceptance of mobile social network games: An application of extended technology acceptance model. Telemat. Inform. 2014, 31, 3–15. [Google Scholar] [CrossRef]
  37. Chang, C.C.; Yan, C.F.; Tseng, J.S. Perceived convenience in an extended technology acceptance model: Mobile technology and English learning for college students. Australas. J. Educ. Technol. 2012, 28, 809–826. [Google Scholar] [CrossRef] [Green Version]
  38. Percy, L.; Rossiter, J.R. A Theory-Based Approach to Pretesting Advertising. In Measuring Advertising Effectiveness; Psychology Press: Hove, UK, 1997; pp. 267–281. [Google Scholar]
  39. Vandecasteele, B.; Geuens, M. Motivated consumer innovativeness: Concept, measurement, and validation. Int. J. Res. Mark. 2010, 27, 308–318. [Google Scholar] [CrossRef]
  40. Rogers, E.M. Diffusion of Innovations, 3rd ed.; Free Press: New York, NY, USA, 1983. [Google Scholar]
  41. Venkatesh, V.; Morris, M.G.; Davis, G.B.; Davis, F.D. User acceptance of information technology: Toward a unified view. MIS Q. 2003, 27, 425–478. [Google Scholar] [CrossRef] [Green Version]
  42. Venkatesh, V.; Thong, J.Y.; Xu, X. Consumer acceptance and use of information technology: Extending the unified theory of acceptance and use of technology. MIS Q. 2012, 36, 157–178. [Google Scholar] [CrossRef] [Green Version]
  43. Alalwan, A.A.; Dwivedi, Y.K.; Rana, N.P. Factors influencing adoption of mobile banking by Jordanian bank customers: Extending UTAUT2 with trust. Int. J. Inf. Manag. 2017, 37, 99–110. [Google Scholar] [CrossRef]
  44. Palau-Saumell, R.; Forgas-Coll, S.; Sánchez-García, J.; Robres, E. User acceptance of mobile apps for restaurants: An expanded and extended UTAUT-2. Sustainability 2019, 11, 1210. [Google Scholar] [CrossRef] [Green Version]
  45. Davis, F.D. Perceived usefulness, perceived ease of use, and user acceptance of information technology. MIS Q. 1989, 13, 319–340. [Google Scholar] [CrossRef] [Green Version]
  46. Featherman, M.S.; Pavlou, P.A. Predicting e-services adoption: A perceived risk facets perspective. Int. J. Hum. Comput. Stud. 2003, 59, 451–474. [Google Scholar] [CrossRef] [Green Version]
  47. Alalwan, A.A.; Dwivedi, Y.K.; Williams, M.D. Customers’ intention and adoption of telebanking in Jordan. Inf. Syst. Manag. 2016, 33, 154–178. [Google Scholar] [CrossRef] [Green Version]
  48. Statista. Digital Market Outlook, Malaysia. 2020. Available online: https://www.statista.com/outlook/374/122/online-food-delivery/malaysia (accessed on 12 January 2021).
  49. Moorthy, K.; T’ing, L.C.; Wei, K.M.; Mei, P.T.Z.; Yee, C.Y.; Wern, K.L.J.; Xin, Y.M. Is facebook useful for learning? A study in private universities in Malaysia. Comput. Educ. 2019, 130, 94–104. [Google Scholar] [CrossRef]
  50. Shao, X.; Siponen, M. Consumer Acceptance and Use of Information Technology: Adding Consumption Theory to UTAUT2. In Proceedings of the SIGSVC Workshop, Shanghai, China, 3 December 2011; Sprouts: Working Papers on Information Systems; Association for Information Systems: Atlanta, GA, USA, 2011; Volume 11, No. 157; pp. 11–157. [Google Scholar]
  51. Yoo, H.T.; You, H.S.; Jeong, Y.S. Study on measures to introduce Drone Delivery Service for domestic logistics. J. Converg. Inf. Technol. 2018, 8, 243–249. [Google Scholar]
  52. Zhang, T.; Tao, D.; Qu, X.; Zhang, X.; Lin, R.; Zhang, W. The roles of initial trust and perceived risk in public’s acceptance of automated vehicles. Transp. Res. Part C 2019, 98, 207–220. [Google Scholar] [CrossRef]
  53. Al-Momani, A.M.; Mahmoud, M.A.; Ahmad, M.S. Factors that influence the acceptance of Internet of things services by customers of telecommunication companies in Jordan. J. Organ. End User Comput. 2018, 30, 51–63. [Google Scholar] [CrossRef]
  54. Choi, J.K.; Ji, Y.G. Investigating the importance of trust on adopting an autonomous vehicle. Int. J. Hum. Comput. Interact. 2015, 31, 692–702. [Google Scholar] [CrossRef]
  55. Baabdullah, A.; Dwivedi, Y.K.; Williams, M.D. Adopting An Extended UTAUT2 To Predict Consumer Adoption Of M-Technologies In Saudi Arabia. In Proceedings of the UK Academy for Information Systems 19th Annual Conference 2014, Oxford, UK, 7–9 April 2014; UK Academy for Information Systems: London, UK, 2014; p. 5. [Google Scholar]
  56. Harris, M.; Cox, K.C.; Musgrove, C.F.; Ernstberger, K.W. Consumer preferences for banking technologies by age groups. Int. J. Bank Mark. 2016, 34, 587–602. [Google Scholar] [CrossRef]
  57. Gefen, D.; Karahanna, E.; Straub, D.W. Trust and TAM in online shopping: An integrated model. MIS Q. 2003, 27, 51–90. [Google Scholar] [CrossRef]
  58. Prabhash, M.A.M. The Consumer Perception On Online Food Delivery System Among Youth In Kerala. EPRA Int. J. Multidiscip. Res. 2020, 6, 96–100. [Google Scholar]
  59. Kucukusta, D.; Law, R.; Besbes, A.; Legohérel, P. Re-examining perceived usefulness and ease of use in online booking. Int. J. Contemp. Hosp. Manag. 2015, 27, 185–198. [Google Scholar] [CrossRef]
  60. Sharma, K.; Waheed, K.A. Consumption of online food app services: An exploratory study among college students in Dubai. Middle East J. Bus. 2018, 13, 4–11. [Google Scholar] [CrossRef]
  61. Mostafa, S.A.; Gunasekaran, S.S.; Mustapha, A.; Mohammed, M.A.; Abduallah, W.M. Modelling an adjustable autonomous multi-agent internet of things system for elderly smart home. In International Conference on Applied Human Factors and Ergonomics; Springer: Cham, Switzerland, 2019; pp. 301–311. [Google Scholar]
  62. Kim-Soon, N.; Mostafa, S.A.; Nurunnabi, M.; Chin, L.H.; Kumar, N.M.; Ali, R.R.; Subramaniam, U. Quality management practices of food manufacturers: A comparative study between small, medium and large companies in Malaysia. Sustainability 2020, 12, 7725. [Google Scholar] [CrossRef]
  63. Sekaran, U. Research Method for Business: A Skill Approach; John Willey and Sons, Inc: Hoboken, NJ, USA, 2003. [Google Scholar]
  64. Kapser, S.; Abdelrahman, M. Acceptance of autonomous delivery vehicles for last-mile delivery in Germany–Extending UTAUT2 with risk perceptions. Transp. Res. Part C 2020, 111, 210–225. [Google Scholar] [CrossRef]
  65. Huang, F.H. Adapting UTAUT2 to assess user acceptance of an e-scooter virtual reality service. Virtual Real. 2020, 24, 635–643. [Google Scholar] [CrossRef]
  66. Beh, P.K.; Ganesan, Y.; Iranmanesh, M.; Foroughi, B. Using smartwatches for fitness and health monitoring: The UTAUT2 combined with threat appraisal as moderators. Behav. Inf. Technol. 2019, 40, 282–299. [Google Scholar] [CrossRef]
  67. Flamm, K.; Chaudhuri, A. An analysis of the determinants of broadband access. Telecommun. Policy 2007, 31, 312–326. [Google Scholar] [CrossRef]
  68. Liu, H.; Yang, R.; Wang, L.; Liu, P. Evaluating initial public acceptance of highly and fully autonomous vehicles. Int. J. Hum. Comput. Interact. 2019, 35, 919–931. [Google Scholar] [CrossRef]
  69. Lin, Z.; Filieri, R. Airline passengers’ continuance intention towards online check-in services: The role of personal innovativeness and subjective knowledge. Transp. Res. Part E Logist. Transp. Rev. 2015, 81, 158–168. [Google Scholar] [CrossRef] [Green Version]
  70. Al-Momani, A.M.; Mahmoud, M.A.; Ahmad, M.S. A review of factors influencing customer acceptance of internet of things services. Int. J. Inf. Syst. Serv. Sect. 2019, 11, 54–67. [Google Scholar] [CrossRef] [Green Version]
Figure 1. The number of published studies in DFD.
Sustainability 14 02852 g001
Figure 2. Variables Selection Procedure.
Sustainability 14 02852 g002
Figure 3. The number of excluded variables in every stage.
Sustainability 14 02852 g003
Figure 4. Conceptual Model.
Sustainability 14 02852 g004
Figure 5. Final Model of Drone Food Delivery Acceptance.
Sustainability 14 02852 g005
Table 1. Summary of Studies Related to Drone Delivery Services.
Author/Year/CountryIndependent VariablesDependent VariableMethodology
Yoo et al. [31] Republic of KoreaRelative advantage; complexity; compatibility. performance risk; privacy risk; delivery risk; personal innovativeness; Mass media channels; environmental concernAttitude toward drone delivery Intention toward drone deliveryan online survey was conducted among 296 U.S consumers
Hwang et al. [16] South KoreaFunctionally MCI; Hedonically MCI; Cognitively MCI; Socially MCIEffect of motivated consumer innovativeness on attitude; Effect of motivated consumer innovativeness on behavioral intentions; Effect of attitude on desire; Effect of attitude on behavioral intentions; Effect of desire on behavioral intentionsa survey was performed to collect data from 320 respondents in Korea
Hwang & Kim [46] South KoreaGreen image of drone food deliveryIntention to use; Attitude toward using drone food delivery services; word-of-mouth intentions; willingness to payhypotheses were developed and tested using a total of 427 samples collected in Korea
Hwang & Choe [5] Republic of KoreaFinancial risk, time risk, privacy risk, performance risk, psychological riskImage of drone food delivery services; intentions to use a drone; Desire; Willingness to payThis study collected data from 331 respondents in Korea
Ramadan et al. [32] Beirut, Lebanonprivacy risk; safety risk; performance risk; personification of the drone,The attitude toward drone usage; intentions to use a drone.
Khan et al. [14] Islamabad, PakistanPrivacy Concerns; Safety Concerns; Level of Criminal Activity
Effect on the Environment
Consumer AcceptanceA total of 307 responses were collected
Yoo et al. [49]Personal innovativeness; Economics; Convenience; Perceived riskPerceived usefulness
Chen et al. [33]. United StatesPerceived ease of use; Perceived usefulness; Opinion passing; Personal innovativenessBehavioral intentionThis study surveyed 157 college students and their related family members
Anbaroğlu [50]Physical safety; Perception; Privacy risk
Table 2. All variables from related studies.
#VariablesSource
1.Relative advantageYoo et al. [31]
2.Complexity
3.Compatibility
4.performance risk
5.privacy risk
6.delivery risk
7.Personal innovativeness
8.Mass media channels
9.Environmental concern
10.Functionally MCIHwang et al., [16]
11.Hedonically MCI
12.Cognitively MCI
13.Socially MCI
14.Green image of drone food deliveryHwang & Kim [46]
15.Financial riskHwang & Choe [5]
16.time risk
17.privacy risk
18.performance risk
19.psychological risk
20.privacy riskRamadan et al. [32]
21.safety risk
22.performance risk
23.personification of the drone
24.Privacy ConcernsKhan et al. [14]
25.Safety Concerns
26.Level of Criminal Activity
27.Effect on Environment
28.Personal innovativenessYoo at al. [49]
29.Economics
30.Convenience
31.Perceived risk
32.Perceived ease of useChen et al. [33]
33.Perceived usefulness
34.Opinion passing
35.Personal innovativeness
36.Physical safetyAnbaroğlu [50]
37.Perception
38.Privacy risk
Table 3. Combine overlapping variables.
Combined VariableYoo et al. [31]Hwang & Choe [5]Ramadan et al. [32]Khan et al. [14]Yoo et al. [49]Chen et al. [33]Anbaroğlu [50]
Performance riskperformance riskperformance riskperformance risk
Privacy riskprivacy riskprivacy riskprivacy riskprivacy Concerns privacy risk
Personal innovativenessPersonal innovativeness Personal innovativenessPersonal innovativeness
Safety Concerns safety risksafety Concerns Physical safety
Environmental ConcernsEnvironmental Concerns Effect of Environment Green image of DFD
Table 4. Exclude non-potential variables.
#VariablesStudy ReferenceExclusion Reason
1Drone personificationRamadan et al. [32]the study developed a conceptual model only without examining the significance of the variables
2perceptionAnbaroğlu [50]Vision paper
3EconomicsYoo et al. [49]non-fully English study, the study in Korean, and only the abstract and the conceptual model figure in English
4Convenience
5Perceived risk
6Financial riskHwang et al. [16]Not directed to study the acceptance/adoption; instead, the study investigates the relationship between perceived risk and image of drone food delivery services without considering the consumer’s acceptance.
7Time risk
8Psychological risk
Table 5. Excluding similar variables in TAM and UTAUT 2.
#VariablesStudy ReferenceUTAUT2/TAM Constructs
1Relative advantageYoo et al. [31]Usefulness
2Functionality MCIHwang et al. [16]
3Perceived UsefulnessChen et al. [33]
4Cognitively MCIHwang et al., [16]Ease of use
5Perceived Ease of UseChen et al. [33]
6ComplexityYoo et al. [31]
7Socially MCIHwang et al. [16]Social influence
8Opinion PassingChen et al. [33]
9Hedonically MCIHwang et al. [16]Hedonic motivation
10CompatibilityYoo et al. [31]Facilitating condition
Table 6. Summary of the factors and their frequencies.
#VariablesFrequencySourceSignificanceSelected
1.Privacy risk2[31]Yes
[14]Yes
2.Personal innovativeness2[31]Yes
[33]Yes
3.Performance risk1[31]Yes
4.Environmental concern3[31]NoX
[14]No
[46]Yes
5.Level of Criminal Activity1[14]NoX
6.Mass media channels1[31]NoX
7.Safety Concerns1[14]NoX
8.Delivery risk1[31]NoX
Table 7. Factors with Similar functions.
#FactorSource
1.PUTAM
2.EUTAM
3.SIUTAUT2
4.FCONUTAUT2
5.HMUTAUT2
6.PSUTAUT2
7.PIKhan et al.[14]
8.PRRChen et al. [33]
9.PERYoo et al. [31]
10.TGefen et al. [55]
Table 8. Comparing this study’s selected variables and the seminal studies.
VariableThis Study Selected VariablesSeminal Study 1
Yoo et al. [31]
Seminal Study 2
Hwang et al. [16]
PU
EU
SI
FCON
HM
PS
PI
PRR
PER
T
Table 9. Developed Hypotheses.
#VariablesHypothesis
1.Behavioral Intention and Use BehaviorH1: Behavioral intention has a positive effect on the use behavior of the DFD services by customers
2.Usefulness and Behavioral IntentionH2: Perceived usefulness has a positive effect on the behavioral intention of the DFD services by customers
3.Ease of Use and Behavioral IntentionH3: Perceived ease of use has a positive effect on the behavioral intention of the DFD services by customers
4.Social Influence and Behavioral IntentionH4: Social influence has a positive effect on the behavioral intention of the DFD services by customers
5.Facilitating conditions and Behavioral IntentionH5: Facilitating conditions have a positive effect on the behavioral intention of the DFD services by customers
6.Hedonic motivation and Behavioral IntentionH6: Hedonic motivation has a positive effect on the behavioral intention of the DFD services by customers
7.Price sensitivity and Behavioral IntentionH7: Price sensitivity has a negative effect on the behavioral intention of the DFD services by customers
8.Personal innovativeness and Behavioral IntentionH8: Personal innovativeness has a positive effect on the behavioral intention of the DFD services by customers
9.Privacy risk and Behavioral IntentionPrivacy risk has a negative effect on the behavioral intention of the DFD services by customers
10.Performance risk and Behavioral IntentionH10: Performance risk has a negative effect on the behavioral intention of the DFD services by customers
11.Trust and Behavioral IntentionH11: Trust has a positive effect on the behavioral intention of the DFD services by customers
Table 10. Interpretation of Mean Score Value (Siron & Tasripan, 2012).
Range of Mean Score ValueInterpretation of the Result
1–1.80Strongly Disagree
1.81–2.60Disagree
2.61–3.40Neutral
3.41–4.2Agree
4.21–5Strongly agree
Table 11. Source of Measurement.
VariablesNo. ItemsSource
UB3[57]
EU3[48]
SI3[41]
FCON4[41]
HM3[41]
PS5[48]
PI3[31]
PRR3[31]
PER3[31]
T3[42]
BI3[41]
PU4[58]
Table 12. Demographic Information of Respondents.
VariableCategoryFrequencyPercentage
AgeLess than 2511856.5%
25–355124.4%
36–452913.9%
More than 45 years115.3%
Total209100.0%
GenderMale11956.9%
Female9043.1%
Total209100.0%
EducationDiploma student104.8%
Bachelor student12760.8%
Master student2913.9%
Ph.D. student4320.6%
Total209100.0%
Frequency of use food delivery servicesDaily115.3%
Several times per week3818.2%
Once per week2210.5%
Several times per month5526.3%
Less often8339.7%
Total209100.0%
Heard about Drone Food Delivery servicesYes8540.7%
No12459.3%
Total209100.0%
Table 13. Reliability Analysis.
VariablesNo. of ItemsCronbach’s AlphaStatus
PU40.814Good
EU30.819Good
SI30.809Good
FCON40.808Good
HM30.816Good
PS50.814Good
PI30.807Good
PRR30.839Good
PER30.833Good
T30.814Good
BI30.812Good
UB30.806Good
Table 14. Pearson Correlation.
Pearson Correlation
123456789101112
PUEUSIFCHMPSPIPRRPERTBIUB
PU1
EU0.4831
SI0.3790.3781
FCON0.4440.4490.3941
HM0.3990.2170.2890.4501
PS0.2500.2310.3930.3040.3111
PI0.4110.3480.3910.4400.2620.4431
PRR−0.128−0.0070.1990.0310.0870.3500.1541
PER0.0940.0710.1350.2160.2440.2440.1710.5401
T0.2400.2700.4510.3340.2350.4370.4310.1040.0471
BI0.4170.2390.4770.3890.2750.3410.473−0.122−0.0440.4601
UB0.4810.4120.4410.4900.4050.3830.426−0.057−0.0040.4620.5741
Table 15. Regression analysis results.
ModelPathPredicted EffectUnstandardized Coefficientstp-ValueStatus
βStd. Error
D.V: BIPUPU→BI+0.3440.05260.6100.000supported
EUEU→BI+0.2710.07730.5340.001supported
SISI→BI+0.5170.0667.8110.000supported
FCONFCON→BI+0.3650.0606.0660.000supported
HMHM→BI+0.2650.0644.1160.000supported
PSPS→BI-0.2080.0405.2150.000supported
PIPI→BI+0.4690.0617.7220.000supported
PRRPRR→BI-−0.1150.065−1.7750.077rejected
PERPER→BI-−0.0420.065−0.6380.524rejected
TT→BI+0.5090.6870.4460.000supported
D.V: UBBIBI→UB+0.6970.045150.3570.000supported
Table 16. List of Recommendations.
FactorRecommendations
PUCustomers should know the perceived advantages of using DFD services and promote how this technology will enhance their job performance.
EUThe DFD services should be designed in an easy way and free of effort.
SIIn the early stage of adoption, marketing campaigns through media channels are highly recommended, such as television, newspapers, and the internet, to make people aware of this technology and make word-of-mouth effective. When the awareness of using DFD rapidly increase this will generate a high impact on individuals by influencing each other to use this new technology. Eventually this would have a tremendous effect on the adoption.
FCONDFD should be designed in a compatible way with other technologies that people have already been using (e.g., smartphone) and decision-makers are advised to post short videos explaining how and what do you need to use this service.
HMDFD system should be designed attractively to make customers feel more enjoyable through using this service. It is also recommended that customers can use their smartphones to track the order at any particular moment.
PSTechnology providers should focus more on developing DFD services regardless of paying attention to service fees. People are willing to pay more than they are paying for traditional methods to use this new technology.
PIFocus on spreading the technology among consumers who like to experience new technologies (e.g., young people) because they may have a higher intention to use drone food delivery services.
TDFD service providers are highly advised to meet customers’ high expectations towards the use of drones since the results showed that participants’ DFD service is trustworthy.
Publisher’s Note: MDPI stays neutral with regard to jurisdictional claims in published maps and institutional affiliations.

