1. Introduction
Industrial symbiosis has gained traction globally [
1] since the first working industrial symbiosis park in the world, Kalundborg in Denmark, which has been in operation since the 1970s [
2,
3,
4]. Sweden followed in these practices and has since developed a rich experience in industrial symbiosis, with multiple examples within the country, e.g., Sotenäs [
5,
6], Norrköping, Avesta, Enköping, Lidköping, and Helsingborg [
7]. Industrial symbiosis is an emerging concept within industrial ecology that focuses on matching two industries, which traditionally are separated although they are located close to each other, by exchanging energy or material [
3,
8]. The symbiosis concept describes how a network of diverse organizations can foster eco-innovation and long-term culture change, as well as create and share mutually profitable transactions by improving processes such as business and technical processes [
9]. Industrial symbiosis practices are context dependent, in that they depend on local environmental policies and political engagement on the issue to motivate and enable the matching of waste producers with waste users. On the other hand, barriers related to technical, social, intermediaries, and geographical dimension barriers may delay or impede such synergic linkages [
10]. Existing research proposes framework models as a tool to facilitate industrial symbiosis. For example, Henriques J. et al. [
10] suggest that framework models should focus on strategic investments, (e.g., promote regulatory instruments, promote incentives for industrial symbiosis) as, for example, the lack of profitability of some waste streams may discourage the reuse of a specific waste product. However, political barriers might occur as a high diversity of industrial activities—while beneficial in providing plural opportunities for synergies—may also limit communication between stakeholders [
9]. The town of Lidköping exemplifies industrial symbiosis practices in Sweden [
11]. In Lidköping, there are many farming activities producing considerable amounts of waste that are transformed into biogas. This biogas is used as fuel for local transportation services. In subarctic regions, there are synergic strategies as well. For example, in the city of Luleå—the provincial capital of the Norrbotten region in the north of Sweden—the sewage sludge from the wastewater treatment plant, together with residual products from the local milk industry, is used to create biogas for the municipal vehicle fleet [
12]. Furthermore, a combined heat and power plant in Luleå transforms SSAB steel industry excess gas into heat to feed the district heating network [
13]. Since 2011, when Facebook’s data center was the first larger data center to be located in Luleå, the data center sector has significantly grown but has not yet established synergies as an excess heat producer into the existing industrial symbiosis constellation within the municipality.
During the last years, the data center (DC) industry has been increasingly in focus, as they have had a high impact on the locations in which they are established (e.g., job creation, high electricity consumption, release of excess heat, etc.). The subarctic part of Europe has become a favorable location for DC establishments such as Facebook, Google, and Microsoft due to the beneficial climate that permits free air cooling, a stable power grid with a large share of renewable energy at a low cost, and acceptable latency time to the large internet exchange hubs [
14]. Currently, the installed DC power in the north of Sweden constitutes 200 MW, and there are several ongoing establishments in the process that would strengthen the region’s identity as a leading DC industrial arena.
The renewable energy mix in Sweden consists mainly of 28.2% hydropower, 8.7% wind power, 62.8% biofuels, and 0.3% solar power [
15]. Despite the challenging subarctic climate, current research and development of wind power and photovoltaic power green technologies, e.g., [
16], will slowly make their supply share increase. This can increase the region’s energy systems’ resiliency and ensure favorable future conditions to attract high electricity demand sectors, such as the DC sector, through the global energy transition.
Sweden can be considered to be at the forefront of information and communication technology (ICT), with many large international IT companies choosing to establish themselves in the country, leading to a growing number of large DC establishments. The development of ICT is among the fastest growing lines of business today, representing 2% of the world’s total electricity demand, and a prediction is expected to be in the range of 8–21% by 2030 [
17]. In light of the COVID-19 pandemic, ICT has become an ever more dominant and essential part of everyday lives, as society has shifted commonplace physical practices to the online realm, onto digital services and platforms [
18]. This is propelled by increased distance learning and communication, as recommended in most schools and offices, and the increased demand for online consumption services (e.g., retail, food and beverage, etc.). This has accelerated the process of global digitization and increased the load on communication platforms and online services, thereby resulting in the generation of even more excess heat that is released into the environment.
Thus far, the main objectives for DC energy research have been to optimize thermal management by finding more efficient cooling strategies, which would result in an increased power usage efficiency by reducing the demand for chiller work and facility electricity [
14,
19,
20,
21,
22,
23,
24]. A number of papers expand on DC excess heat implementation: absorption refrigeration, organic Rankine cycles, desalination, clean water production, piezoelectric, thermoelectric, space heating, swimming pools, biomass, power plant co-location, and district heating or hot water production [
25,
26,
27,
28,
29,
30], where high potential is found for upgrading the DC low-grade temperature excess heat as a district heating source by using heat pumps [
31,
32,
33,
34,
35,
36].
The DC sector has shown increasing interest towards sustainable practices and the circular economy, for example, by reducing the carbon footprint of IT hardware through reusing or recycling components of servers [
37] and, in the last decade, contributing to industrial symbiosis possibilities via excess heat use. This paper aims to elucidate on how sustainability efforts in industrial symbiosis may couple two seemingly distant industries for mutual gain: excess heat from DCs to heat subarctic greenhouses (GHs) to increase local food production. It has been shown that a 1 MW DC is economically beneficial for heating a 10,000 m
2 greenhouse with an additional peak boiler, which would increase the self-sufficiency in the north of Sweden by 8% [
38,
39]. While there is existing literature on technical examples regarding DC-heated GHs [
38,
39,
40], these examples are not within subarctic regions [
38,
40] or are less focused on non-technical challenges [
39].
GH farming in northern latitudes suffers from the challenge of both low temperatures and scarce sunlight in the wintertime. Investigations into the energy demand for the heating and lighting of greenhouses are often focusing on moderate latitudes around 50–55° N [
41,
42] and not on 60–70° N, which constitutes the north of Sweden. However, the calculations in [
43] show that the energy demand of a GH in northern Sweden (Kiruna, at 67° N), while roughly double compared to GHs in more southern locations (exemplified by Amsterdam and Abu Dhabi), is still lower than the energy demand of plant factories illuminated by LEDs. Moreover, as more than half of the energy demand comes from heating, using excess heat could potentially make GH farming in the north of Sweden competitive.
Since Sweden’s entry into the EU in the 1990s, domestic food production has continuously decreased. In the following decades, the degree of self-sufficiency has decreased by over 30% [
44]. To reverse this trend, the government established a food strategy for Sweden in 2016, aiming to create jobs and reduce the industry’s climate footprint by realizing more sustainable food production [
45]. Through industrial symbiosis, the coupling of DCs and GHs to utilize excess heat for horticulture farming would not only lead to a circular model of resource use within the DC industry but also increase local food production in more sustainable ways, thereby increasing local economic competitiveness. With the creation of new and emerging work roles (e.g., urban farmers) and collaborations that had not previously existed comes the possibility to strengthen the degree of self-sufficiency and employment throughout the region [
46]. Cumulatively, this would offer local communities in the north alternative ways of life that may be beneficial in vulnerable contexts, such as during the ongoing world COVID-19 pandemic.
One of the key features of industrial symbiosis is to have a diverse stakeholder network with mutual understanding between different sectors and industries to achieve innovation [
9]. Here, in the north of Sweden, lies a favorable context where there are industries such as GH horticulture farming in need of heat and industries such as the DC sector with excess heat to provide. The questions we consequently put forth are: Why has this industrial symbiosis not yet emerged between DCs and GHs? What are the challenges hindering such a symbiosis, and what are potential offerings for implementing it? This paper aims, firstly, at displaying challenges and opportunities from relevant stakeholder perspectives regarding DC–GH symbiosis and, secondly, suggesting future DC–GH scenarios and implementations to embrace stakeholder collaboration in furthering industrial symbiosis in the subarctic.
2. Method Workflow
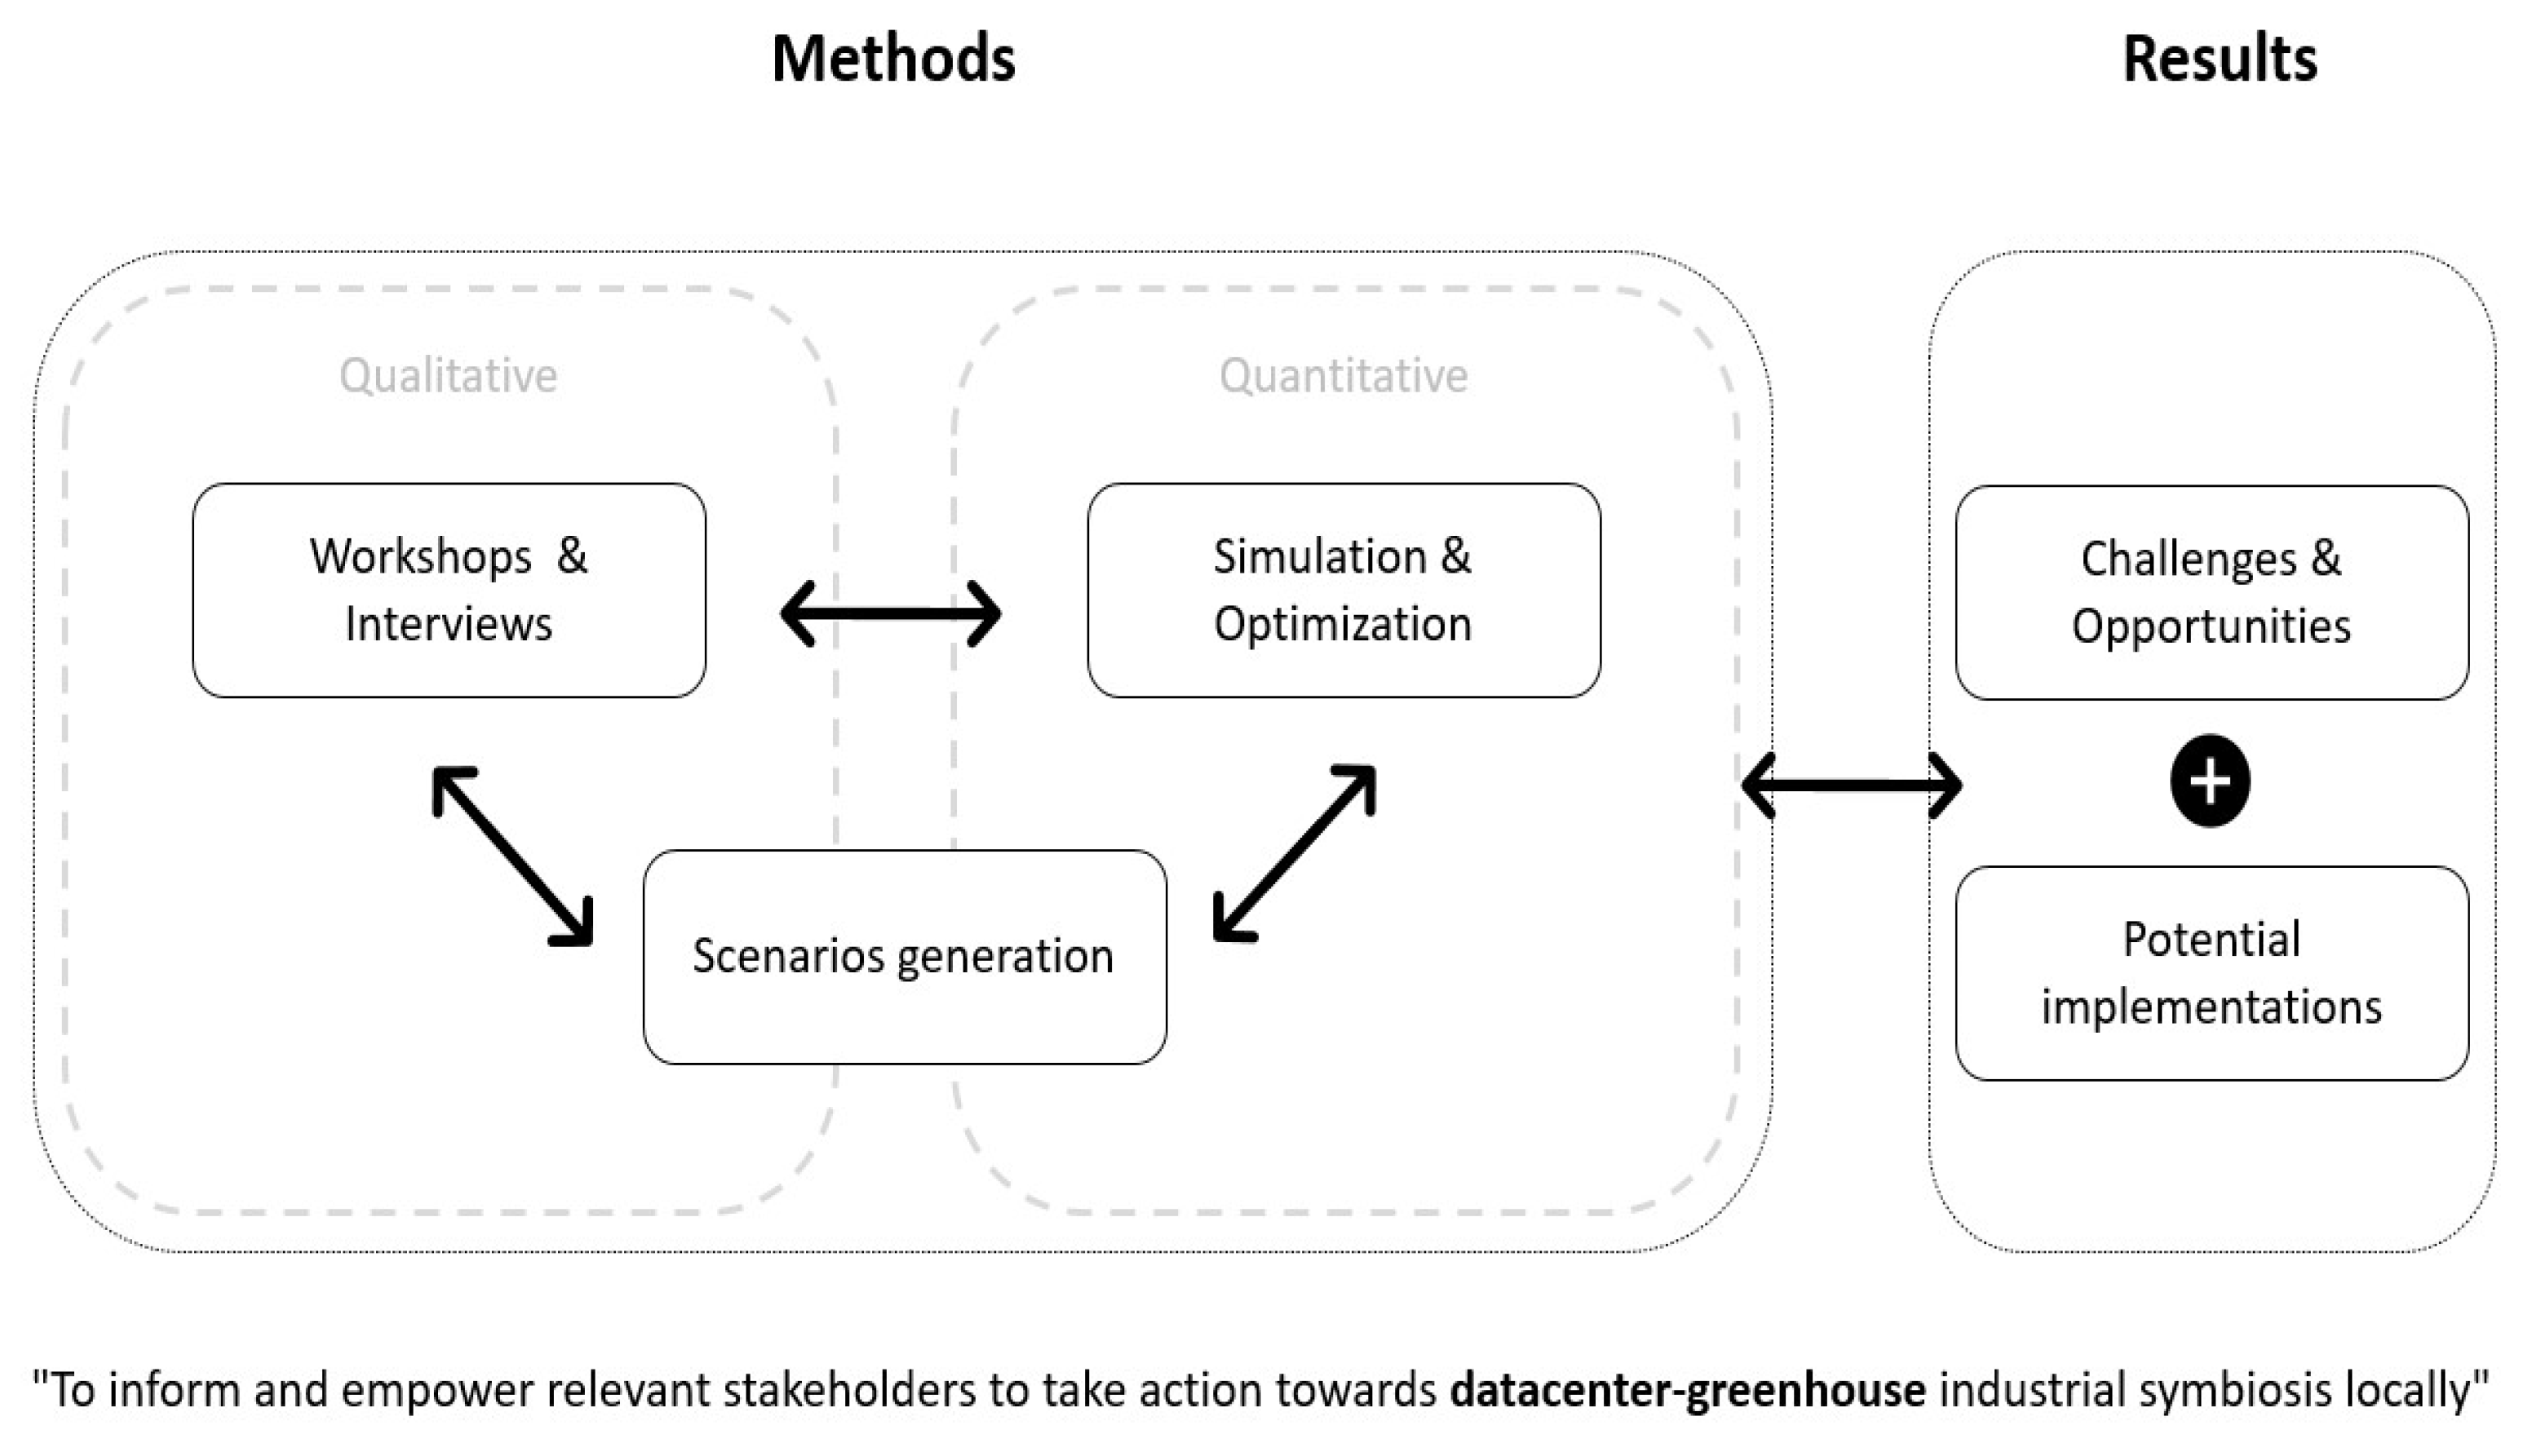
The methods utilized within this paper are multi-faceted in nature; qualitative methods, such as interviews and workshops, were conducted to gather information on the socio-economic aspects of the study, while quantitative methods, such as simulations and optimizations, were conducted to gather information on technical aspects of the study. In the following paragraphs, an overview of the methods is explained.
Figure 1 overviews the methods’ workflow, where different methods and their results synergistically feed into an iterative method cycle. The cycle begins with gaining qualitative bottom-up data from the situated context through workshops and interviews. This need-finding stage aims to uncover challenges and opportunities within the local context with the stakeholders involved in the industrial symbiosis design. The outcome of this stage feeds into simulations and optimizations, which then explore and clarify delimitations and technical potentialities for DC–GH symbiosis. The results then feed into the next stage, which is the design of different scenarios of DC–GH implementations in context. These scenarios serve as a medium for further exchanges between the research group and wider society. This occurs in two ways specifically: (1) as communication material on which further dialogue, engagement, and empowerment of relevant stakeholders can occur, thus promoting local and proactive change; (2) the knowledge created from the different scenarios then feeds into further workshops and interviews in order to refine the problem and solution space. The overall results of the method workflow are an understanding of the challenges and opportunities of DC–GH implementations, as well as solutions for potential implementations.
2.1. Workshops and Interviews
The purpose of this section is to explain how the workshops and interviews were conducted, their purpose, how their data were collected, how the data were processed, and how the data contribute to consequent iterations of the method workflow.
2.1.1. Workshops
Workshops provide opportunities for research-generated data [
47]. This is due to their abilities to capture particular social realities in context and to view the research topic within a wider network of stakeholders and issues [
48]. Three workshops have been carried out with different constellations of DC and GH stakeholders, with each workshop conducted for a specific purpose (
Table 1).
The stakeholder groups were identified through a combination of both constructive [
50] and reconstructive stakeholder identification methods [
51] to avoid an overtly top-down prescription of restrictive boundaries on who is included and who is omitted. This allowed for a balanced study of what is considered an “information-rich” phenomenon [
52]. Workshops 1 and 2 took a mainly constructive perspective on stakeholder identification via Eden and Ackermann’s [
50] four categorizations: Key Players, Context Setters, Subjects, and Crowd, while Workshop 3 took a mainly reconstructive method as proposed by Reed [
51].
“Key Players” are considered stakeholders who should be actively looped in the process because they have high interest in and influence over the phenomenon. “Context Setters” are highly influential but have little interest. They, however, play an important role in the formation of the phenomenon and should be included as much as possible in the process. “Subjects” have high interest but low influence. While they are supportive (by definition), they lack the capacity for impact. Through synergies, however, they may become influential. The “Crowd” are stakeholders who have little interest in or influence over desired outcomes.
As shown in
Table 1, empirical data were collected through semi-structured, short interviews with the participants [
53], several prototyping group exercises, photographs, film recordings, as well as researchers’ field notes based on observations throughout the workshop. Each group discussion was mediated by several facilitating researchers that guided the activity and discussion.
Workshop 1 was held at Luleå University of Technology in the spring of 2019 in Luleå. The workshop saw an attendance of approximately 25 individuals, representing different organizations from around the region: small business owners, small- and large-scale food producers, restaurant owners, chefs, DC owners and engineers, hobby farmers, representatives from political initiatives in the region, students, and researchers. These stakeholder groups were considered “Key Players” to the DC–GH symbiosis [
50]. The workshop began with four lectures by experts, followed by a group activity: a SWOT analysis of potential DC–GH synergies. In this activity, stakeholders were placed in mixed groups. A large worksheet was provided to the groups, where they had to first learn each other’s expertise and experiences and then collaboratively propose strengths, weaknesses, opportunities, and threats of a DC–GH symbiosis. The workshop was filmed as part of the research delivery and to make the co-created knowledge accessible to a wider audience (these stakeholders were considered under the categorizations “Subjects” and “Crowd” [
50]).
The second workshop was held at Luleå University of Technology in the autumn of 2019, with a broad range of stakeholders such as young farmers, researchers, DC engineers, business owners, state representatives, grassroots organizations, and union advisors. These stakeholder groups were also considered “Key Players” to the DC–GH symbiosis [
50]. The total number of attendees was 20. The workshop began with two site visits, one to a nearby DC and another to a municipal greenhouse farm, followed by an expert lecture and then concluded with a collaborative and speculative design activity inspired by Dunne and Raby [
54]. The activity entailed a probing worksheet that motivated participants to brainstorm and describe their future ideal DC–GH scenarios. This was followed by a sketching exercise where participants were motivated to visualize their ideal utopian scenarios by sketching on clear, laminate folders placed over photographs of an example DC space. As with the first workshop, the second workshop was also video recorded and produced into a short film to garner public interest and involvement in the project.
Due to the circumstances provided by the onset of COVID-19, the third workshop was held digitally through Zoom in the spring of 2020. The workshop targeted urban planners, business developers, and political decision makers within the region, with a total attendance of 15 participants. Two activities were held for these stakeholders to characterize themselves reconstructively in a DC–GH symbiosis [
50]:
First was a visual mapping exercise of the ecosystem services around Facebook’s DC in Luleå. This was considered a prime and critical case study due to Facebook’s close proximity to the Gammelstadsviken Nature Reserve, which had brought out several debates, discussions, and local friction on the issue. This activity utilized a tool called ESTER sourced from Boverket [
55].
Second, an assessment activity on stakeholder power, interest, and function was conducted. Inspired by Reed [
56], the activity is a bottom-up and reconstructive method in which stakeholders themselves define their power, interest, and function regarding a DC–GH symbiosis, based upon perceptions they have of their roles within the system.
2.1.2. Interviews
Interviews were conducted with different food stakeholders in the north of Sweden. The motivation for conducting interviews was to follow the import and export journeys of food nationally and thereby understand the opportunities and challenges associated with these journeys. As with the workshops, interviewees were identified through a combination of both constructive and reconstructive manners. A total of 15 interviewees were interviewed. The first five interviews were conducted through prior stakeholder identification by the research group (i.e., constructively). The next ten interviews were conducted during the process of the workshops, after learning more about the phenomenon (i.e., reconstructively). All interviews followed Flick’s [
53] guide to semi-structured interviews. During each interview, between five and ten questions were asked, and an interview guide was created prior to each interview to provide conversation prompts [
53]. Each interview guide differs from another, to suit the context of each interviewee. However, the underlying purposes behind the questions were consistent:
To understand the interviewee’s scope of operation within the current food or DC network (from their own perspective).
To understand their interest in new roles within a DC–GH network.
To understand how they might carry out these new roles.
To receive any advice or recommendations.
The interviewees consisted of a large food producer, a large national food supplier, three local restaurants, two researchers, three leaders within two different political initiatives, and five urban farmers. The verbal data collected from the interviews were transcribed into text and analyzed via thematic analysis [
49]. Explicit consent was sought during interview sessions, keeping in line with GDPR regulations.
2.2. Simulation and Optimization
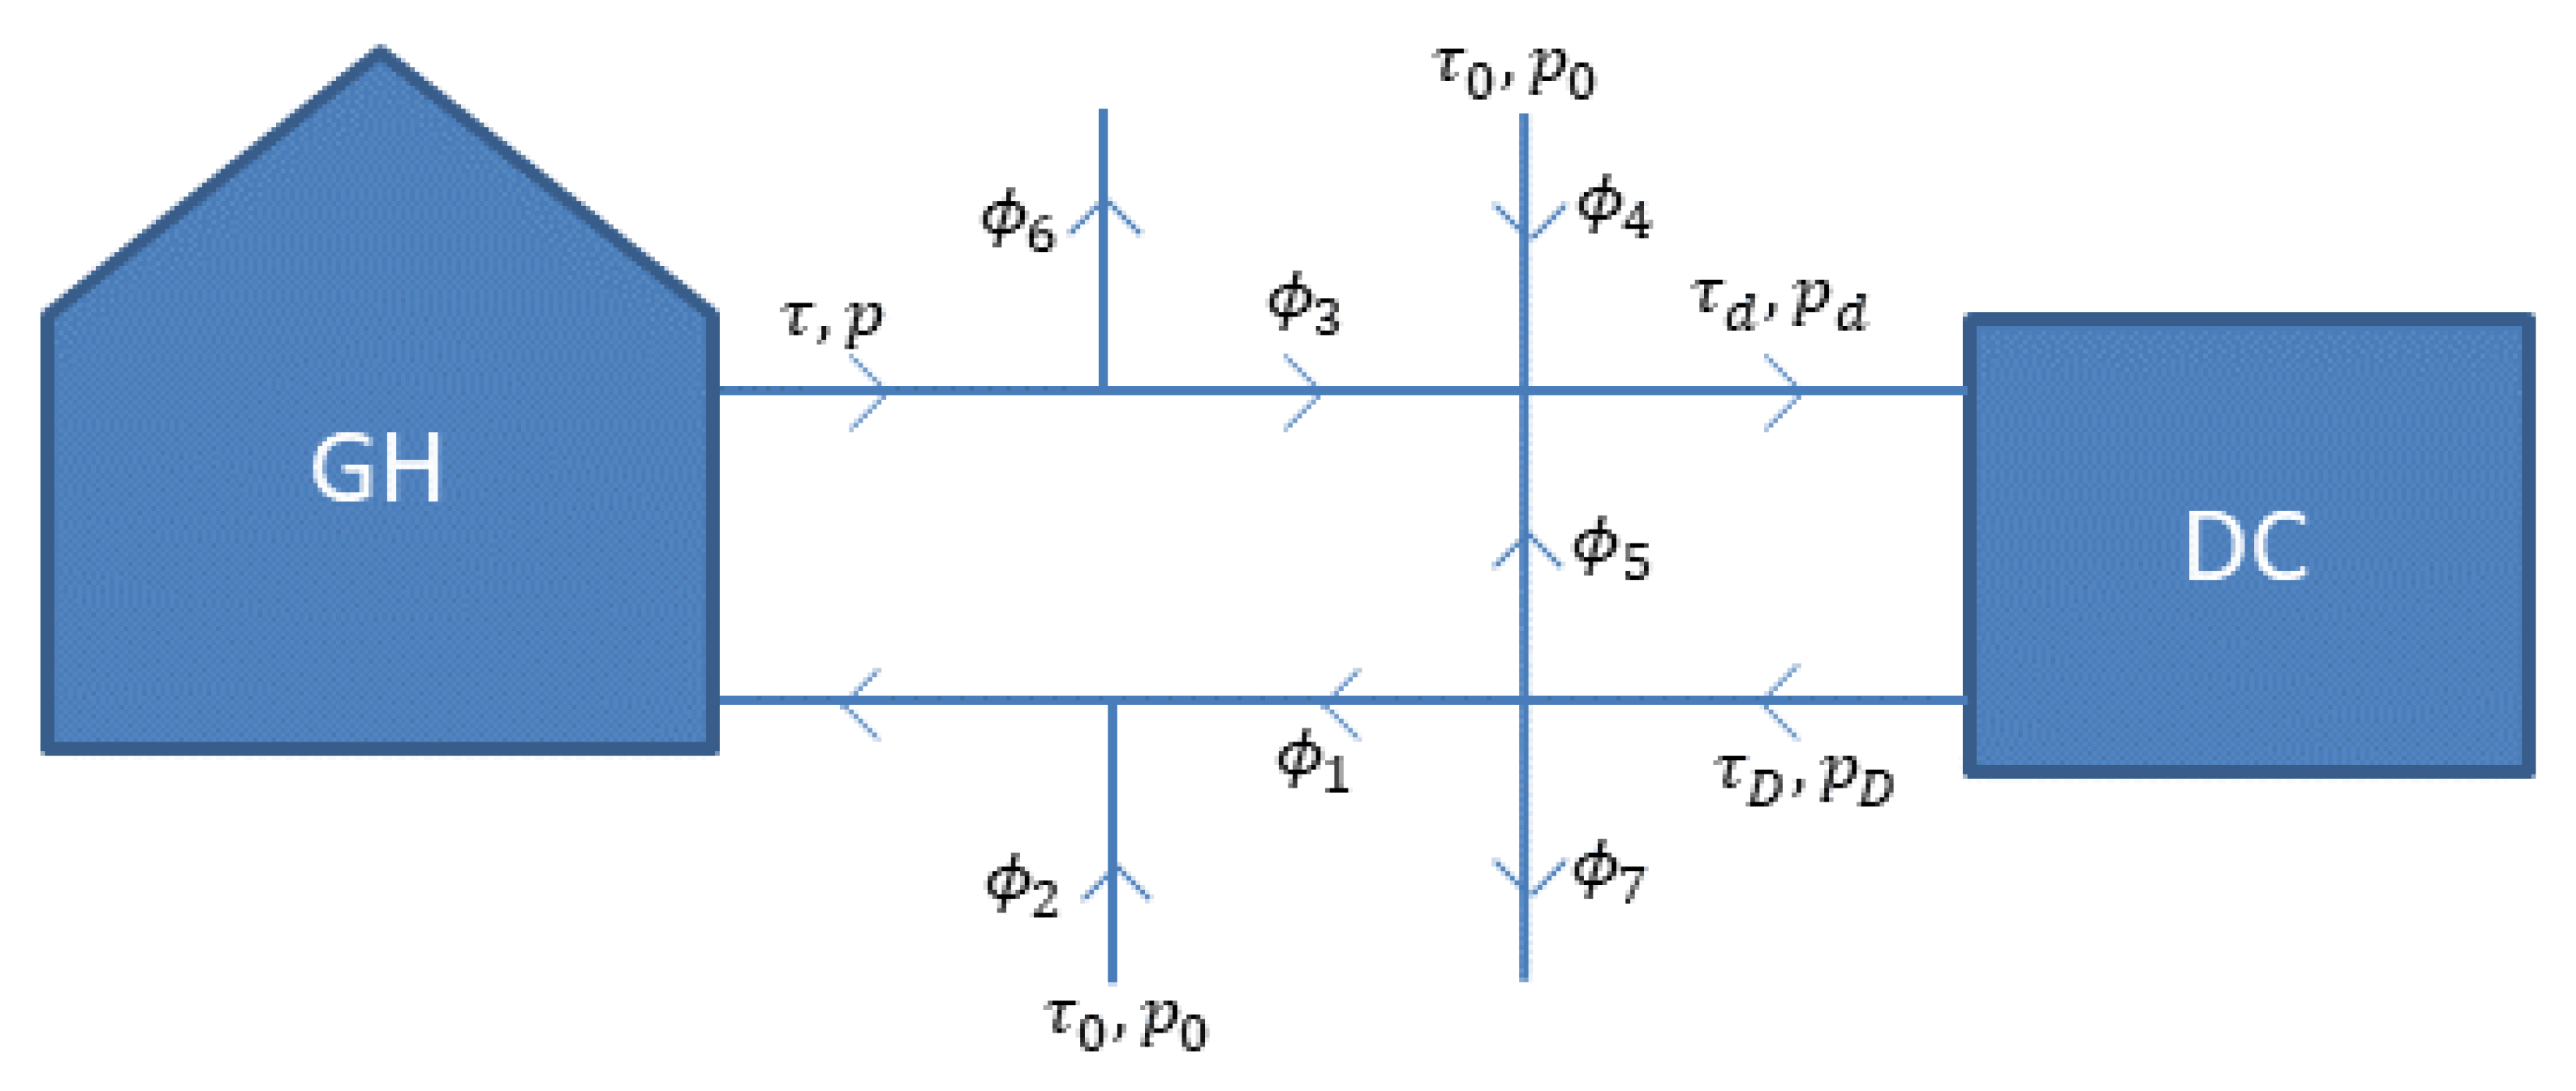
As mentioned in the introduction, there lies several technical barriers that hinder the implementation of a DC and GH symbiosis. The main challenge when using DC excess heat is its low temperature. A possible remedy is to raise the temperature using a heat pump, which greatly broadens the applicability of the heat. Here, we instead propose to use the DC air directly in the GH to avoid the heat pump, which is costly both in terms of investment and operation. However, the air taken directly from the DC may be very dry when the outdoor air is cold. Thus, we face a challenge of maintaining favorable humidity conditions in the GH. A possible remedy is to transfer the heat from DC to GH via a heat exchanger so that the humid GH air can be retained. To avoid the costly heat exchanger, we instead propose to reuse the GH air in the DC. This has the additional advantage that the cooling air entering the DC is humidified, which is normally necessary to avoid static electricity. Hence, we propose the setup in
Figure 2. A hot dry air flow
from the DC goes into the GH along the bottom line, combined with a fresh air flow
. The air leaving the GH is likely very humid and is partly discarded (outflow
, left), but some of it
) is reused in the DC in combination with the inflow
(right) to maintain an appropriate humidity level in the DC inflow. The air exiting the DC is split into
(going to the GH),
that is recycled within the DC, and
that is discarded. Note that, to simplify the equations later, flows
are normalized with respect to the GH floor area
while
are normalized with respect to the DC power
. The ratio of DC power over GH floor area is denoted
κ =
Q/A.
2.2.1. Modeling
For the symbiotic setup in
Figure 2, we will describe a dynamic model for the temperature and humidity in the GH and at the inlet of the DC and how they depend on GH building parameters and external variables such as solar irradiance and outdoor temperature. The model consists of two parts, of which the GH part is the widely used and validated model from [
57], albeit simplified and reformulated in some respects. The DC part of the model is based on the assumption that the DC acts as a heat source that instantaneously adds the DC input power
in the form of heat to the incoming air. In addition to the GH and DC part, there are also equations modeling the connection ducting between them. Here, we assume that the DC and GH are located adjacent to each other so that we can neglect any moisture or heat loss. These simplifying assumptions, neglecting losses in the DC and the DC–GH connections, are straightforward to replace with, e.g., assumptions on heat losses proportional to the difference to the outdoor temperature. In the modeling, we will assume perfect mixing and steady-state conditions in both the GH and DC, as the air flows required to maintain adequate temperatures in the GH will be sufficient to replace the air volumes in a matter of minutes. The model equations are provided along with motivations in
Appendix A. Constraints on the GH indoor climate and DC inflow, in terms of temperature and humidity, are formulated in
Appendix B.
2.2.2. Optimization of GH Area and Calculation of Air Flows
In the workflow of developing a symbiotic GH–DC facility, as outlined in
Figure 2, it is vital to know the limiting GH area that a given DC facility can support. Moreover, for designing the ducting connections when generating the scenarios, it is also necessary to know the magnitude of the air flows.
We will now use the GH and DC models described in
Appendix A to find the maximum GH area that can be heated under the constraints in
Appendix B. To accomplish this, we formulate the following optimization problem for which the solution is the minimum DC power per GH area that is required to satisfy the constraints:
This optimization problem is nonlinear and hence we cannot a priori assume that the global optimum is attained and that it can be solved with a reasonable computational effort. Here, we will demonstrate the viability of the method by an example calculation using the function fmincon in the MATLAB software. We assume that the DC outflow temperature is
which is normal for traditional CPU server equipment.(Mining equipment usually has higher outflow temperatures and power density than the traditional equipment). The thermal transmittance per floor area is
, which is consistent with a
polycarbonate cover (thermal transmittance
) and
cover area per unit floor area. GH climate constraints are assumed to be
and
(we assume that the limiting case in terms of capacity is nighttime. During daytime, we will have either sunlight (except during mid-winter) or artificial light or no light. If there is light, this will contribute to the heating, and if there is no light, then the plants will benefit from the colder nighttime temperatures). For outdoor climate data, we have used measurements of temperature, humidity, and sunlight during the two first months of 2019 for the city of Luleå and the evapotranspiration parameters are [
58]
and
.
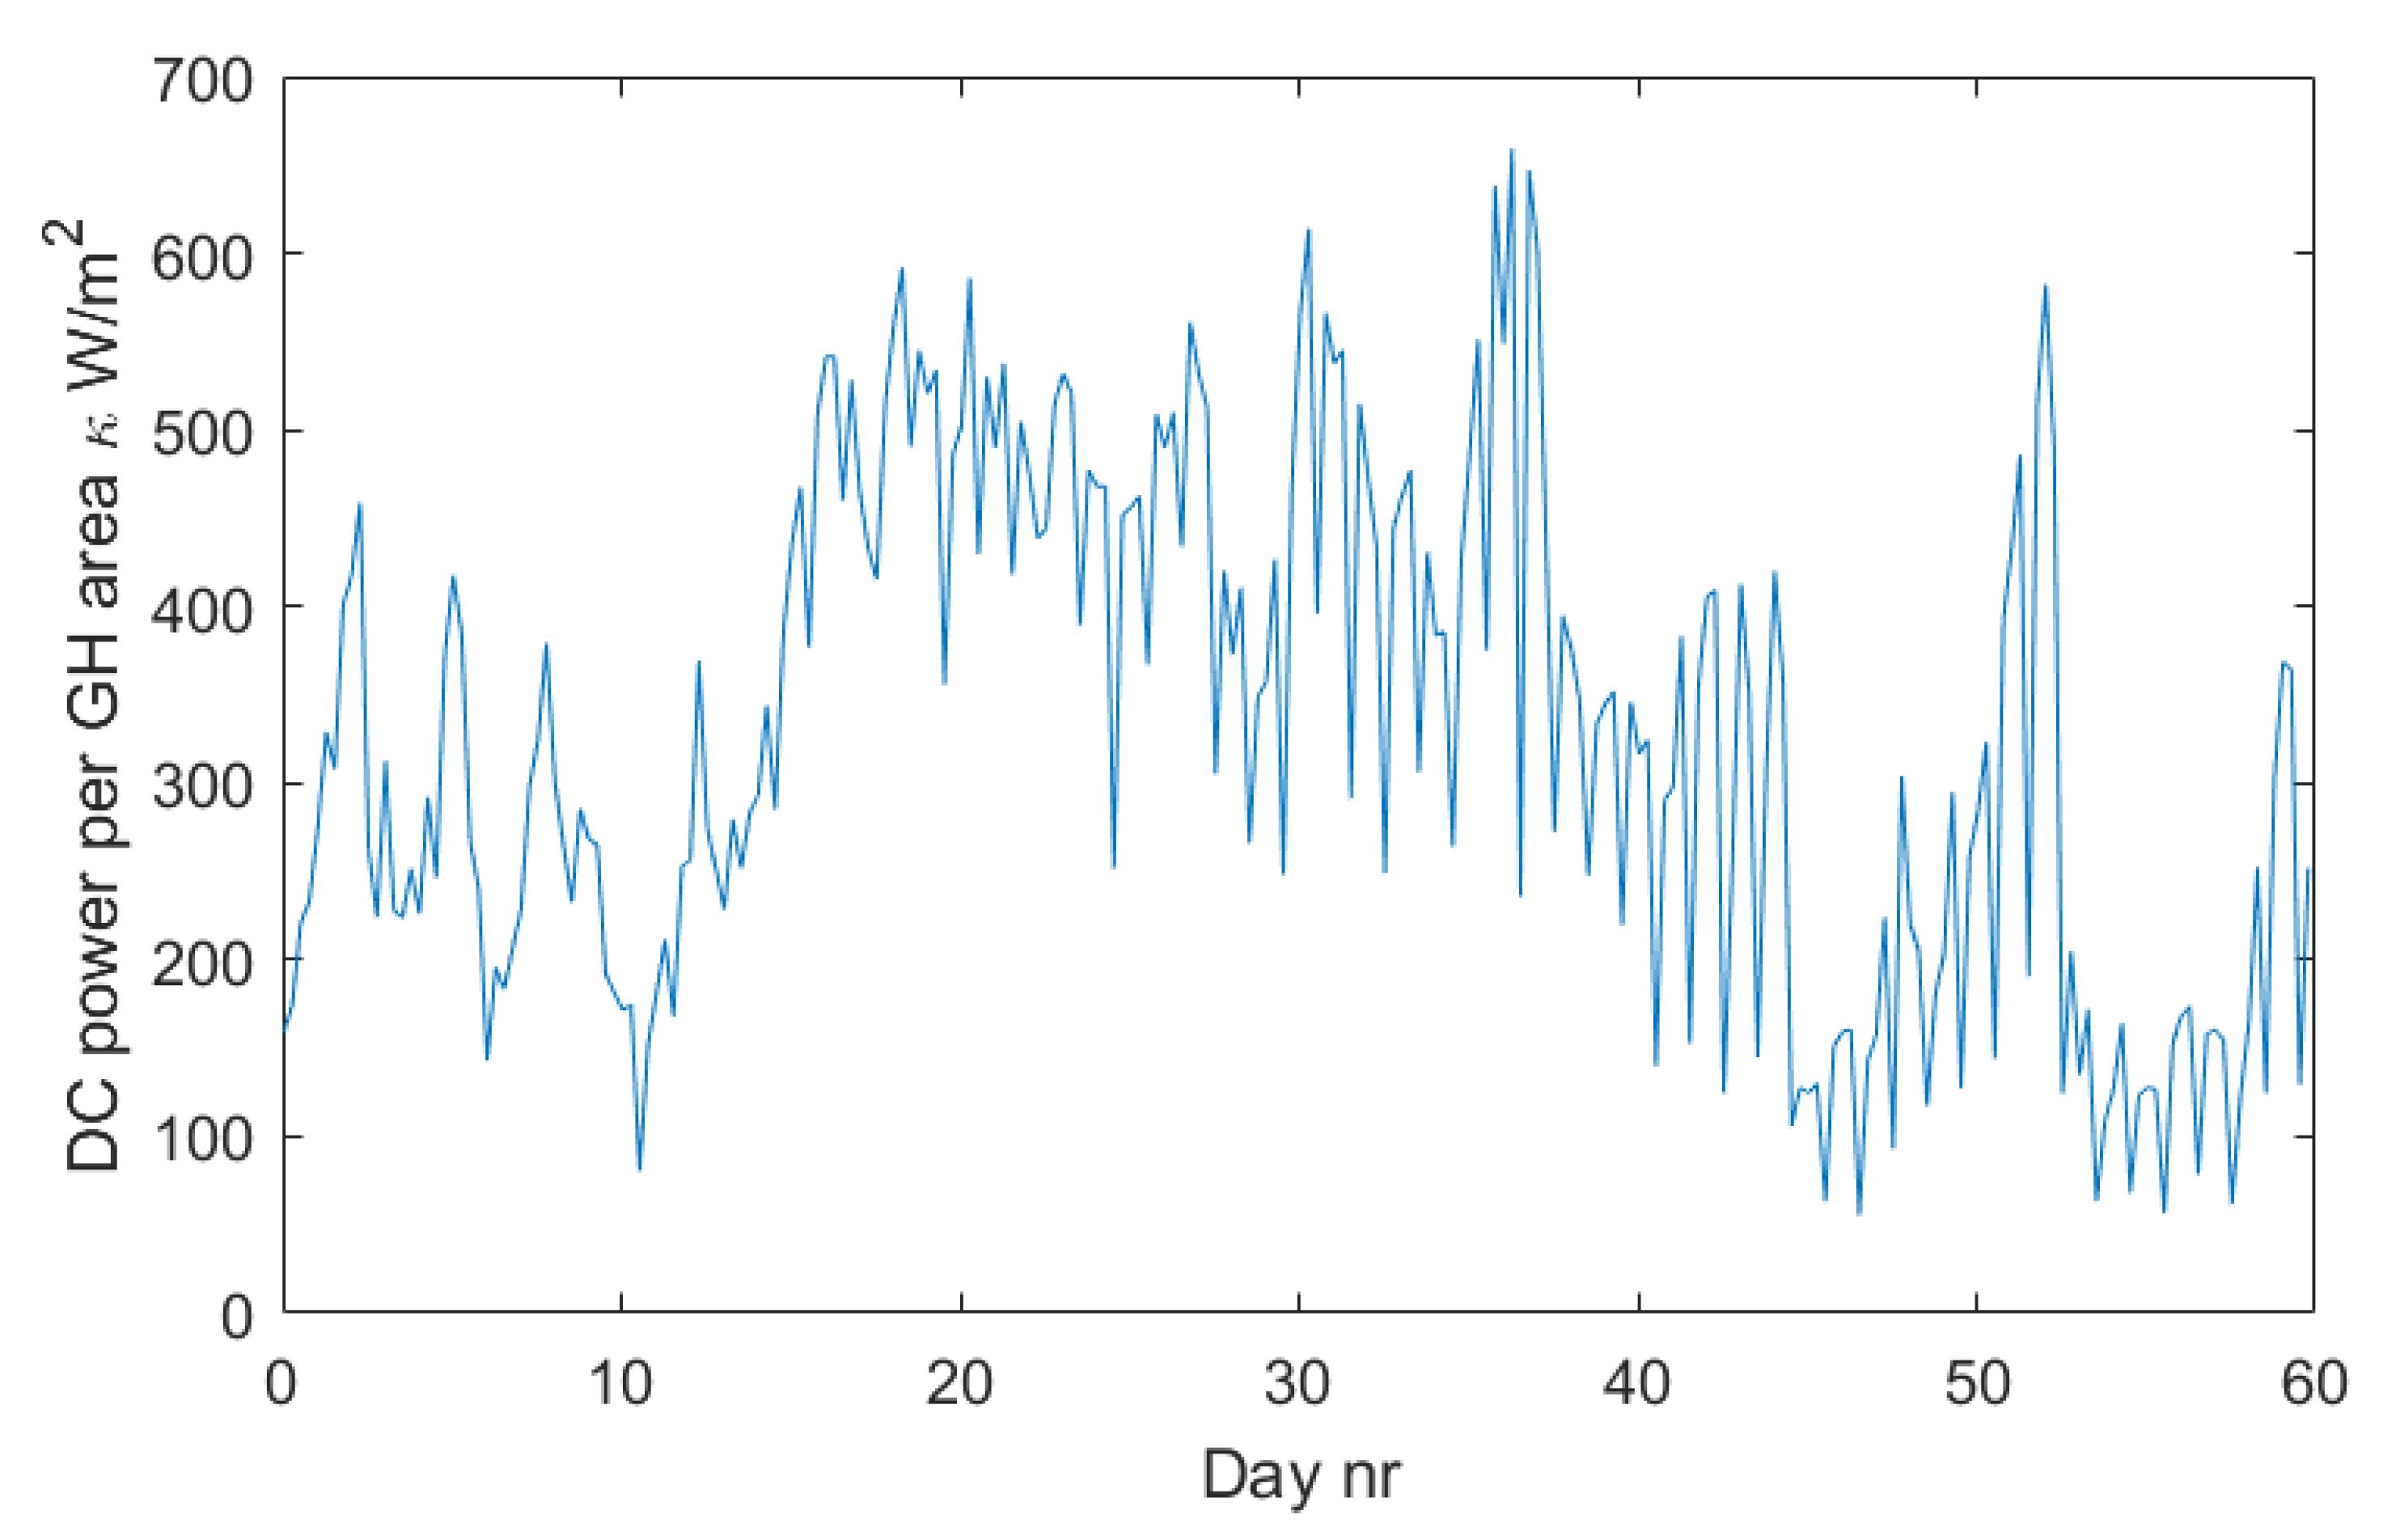
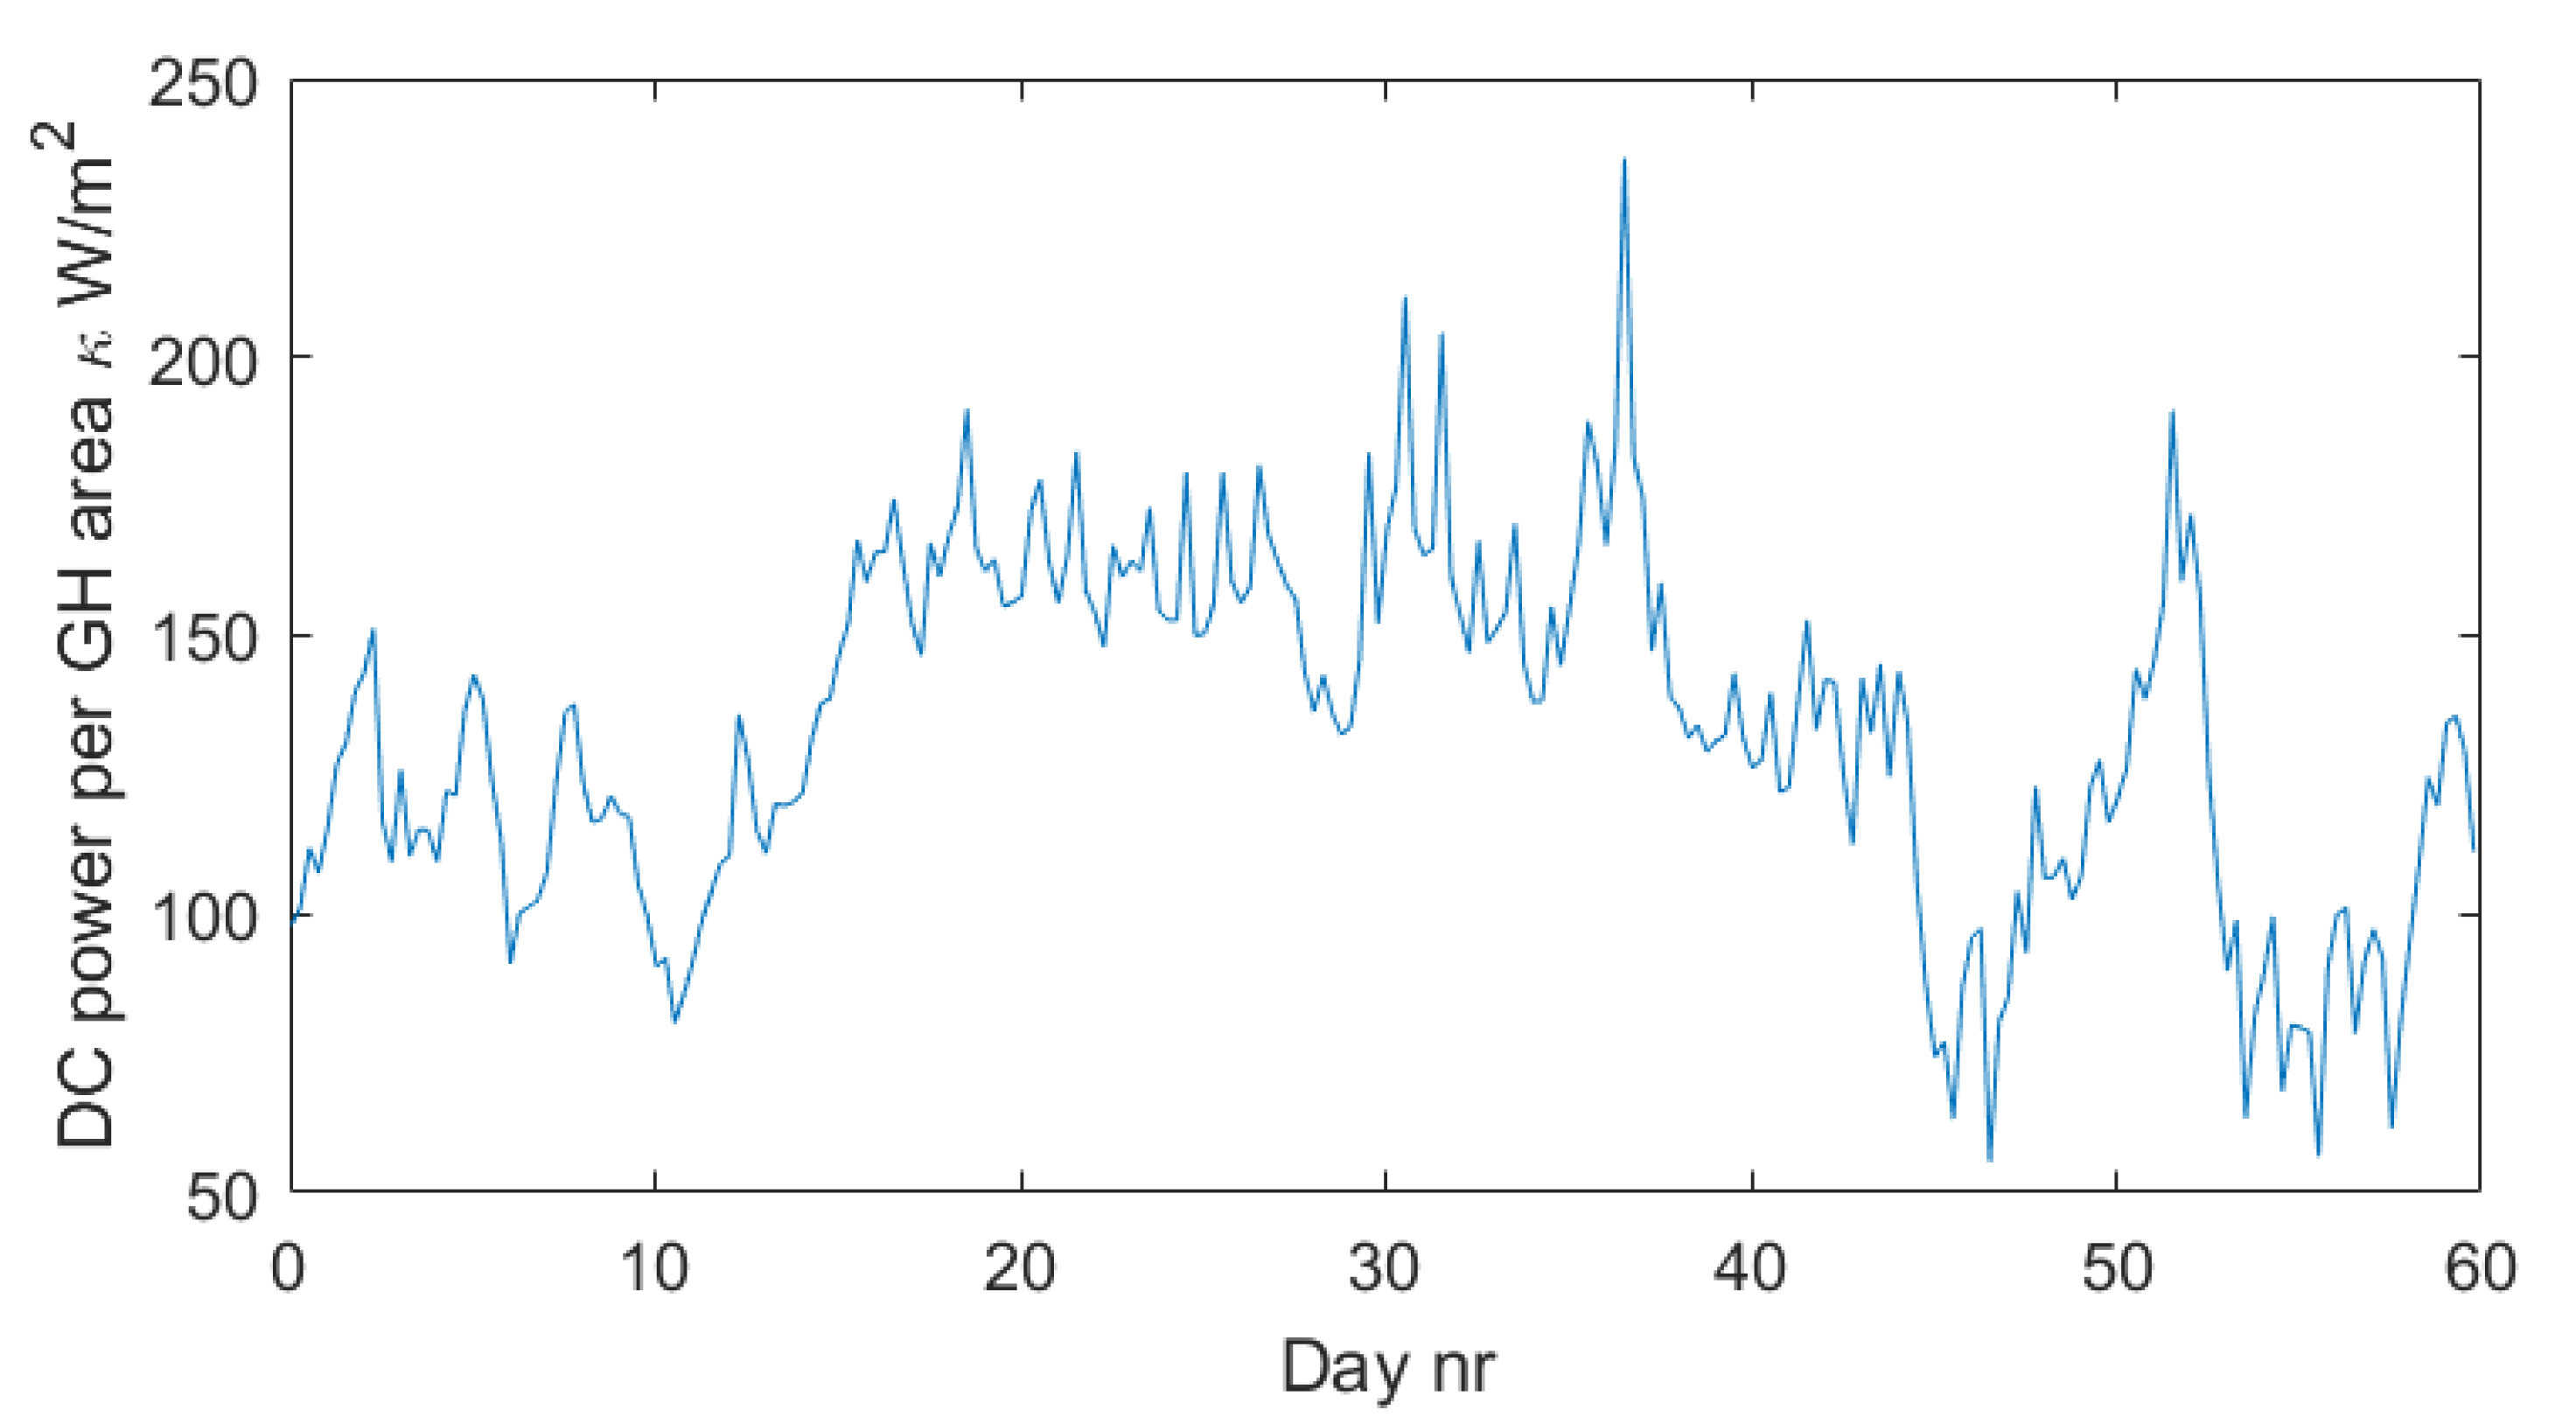
First, we consider the case of no reflow from GH to DC, i.e., setting
, which, according to (A2a), results in
.
Figure 3 shows the solution of the optimization problem above for every 6 h during the first 2 months of 2019. We can see that the limiting case is at around day 36, where approximately
is required, which indicates the possibility to heat 1000/659 = 1.52
of GH area per kW of DC power. However, the conditions in both the DC and GH will be very dry (for mining equipment, the higher DC outflow temperatures
will improve the results, both in terms of lower ratio
and lower air flows resulting in higher GH humidity). To remedy this, we will examine the potential of recirculating some of the GH air back into the DC by relaxing the condition
. Solving the optimization problem above now gives the result in
Figure 4. We can see that the limiting case is once again at around day 36, where approximately
is required, implying that approximately 4.24
GH area can be heated per kW of DC power, which is almost 3 times the capacity without GH air reflow.
In order to choose the flows
so that the proper conditions in both GH and DC are achieved, we now fix
(here we choose the maximum possible value
) and solve the optimization problem
For some optimality condition
. Here, we have chosen
, which will serve to keep temperature down and humidity up.
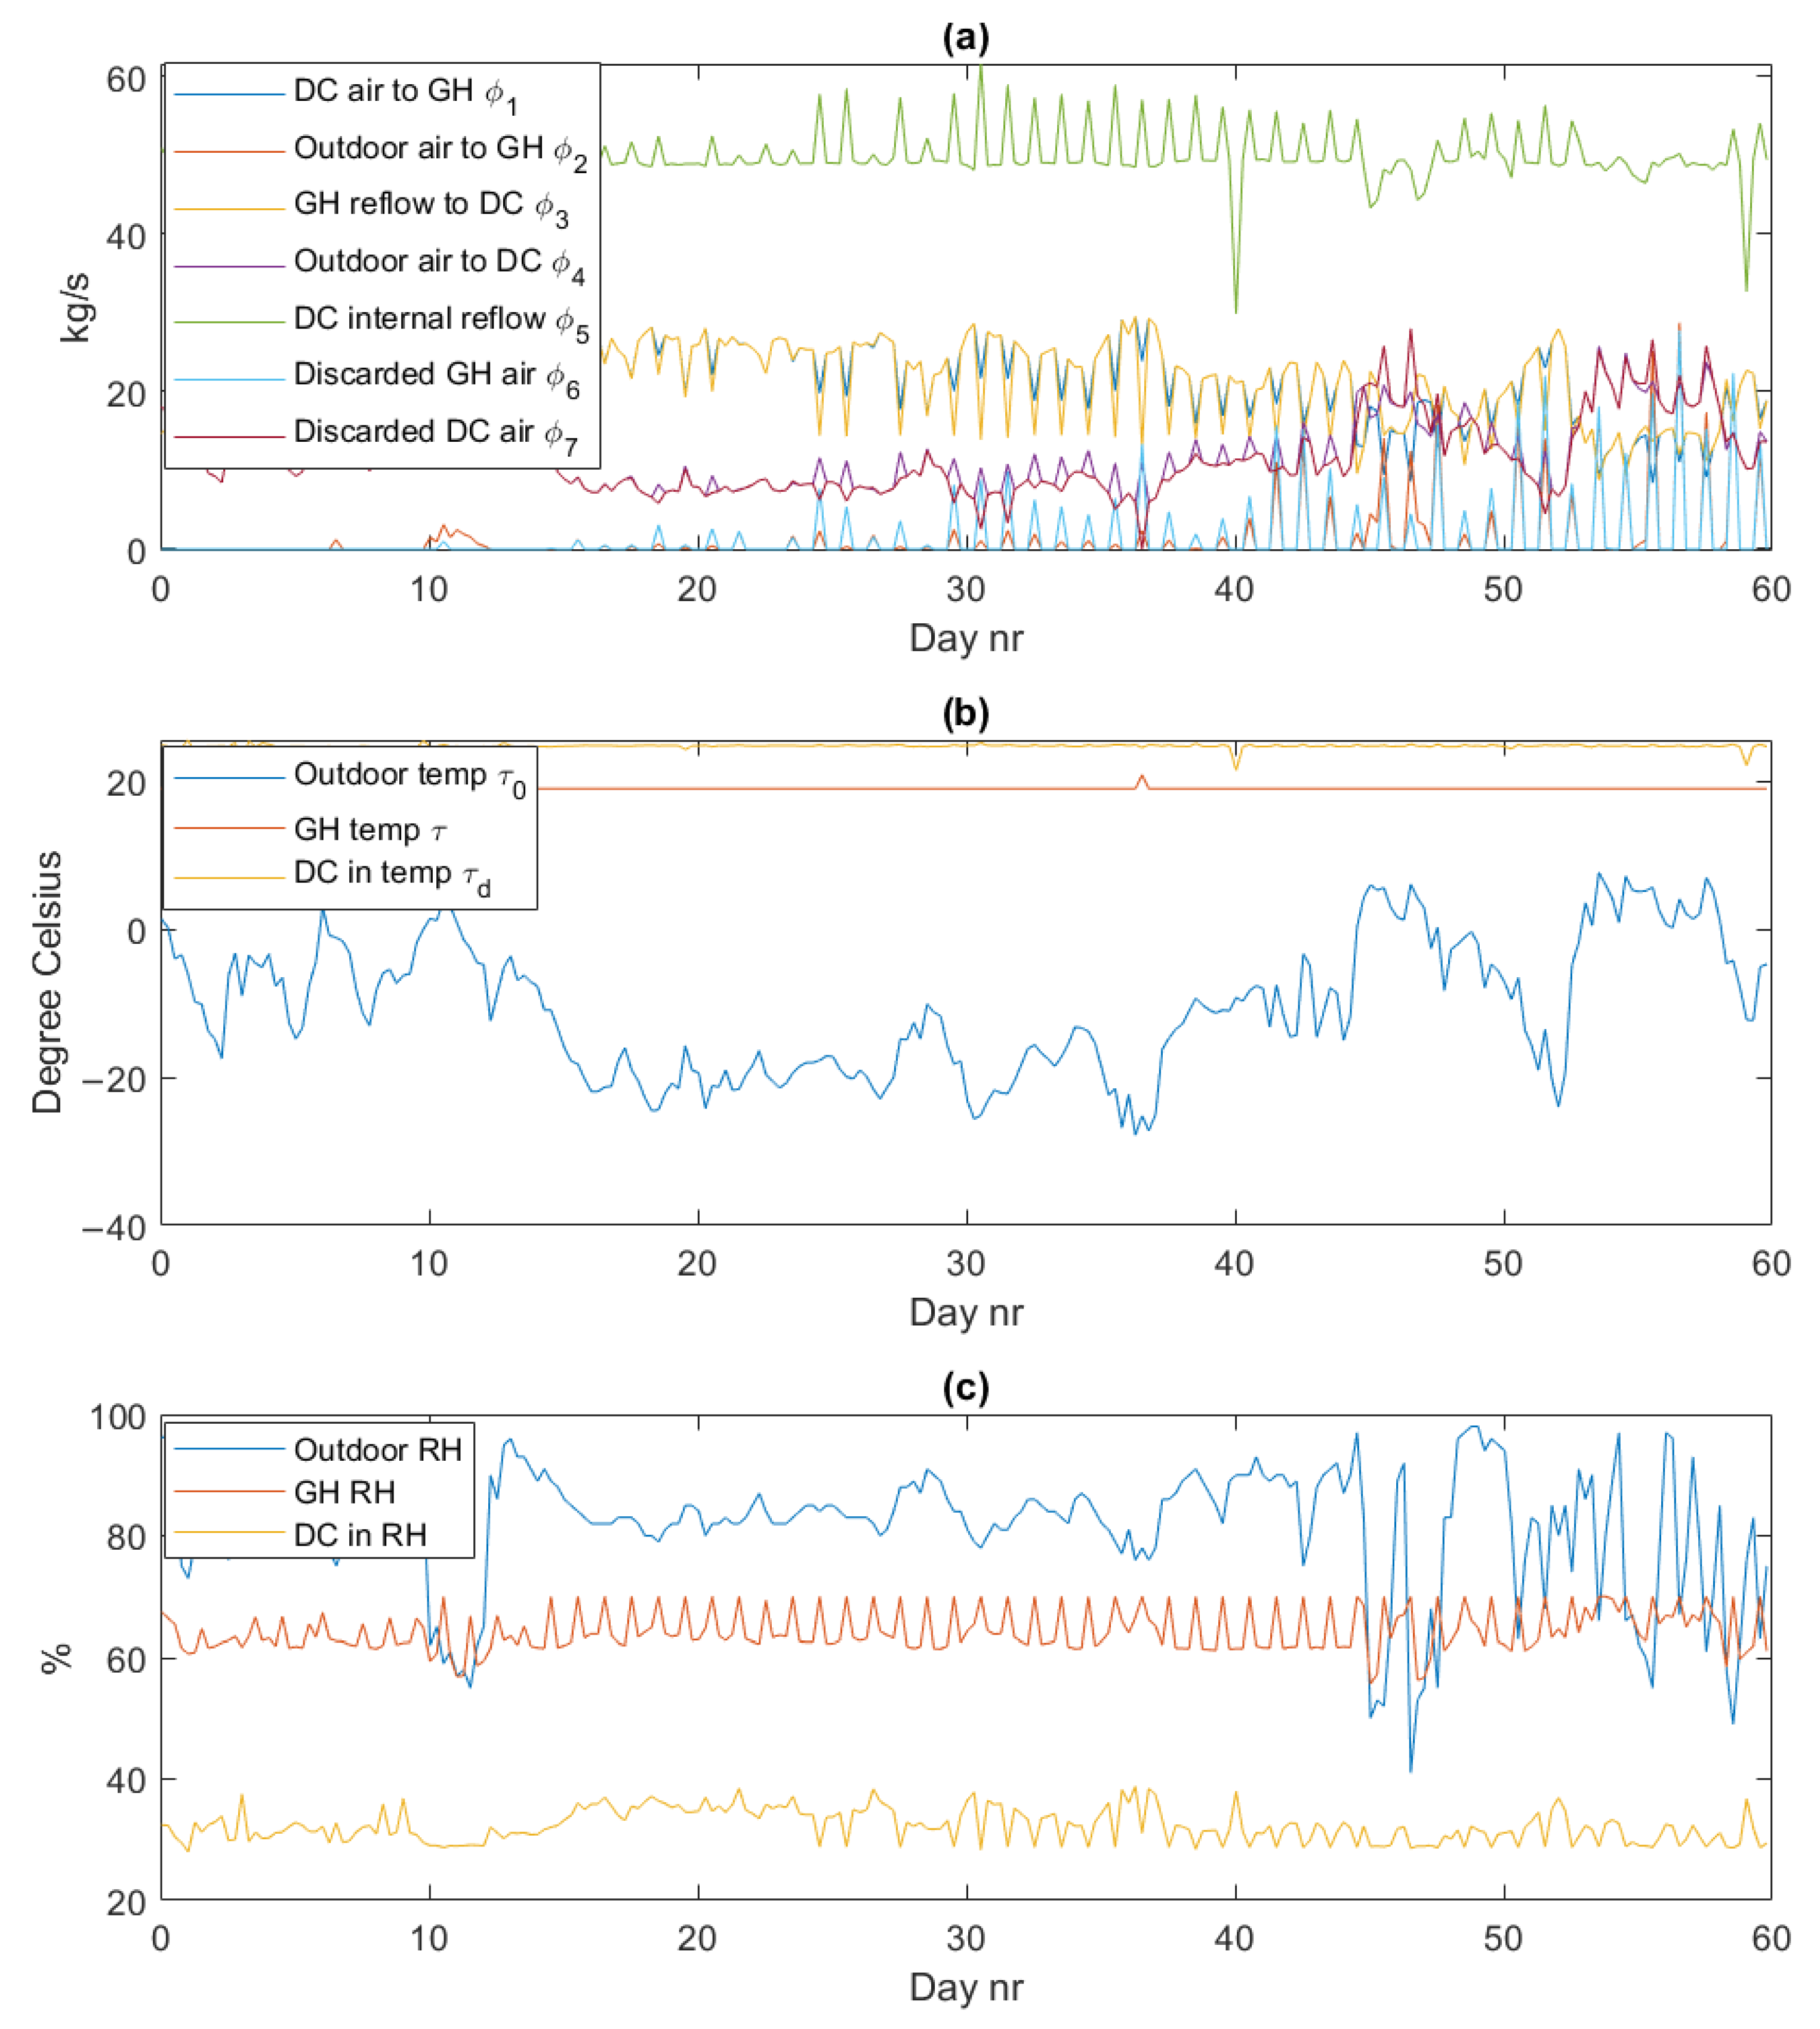
Figure 5 shows the results during the same time period as above. To be able to plot actual flows instead of normalized flows, we have chosen a fixed DC power of
, resulting in a GH area of
We can see that both the GH and DC temperature and relative humidity satisfy their bounds (A4), (A5a), and (A5c) (the DC inlet vapor pressure bounds (A5b) are also satisfied, but the plot is omitted to save space) and that all flows
are nonnegative. It may be noted that during the limiting condition in day 36, where the outdoor temperature reaches −28 °C (middle pane, blue), the discarded DC flow reaches 0 (top pane, dark red), i.e., all the excess heat is utilized. The diurnal saw-tooth pattern on the flows and the humidity ratios in the GH and DC are due to the extra moisture produced by the plants due to daytime sunlight. This results in higher humidity in the GH (bottom pane, red), and the optimization procedure will then favor using internal DC reflow (top pane, green) rather than using reflow from the GH (top pane, yellow).
2.3. Scenarios Generation
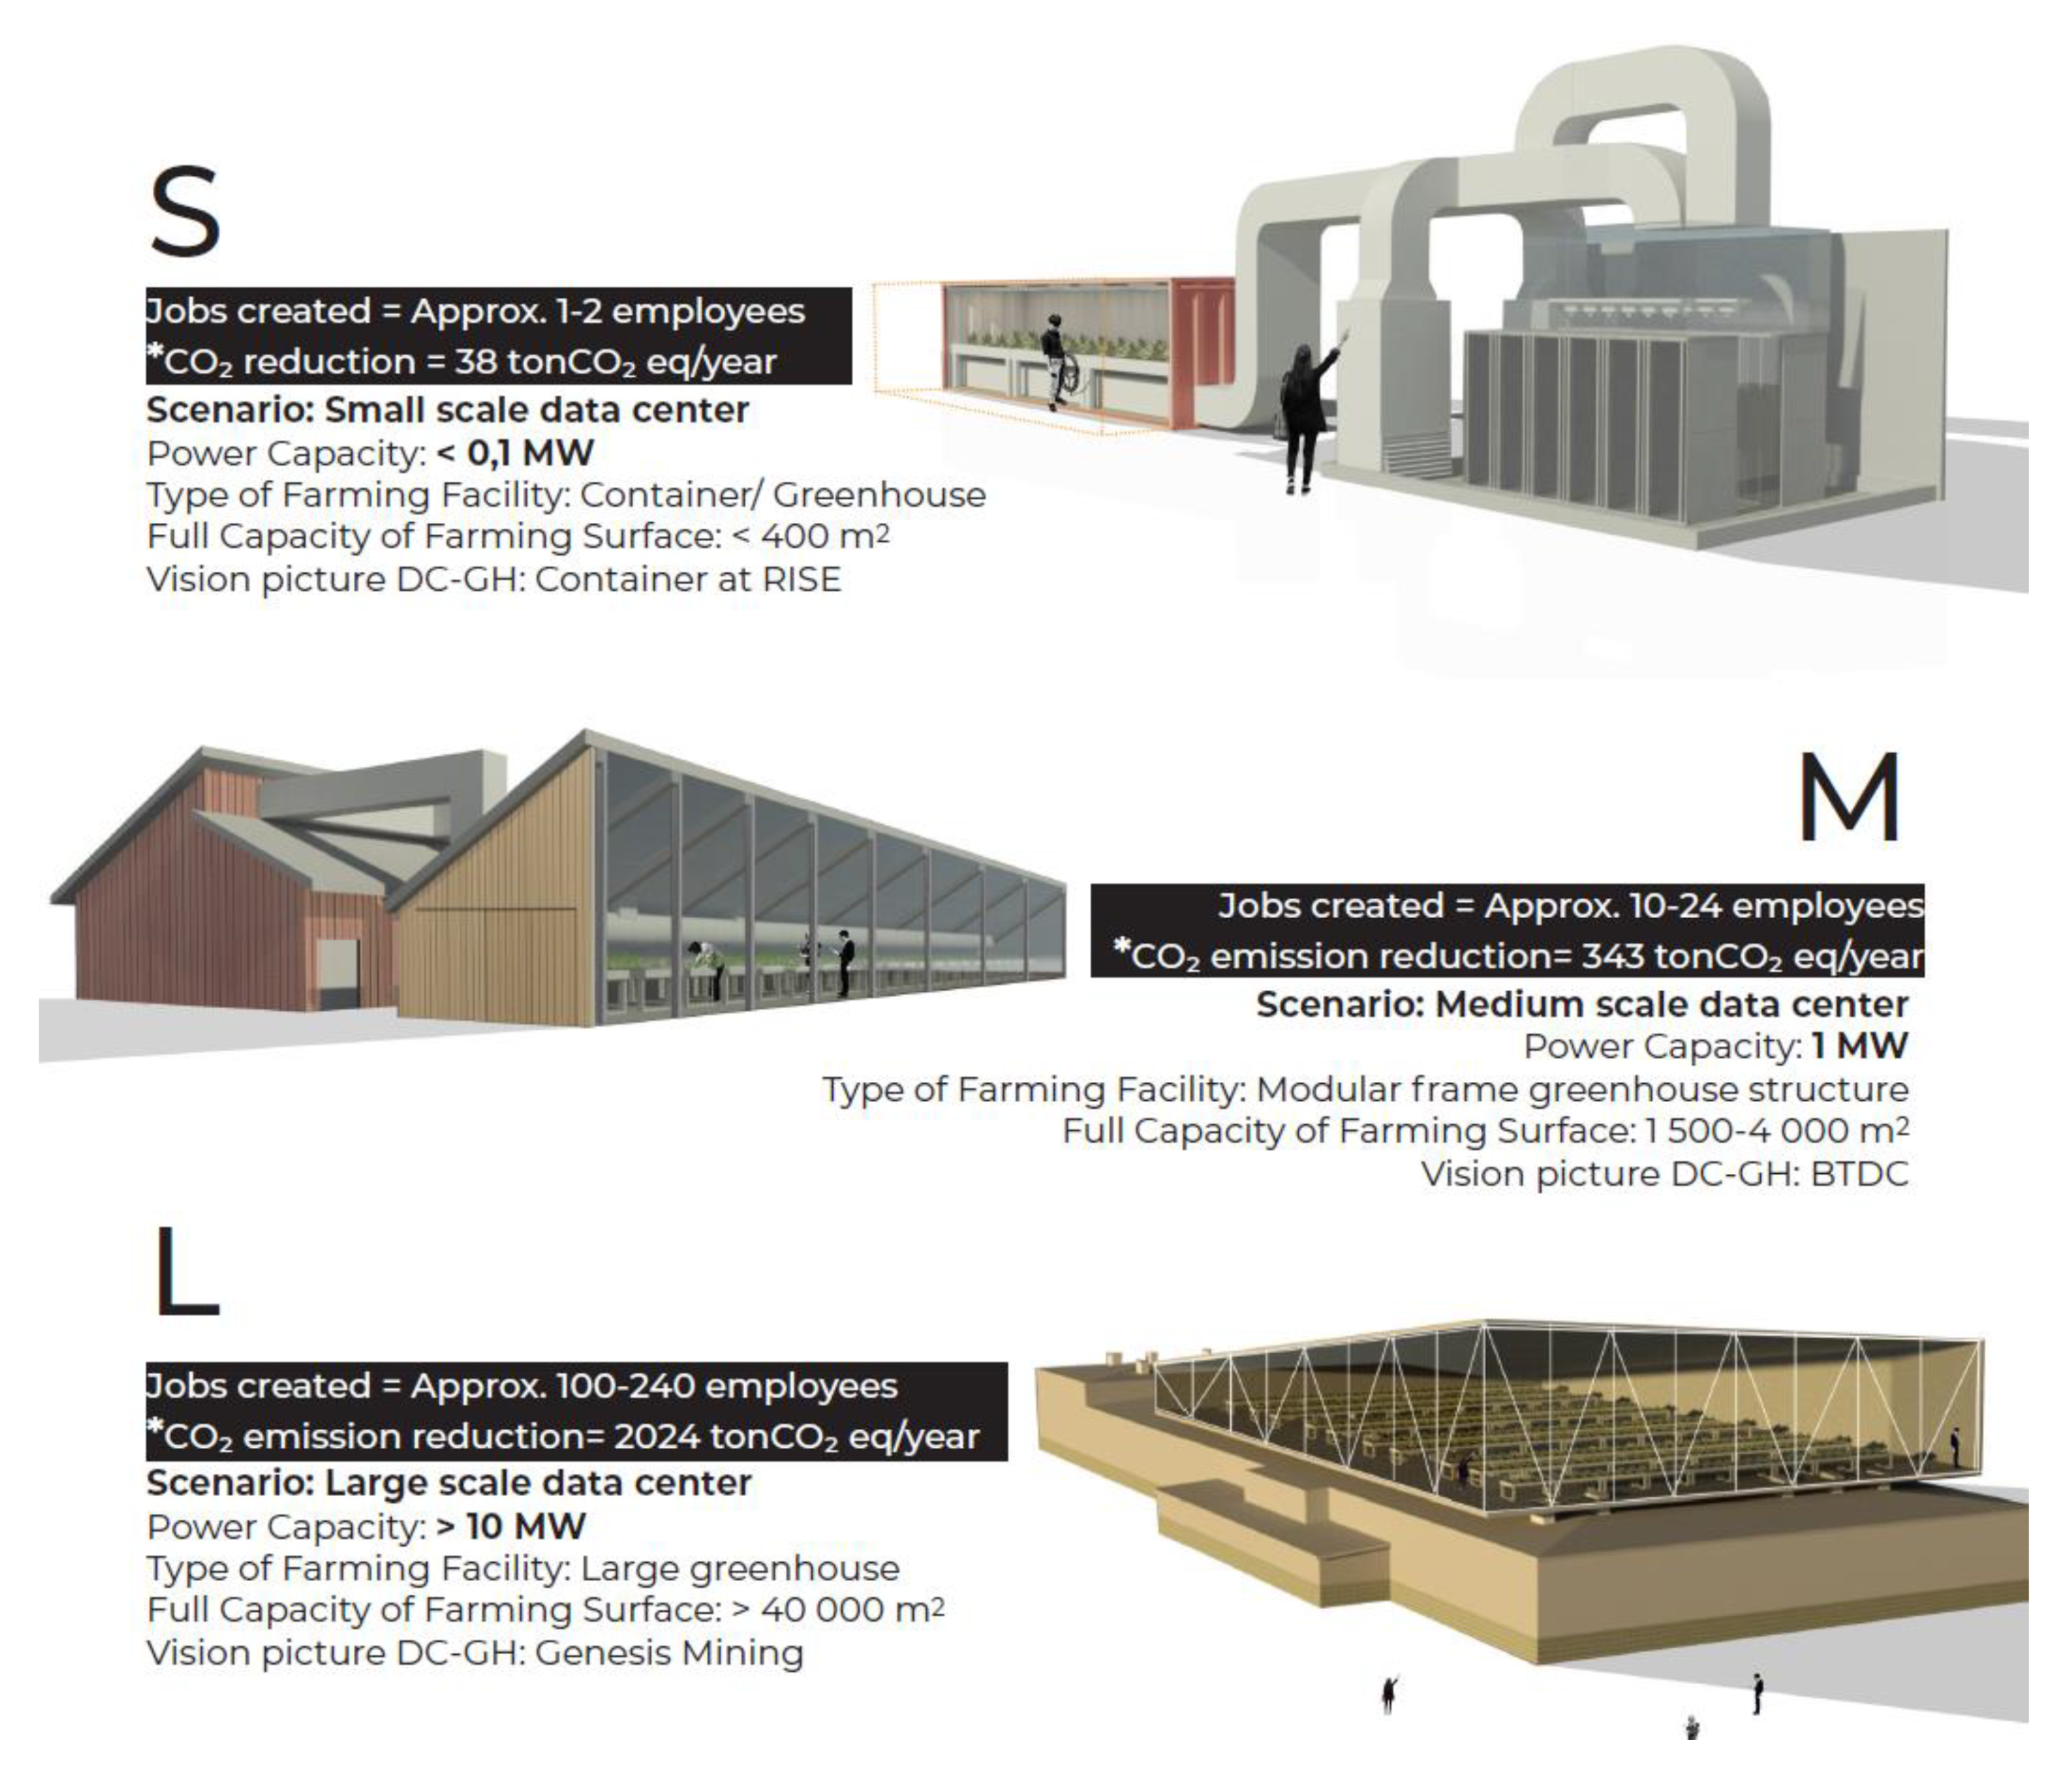
Considering the scalability of the GH model, three scenarios are defined to showcase the greater potential of the excess heat from a DC, regarding factors that contribute to the adaptive capacity and environmental health in northern regions. Through the iterative process during the stakeholder workshops, the following factors were put forward for the scenario design: number of jobs created, the potential heated GH surface, and the amount of CO2 emission reduction.
The potential heated GH surface is based on the DC–GH model’s results, where the power (MW) used by the DC is directly proportional to the GH farming surface. The scenarios are drawn and scaled up in relation to the hypothetical size of the DC, small (S), medium (M) and large (L), respectively, defined by its power capacity in MW. Here, a small DC is defined to have a power capacity under 0,1 MW, a medium DC has approximately 1 MW, and a large DC has over 10 MW.
The CO
2 emissions reduction presented in
Table 2 refers only to the energy consumption related to DC operations and GH space heating. The GH yearly consumption is calculated using “Grön kompetens” online tools and database [
59]. The reduction refers to the difference between two cases. In the first case, the DC and GH are disconnected from each other, while in the second case, the DC and GH are connected to each other in symbiosis. The embedded energy in the construction of the DC and the GH is not included, as it would not contribute to the difference between the proposed cases. Additional equipment needed for the connection between DC–GH should be considered in a further analysis, as it could increase the CO
2 emission values.
In relation to job creation, estimated figures were based on currently active GH farms with similar surface sizes as the ones presented in the cases. As an example, the average number of jobs created for the large-scale scenario was based on the following references: GothamGreens with a surface of 15,800 m
2 and 150 employees, LufaFarms with a surface of 28,000 m
2 and 200 employees [
60], and BrightFarms with 13,000 m
2 and 120 employees [
61]. It is important to consider that new technological fixes, as in automation and control systems, or the type of business models chosen can make the number of job needs vary to the ones presented.
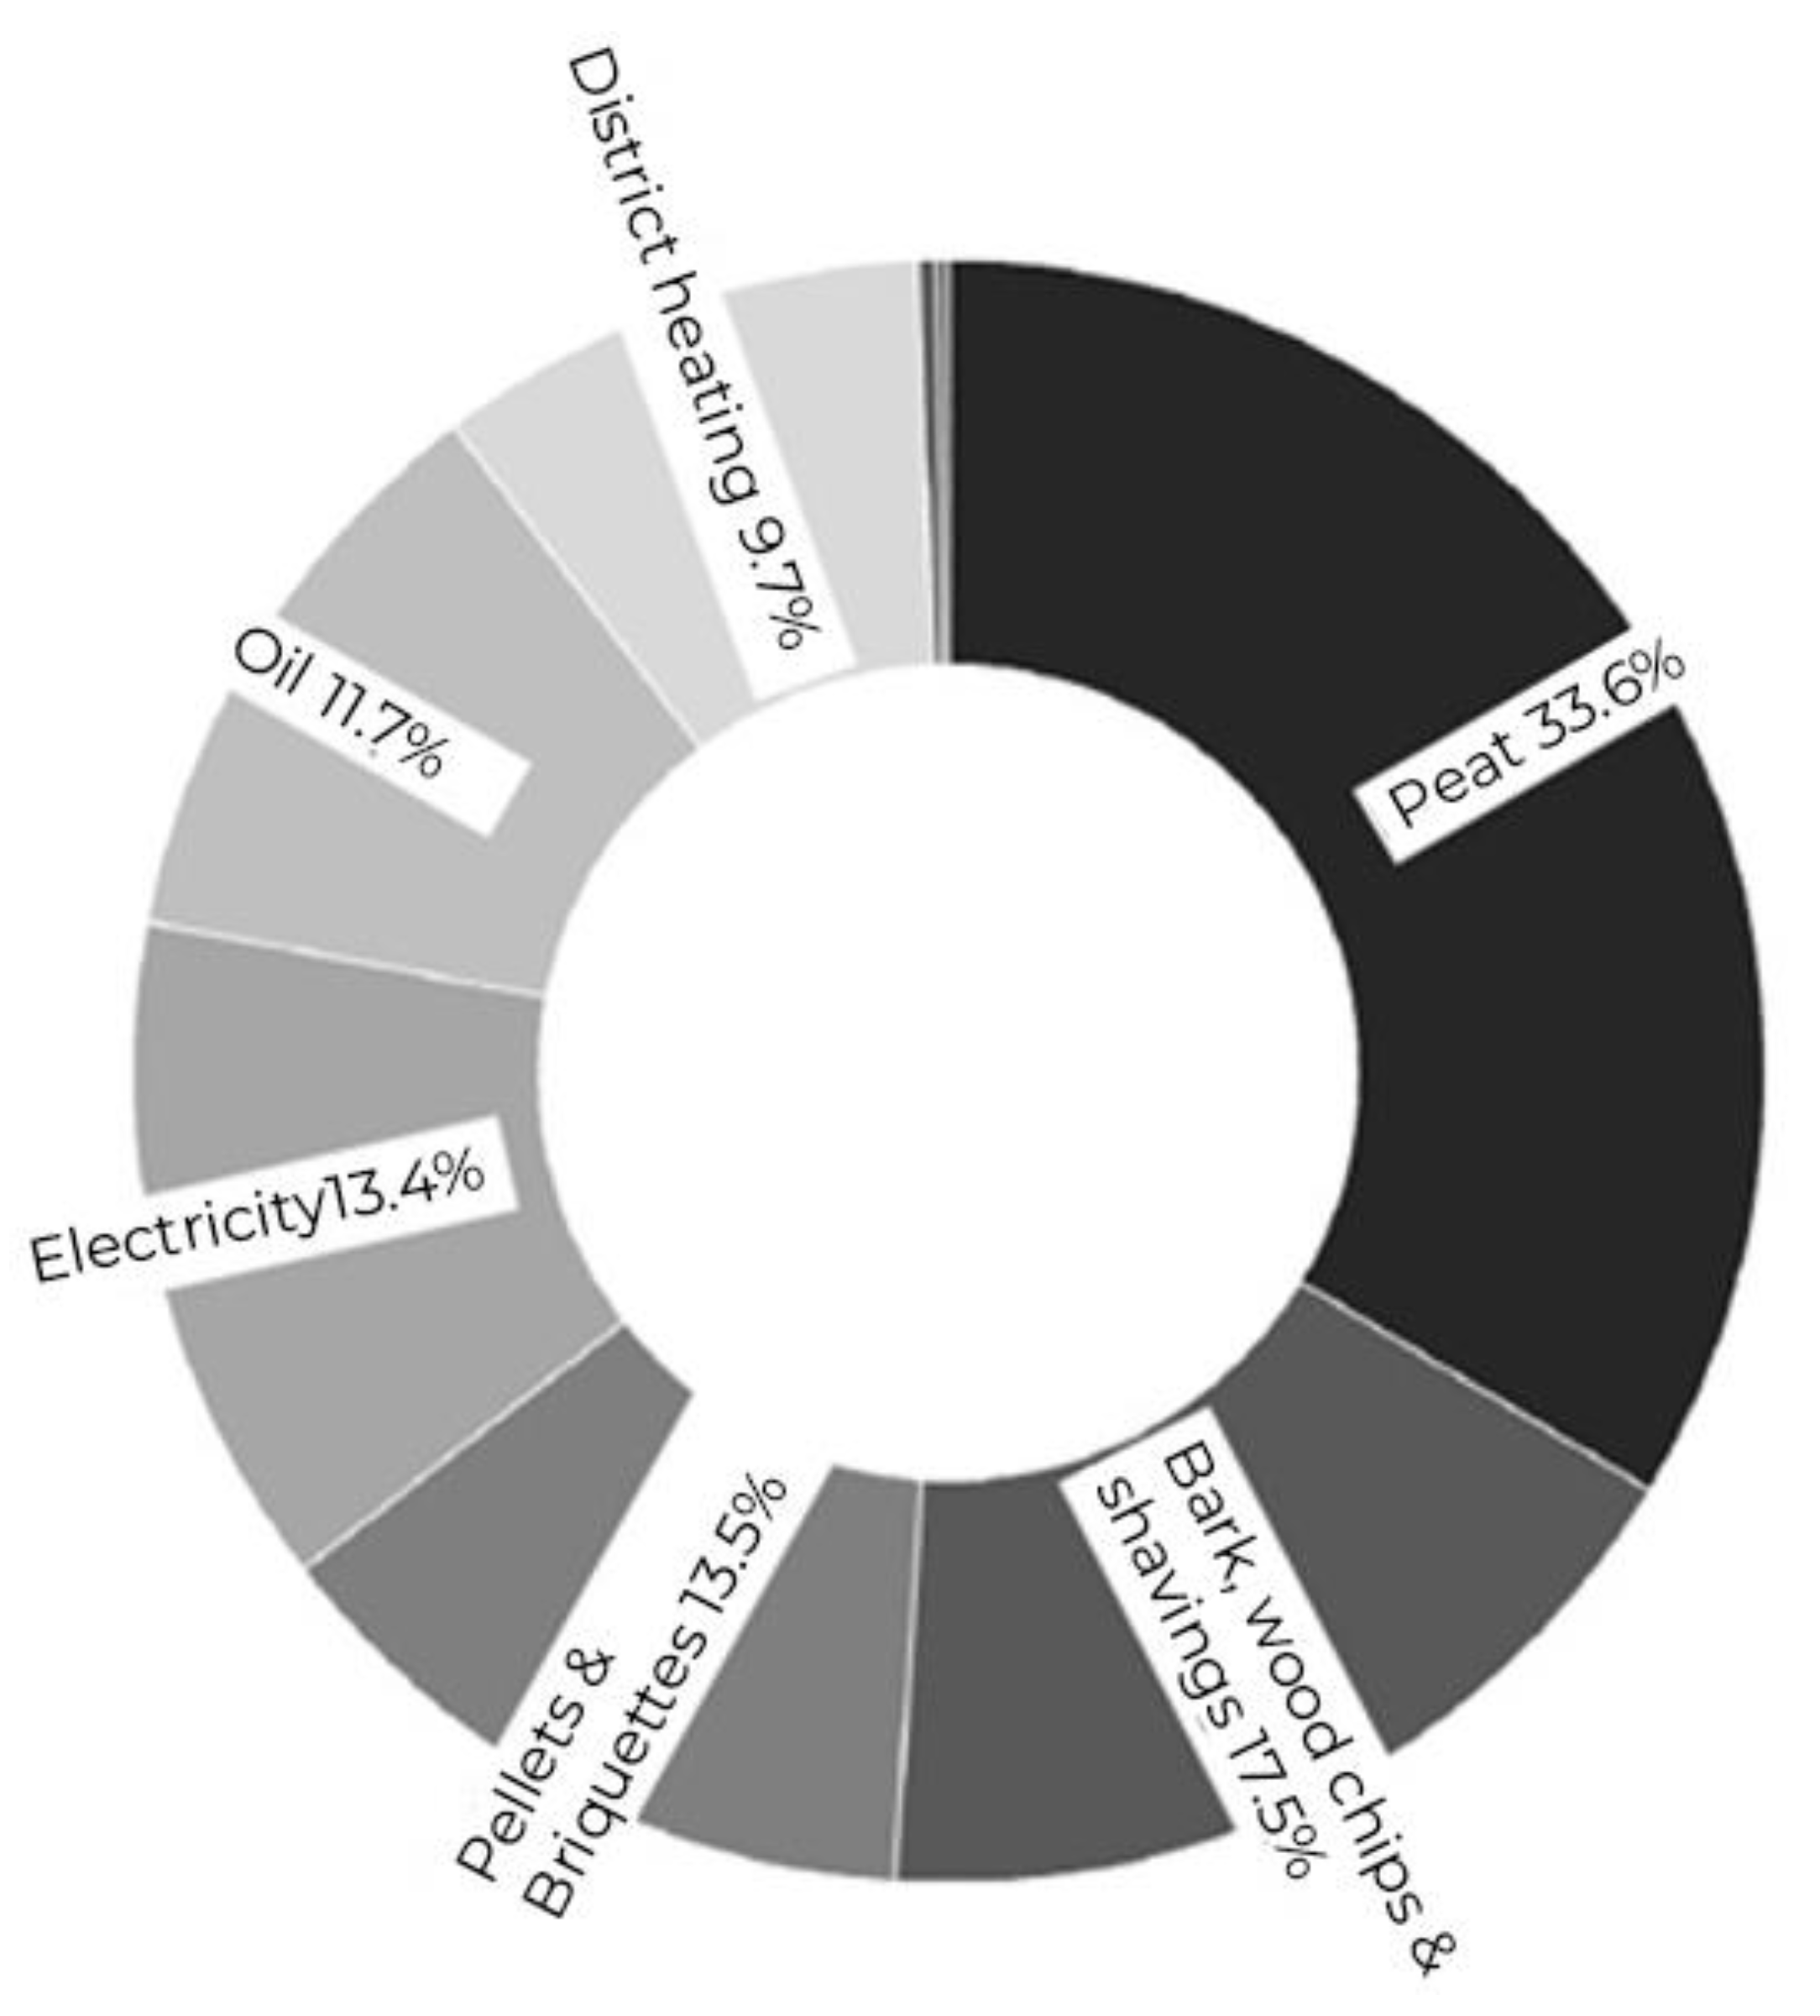
It is assumed that the GH farm is using peat as a heat source, as peat is the most common heat source used for GH farming in Norrbotten (see
Figure 6). The idea is that if the standalone GH would use DC excess heat instead of peat, the CO
2 emissions would be reduced. The three GH scenarios were visualized through 3D infographics in order to create a common understanding and increase engagement of the scenario’s potential implementation among the relevant stakeholders with diverse backgrounds involved in the study.
3. Results: Challenges, Opportunities, and Potential Implementations for DC–GH Symbiosis
3.1. Challenges
The workshops and interviews uncovered a series of challenges in Norrbotten’s food network and communities. The dominant challenges that were analyzed from the interviews are summarized in
Table 3. One challenge was that it could be difficult to rely on small-scale, localized, urban farms for produce, since food and beverage establishments often depend on consistent and reliable deliveries from their suppliers. Urban farms, however, for a variety of reasons, often choose to grow seasonal produce that are in smaller harvest quantities than in large-scale farms. For this reason, urban farms may not be able to cater to the needs of large food and beverage establishments. However, an interviewee noted that local fine dining restaurants may perform well with small quantities and good quality produce. Small-scale local production through industrial symbiosis could thus offer these fine dining restaurants a way to obtain ingredients for a smaller public.
Another challenge is one of competitive food pricing. While the interviews indicate an openness towards paying higher prices for locally grown food, chefs and managers are still restricted to keep costs low for lunch menus (e.g., they are often competitively priced at 89–99 Swedish crowns per dish). Furthermore, low-cost imports of produce from elsewhere in Europe make it difficult for more expensive, locally grown food to compete.
A third challenge is the potential high investments required. Interviews and workshops with large-scale food producers exposed the many economic challenges of running a large-scale food production facility, from burning massive amounts of peat for heat (1000 tons per year), to the maintenance of the GH structure over winter months and removing snow build up (polycarbonate is chosen over glass for this), to ascertaining ventilation during the warm summers so that the crops gain the optimal balance in humidity and temperature, and finally, to maintaining a controlled environment so that crop harvests remain protected and ultimately bountiful (i.e., unpredictability in the environment is eliminated through the avoidance of soil and excessive visitation). When pitched the idea of a DC and GH symbiosis, the interviewee continued to explain that there should be obligations pertaining to construction regulations that DCs, or similar industries, should be responsible and sustainable with the excess heat released into the environment. The interviewee offered that DC and GH synergies should be planned together from the start, thus indicating that there are potential mutual motivations for collaboration from both sides.
A fourth challenge is the lack of specialized knowledge regarding future DC–GH construction. While experiments and testing are underway, there still exists a gap in knowledge regarding thermal management and cooling control in designing DC business models. From the interviews, it has been learnt that the basic business model for the DC owners is to sell IT services, computer power, or server hall area. Thus, this implies a focus towards data engineering as opposed to thermal management and cooling control. Furthermore, the current DC security protocol impedes the physical integration of GH facilities. Depending on the DC security level classification, physical access could be limited both as direct access and to surrounding areas. This is problematic, since DC excess heat is of low grade (in certain circumstances), and the usage must therefore be close to the source and cannot be transported over long distances.
3.2. Opportunities
Analysis of the interviews has exposed several opportunities for DC–GH farming in the region, and these are delineated in
Table 3. One opportunity is the possibility to meet niche produce demands locally, without having to import international produce on a large scale. This lowers carbon emissions that would otherwise be produced from long-distance transportation. It was also discovered that a high proportion of vegetarian products is desired by restaurant establishments in the area. For example, an interview with a local restaurant indicated that 60–70% of the food ordered is vegetarian, with a high demand placed on seasonal produce. Another interview indicated that 25–30% of daily customers order vegetarian dishes. This indicates a cumulative need for fresh produce. Some examples of produce that are high in demand are cucumbers, tomatoes, herbs and microgreens, avocados, different leafy greens, chili, tropical fruits, and root vegetables. The demand for such produce can be collectively fulfilled by several DC–GH farms.
The workshops presented the opportunity for different stakeholders to meet, discuss, and therefore exchange knowledge from different sectors. These multidisciplinary knowledge exchanges give rise to potential symbiotic relationships between DC stakeholders and GH stakeholders, which may in turn propel contextualized and meaningful developments of industrial symbiosis in the region.
Towards 2040, farming systems and diverse types of farmers will be exposed to a plethora of risks and crisis situations, with some examples being climate change, environmental degradation, and COVID-19 [
46]. Given the increasing diversity of farming situations, it is important to curate an industrial ecosystem that is responsive to local conditions (i.e., resources available, climate, labor, etc.). Thus, opportunities for future farming are created through contextualizing knowledge for a particular situation of a particular farmer or GH and a particular DC and by addressing crises in more systemic ways, aligned with the European Union’s ideals for future farmers in a bid to achieve transformative resilience.
Another opportunity is the increasing regional demand for greener industrial profiles. The process of DC evaluation is targeting a greener profile of their services by using renewable power sources and efficient computing and cooling, which have resulted in the subarctic Swedish region being a beneficial area for DC establishments. Currently, the next generation of DCs is taking shape, where sustainability is in focus. Sustainable efforts include the utilization of excess heat for different applications, for example, in GH heating in cold climate areas. By this, channeling humidified air from the GH to the DC operation would be beneficial, since DCs often require an air humidity of up to 70–80%. This will lower the need for purchasing and installing an air humidification system, whilst creating a better workplace environment.
3.3. Potential DC–GH Implementations
As it is shown, DC–GHs can have a relevant role in the transition towards a sustainable horticulture sector in the north of Sweden. Currently, GHs in Norrbotten commonly heat up using non-renewable resources. Peat is the most used, accounting for 33.6% (data collected from
www.jordbruksverket.se accessed on 17 October 2019) of energy sources used for heating GHs. At the moment, most of the horticulture GHs are located sparsely in rural areas around the region, far from existing urban heat sources such as DCs or district heating networks.
DC excess heat is in low temperatures, ideal for space heating, such as for a GH. In order to minimize the heat losses in the heat transfer between the DC and the GH [
62], this study assumes the following location possibilities in the scenario design: establishing future DCs where existing GH are or vice versa and to locating future GHs where DCs are located.
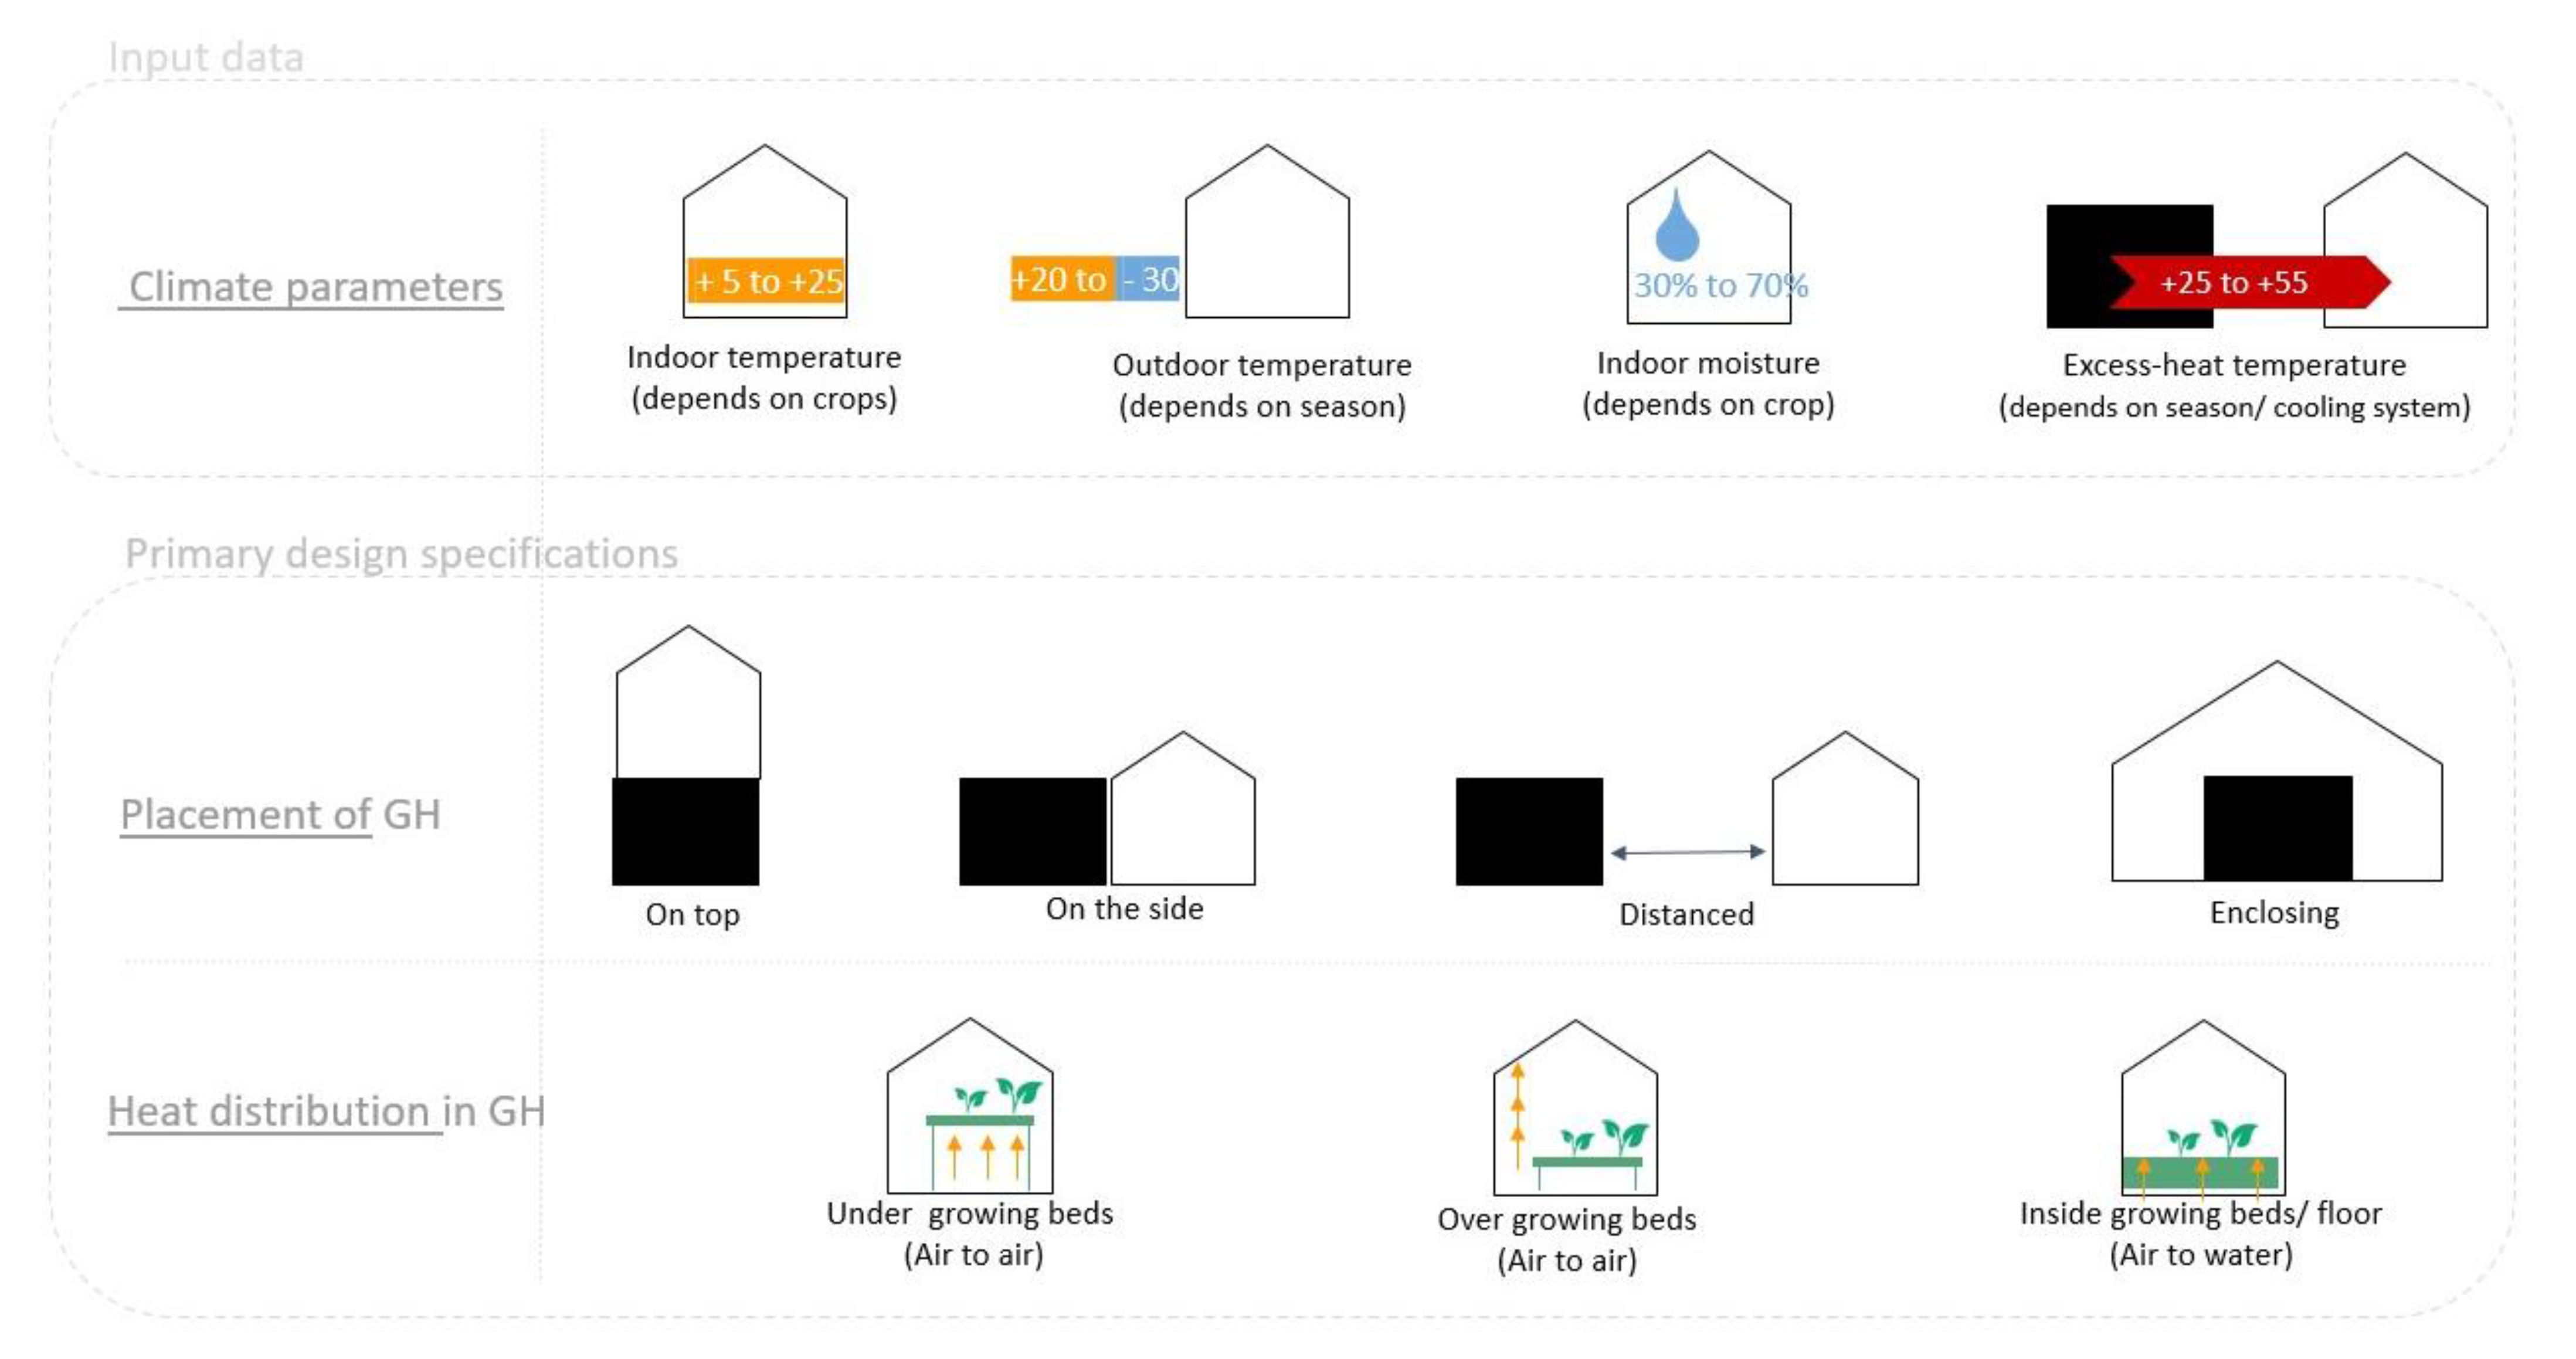
Through the study’s iterative process, guided by various technical and spatial DC–GH design parameters (see
Figure 7), three different scenarios are modelled. These scenarios showcase the positive social and environmental impacts of using the excess heat from DCs, rather than peat, for farming (see
Figure 8). The modelled scenarios are contextual, responding to specific sites targeted by the stakeholders involved in the study’s iterative process. The small-scale scenario illustrates a data center with a power capacity of less than 0.1 MW in heating a connected farming container/greenhouse of 400 m
2, with a job generation possibility of one to two employees. The medium-scale scenario illustrates a data center with around 1 MW of power capacity in heating a connected 1500–4000 m
2 greenhouse farm, with the possibility to employ between 10 and 24 employees. The large-scale scenario illustrates a data center with more than 10 MW of power capacity in heating a connected rooftop greenhouse farm of more than 40,000 m
2, with the possibility to employ between 100–240 people.
Rethinking the location of GHs within or close to these low-temperature heat sources as DCs or vice versa could bridge the existing generational gap of farmers in the northern regions. Creating farming opportunities close or within active economic areas (e.g., urban areas or industrial parks) can attract younger generations with multidisciplinary competences into the horticulture sector through an industrial symbiosis approach.
4. Discussion
Data center activities and its consequent excess heat production are increasing due to the globally increasing use of digital tools and services. Surveys have shown that new habits generated during the pandemic may persist after the pandemic as well. In particular, habits associated with working from home. These habits will also contribute to the continued use of digital tools and services in the upcoming years [
63]. A pre-pandemic prediction of the electricity consumption by DCs to support these online activities points to a significant increase for 2030 [
1]. The questions we thus return to are: What solutions can be proposed to capitalize on the excess heat? How can these solutions improve cities’ adaptive capacity and environmental health?
Other studies such as [
33,
36] have focused on the usage of data center excess heat for district heating. Our study builds upon this field of knowledge, pertaining to the different usages of excess heat, by exploring potentialities between excess heat from data centers and greenhouse farming, specifically in the subarctic region of the north of Sweden. The study was conducted to address urgent urban issues, namely self-sufficiency in local food production. This study utilized a variety of methods that have enabled us to study the phenomenon from a variety of angles: the social, economic, political, environmental, technical, and spatial angles. An iterative method workflow also supports a holistic study of this research area. However, certain challenges and limitations of the study may be addressed to motivate further clarification and future work in this research area.
The three scenarios presented show the greater potential that horticulture GH farming has in the north of Sweden to increase self-sufficiency when collaborating with the DC industry. The collaboration between relevant stakeholders requires planning for—and technically/economically supporting—DC and GH symbiosis. This includes strengthening sustainability requirements for the coming DC establishments. Empowering stakeholders with tools and guidelines towards industrial symbiosis is key in maintaining resiliency in local food production, local employment, and local recreational spaces. Maintaining the local economy and social activities is especially important for vulnerable groups, which have been severely impacted during the COVID-19 pandemic in many cities [
64].
The potential implementations of DC–GH symbiosis may contribute positively to employment opportunities, as well as in bridging the existing generational gap of farmers in the northern regions. Creating farming opportunities close or within active economic areas (e.g., urban areas or industrial parks) can attract younger generations with multidisciplinary competences into the horticulture sector through an industrial symbiosis approach. This study highlights the investment costs and ownership issues of a DC–GH establishment as main challenges hindering the potential synergetic linkages between the two sectors. The additional cost for making the interaction between a DC and a GH is relatively low, when the extra cost is in the ducting, fans, and dampers for air handling from and back to the DC. By using the air flow calculations in
Section 2.2.2, these costs will be straightforward to estimate for a particular DC–GH design. The payback time of the investments is difficult to estimate when it is correlated to which farming system that is used, traditional bench farming or hydroponic vertical farming, and to which product that is selected for farming.
Previous studies show an investment analysis of using the DC excess heat for district heating from a small, medium, or large DC case and conclude that, in the small case, alternative consumers of excess heat could be considered [
36]. In a similar manner, this paper contributes to this field of knowledge by offering different investment potentials in relation to the amount of jobs created when connecting a DC and an alternative consumer: a horticulture GH farm at three different scales: small, medium, and large. Alternative consumers, such as GH farms, that could use the DC excess heat in all cases (small, medium, large) should be considered rather than just focusing on the small DC case, as it can bring social sustainability as well by creating jobs in the local context.
To further develop the investment analysis, it is important to consider that farmers often have a lack of capital to invest in extra equipment, and the data center industry is often risk-averse and thus reluctant in investing and taking ownership of a GH without having a guarantee that the horticulture greenhouse production would be economically competitive in the local food market.
Stakeholders from the local food network highlighted the increase in local vegetable demand during the study. To meet this demand, while keeping in mind the environmental health of Sweden’s northern regions, a viable solution would thus be to switch from burning peat to utilizing excess heat from data centers in order to heat the greenhouses. However, other regions may have alternative clean energy sources to utilize in heating GHs; therefore, the DC–GH connection may not necessarily be a suitable option from the environmental point of view.
From the technical perspective, using a standard greenhouse model and basic assumptions on heat and mass conservation when mixing flows, we have shown how to make predictions on how much GH area can be heated by a given DC installation. Moreover, the required air flows between the GH and DC can also be calculated, thus providing a basis for dimensions and costs of ducting and fans. Since these calculations involve the peak requirements of the GH, this can be considered a new contribution to the field of DC–GH knowledge, in comparison to existing results that instead concern the total yearly energy consumption, see, e.g., [
43] and the online calculation tool [
59]. In the modeling, some reasonable assumptions have been made for simplicity (e.g., perfect air mixing and steady-state conditions). The main simplification is the assumption of no heat loss between the DC and GH. Hence, to consider a setup with some geographical distance between the GH and DC, the model would then need to be extended with this heat loss. The most critical parameters for operation of a DC–GH are the cooling of the DC and the heating of the GH, the technical risk of such a symbiosis system is a failure where the DC gets overheated, and the GH becomes cold. To prevent system failure, backup systems are required to run both facilities in island mode, where the DC is chilled and the GH is heated, separately. Furthermore, the humidity level is a critical parameter for both the DC and GH that must be taken into consideration; if going into island mode, the GH must be de-humidified by ventilation and the data center will use fresh dry outdoor air for cooling.
Lastly, from a spatial perspective, the existing DC and GH locations in northern Sweden are unfortunately distant from one another. Placing smaller autonomous edge DC servers inside existing GHs could be a more affordable option than building a new GH close to an existing DC or vice versa. In that case, the more forgiving security needs of the edge servers offer a higher possibility to harvest all heat. During the process of designing potential DC business models for this study, a lack of knowledge in the DC sector regarding thermal management was identified, therefore presenting a knowledge gap that should be fulfilled. This education could also apply to the GH sector to increase mutual understanding.
Future Work
Follow-up research should include the calibration of the developed DC–GH simulation model. This can be performed by using experimental measured values from existing GHs and by constructing an experimental DC–GH setup in the region, as well as in other climate conditions outside the region. In addition, more investigations should be carried out about the effects of artificial lighting on the DC excess heat demand. For example, LED lights can contribute to an increase of indoor temperatures, thereby needing less heat from the DC to heat up the GH.
While the study dabbles with the environmental impacts of a DC–GH symbiosis, it could benefit from a deeper analysis. Thus, from an environmental perspective, further research into the CO2 impact of the additional equipment required when connecting a DC to a GH should be conducted to obtain a more comprehensive environmental assessment in relation to the energy consumption of DC–GH operations. The environmental impacts in relation to the embedded energy of a DC–GH construction and IT equipment have been, thus far, out the scope of this paper.
Furthermore, a comparative study of CO2 impact between different heat sources (renewable and non-renewable) could be valuable for implementing this research in other geographical contexts, with other heat sources available rather than peat, such as, e.g., biogas or biofuels.
From a social, economic, and political perspective, the context can be considered to play a significant role in determining the effectiveness, efficiency, and even possibility of implementing a DC–GH symbiosis. Climate considerations, economic and environmental policy, design, and building and construction regulations may all play a role in determining realistic implementation. Thus, future work in the arena could be an expansion of the current study in different contexts via a case-by-case basis, in order to provide a detailed protocol for future implementation.
5. Conclusions
This study shows synergistic opportunities from both industries to collaborate in the future, thereby improving environmental health and increasing sustainability. To recap, the research questions we put forth for this study were: Why has this industrial symbiosis not yet emerged between DCs and GHs? What are the challenges hindering such a symbiosis, and what are the potential offerings for implementing it? The paragraphs below summarize this research study’s overarching takeaways.
Firstly, the study emphasizes the complex nature of industrial symbiosis; a multitude of individuals and organizations with different expertise are required to collaborate to implement DC–GHs in reality. Some examples include (and are not limited to), food production actors, food supply actors, food and beverage services, municipal planners, DC engineers, urban farmers, research associates, strategic communication actors, local energy companies, and end consumers. This responds directly to the first question, in that the tenets of communication and leadership are necessary in such a study’s continuity and coordination over time, which can be offered as a takeaway lesson for future industrial symbiosis efforts. Furthermore, the use of visual and communicable materials across stakeholders was found to be necessary in conveying knowledge across those involved. For example, the use of digital simulation models, posters, renderings, brochures, and booklets along the research study’s journey were helpful in representing common goals among the diverse stakeholders.
Secondly, to embrace the adaptive capacity of cities, apart from guiding the stakeholders’ collaboration and engagement, the construction design and urban planning process would need to become more flexible in allowing DC–GH symbiosis in cities. Restrictive land-use planning, exorbitant investment costs, and other governing and regulatory inhibitions are all hindering existing DC–GH efforts. A certain appetite for risk taking and dynamic moves in these areas may offer leeway for future innovation and experimentation. A bottom-up approach to these efforts would mean that each sector takes responsibility over solving their own implementation issues, and an accompanying top-bottom approach would mean that policy and legislations would facilitate, even motivate, DC–GH symbiosis in cities.
Thirdly, consistent experimentation is key in delivering optimal industrial symbiosis solutions. The research study’s iterative approach had, over the years, facilitated a stringent yet continuous assessment of successes and failures, enabling the finalization of solutions that may be confidently implemented in reality. Context-dependent details were helpful in providing workable solutions to the study, which offer a useful point of departure for future DC–GH symbiosis studies in other contexts.


 ,
, 


