
Chloride Penetration Behavior of Concrete Made from Various Types of Recycled Concrete Aggregate

Abstract
:1. Introduction
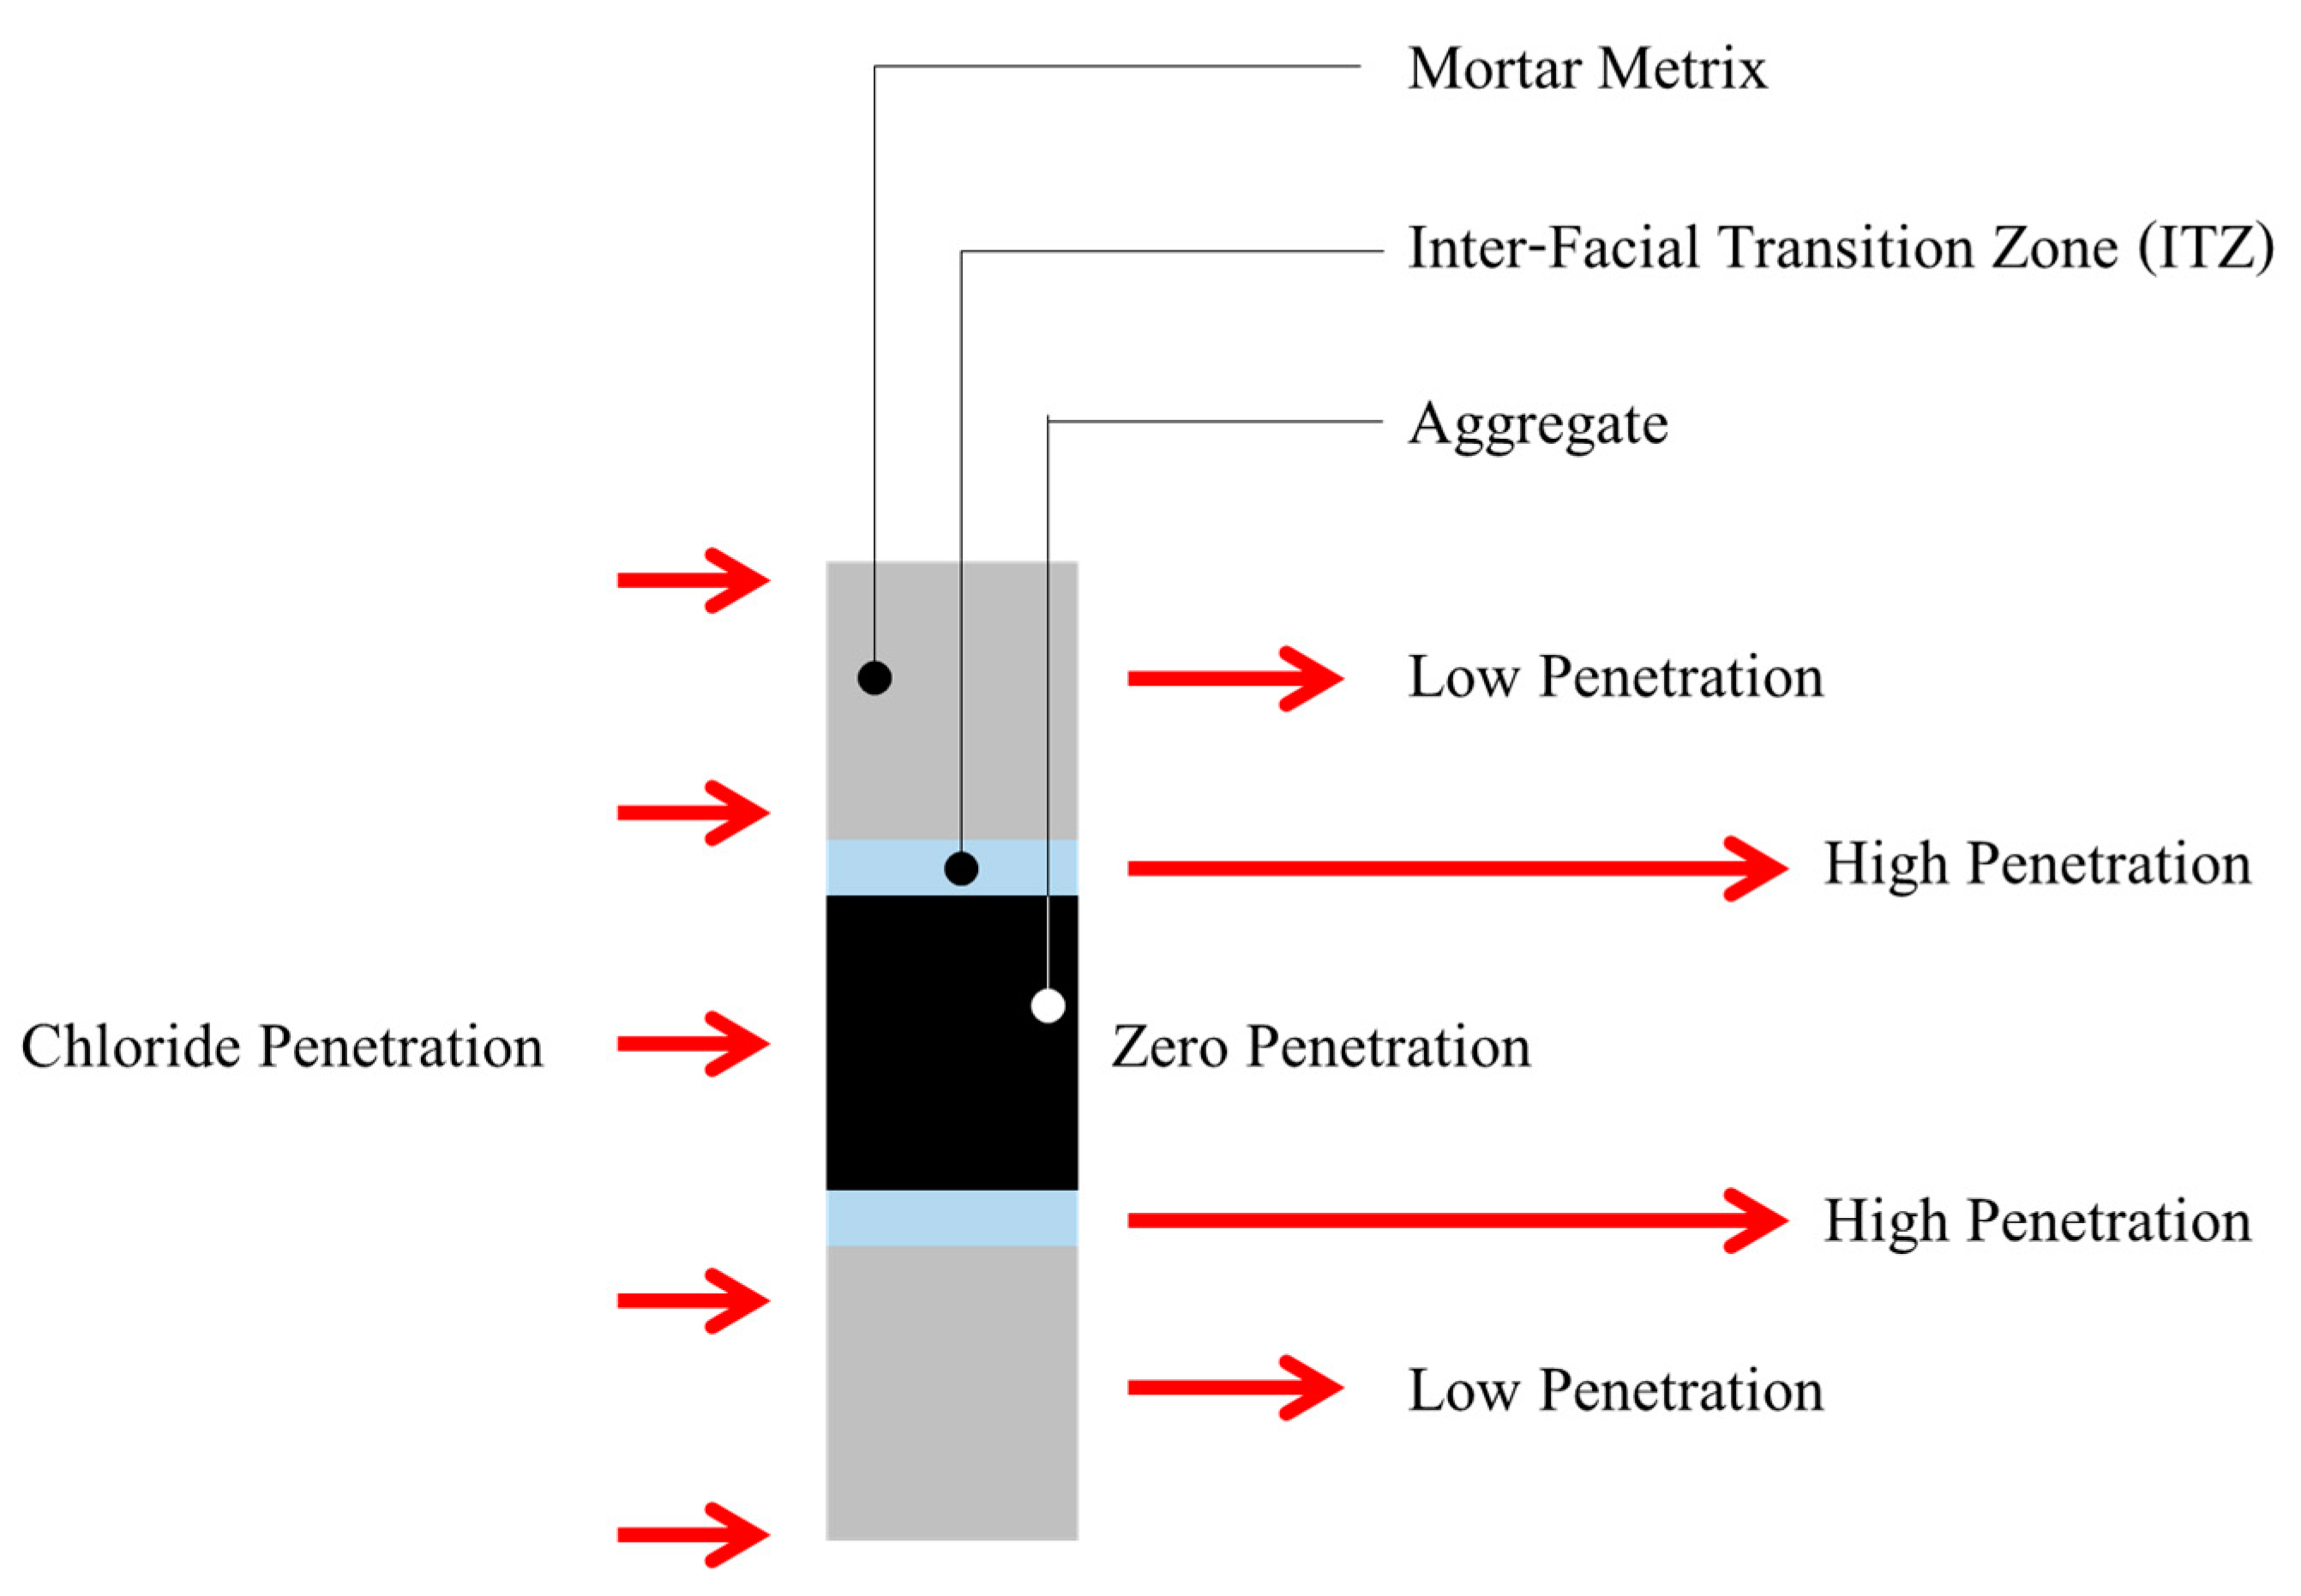
1.1. Chloride Penetration Behavior
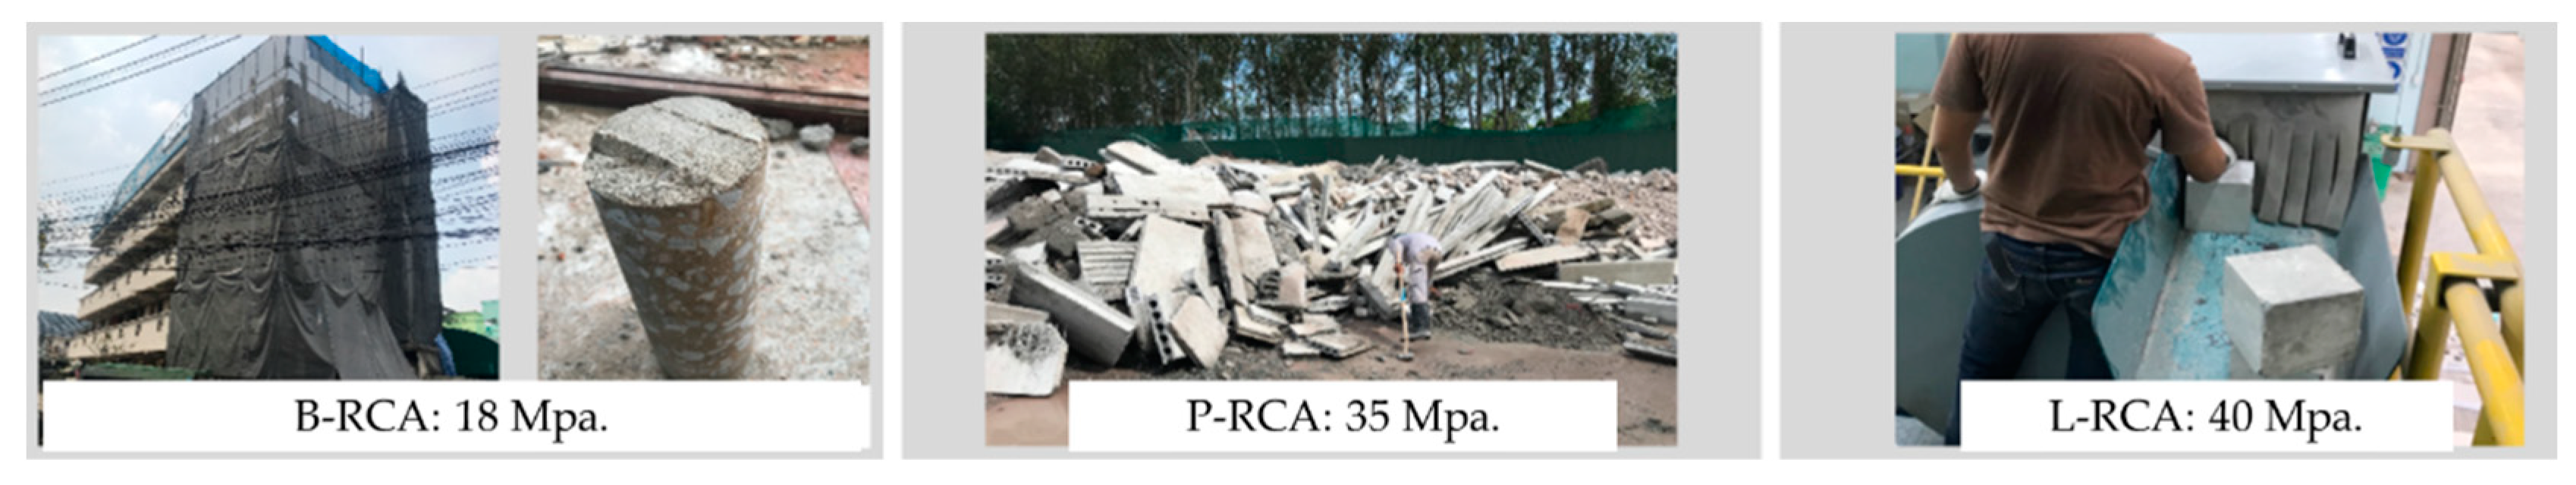
1.2. Sources of Recycled Aggregate
2. Materials and Methods
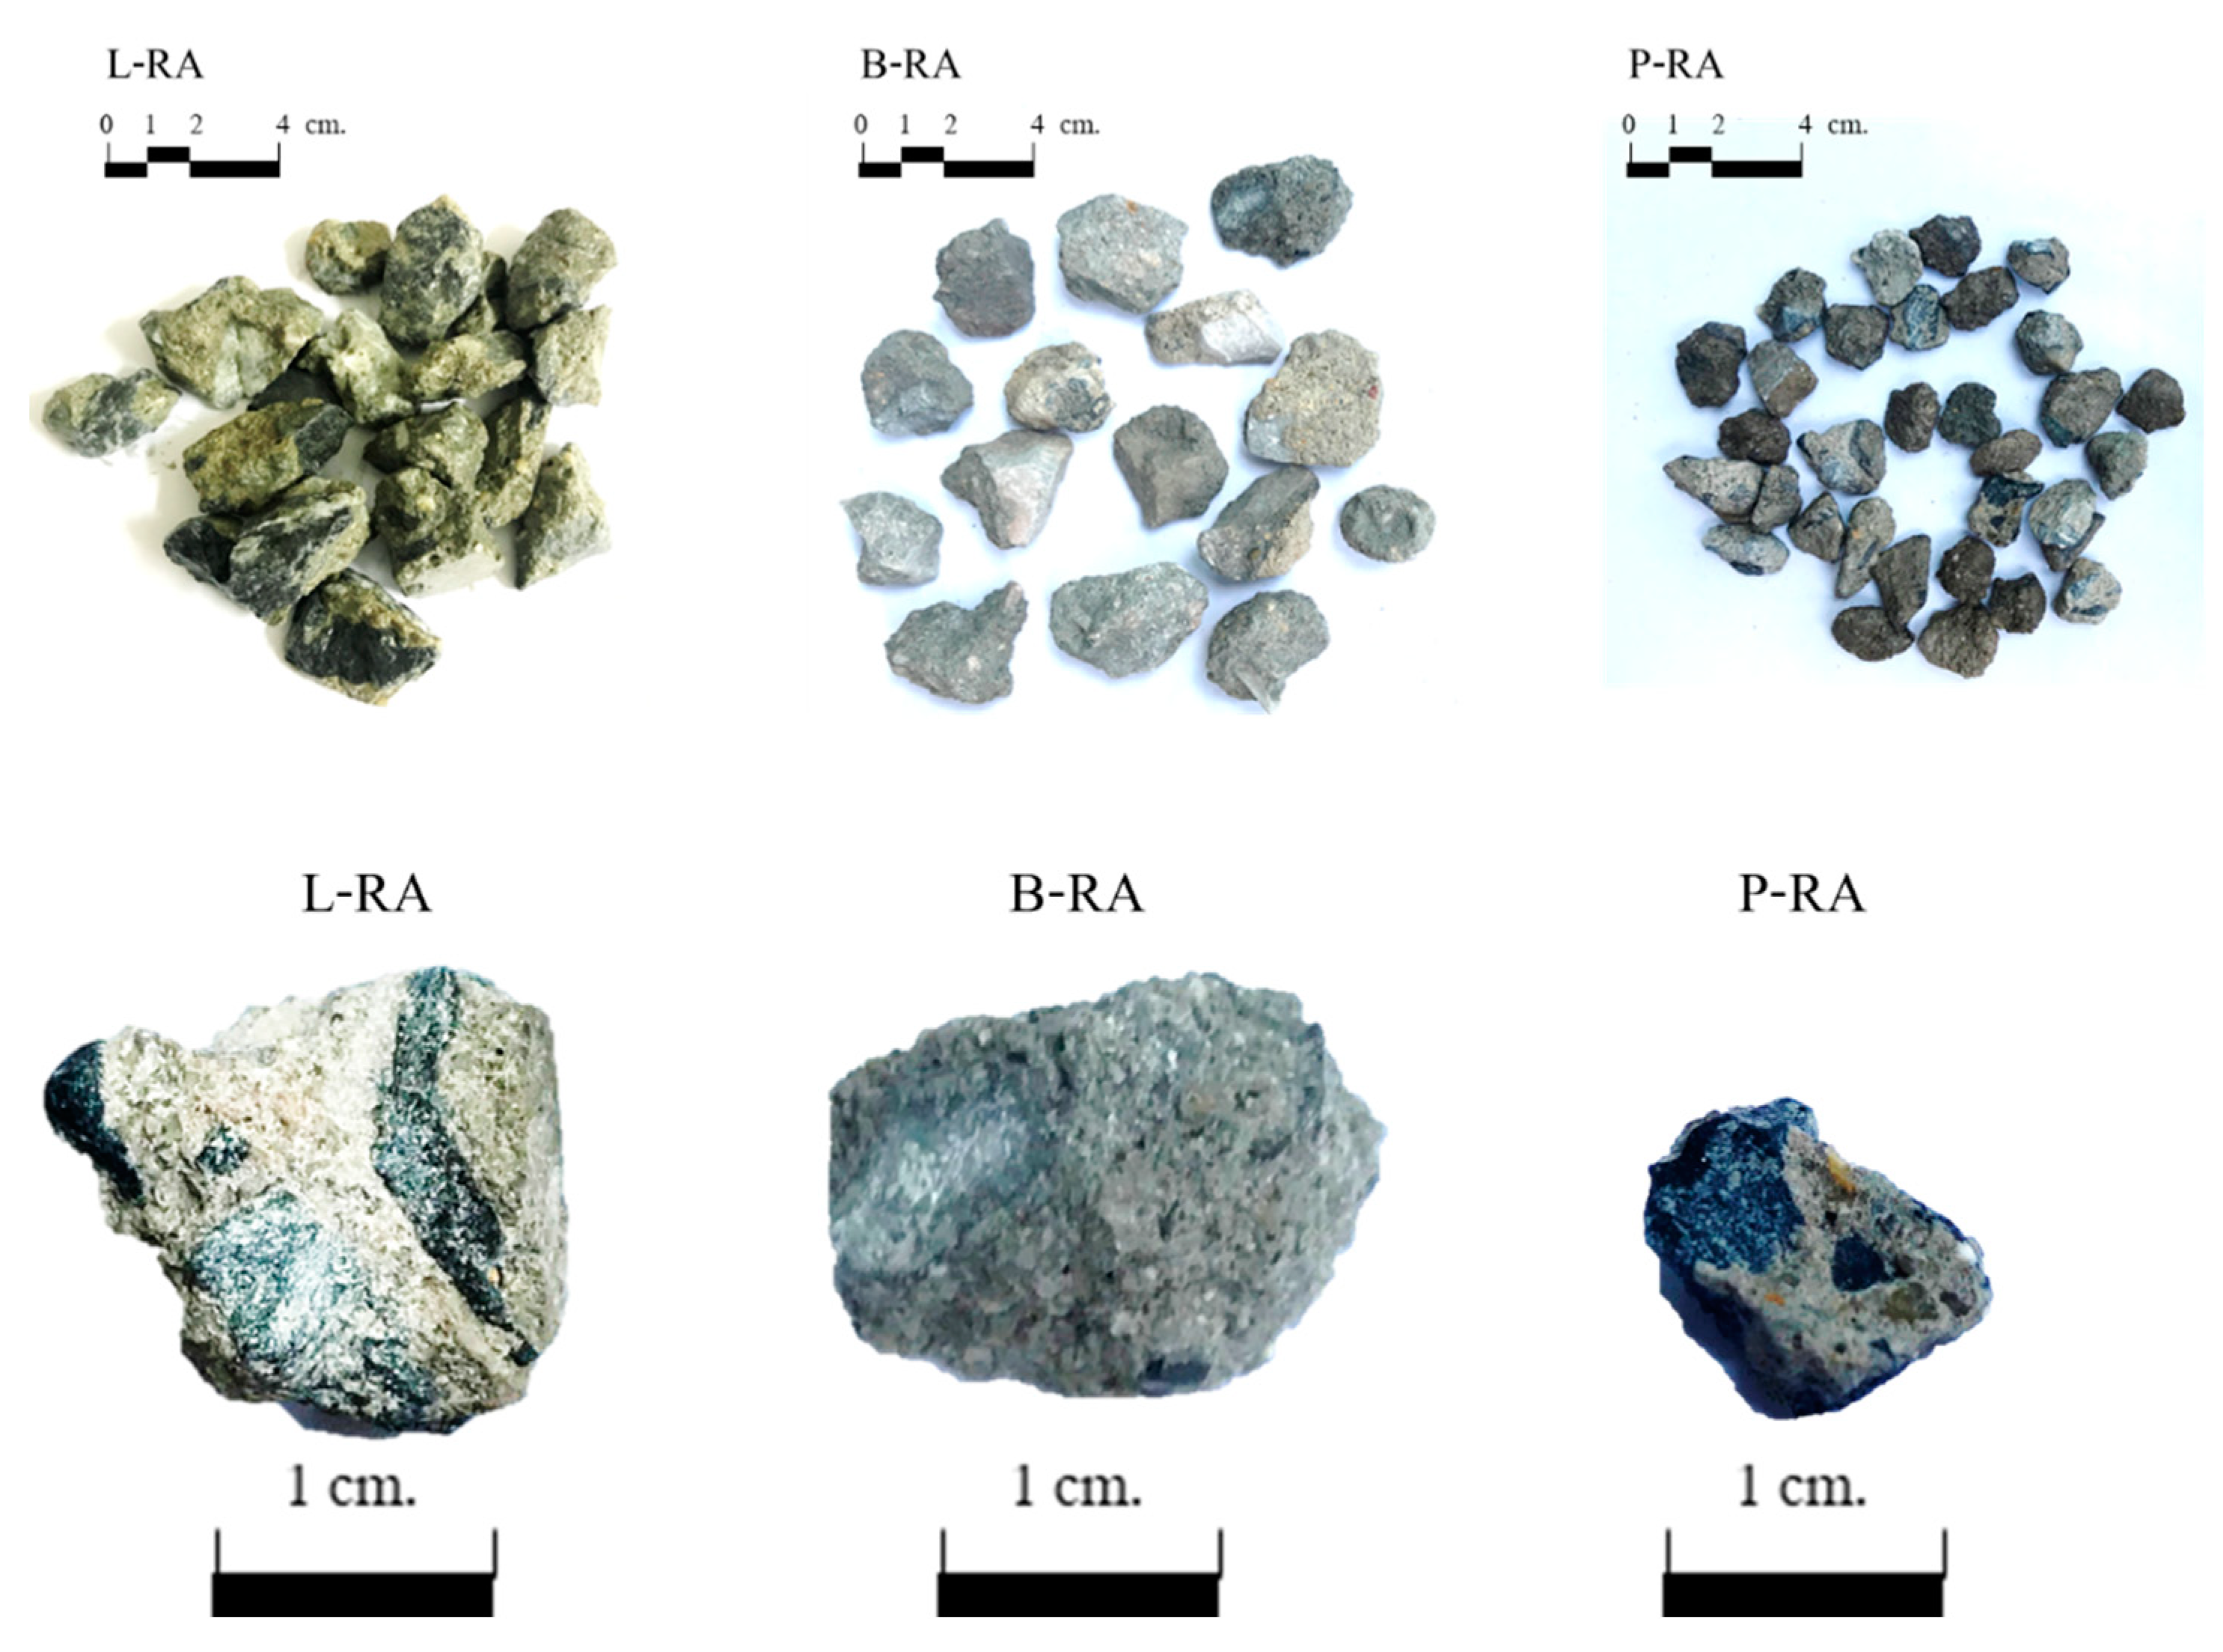
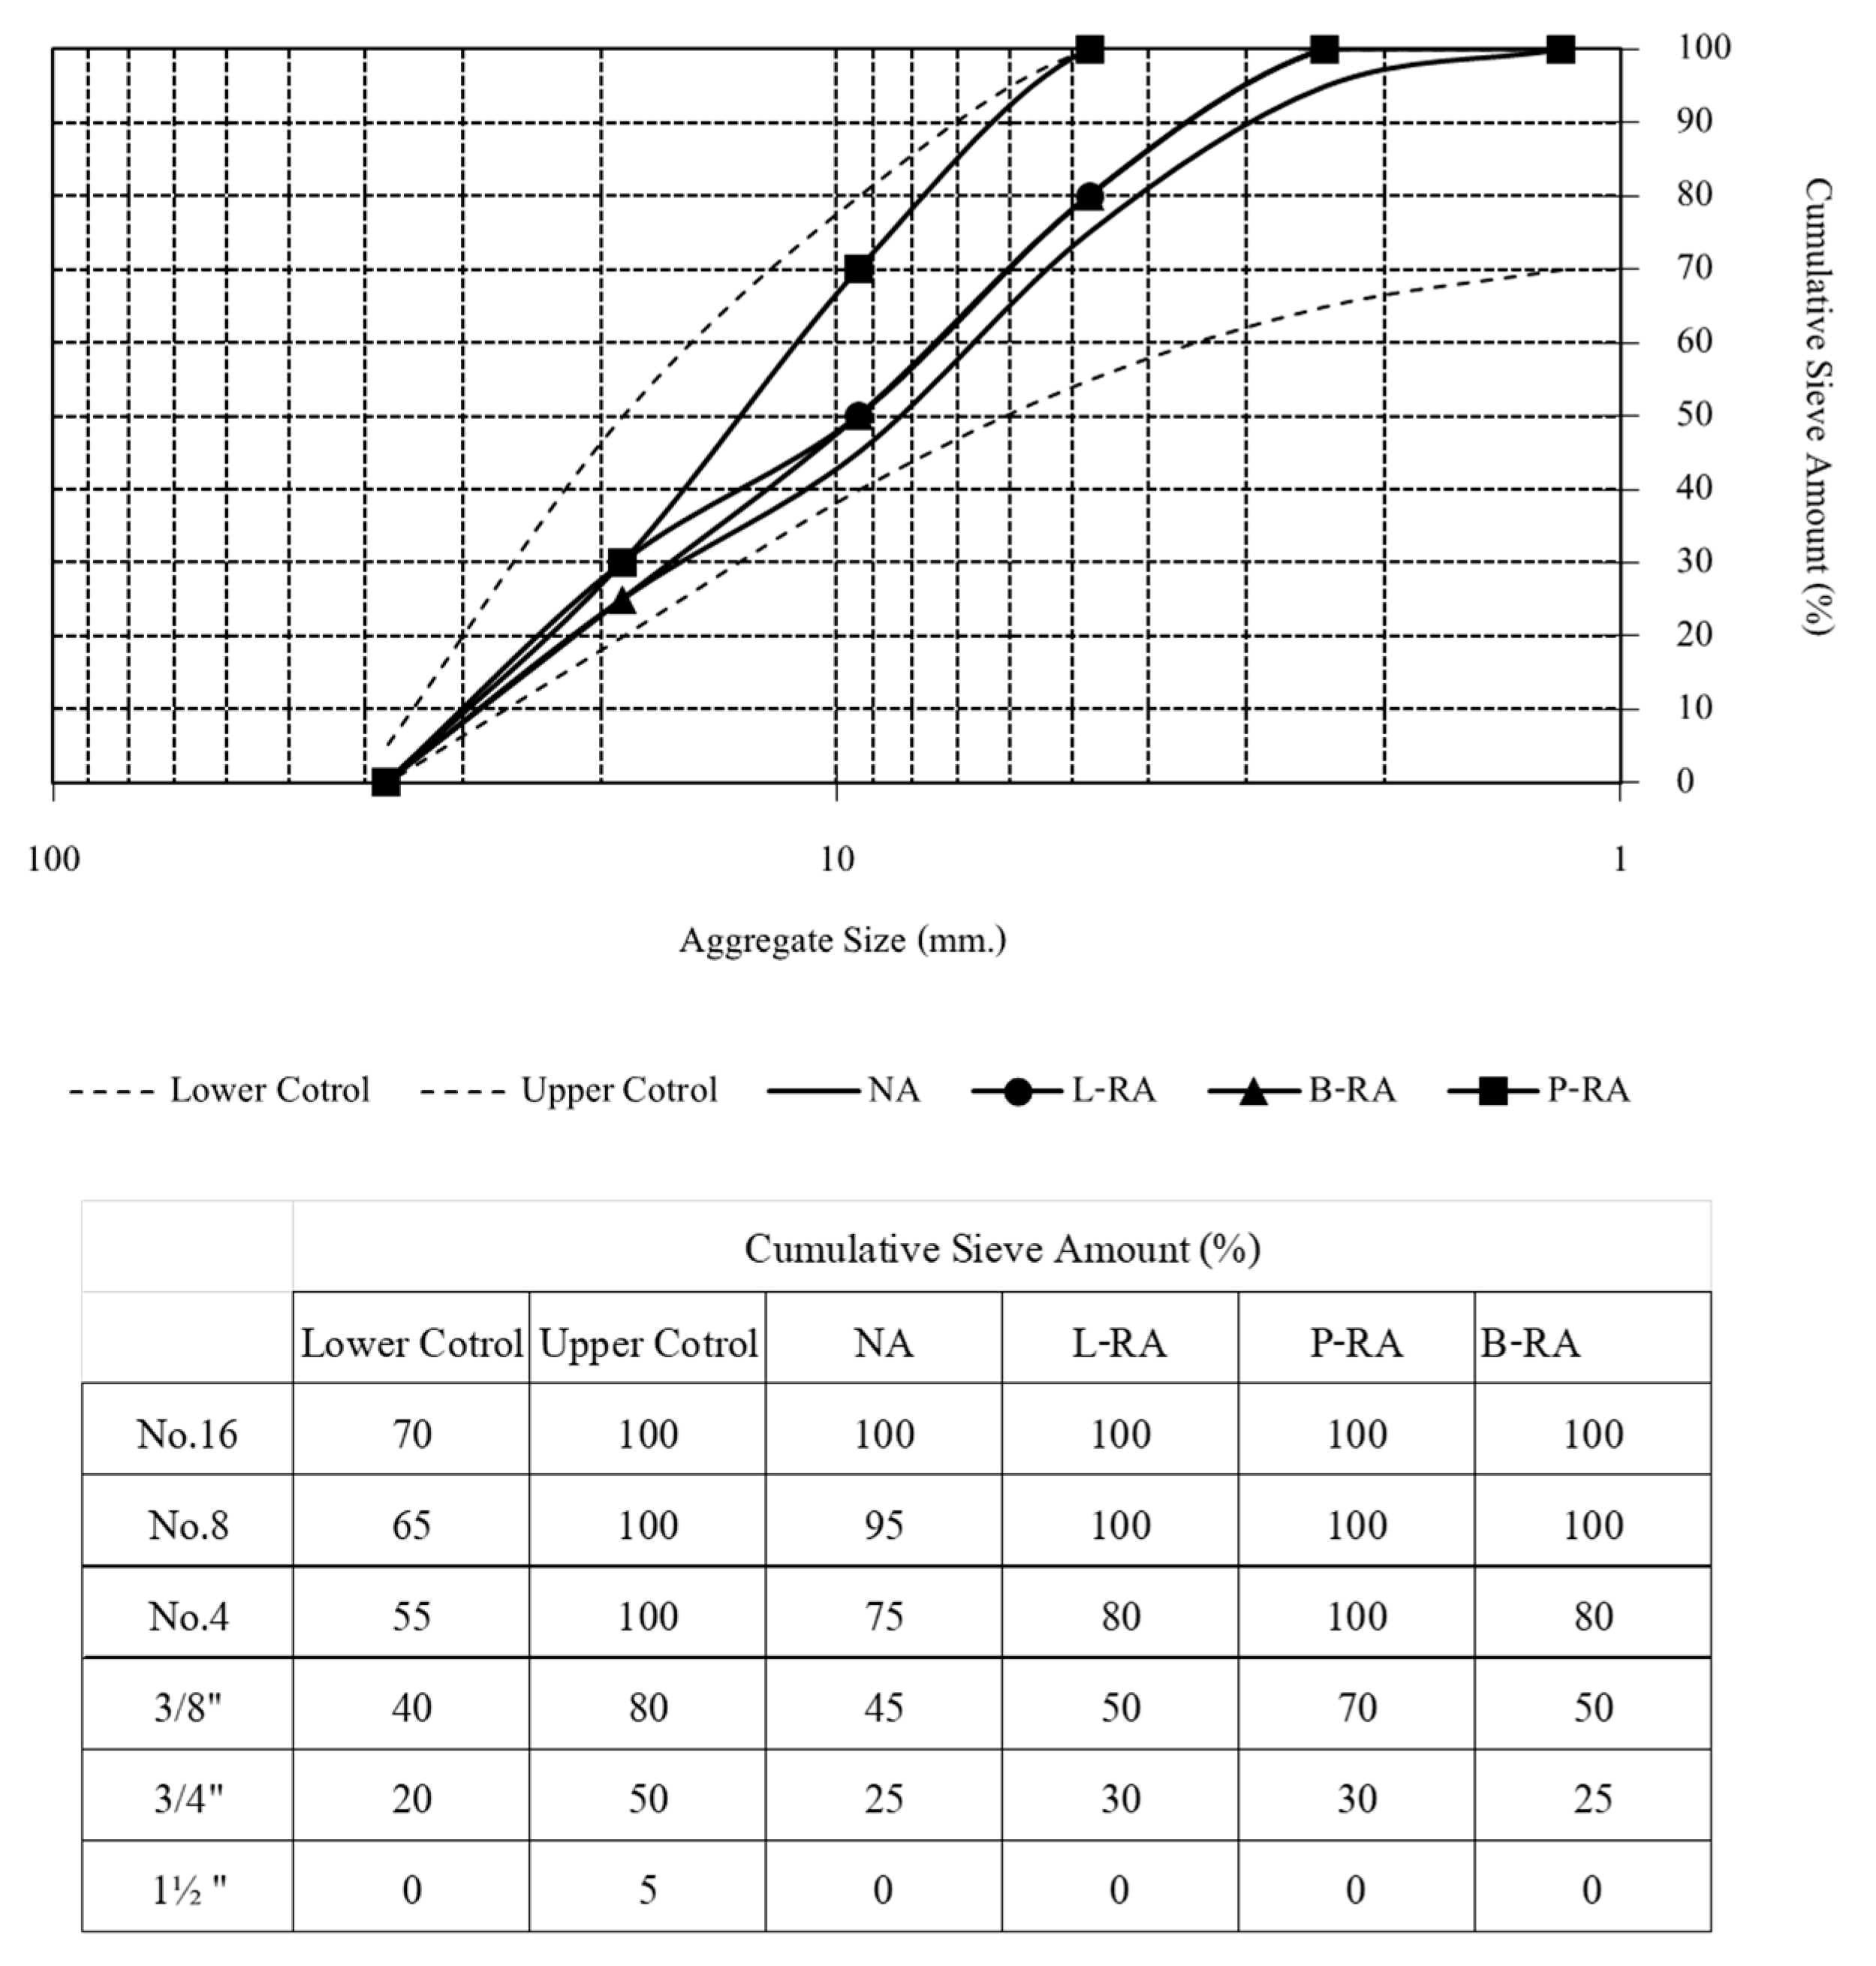
2.1. Aggregate
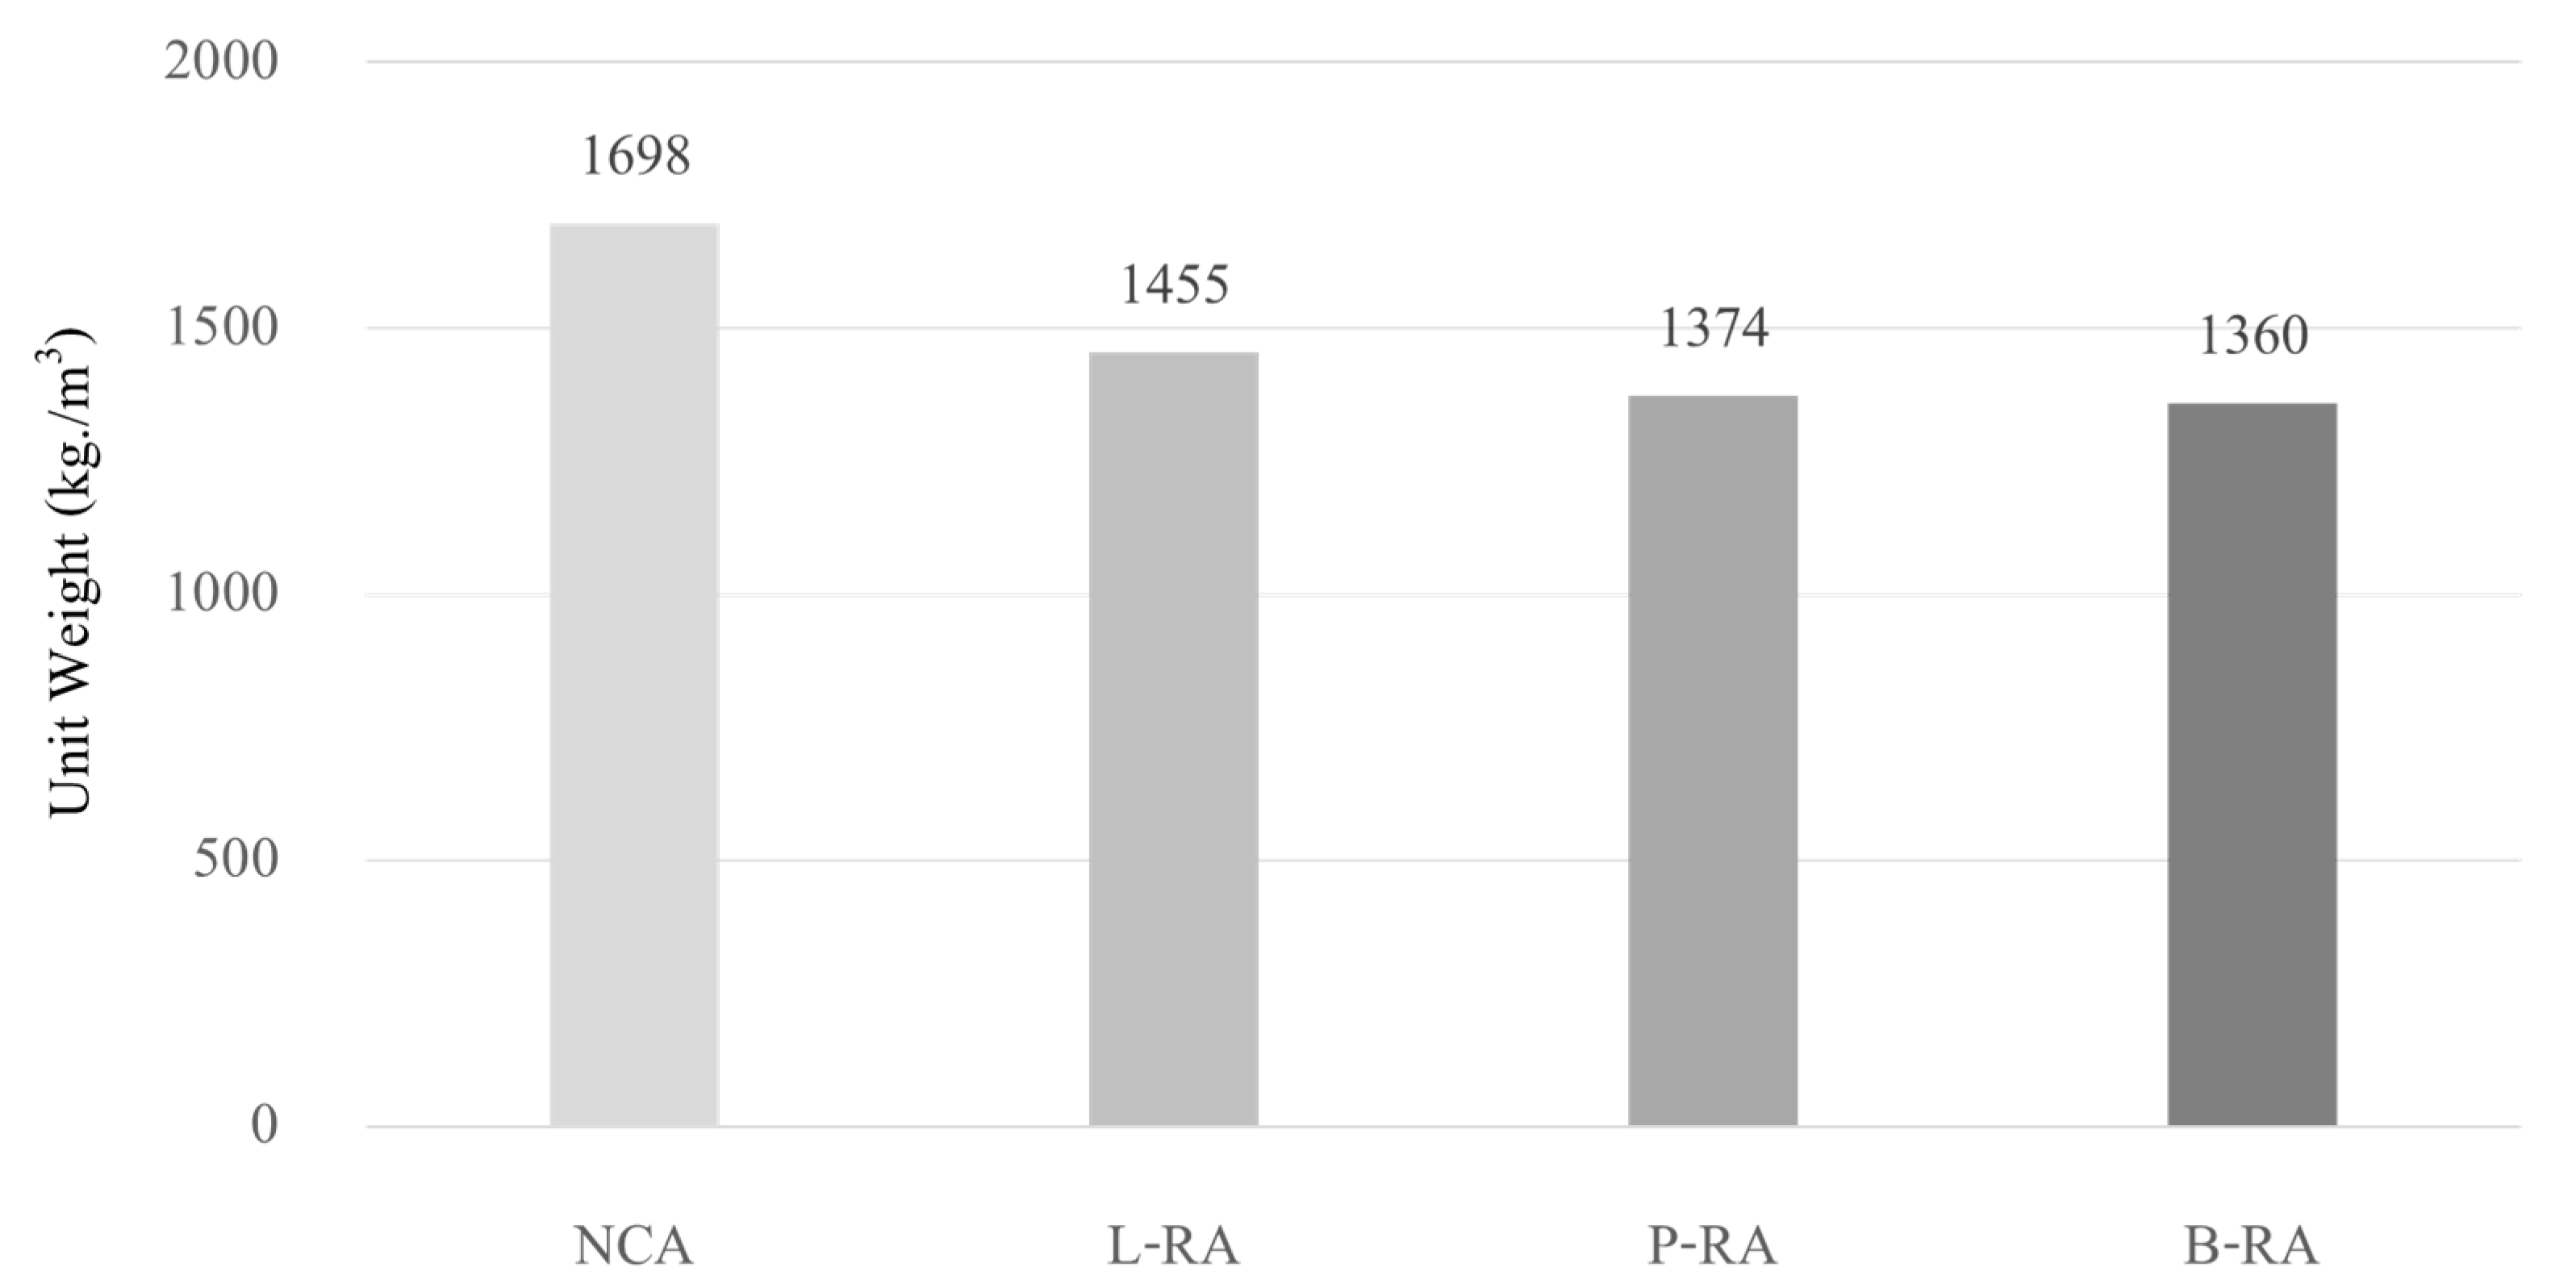
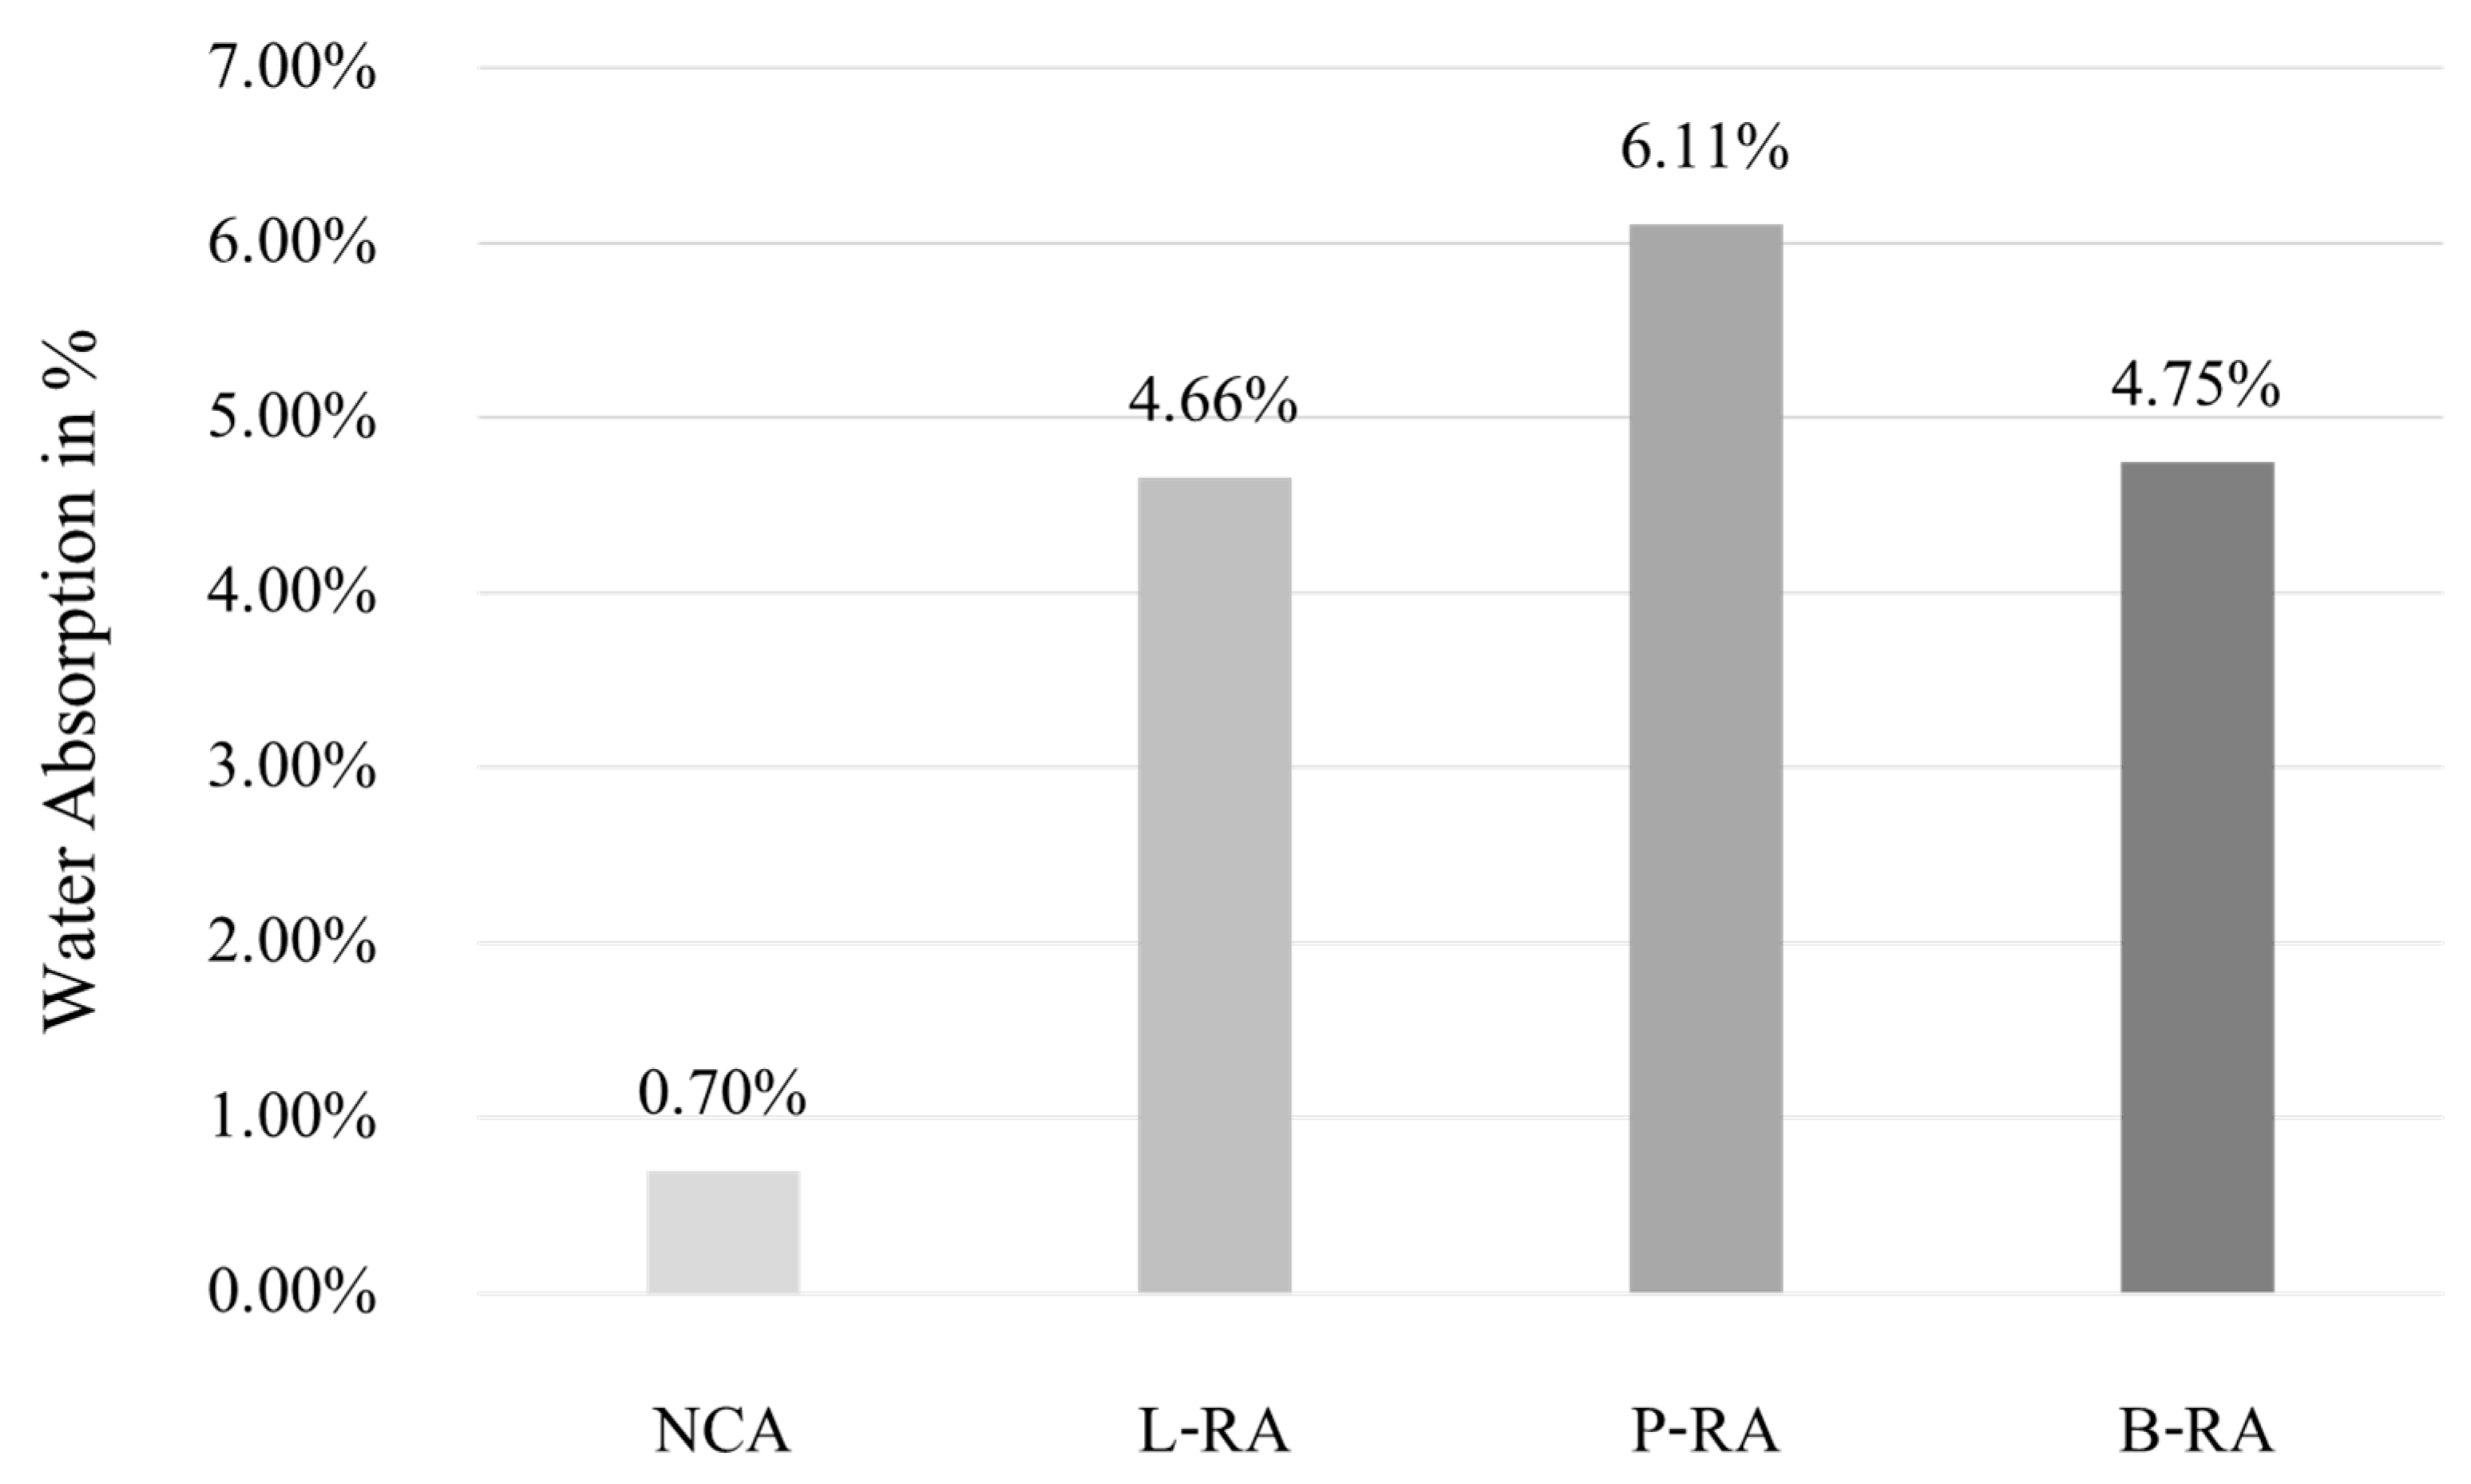
2.2. Unit Weight and Absorption Rate of Aggregate
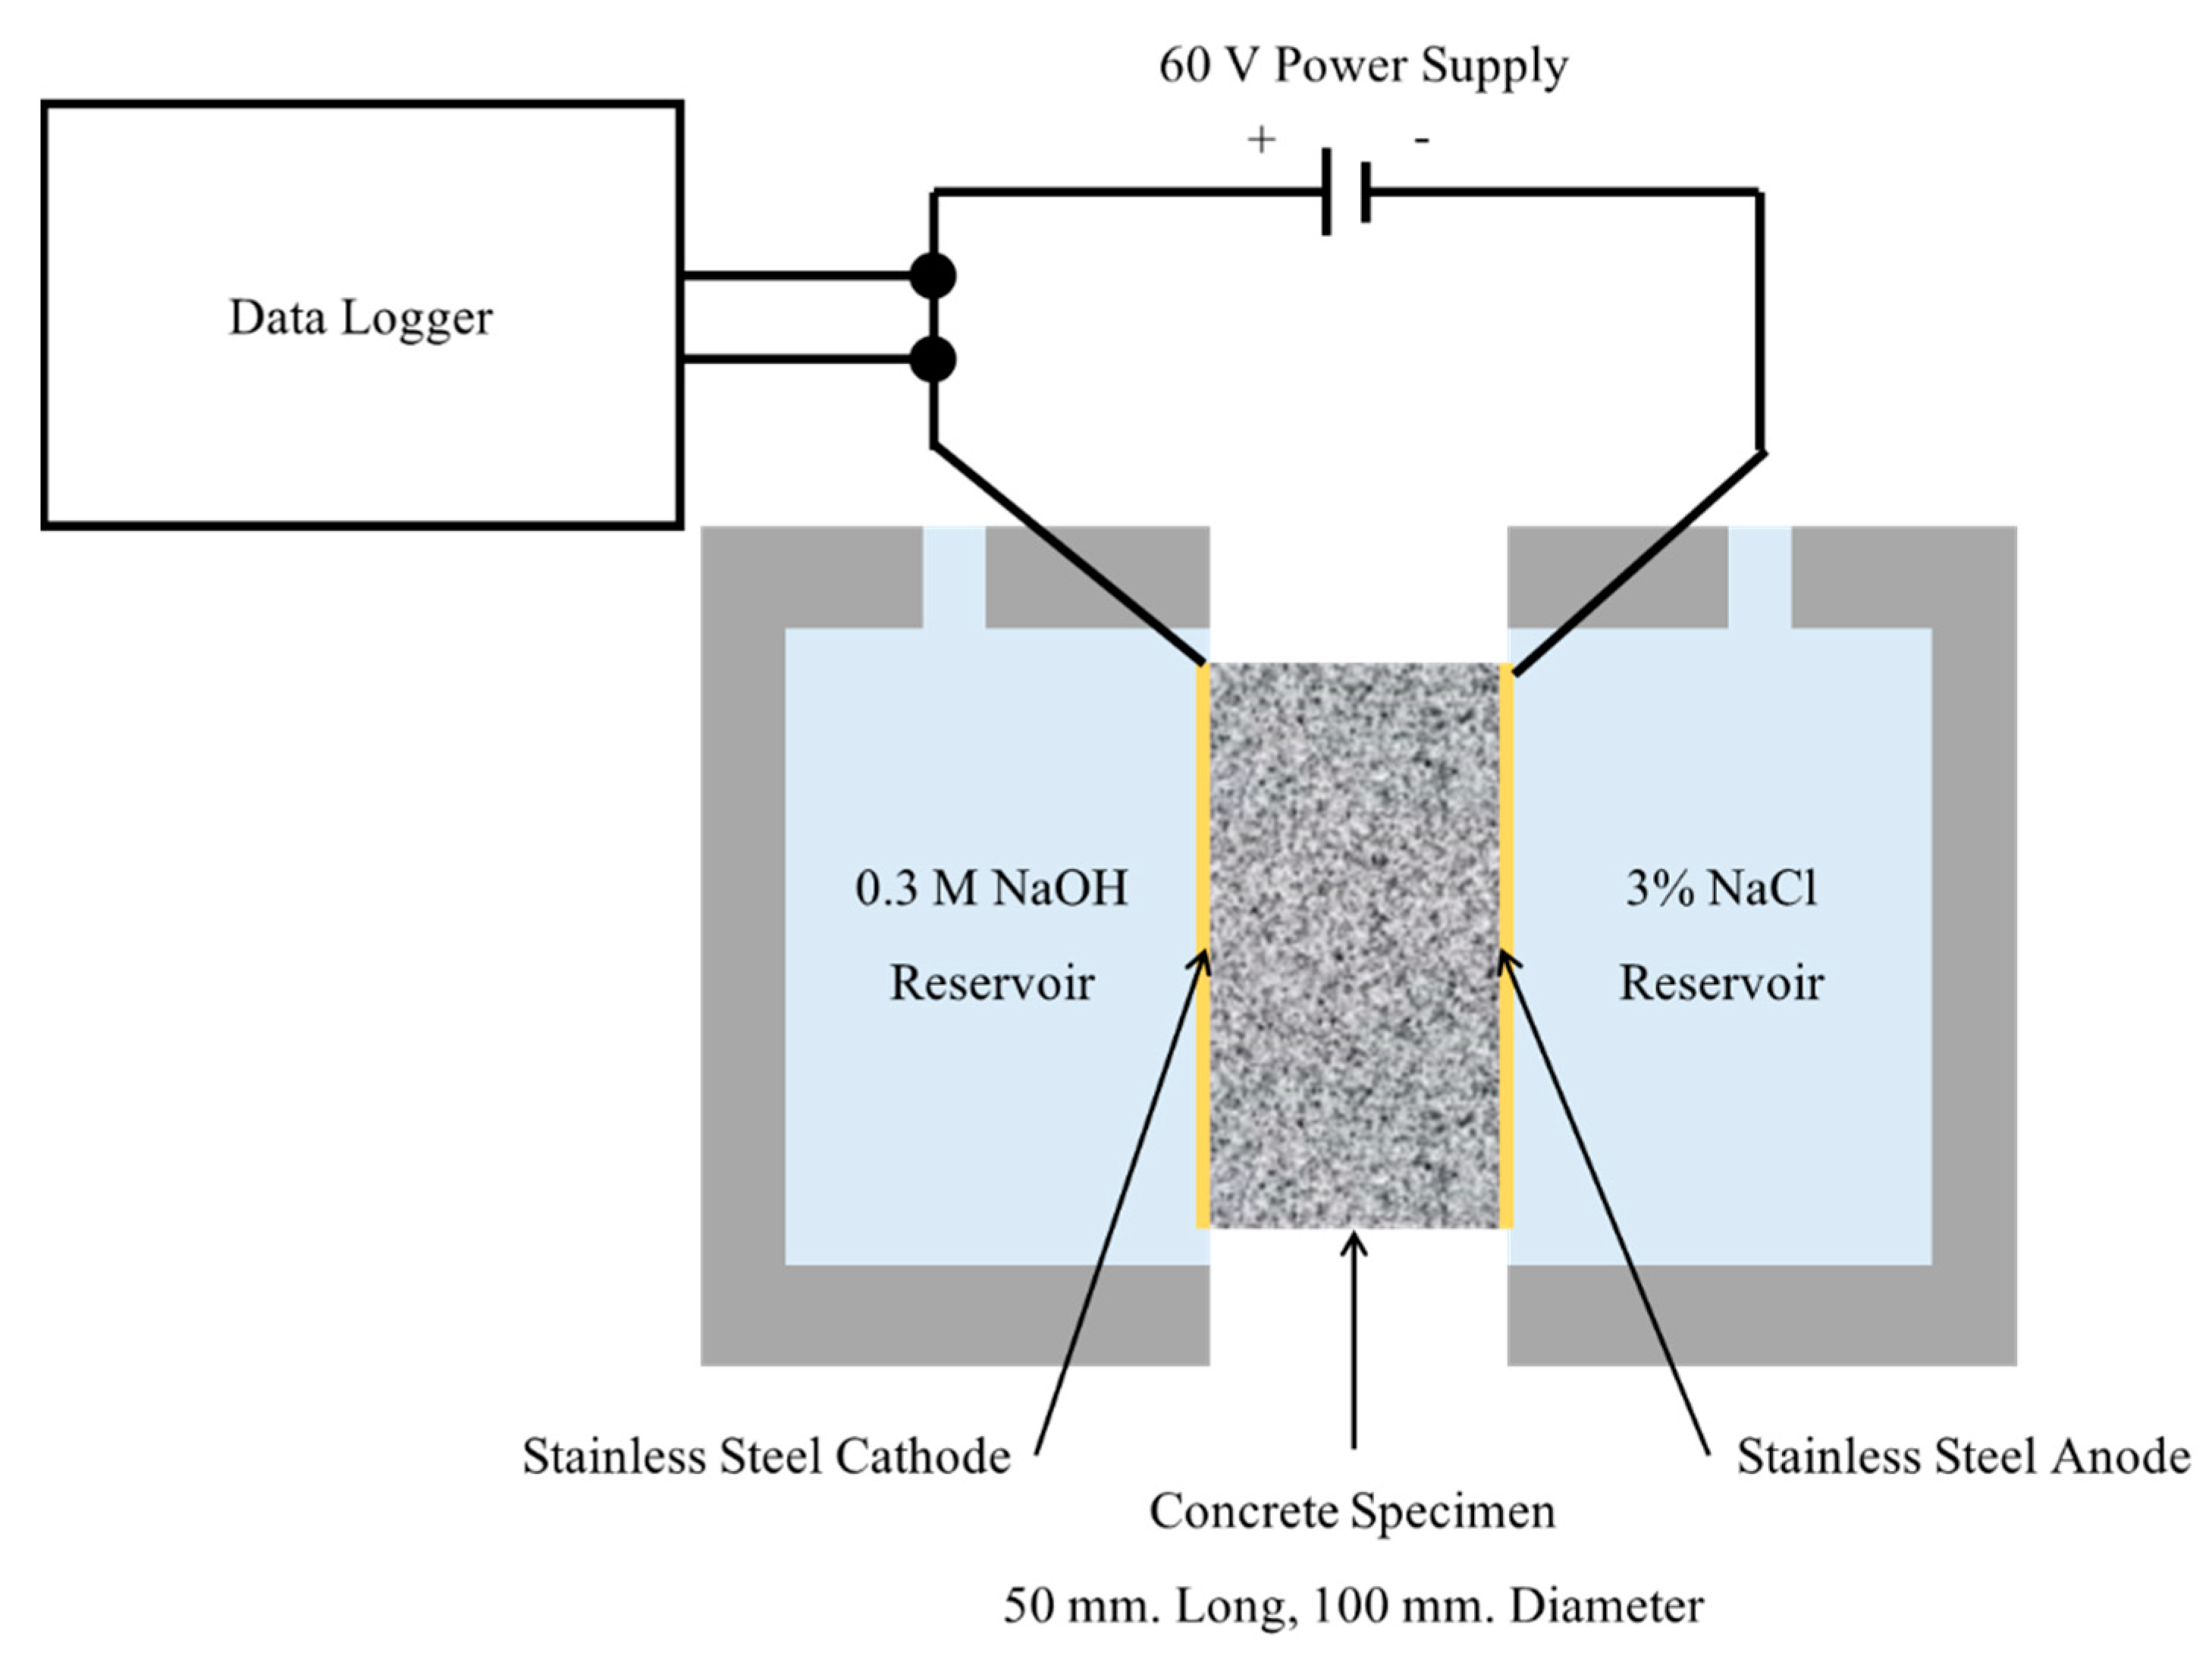
2.3. Rapid Chloride Penetration
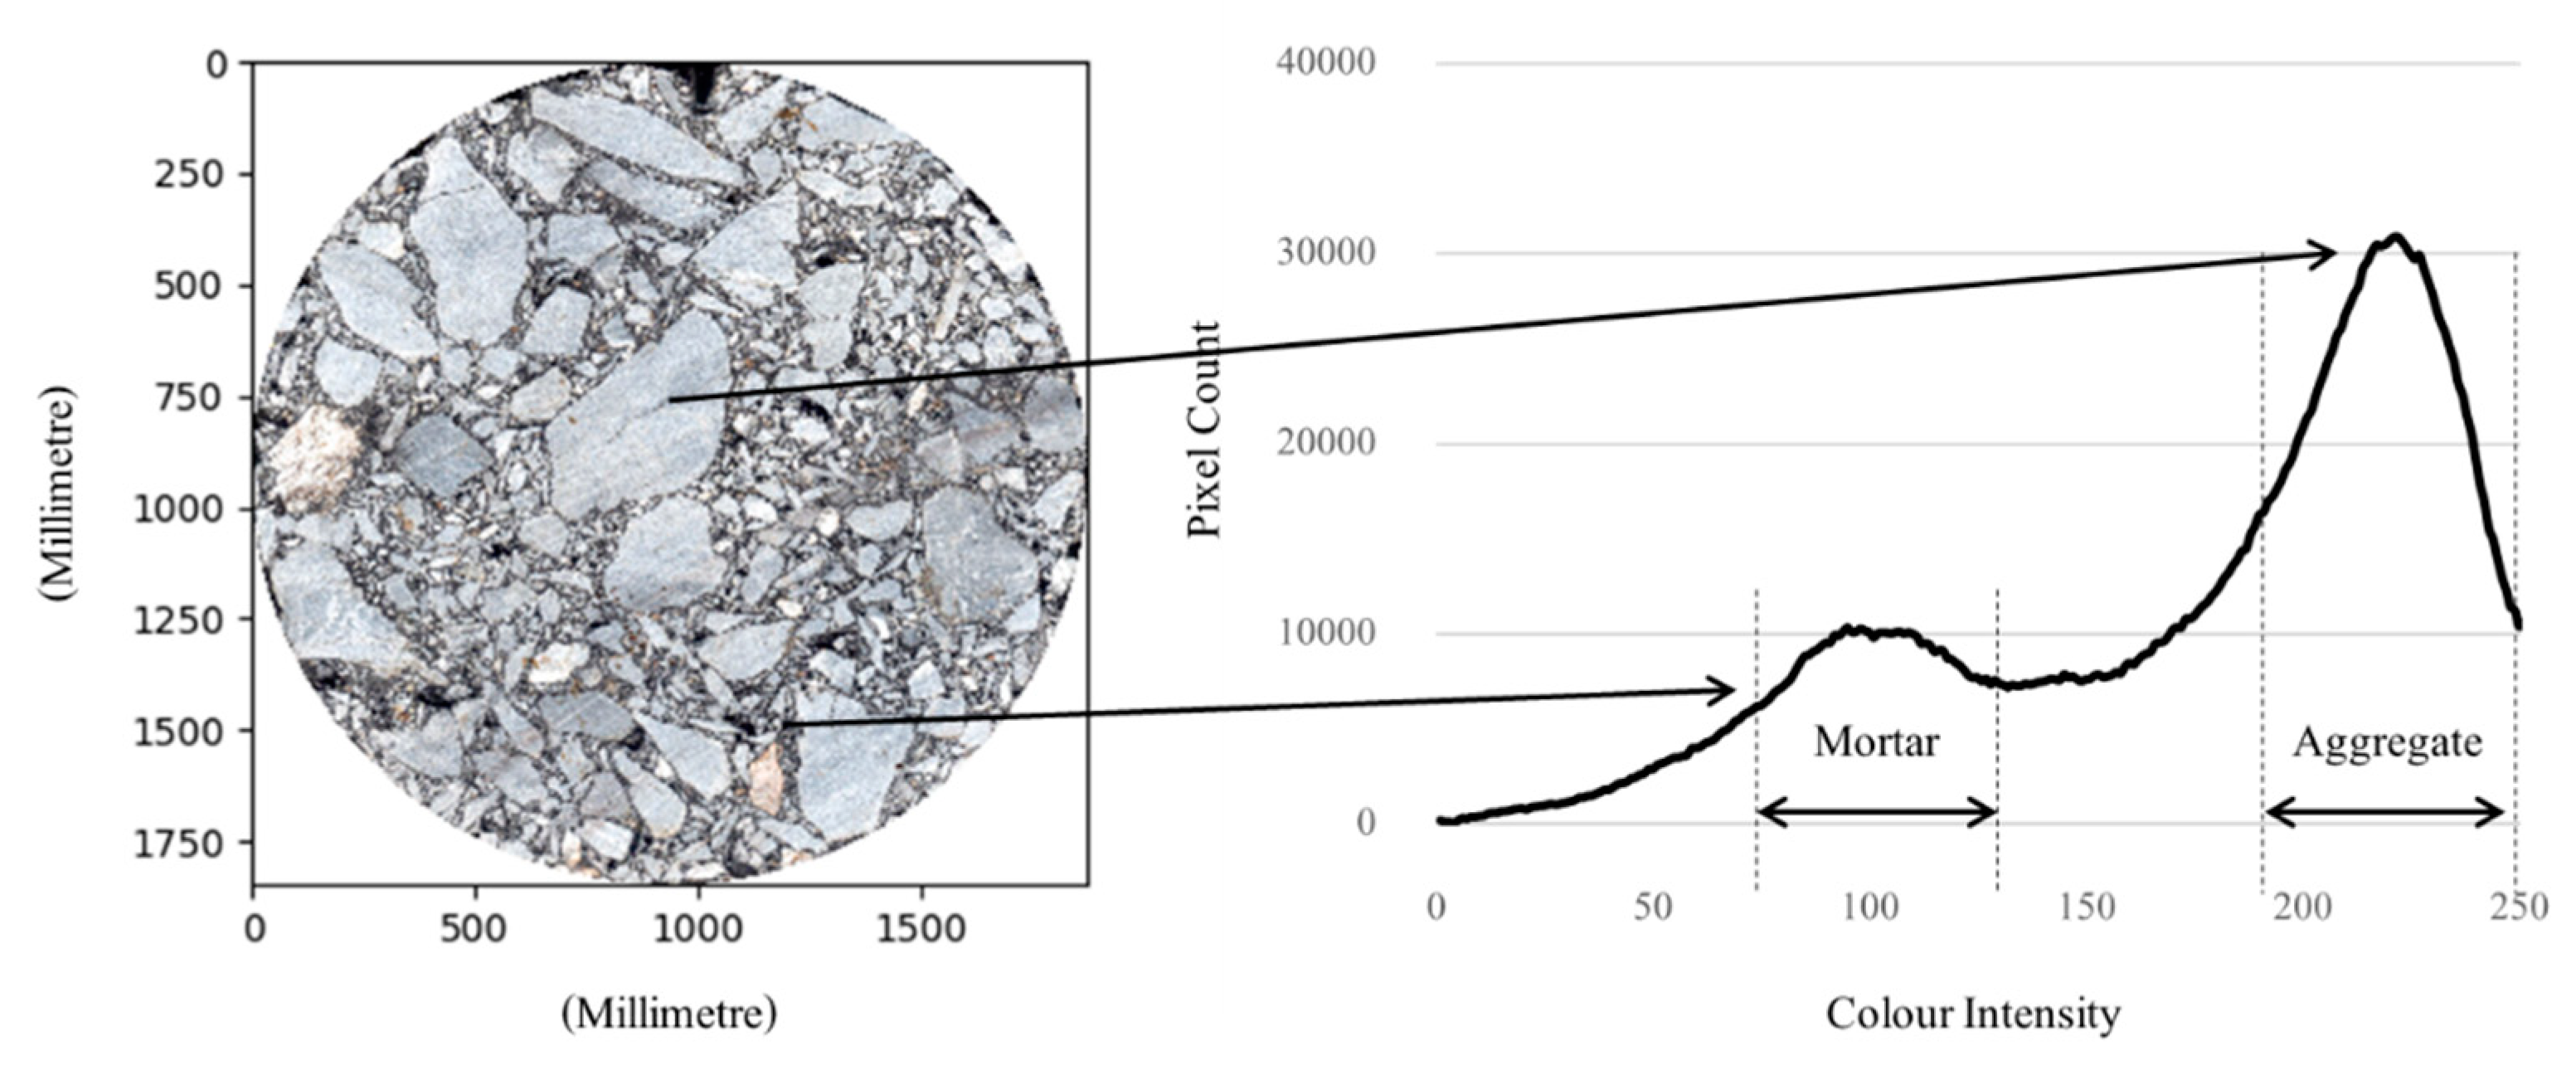
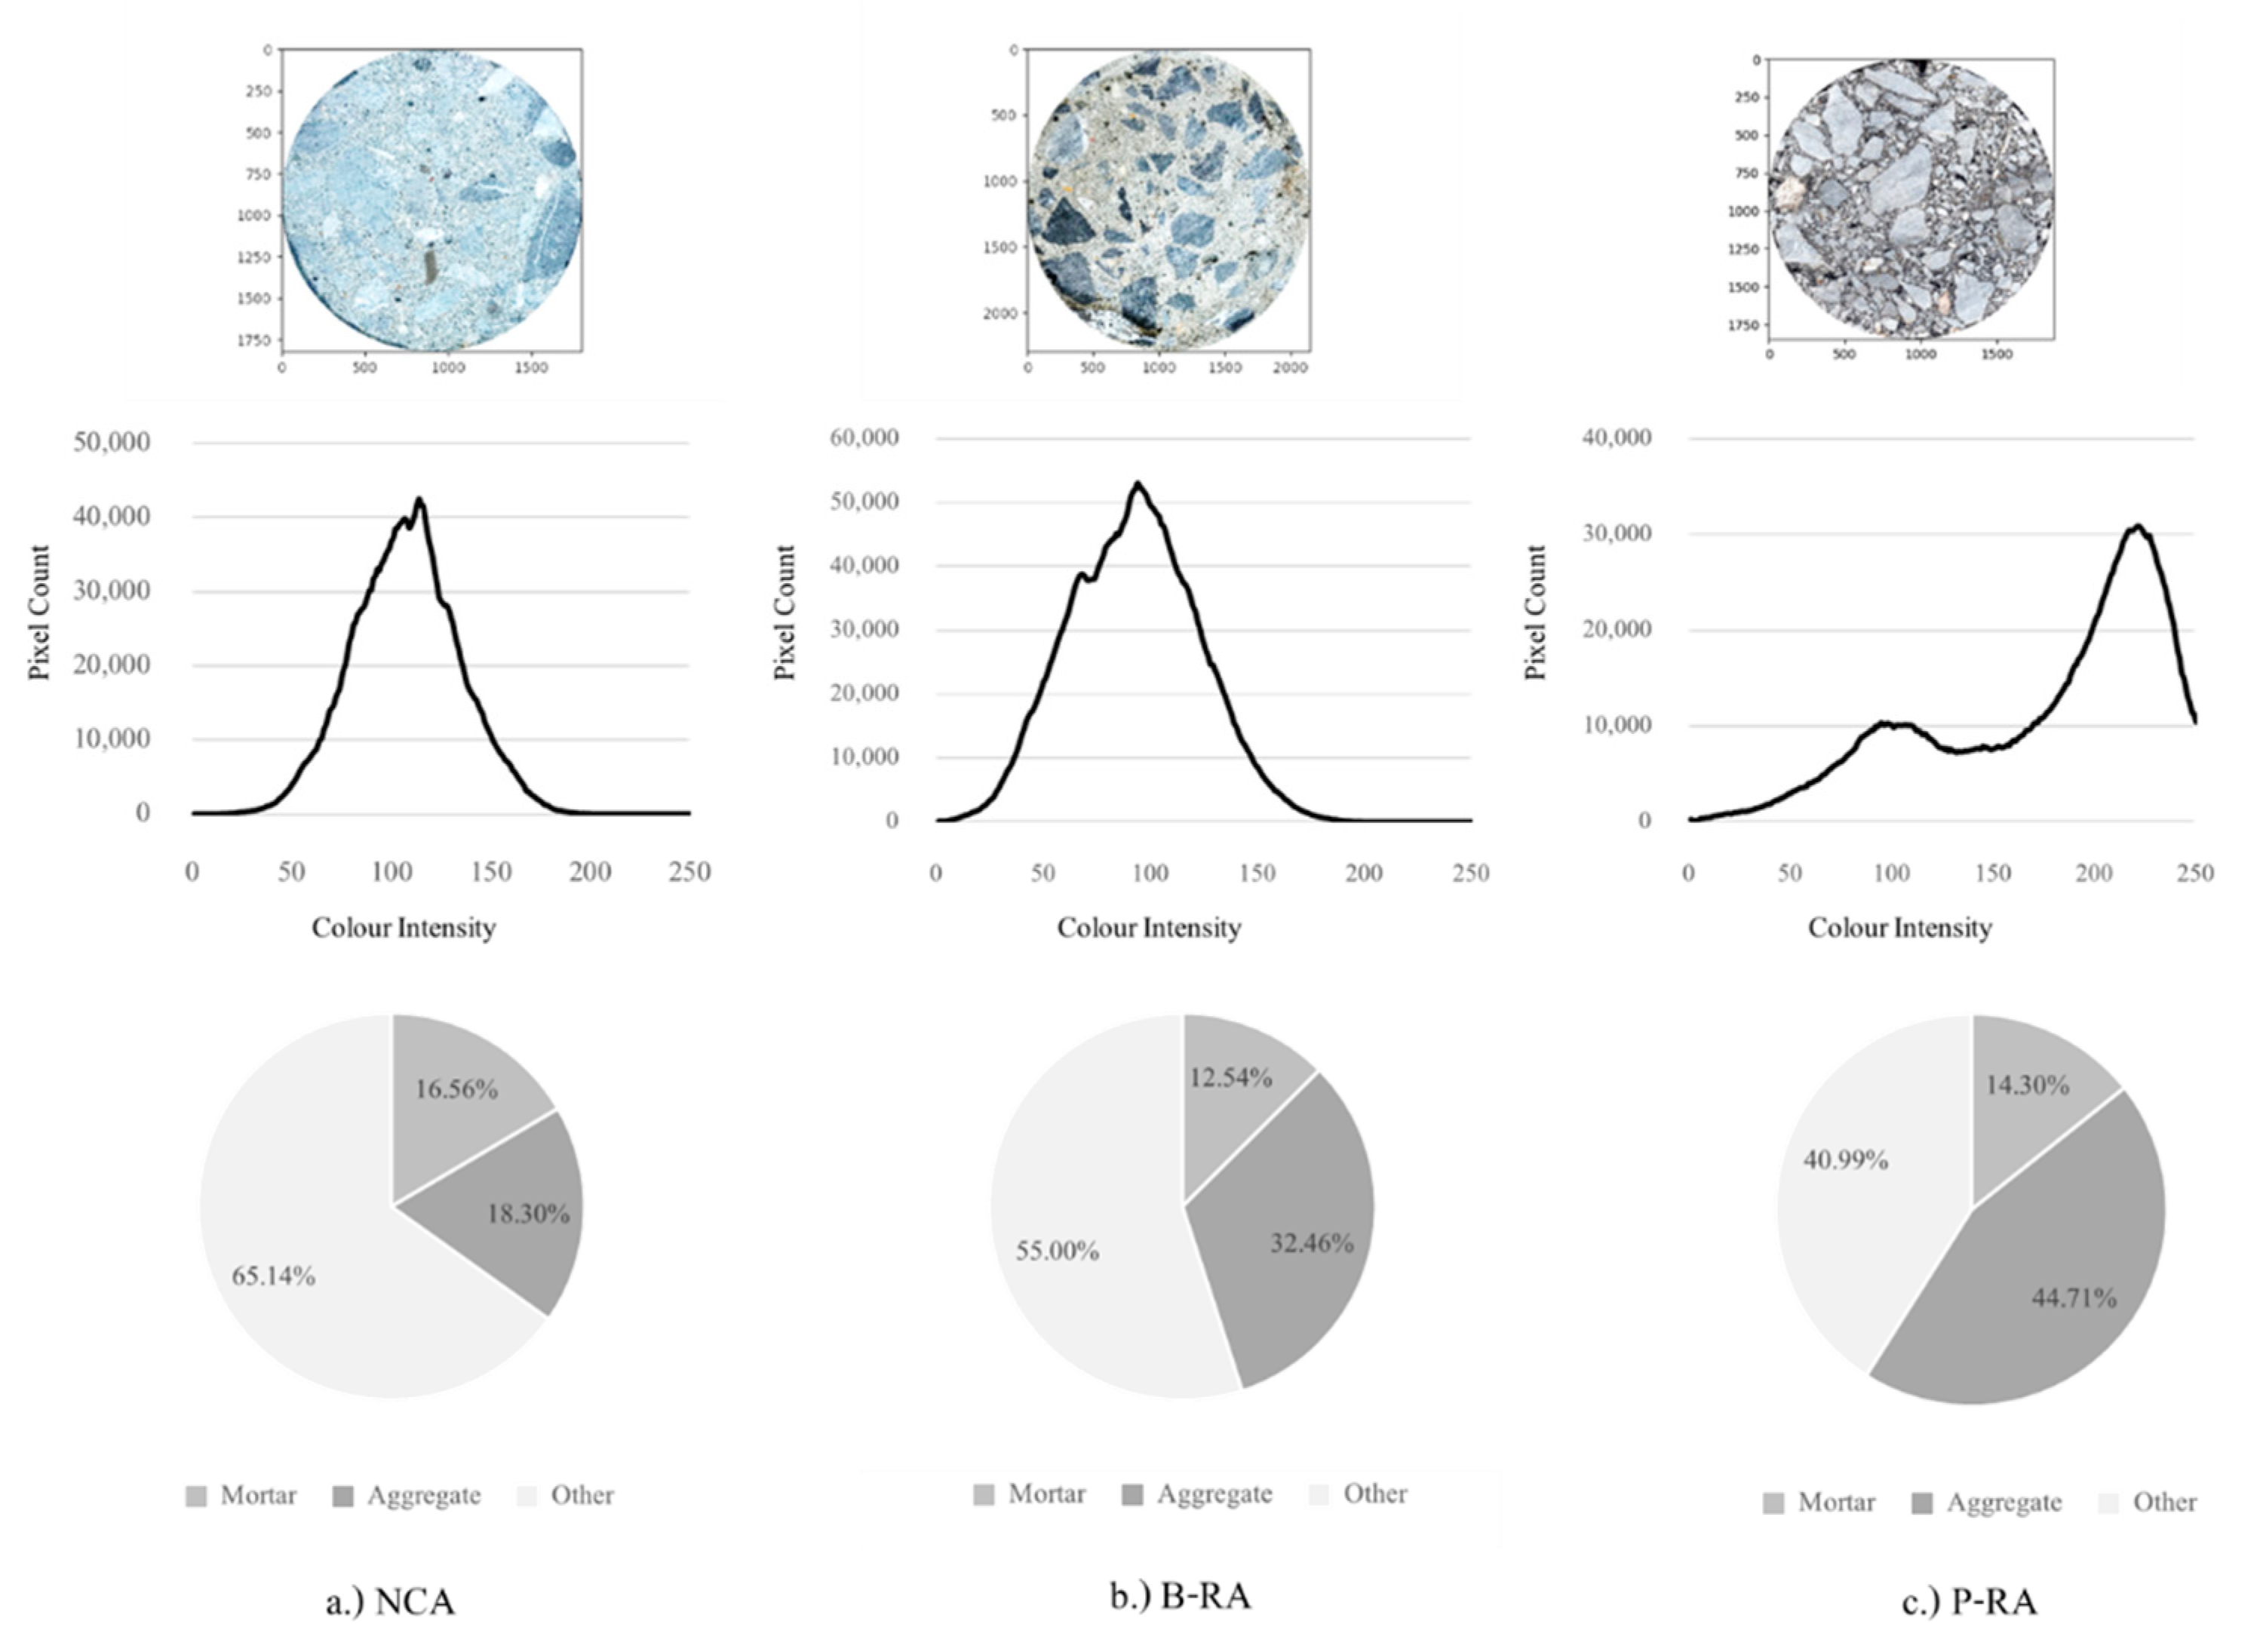
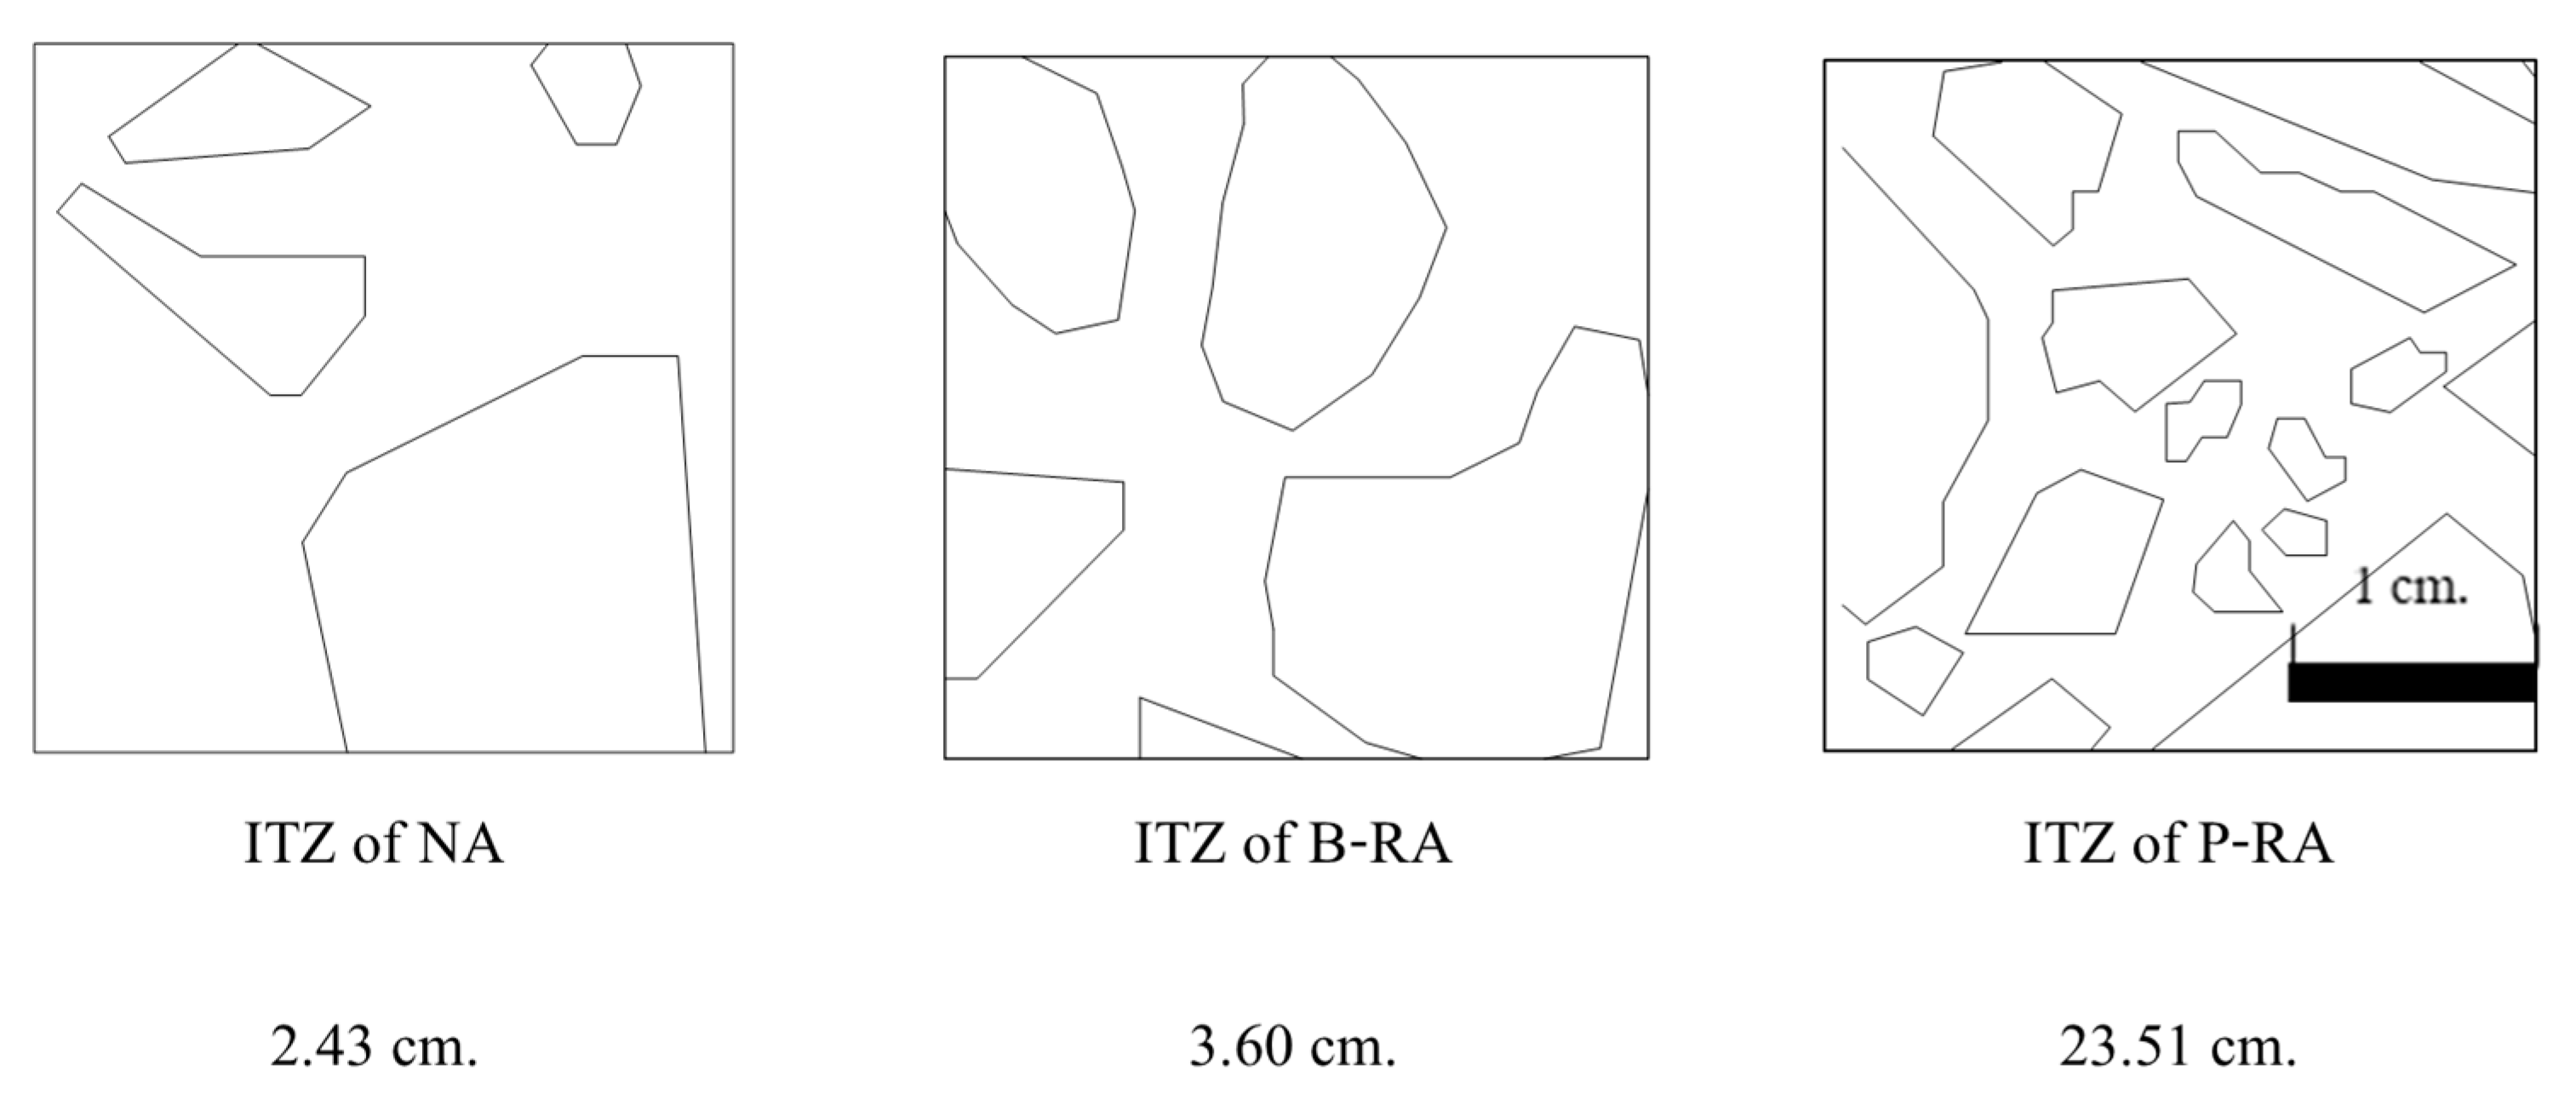
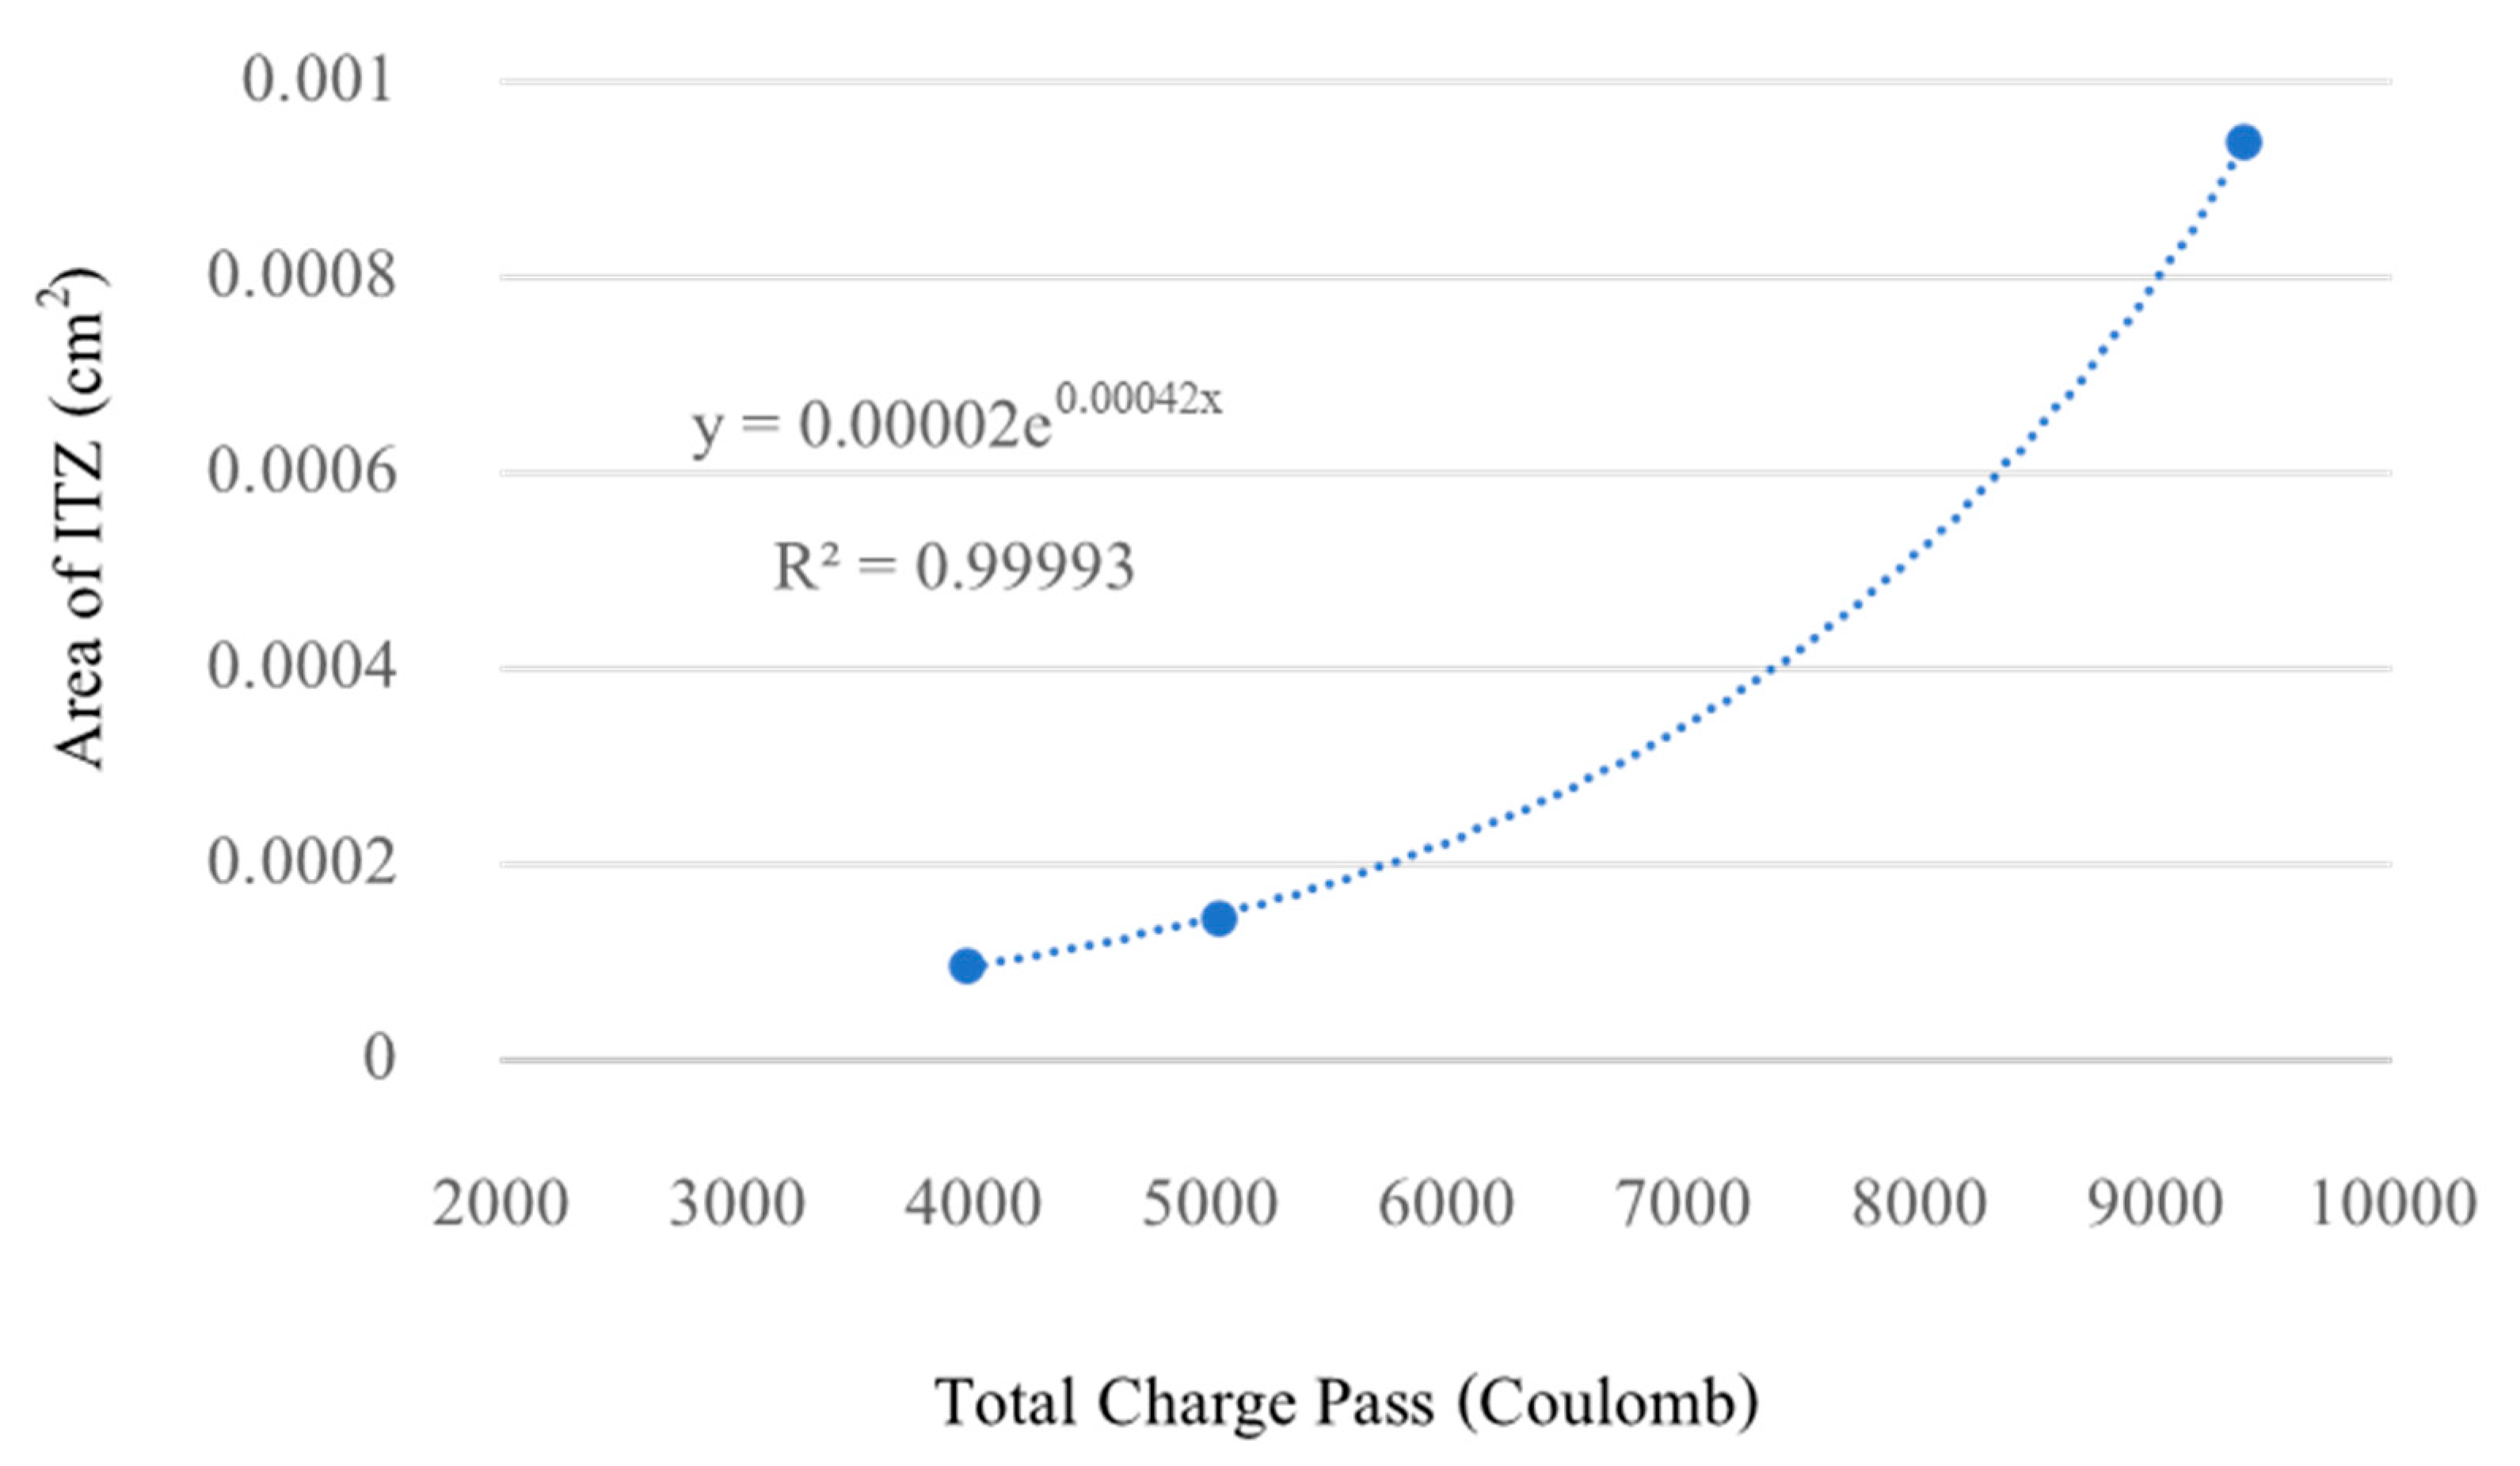
2.4. Image Processing
3. Results
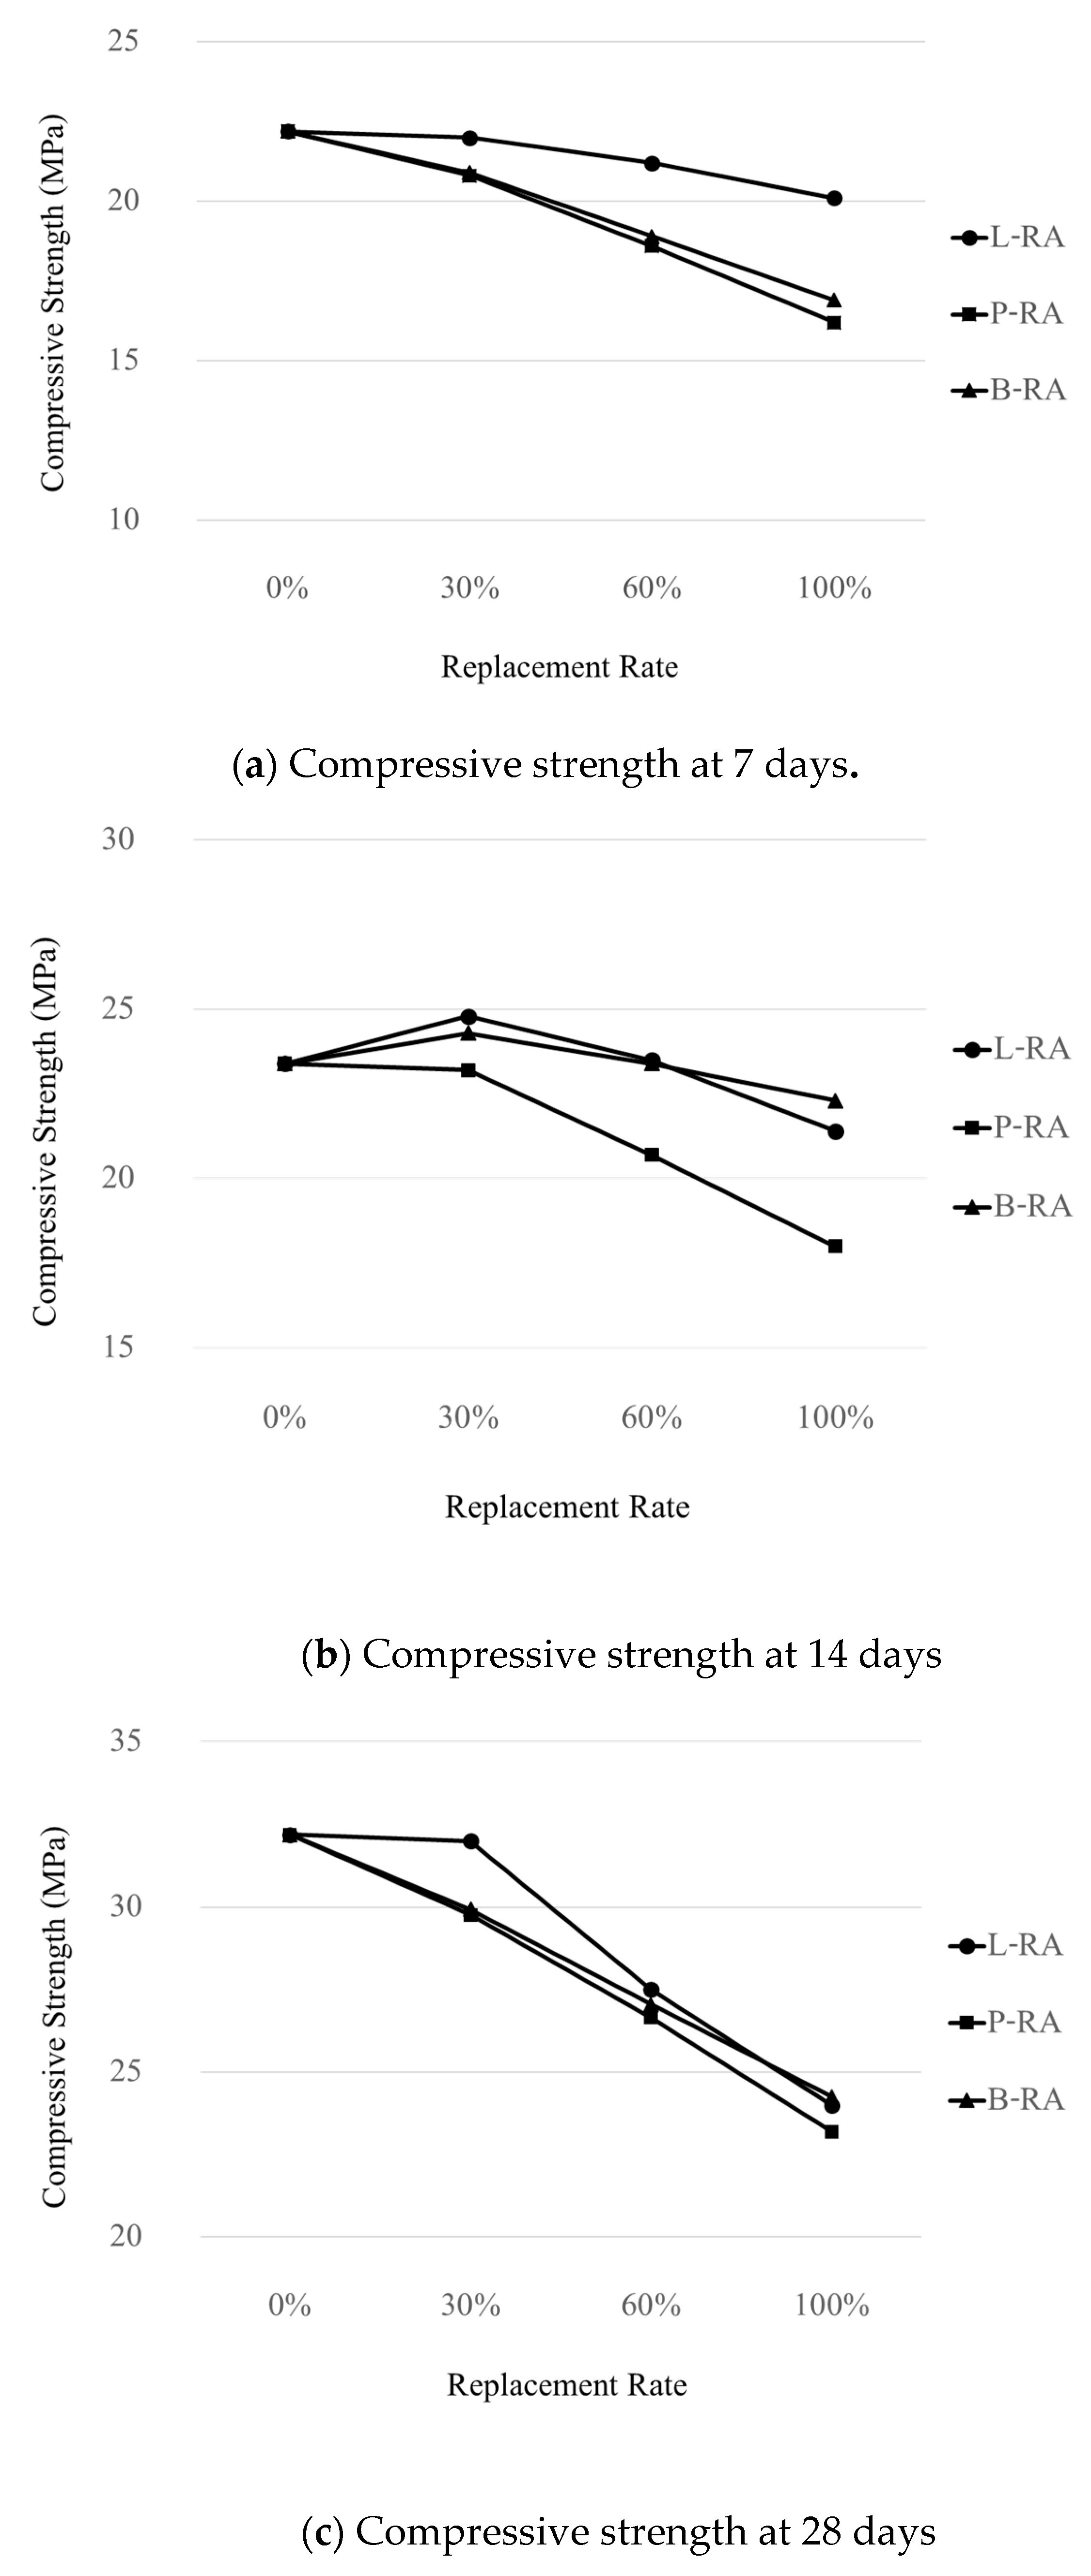
3.1. Compressive Strength
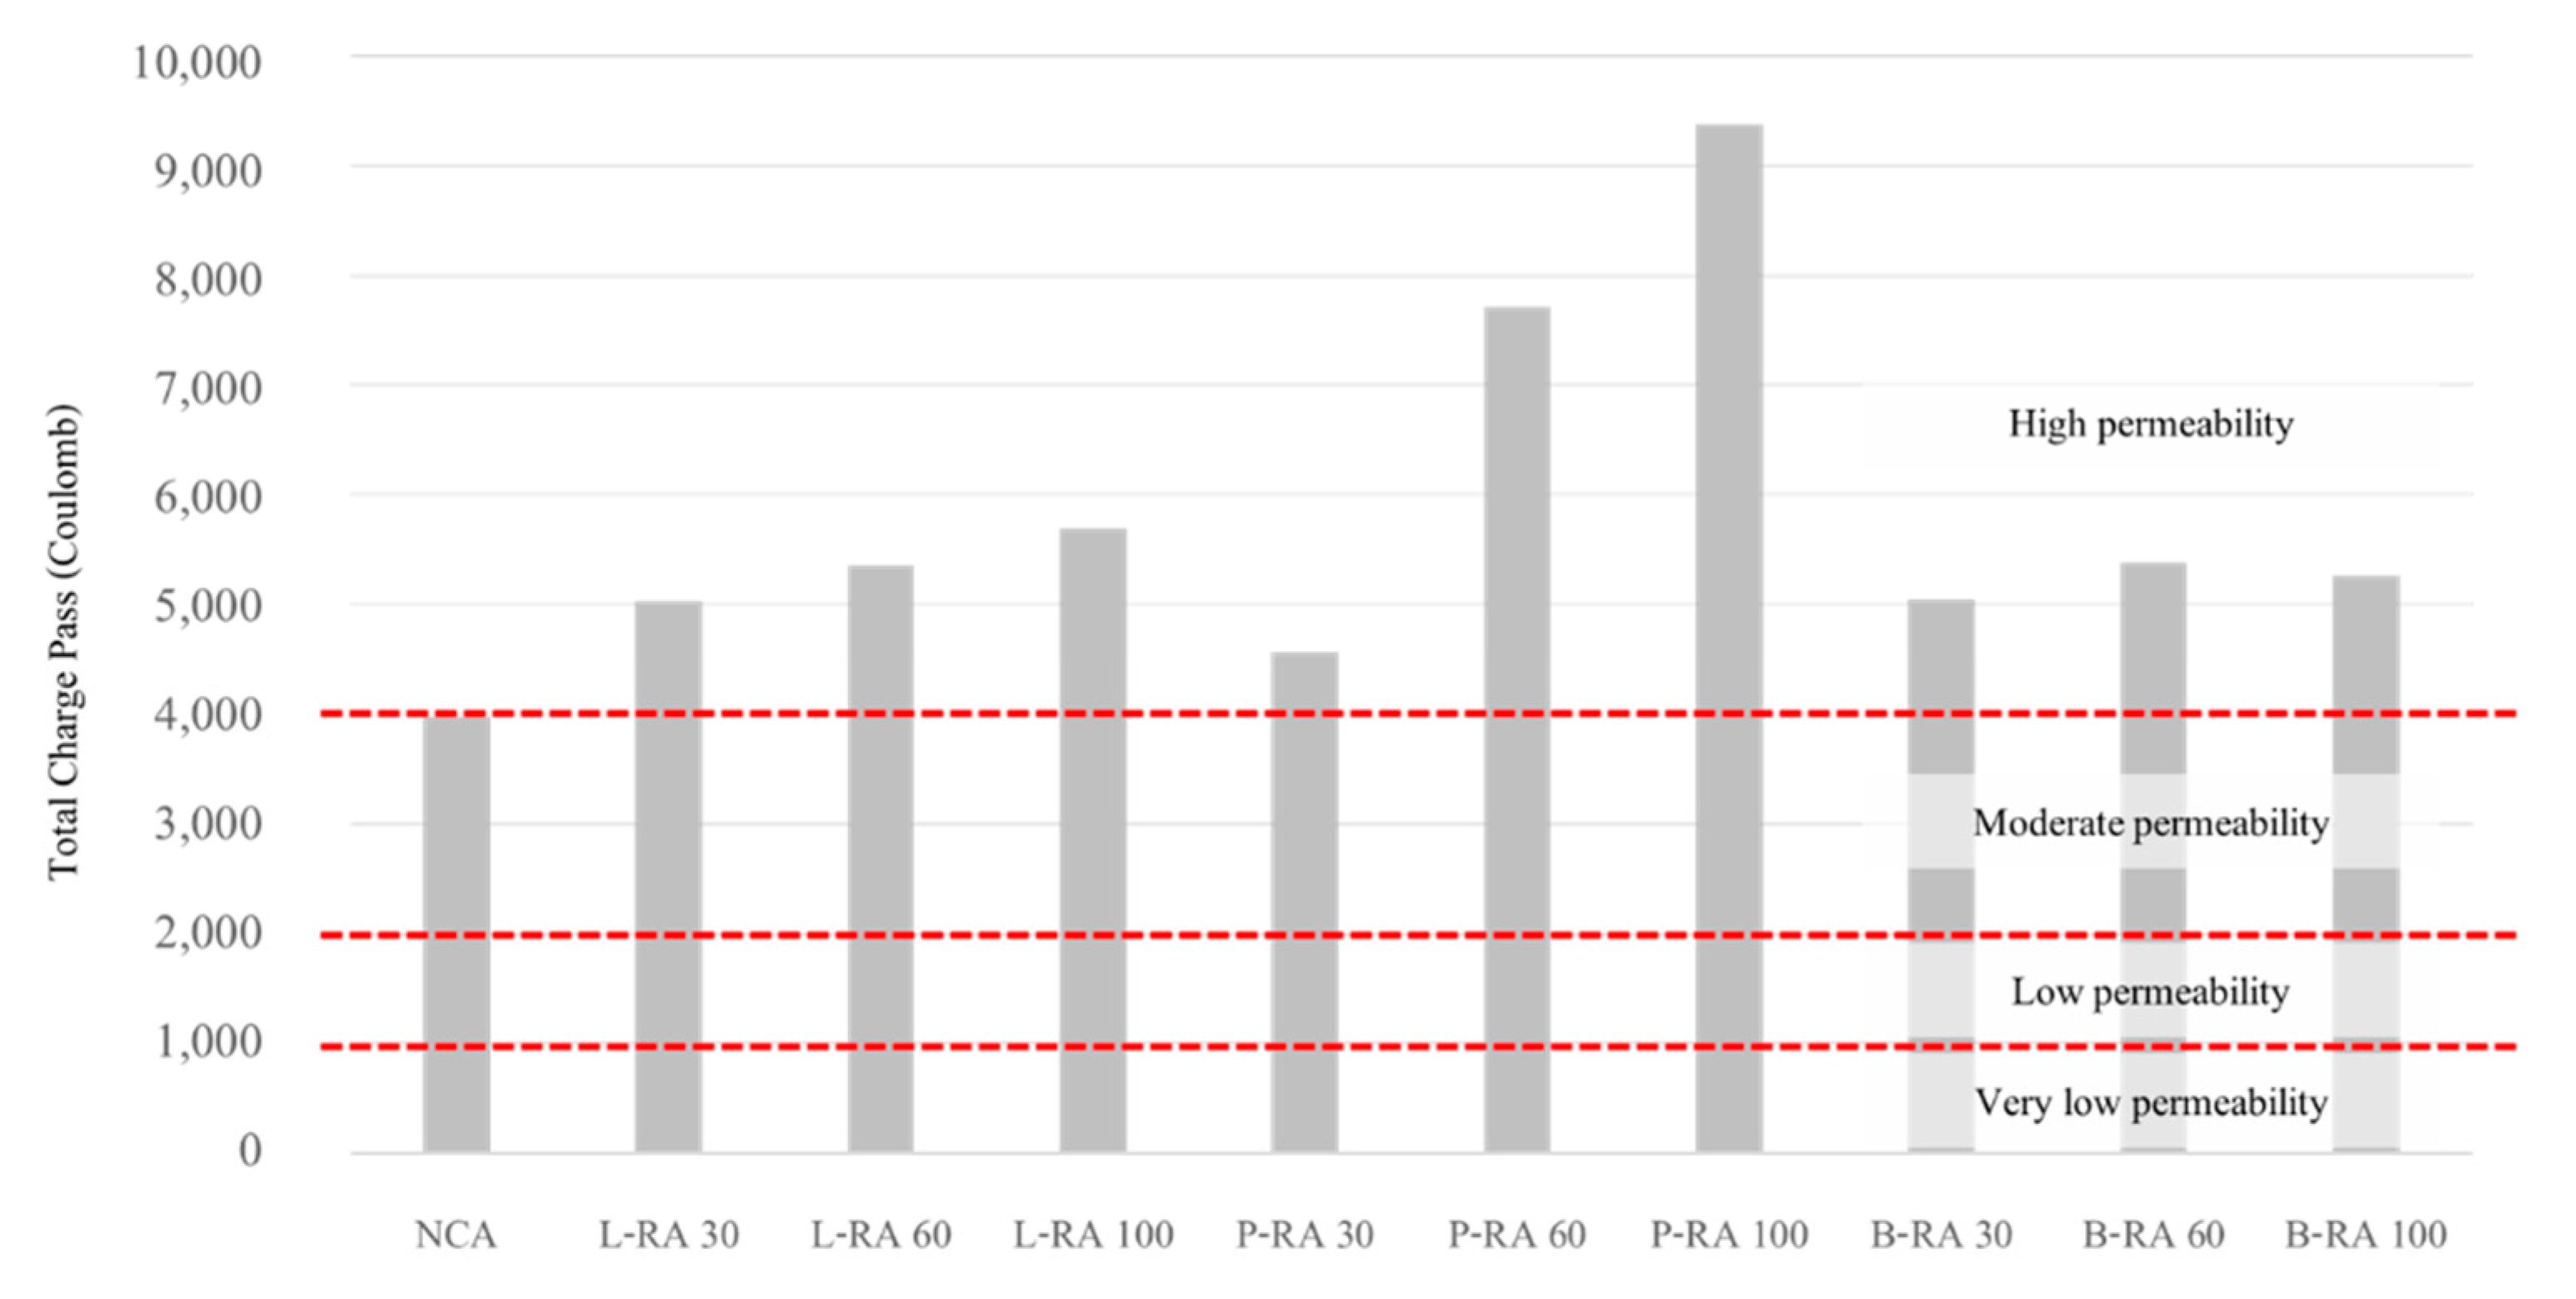
3.2. Chloride Penetration Resistance
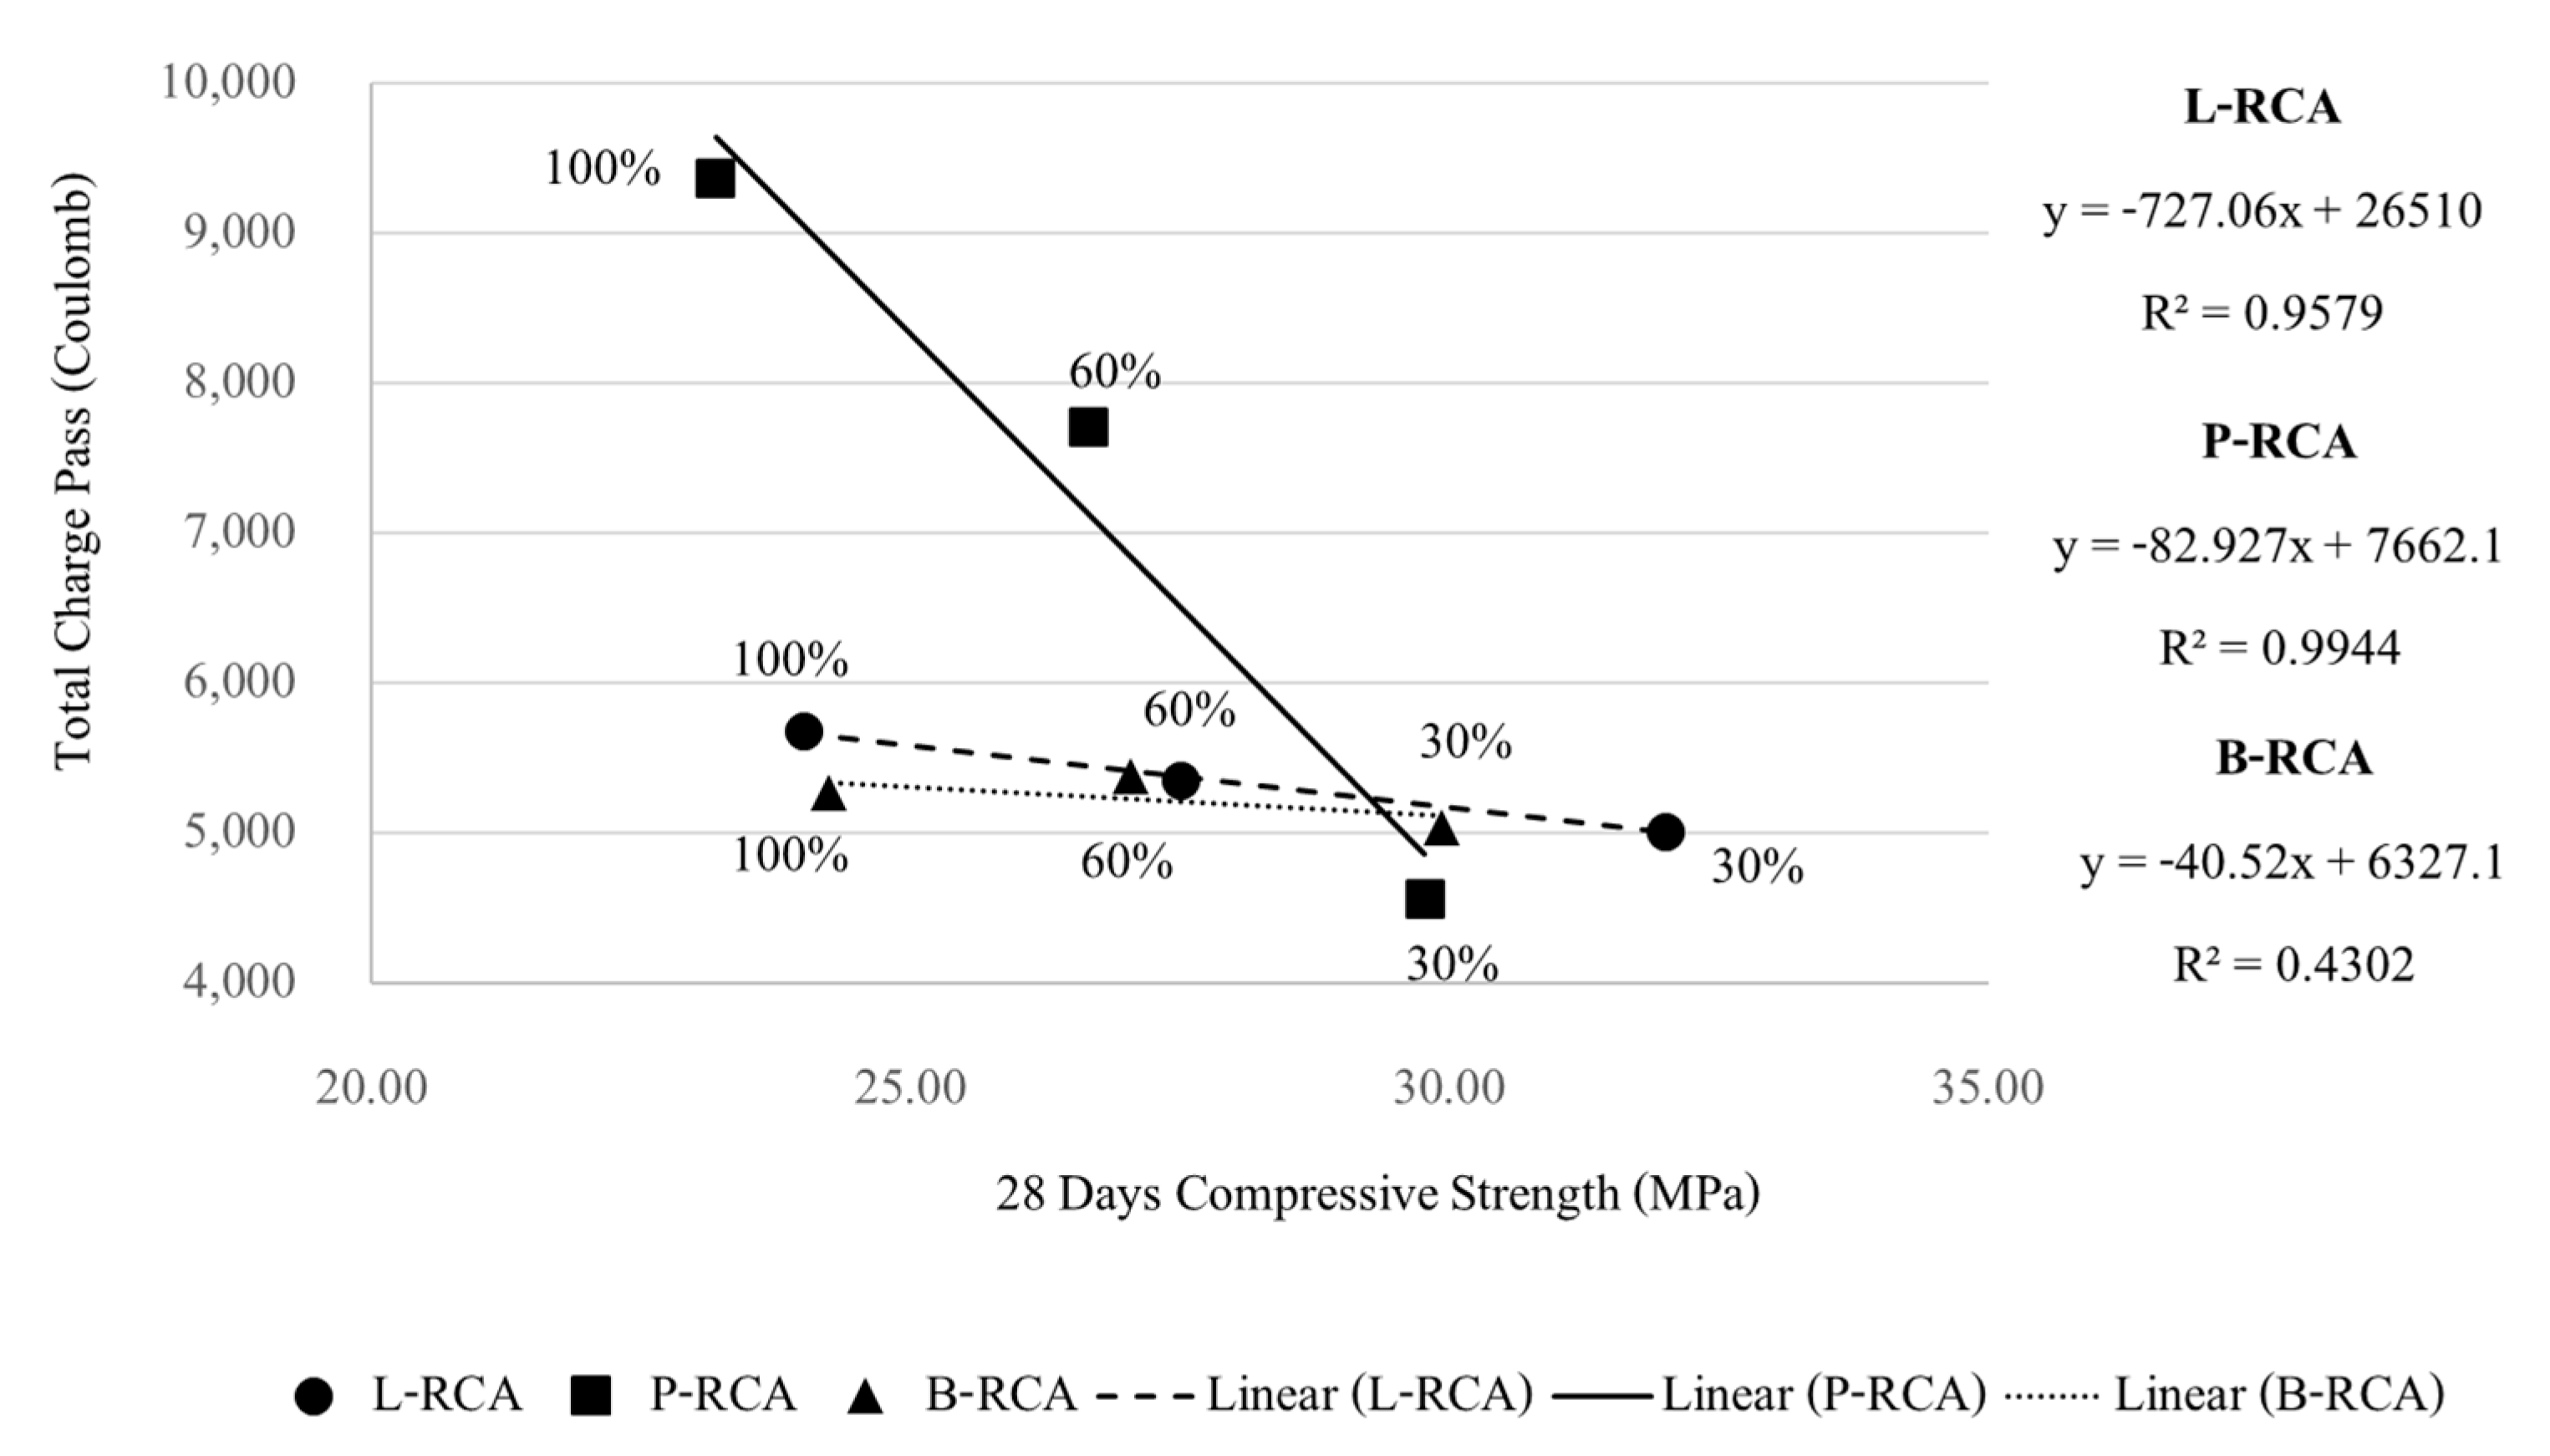
3.3. Chloride Penetration and Compressive Strength
4. Discussion
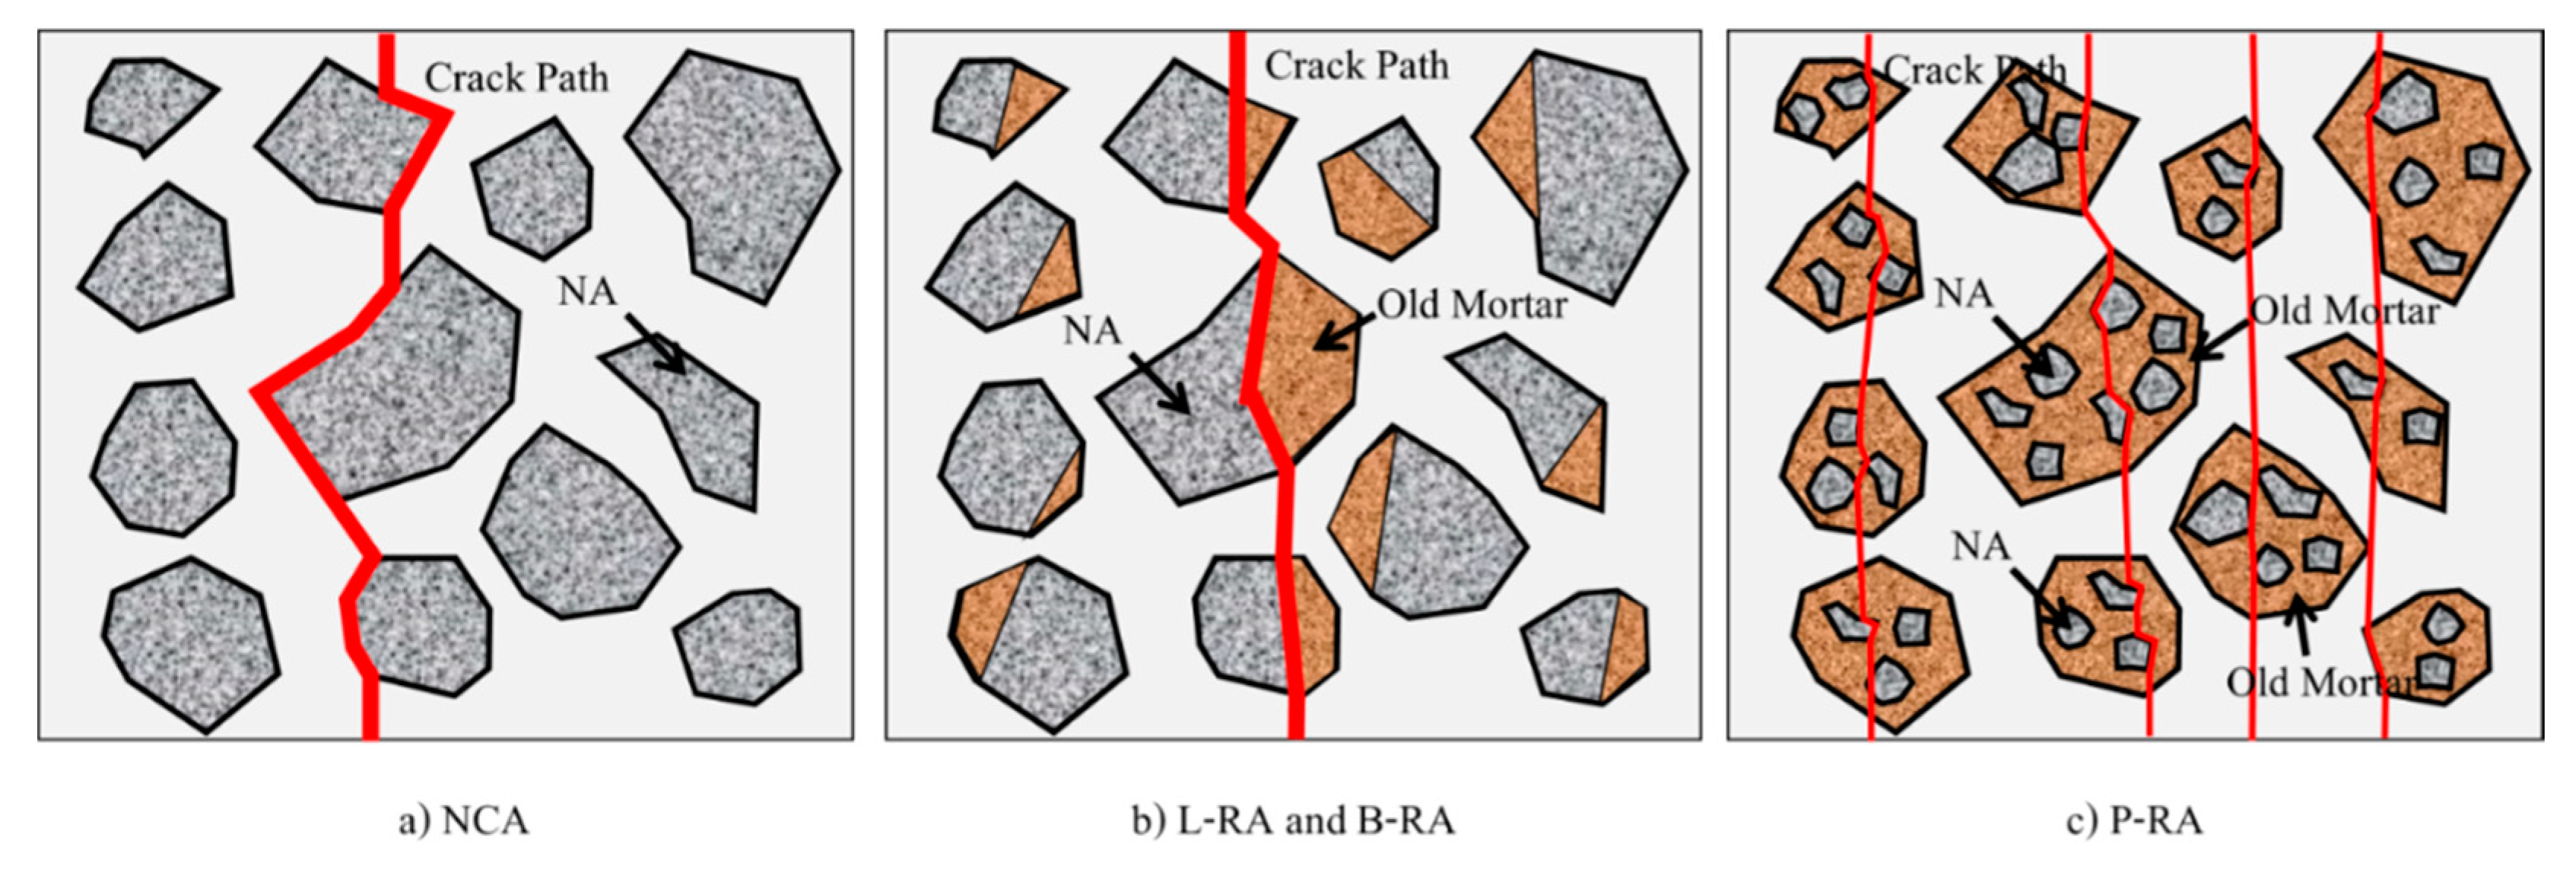
4.1. Failure Mode
4.2. Durability Mode
x = Total charge passed, Coulombs
5. Conclusions
- (a)
- Although the unit weight was similar to that of NA, the % Water Absorption difference was 6–8 times more on average. In this respect, the pre-formed RCA concrete has been used from different sources, including from old buildings (B-RCA), from precast concrete slab specimens (P-RCA), and from laboratory test specimens (L-RCA) has lower chloride permeability properties than NA based concrete, but its penetration rate also depends on the shape of the aggregate which the aggregates are small and the quantity of old-adhered mortar. It will make the permeability a lot. Otherwise, the compressive strength was not significantly different between the ages of 7, 14 and 28 days.
- (b)
- Increasing of percent replacement is added, higher the compressive strength and chloride penetration resistance, the better from the Rapid Chloride Penetration Test at all 30%, 60% and 100% Replacement Rations. It is worth noting that P-RCA has the highest chloride permeability. When considering the % Water Absorption that P-RCA has the most and considering the mixed part of the aggregate which is somewhat more detailed than other types of aggregate, it can be determined that the chloride permeability properties and the strength is linked to the physical nature of the aggregates. In this experiment, the area of the ITZ was taken into account, which has a significant effect in the case of Recycle Aggregate concrete, since the aggregate is attached to the old ITZ from old-adhered Mortar.
- (c)
- Using the Image Processing method for considering ITZ in this experiment, it was found that a highly consistent relationship between the size of the imaging ITZ area was identified and the amount of chloride permeation. An image processing technique could be used to explain the characteristics of each element in the cross-section of the concrete. The method yielded the results in accordance with the concrete behaviors. In the future, it would be possible to predict the properties of concrete if there are ample information archives of the cross-section of concrete.
Author Contributions
Funding
Institutional Review Board Statement
Informed Consent Statement
Data Availability Statement
Conflicts of Interest
References
- Opon, J.; Henty, M. An indicator framework for quantifying the sustainability of concrete materials from the perspectives of global sustainable development. J. Clean. Prod. 2019, 218, 718–737. [Google Scholar] [CrossRef]
- Dhir, R.K.; Dyer, T.D.; Newman, M.D. Ultimate Concrete Opportunities: Achieving Sustainability in Construction. In Proceedings of the International Conference on Global construction, London, UK, 5–6 July 2005. [Google Scholar]
- Saez, P.V.; del Rio Merino, M.; Gonzalez, A.S.A.; Porras-Amores, C. Best Practice measure assessment for construction and demolition waste management in building constructions. Resour. Conserv. Recycl. 2013, 75, 52–62. [Google Scholar] [CrossRef]
- Otsuki, N.; Miyasato, S.; Yodsudjai, W. Influence of Recycled Concrete on Interfacial Transition Zone, Strength, Chloride Penetration and Carbonation of Concrete. J. Mater. Civ. Eng. 2004, 15, 443–451. [Google Scholar] [CrossRef]
- Rao, A.; Jha, K.N.; Misra, S. Use of Aggregate from Recycled Construction and Demolition Waste in Concrete. Resour. Conserv. Recycl. 2007, 50, 71–81. [Google Scholar] [CrossRef]
- Yu, Y.; Wang, P.; Yu, Z.; Yue, G.; Wang, L.; Guo, Y.; Li, Q. Study on the Effect of Recycled Coarse Aggregate on the Shrinkage Performance of Green Recycled Concrete. Sustainability 2021, 13, 13200. [Google Scholar] [CrossRef]
- Malecot, Y.; Zingg, L.; Briffaut, M.; Baroth, J. Influence of free water on concrete triaxial behavior: The effect of porosity. Cem. Concr. Res. 2019, 120, 207–216. [Google Scholar] [CrossRef]
- Accary, A.; Malecot, Y.; Daudeville, L. Design and Evaluation of a Deformable Sensor for Interstitial Pore Pressure Measurement in Concrete under Very High Stress Level. Appl. Sci. 2019, 9, 2610. [Google Scholar] [CrossRef] [Green Version]
- Lu, B.; Shi, C.; Cao, Z.; Guo, M.; Zheng, J. Effect of carbonated coarse recycled concrete aggregate on the properties and mi-crostructure of recycled concrete. J. Clean. Prod. 2019, 233, 421–428. [Google Scholar] [CrossRef]
- Kim, H.; Goulias, D.G. Shrinkage Behavior of Sustainable Concrete with Crushed Returned Concrete Aggregate. J. Mater. Civ. Eng. 2015, 27, 4014204. [Google Scholar] [CrossRef]
- Knaack, A.M.; Kurama, C.Y. Behavior of Reinforced Concrete Beams with Recycled Concrete Coarse Aggregates. J. Struct. Eng. 2015, 141, B4014009. [Google Scholar] [CrossRef]
- EN 1744-1; Tests for chemical properties of aggregates Chemical analysis. BSI: Pilsen, Czech Republic, 2012.
- ASTM C33; Standard Specification for Concrete Aggregates. ASTM: West Conshohocken, PA, USA, 2016.
- Vázquez, E.; Marilda Barra Bizinotto, M.B.; Aponte, D.; Jiménez, C. Improvement of the durability of concrete with recycled aggregates in chloride exposed environment. Constr. Build. Mater. 2014, 67, 61–67. [Google Scholar] [CrossRef]
- Nakhi, A.B.; Alhumoud, J.M. Effects of Recycled Aggregate on Concrete Mix and Exposure to Chloride. Adv. Mater. Sci. Eng. 2019, 2019, 7605098. [Google Scholar] [CrossRef] [Green Version]
- Silva, R.V.; de Brito, J.; Neves, R.; Dhir, R.K. Prediction of Chloride Ion Penetration of Recycled Aggregate Concrete. Mater. Res. 2015, 18, 427–440. [Google Scholar] [CrossRef] [Green Version]
- Mehta, P.K. Greening of the Concrete Industry for Sustainable Development. Concr. Int. 2002, 24, 23–28. [Google Scholar]
- Etxeberria, M.; Konoiko, M.; Garcia, C.; Perez, M.Á. Water-Washed Fine and Coarse Recycled Aggregates for Real Scale Concretes Production in Barcelona. Sustainability 2022, 14, 708. [Google Scholar] [CrossRef]
- JIS A5002; Lightweight aggregates for structural concrete. JIS: Tokyo, Japan, 2003.
- McNeil, K.; Kang, T. Recycled Concrete Aggregates: A Review. Int. J. Concr. Struct. Mater. 2012, 7, 61–69. [Google Scholar] [CrossRef] [Green Version]
- Duan, Z.; Poon, C.S. Properties of recycled aggregate concrete made with recycled aggregates with different amounts of old adhered mortars. Mater. Des. 2014, 58, 19–29. [Google Scholar] [CrossRef]
- Pedro, D.; de Brito, J.; Evangelista, L. Influence of the use of recycled concrete aggregates from different sources on structural concrete. Constr. Build. Mater. 2014, 71, 141–151. [Google Scholar] [CrossRef]
- ACI 555; Concrete with Recycled Materials. ACI: Pflugerville, TX, USA, 2001.
- ASTM C1202; Standard Test Method for Electrical Indication of Concrete’s Ability to Resist Chloride Ion Penetration. ASTM: West Conshohocken, PA, USA, 2019.
- ASTM C135; Standard Test Method for True Specific Gravity of Refractory Materials by Water Immersion. ASTM: West Conshohocken, PA, USA, 2015.
- Yue, G.; Ma, Z.; Liu, M.; Liang, C.; Ba, G. Damage behavior of the multiple ITZs in recycled aggregate concrete subjected to aggressive ion environment. Constr. Build. Mater. 2020, 245, 118419. [Google Scholar] [CrossRef]
- Li, W.; Xiao, J.; Sun, Z.; Shah, S. Failure processes of modeled recycled aggregate concrete under uniaxial compression. Cem. Concr. Compos. 2012, 34, 1149–1158. [Google Scholar] [CrossRef]
- Azarsa, P.; Gupta, R. Electrical Resistivity of Concrete for Durability Evaluation: A Review. Adv. Mater. Sci. Eng. 2017, 2017, 8453095. [Google Scholar] [CrossRef] [Green Version]
- Zouaoui, R.; Miled, K.; Limam, O.; Beddey, A. Analytical prediction of aggregates’ effects on the ITZ volume fraction and Young’s modulus of concrete. Int. J. Numer. Anal. Methods Geomech. 2017, 41, 976–993. [Google Scholar] [CrossRef]


| Mix | Mix Proportion (kg/m3) | ||||
|---|---|---|---|---|---|
| Cement | Water | Sand | Stone | RA | |
| NCA | 411 | 206 | 827 | 1028 | - |
| L-RA 30 | 411 | 206 | 827 | 719 | 309 |
| L-RA 60 | 411 | 206 | 827 | 616 | 412 |
| L-RA 100 | 411 | 206 | 827 | - | 1028 |
| P-RA 30 | 411 | 206 | 827 | 719 | 309 |
| P-RA 60 | 411 | 206 | 827 | 616 | 412 |
| P-RA 100 | 411 | 206 | 827 | - | 1028 |
| B-RA 30 | 411 | 206 | 827 | 719 | 309 |
| B-RA 60 | 411 | 206 | 827 | 616 | 412 |
| B-RA 100 | 411 | 206 | 827 | - | 1028 |
| Total Charge Passed (Coulombs) | Chloride Permeability |
|---|---|
| >4000 | High |
| 2000–4000 | Moderate |
| 1000–2000 | Low |
| 100–1000 | Very low |
| <100 | Negligible |
Publisher’s Note: MDPI stays neutral with regard to jurisdictional claims in published maps and institutional affiliations. |
© 2022 by the authors. Licensee MDPI, Basel, Switzerland. This article is an open access article distributed under the terms and conditions of the Creative Commons Attribution (CC BY) license (https://creativecommons.org/licenses/by/4.0/).
Share and Cite
Yodsudjai, W.; Nitichote, K. Chloride Penetration Behavior of Concrete Made from Various Types of Recycled Concrete Aggregate. Sustainability 2022, 14, 2768. https://doi.org/10.3390/su14052768
Yodsudjai W, Nitichote K. Chloride Penetration Behavior of Concrete Made from Various Types of Recycled Concrete Aggregate. Sustainability. 2022; 14(5):2768. https://doi.org/10.3390/su14052768
Chicago/Turabian StyleYodsudjai, Wanchai, and Kirati Nitichote. 2022. "Chloride Penetration Behavior of Concrete Made from Various Types of Recycled Concrete Aggregate" Sustainability 14, no. 5: 2768. https://doi.org/10.3390/su14052768
APA StyleYodsudjai, W., & Nitichote, K. (2022). Chloride Penetration Behavior of Concrete Made from Various Types of Recycled Concrete Aggregate. Sustainability, 14(5), 2768. https://doi.org/10.3390/su14052768