1. Introduction
The globalization of the economy and the processes of technological innovation are producing structural transformations of the economic and social system, which are reflected in the paradigms that, for many decades, have been the basis for the development of cities. The profound and remarkable changes at the scale of the macroeconomic system are bringing equally profound transformations in the construction and real estate market, starting with the hierarchy of values. The real estate market in Italy has been characterized by a phase of continuous decline since 2008; the contraction of employment rate and the changed distribution of income are perceptible in the cities through the abandonment of residential and commercial areas, while, in the inner territories, they are causing the progressive depopulation of villages. In general, the Italian population has been decreasing since 2015, and in 2019, for the first time in the last 90 years, has started a phase of demographic decline [
1].
In this situation, the approach to the real estate market needs to be rethought, also in relation with the reform of several regulatory city plans; given the end of population increase (also theoretical), land consumption must cease, and the use of free land must be totally substituted by the re-use of the existing and abandoned building stock and the empty and underused residential stock. It will be necessary to identify new paradigms underlying policies and new operational tools to safeguard the habitability of cities, manage the necessary degrowth, and safeguard heritage sites.
Moreover, the recent European Directive 2018/814 [
2] focuses on existing buildings for the first time, with the Communication ‘A renovation wave for Europe 2020’ underlining that currently, around 75% of buildings in the EU are not energy efficient and 85–95% of those buildings will still be in use in 2050 [
3]. Only 1% of these buildings undergo energy renovations every year, so the actual challenge is to intervene in existing inefficient buildings, without compromising their value, to give a fundamental contribution to making Europe climate neutral (Net Zero Emissions) by 2050.
In Italy, the majority of these buildings are more than 50 years old, built mainly during the second half of the 20th century, and in many cases with a poor quality of materials, no quality elements in facades, and experimental technologies. The experimentation of new technologies and materials, with an absence of ordinary maintenance over the years is the main cause of their degradation. Only a small part of this building stock has high architectural and building qualities, in some cases with a widely recognized authorship or a perfect realization by the construction companies of the time, but not totally under protection due to a gap in the Italian law.
In Italy, from the point of view of the regulatory framework of protection, private residential buildings under the age of 70 are not subject to the ‘automatic’ protection provisions and, therefore, are not subject to ‘automatic’ verification of cultural interest. The definition of the concept of cultural heritage underlines that ‘[…] for immovable objects belonging to any private owner, whether they are the work of a living author or whose execution dates back to less than seventy years, as well as whether they are the work of a living author or whose execution dates back to less than fifty years ago, are not subject to protection provisions and, therefore, cannot be the subject of a declaration of cultural interest […]’ (Law Decree 42/2004, so called Cultural Heritage codex, art. 10, comma 5). Not having the ‘protection provision’ implies that only if there is a clear request from the Region or some local authority, could some of these buildings possibly be reported and placed under protection.
With these premises, restoration interventions on these buildings are almost completely deregulated and risk transforming and distorting them. Furthermore, although the new fiscal incentives (Superbonus introduced by Italian Law Decree, 19 May 2020, n.34) for the energy retrofit of buildings represent a great opportunity to foster building renovation, both for recent and historical buildings, they also represent a threat to contemporary heritage. In fact, it would be necessary to distinguish the energy retrofit interventions intended for ordinary or extraordinary buildings, but in both cases retrofit interventions should have a role in enhancing their architectural quality, and not only the EPC level. Moreover, in the recent Italian Recovery and Resilience Plan (PNRR, 2020) in Measure 1 ‘Patrimonio culturale per la prossima generazione’ there are no indications for the recovery of the contemporary heritage of the 20th century.
Among the historical building heritage of the second half of the 20th century, housing heritage is generally unknown and not appreciated by citizens and visitors; it is often offered on the market with no monetization of its historical value and, therefore, under evaluated. In the context of a statistical analysis of the real estate market, it seems that architectural quality is not commonly considered as a descriptive building variable, but often it is included in other intrinsic housing characteristics or confused with housing services, such as a concierge, lift, or car park.
Starting form a literature review, the main gaps found are related to the right for protection of the residential heritage of the second half of the 20th century, with the related definition of architectural quality. Moreover, research is lacking in the development of the analysis of these components in the real estate market, by not distinguishing the architectural quality from other physical characteristics of buildings. Finally, analyses fail to consider all these features separately from locational characteristics in the real estate market. Starting from these shortcomings, it was possible to refine the research direction, to also include the construction of a geodatabase of the residential heritage of the 20th century, and to define a workflow and scientific research methodology.
The aim of this work is to understand whether, how, and in what measure the qualities that characterize residential heritage can influence the price formation process. In particular, the research addresses the role that economic evaluation can play in analyzing how individuals perceive the architectural quality of contemporary architecture and monetize it through the real estate market.
Analyses were conducted in an Italian urban context, the city of Turin, which represent a good example of a post-industrial city of medium dimensions, with a slow recovery from crises; first the economic one of 2008, and now from the post-pandemic one (2020). Previous research [
4] on Turin has shown that the system of values in the real estate of the second half of the 20th century, today, no longer exists. At the time, the system reflected the distribution of income and the social division of space, while today, the relation is not so linear, and dictated more by social vulnerability and vibrancy dynamics [
5,
6,
7,
8].
Assuming these premises, the paper is articulated in the following parts:
Section 2 presents the literature considered and scientific background on the topic. In
Section 3, the methodology is presented. In
Section 4, a case study and data sampling are illustrated.
Section 5 shows the results of the GWR application, and, finally, a discussion is in
Section 6 and a conclusion in
Section 7.
2. Background
This research focused on the study of the real estate market, to analyze the economic value of housing stock built in the second half of the 20th century (1950–1999). In particular, the analyses focused on housing that stands out for its architectural and building quality; materials used and level of technology and workmanship. First of all, it was necessary to define and measure architectural and building quality and how to distinguish this from other housing features. The most challenging aspect of the research was to identify and measure the architectural quality, not only for well-known buildings—published in magazines and monographs—but also for buildings whose designers are unknown. In this research, ‘residential buildings of the second half of the 20th century’ refers to modernist buildings, for which the influence of the ’international modern movement’ is evident in terms of the purpose, typologies, technologies, and functions used in the design of buildings [
9], but also contemporary post-war and late twentieth century architecture. The second aspect that was analyzed in the literature reviews was the use of Geographically Weighted Regression (GWR) for real estate market analysis, focusing on the use of point of interest data coming from different sources.
2.1. The Concept of Architectural Quality
At least to the author’s knowledge, currently, housing quality is, in some respects, better defined in the national and international regulatory framework than in the literature present in the main indexed databases. Qualities introducing new forms, types, and content constantly appear in architectural design, but the quality concept is dynamic and complex and can assume new meanings over time and in different places.
Architectural quality and building quality have a large impact on the design and implementation of architectural projects, and urban design [
10], by correlating the architectural form to the built urban environment, can be seen in relation with other urban dynamic characteristics, such as traffic and noise [
11] for neighborhood quality assurance or in relation to urban image and the planning process [
12] for raising of the overall quality standards in society.
More specifically, architectural quality is one of the parameters that often comes into consideration for the awarding of architectural or urban planning projects, and goes far beyond the production of a precise and error-free work [
13]. Urban and architectural quality is linked to the urban context in which it is located and is considered as a positive increase in the environment quality [
14]. Architects and academics have tried for years to give a definition and understanding of quality in architecture: ‘Architectural quality has always been about making a surprise. It means a new combination of traditional materials put together in a way, which gives a feeling of satisfaction to the one who is experiencing that space. It is dealing with interpretation of factors that might not have been known before’ [
13], without, however, reaching a common definition.
As far as it concerns regulation policies, some national policy programs developed in Europe during the 1990s explicitly refer to quality: the Netherlands (1991), Norway (1992), and Denmark (1994) promoted an aesthetic-oriented concept to develop quality in architecture and urban design [
15].
The European Council Resolution of 12 February 2001 (2001/C 73/04) established that ‘architectural quality is a constituent part of both the rural and urban environment; the cultural dimension and the quality of the physical treatment of space should be taken into account in Community regional and cohesion policies’ [
14]. Moreover, in this document the European Council expresses its attachment to ‘the fact that good quality architecture, by improving the living context and the relationship between citizens, and their environment, whether rural or urban, can contribute effectively towards social cohesion and job creation, the promotion of cultural tourism and regional economic development’ [
14].
In February 2008, the European Parliament approved a resolution on the follow-up of the Territorial Agenda and the Leipzig Charter of Sustainable European Cities, which called on Member States to favor the growth of a culture of a high-quality built environment, ‘giving particular attention to the quality of the public space, notably in terms of architectural design quality, as a means of improving the well-being of European Union citizens’ [
16].
In 2018, the European Ministers of Culture, along with other institutions and NGOs, denounced in the Davos Declaration ‘a trend towards a loss of quality in […] the built environment […] all over Europe’, characterized by ‘the trivialization of construction, the lack of design values, […] the growth of faceless urban sprawl and irresponsible land use, the deterioration of historic fabric, and the loss of regional traditions and identities’ [
17]. In this document it was also suggested that a high-quality built environment could give a crucial contribution to achieving a sustainable society, characterized by a high quality of life, cultural diversity, individual and collective well-being, social justice and cohesion, and economic efficiency [
18].
In November 2018, the European Council created under the Work Plan for Culture 2019–2022 an expert group on ’High-quality Architecture and Built Environment for Everyone’. Experts designated by EU Member States were asked to exchange ideas on best practices with respect to ‘multi-disciplinary and participatory governance models contributing to social inclusion and sustainable development of neighborhoods’, particularly focusing on ‘architecture as a discipline that encompasses the right balance between cultural, social, economic, environmental and technical aspects for the common good’ [
19]. On 30 November 2021, EU ministers responsible for culture adopted the ‘Conclusions on culture, high-quality architecture and built environment as key elements of the New European Bauhaus initiative’ [
18].
As far as this concerns the Italian legislative approach, the Italian Council of Ministers approved a Law on Architectural Quality in 2017 (D.L. n. 2867, 2017, ‘Legge quadro sulla qualità architettonica’), that is still under analysis at the Seventh Standing Committee (Public education, cultural heritage) of the Senate. In the law, the concept of quality of architectural design and construction attains to urban planning: ‘a quality recognized as a matter of public interest—because it is capable of contributing to the preservation of the landscape and to the improvement of the living conditions of citizens—and defined as the result of a coherent project development that incorporates the functional, social and formal requirements based on the realization of the work, ensuring its harmonious insertion into the surrounding environment’ (D.L. n. 2867, 2017, ‘Legge quadro sulla qualità architettonica’). This Italian law establishes instruments for the promotion of architecture quality (such as competitions, prizes for young professionals) and for the protection of architectural works of the second half of the 20th century, in order to promote knowledge and enhancement of architectural, urban planning, and landscape culture.
In the meantime, several certification methodologies have been developed across Europe to report and measure the quality of buildings [
20]. These certifications are suitable for newly constructed building, applicable in different areas and at different stages of the building process, but a few are also adaptable to the existing building stock. Some examples are reported in Acampa et al. [
21]:
Housing Quality Indicator (HQI): developed by the English Government (Homes and Communities Agency), it measures quality based on the requirements of the buildings and the context in which they are placed [
22];
Building Quality Evaluation (BQE): developed by CIRI (Centro Interdipartimentale per la Ricerca Industriale) Building and Construction, which is part of the network of research and innovation facilities in the Emilia-Romagna region, is focused on the enhancement and management of assets [
23].
While there is a broad consensus on the fact that ‘high-quality’ built environments have positive impacts on people’s everyday lives, the characteristics of high-quality architecture need a deeper discussion and specification.
In the recent Italian Recovery and Resilience Plan (PNRR, 2020) in Measure 1 ‘Patrimonio culturale per la prossima generazione’ there are no indications for the recovery of the contemporary heritage of the 20th century. However, in the line ‘M5C2: infrastrutture sociali, famiglie, comunità e terzo settore’, Investiment 2.3 (2.80 billion) there is an innovative program related to the quality of living, which also includes housing: the investment is divided into two lines of intervention, to be carried out without the consumption of new land: (i) redevelopment and increase of social housing, renovation and re-generation of urban quality, improvement of accessibility and safety, mitigation of housing shortage and increase in environmental quality, and the use of innovative models and tools for urban management, inclusion, and well-being; (ii) interventions in public housing with a high strategic impact on the national territory.
2.2. The Real Estate Market POIs Analysis by Geographically Weighted Regression (GWR)
In recent years, thanks to the increase of the availability of open data on the web, and also thanks to supranational agreements, such as the International Open Data Charter (2015), point data, rather than lattice data, are increasingly commonly used in various research fields through web-crawling on open access platforms.
Many types of point data are called Points-of-Interest (POIs), of which there is not an official definition yet, but can be defined as a specific physical location which someone may find interesting. Heritage buildings, real estate ads, urban amenities, restaurants, and retail stores are all examples of Points-of-Interest. Recent explorations of POIs data on open access platforms have provided new opportunities to address these data issues. Urban amenities and services, in terms of POIs, can be extracted and categorized, as POIs represent the smallest spatial resolution of the built environment of urban landscapes. Many scholars have employed POIs to evaluate a city’s growth potential [
24], as well as to analyze land use and classification strategies [
25] and the real estate market [
26,
27,
28,
29].
There is a huge need to utilize POIs for housing price studies, as the pace at which some new communities are born (e.g., in China) and the sheer number of geospatial variables generated in that processes cannot be efficiently captured in a traditional manner.
Classical models such as the hedonic pricing model proposed by Rosen [
30] typically take into account only structural attributes and locational amenities, which may not fully describe other aspects affecting the appreciation rate of housing prices. Structural (intrinsic) attributes contain the material assets of the property, including the size of the house, the year of construction, the number of the bedrooms and bathrooms, etc., which can describe the internal characteristics of the houses [
31]. Location amenities (extrinsic) refer to geographical-related variables, such as distance from nearest facilities, neighborhood quality, noise, and pollution, which can reflect the intangible environment nearby [
32]. The POIs data can assess both types of data, and by means of geographical hedonic models it is possible to analyze them, even if they belong to very different sources and data structures.
However, the ‘house price appreciation rate’ and the social aspects and demand choices could be analyzed in more depth, in fact, the ‘appreciation’ of a home is affected by variables such as the physical appearance of the house, surrounding physical and social environment, and dynamic patterns of human mobility [
33]. For example, homes located in districts and areas with a beautiful visual aesthetic environment, where residents’ well-being may be benefited, might have higher appreciation rate; homes with refined decoration may be attributed higher values; and more attractive neighborhoods may have higher selling prices [
27]. These key factors were overlooked by most of the previous studies, due to the lack of quantitative measurements in conventional data collection methods.
The rise of big data, high-performance computing, and advanced machine learning methods provide unprecedented opportunities to model those intangible and latent features of houses, which can improve the estimation of house price appreciation rates. On the one hand, in contrast to previous studies, which used official statistical data and manual surveys in exploration of house price appreciation rates [
34,
35,
36,
37], larger volumes and varieties of geo-referenced data are actively and passively produced by users, bring more comprehensive insights into the representation of socio-economic environments in the era of Volunteered Geographic Information (VGI) [
38] and big geo-data [
39]. For instance, photographs of houses that reflect indoor and outdoor scenarios of the properties, taken by the house owners and seller agents, are uploaded to online websites, which enable people to understand the appearance of houses, and Street View images can describe the relationships between building physical attributes and socio-economic environments [
40,
41,
42]. A better understanding of the relationship between all these dimensions and house price appreciation rates could provide more comprehensive and valuable information for policy makers, to improve the overall quality of neighborhoods and stimulate social and economic balances between urban areas [
27].
A wide range of literature works have confirmed the idea that territorial segmentation in sub-markets represents the different sets of local features, such as green areas, public schools, public spaces, social centers, or police departments. The nearer a house is located to positive attributes, the higher the benefits for this household should be; conversely, the nearer a house is located to negative attributes, the higher the vulnerability should be [
43,
44,
45]. The spatial structuring of environmental variables and community processes is a source of spatial autocorrelation in data.
Econometric modeling of real estate prices using socioeconomic and environmental factors has a relatively long tradition and has been frequently described in the literature. An extensive review of the statistical models describing the relationships between house prices and factors influencing them, both at the national, regional, and local levels, is presented by Gaspareniene et al. [
46], who mentions both advantages and disadvantages of the models, as well as their structural elements. It should be noted, however, that generally the models developed so far do not consider spatial relationships, either as a geographical reference of the variables adopted or as a structural model. The spatial effects considered in price and market activity models, especially in regional terms, may concern both spatial autocorrelation and spatial heterogeneity. Spatial autocorrelation is included in Spatial Autoregressive models (SAR), as well as spatial panel models [
47,
48,
49], while spatial heterogeneity and the spatial structure of location features may also be included in a Geographically Weighted Regression (GWR) model.
Geographically Weighted Regression (GWR) is widely used in the real estate market, primarily in local-scale research [
27,
50,
51,
52,
53]. Spatial-temporal GWR models play an increasingly important role in the study of spatial diversity determinants of the real estate market, which assumes not only a spatial heterogeneity but also a temporal one [
54,
55]. Basic GWR models assume that the influence of explanatory variables may differ at each point of the analyzed space. The assumption that some variables can be global, and that others can be local, was the basis for creating Mixed Geographically Weighted Regression (MGWR) models. These models are used increasingly often for both local and regional research and seem to solve some problems found in the classical GWR [
56]. The relevance of spatial econometrics, spatial statistics, and GIS for empirical analysis of real estate markets is currently widely recognized.
3. Methodological Approach
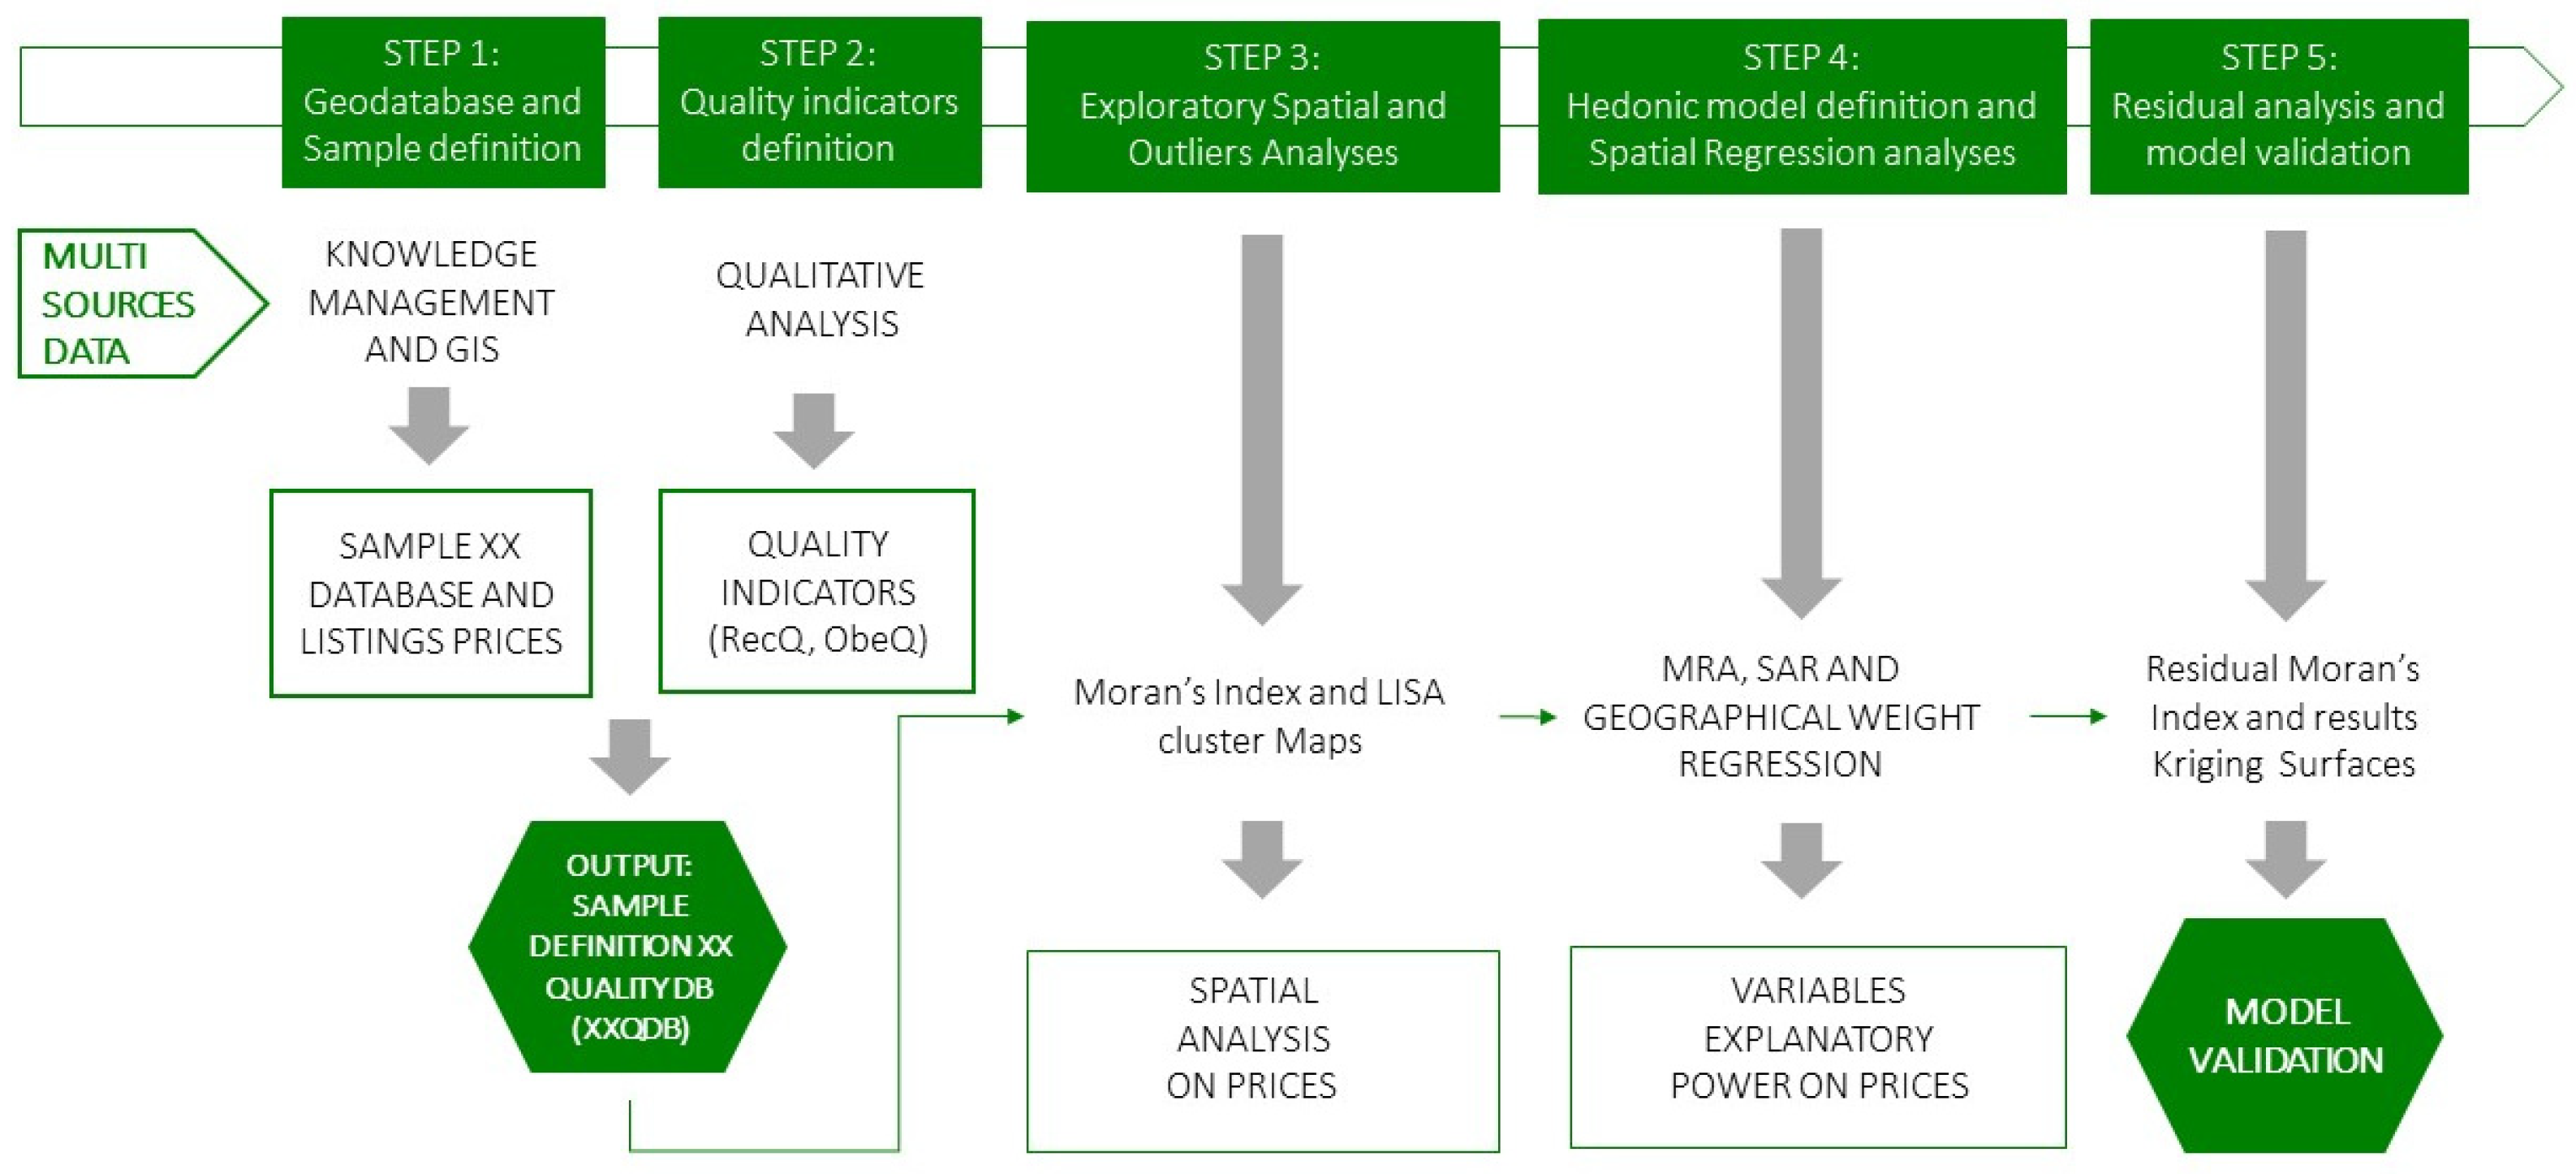
The methodological approach developed and implemented in this work includes both qualitative and quantitative analysis of contemporary architecture, in relation to the real estate market. The methodology consists of 5 consequent phases, each of which develops from the results of the previous one (
Figure 1).
Each phase (step) consists in the application of well-known statistical data-driven methodologies. Data from different sources must be harmonized to became comparable and measurable and to become a good statistical basis for analyses. Data samples may well represent the reality, in a inferential way, but to obtain accurate and unbiased results, several validation and refinement steps are required, which are explained below.
Geodatabase and sample are defined in the Step 1, where the objective of the research and the problem question are also identified. This drives the choice of the rules of the data sampling and the definition of the dataset, which underpin the statistical analyses. The conceptual structure of the geodatabase involves the definition of variables, the use of spatial joins, attribute queries, and spatial queries for the union and harmonization of data from different sources. The construction of the sample started from the data already published, both in online resources and in articles and monographs. Then, the sample was integrated through a visual survey of the architectures of outstanding value. The main purpose of this first survey was to reach a statistically significant amount of data in order to proceed with subsequent analyses. In this way, an initial classification of the urban residential heritage with architectural or built qualities was obtained. The collected data sample was integrated with a database of real estate listings, detected on the real estate market in 2019. The database, thus composed, includes intrinsic descriptive variables of the characteristics of the real estate units and intrinsic characteristics of the building (listing price, square meters, number of rooms, presence of lift, etc.).
Subsequently, in Step 2, some features related to both architectural and built qualities (authorship, age, notification of interest, bonds by the Superintendence of Cultural Heritage, presence in publications, etc.) were detected and evaluated, to form the two main indicators of quality used in this research: recognized quality (RecQ), and observed quality (ObeQ).
In the Step 3, exploratory statistics and an outlier analysis were performed. The sample of data, thus composed, was observed and described using classical central and statistical dispersion indicators and refined through analysis of the outliers.
The hedonic model definition and spatial regression analysis were applied in Step 4 of the methodological approach. Spatial statistics methods and models were applied for estimating the values of the classified architectures in the data sample and for understanding which characteristics have a significant influence on price formation. For this aim were employed Exploratory Spatial Data Analysis (ESDA), with which Morans’ index and Anselin’s LISA analyze the presence and the type of spatial autocorrelation among the data. Hedonic regression models and residual analysis were applied as a preliminary step of the application of a Geographic Weighted Regression (GWR) model, to understand the contribution of each physical characteristic to price formation and to infer the value of all the residential units classified in the sample. The assumption in the OLS model is that all the values of the marginal coefficients are constant across the geographical space. This means that if there is any geographic variation in the relationship, then it must be confined in the error term. Assuming a location in the study area, perhaps one of the data points, where (
u,
v) are the coordinates of its position, it is possible to rewrite a classical OLS model thus (1):
This can be fitted by least squares, to give an estimate of the parameters at the location (
u,
v) and a predicted value. This is achieved though implementation of the geographical weighting scheme. Therefore, generally, a basic form of GWR can be expressed as (2):
where
and
(
k = 1,
…,
m) are the observations of dependent variable and independent variable, respectively, at location
i,
(
k = 1,
…,
m) is the set of regression parameters estimates at location
i; and
is the random error term.
A standard calibration model is used to calibrate the weight least squares approach at each regression point, in this work a Gaussian Kernel function was chosen, and the Bandwidth is a fixed distance, by using ArcGis Desktop 10.8 software (Version 10.8.12790). This can be optimally found by minimizing the CV score or the Akaike Information Criterion (AIC) [
57].
GWR led to the inferential estimation of the buildings of architectural quality analysed, by classifying the characteristics monetized in the real estate market and Kriging interpolation statistics were then applied to obtain the interpolation of the estimated (expected) values throughout the city. In the final step of the process (Step 5), residuals were analyzed, and the model was validated.
4. Study Area and Data Sampling
According to the aim of this research, some valuable housing built in the second half of the 20th century was analyzed, to understand whether the real estate market monetizes the building features, focusing on architectural quality.
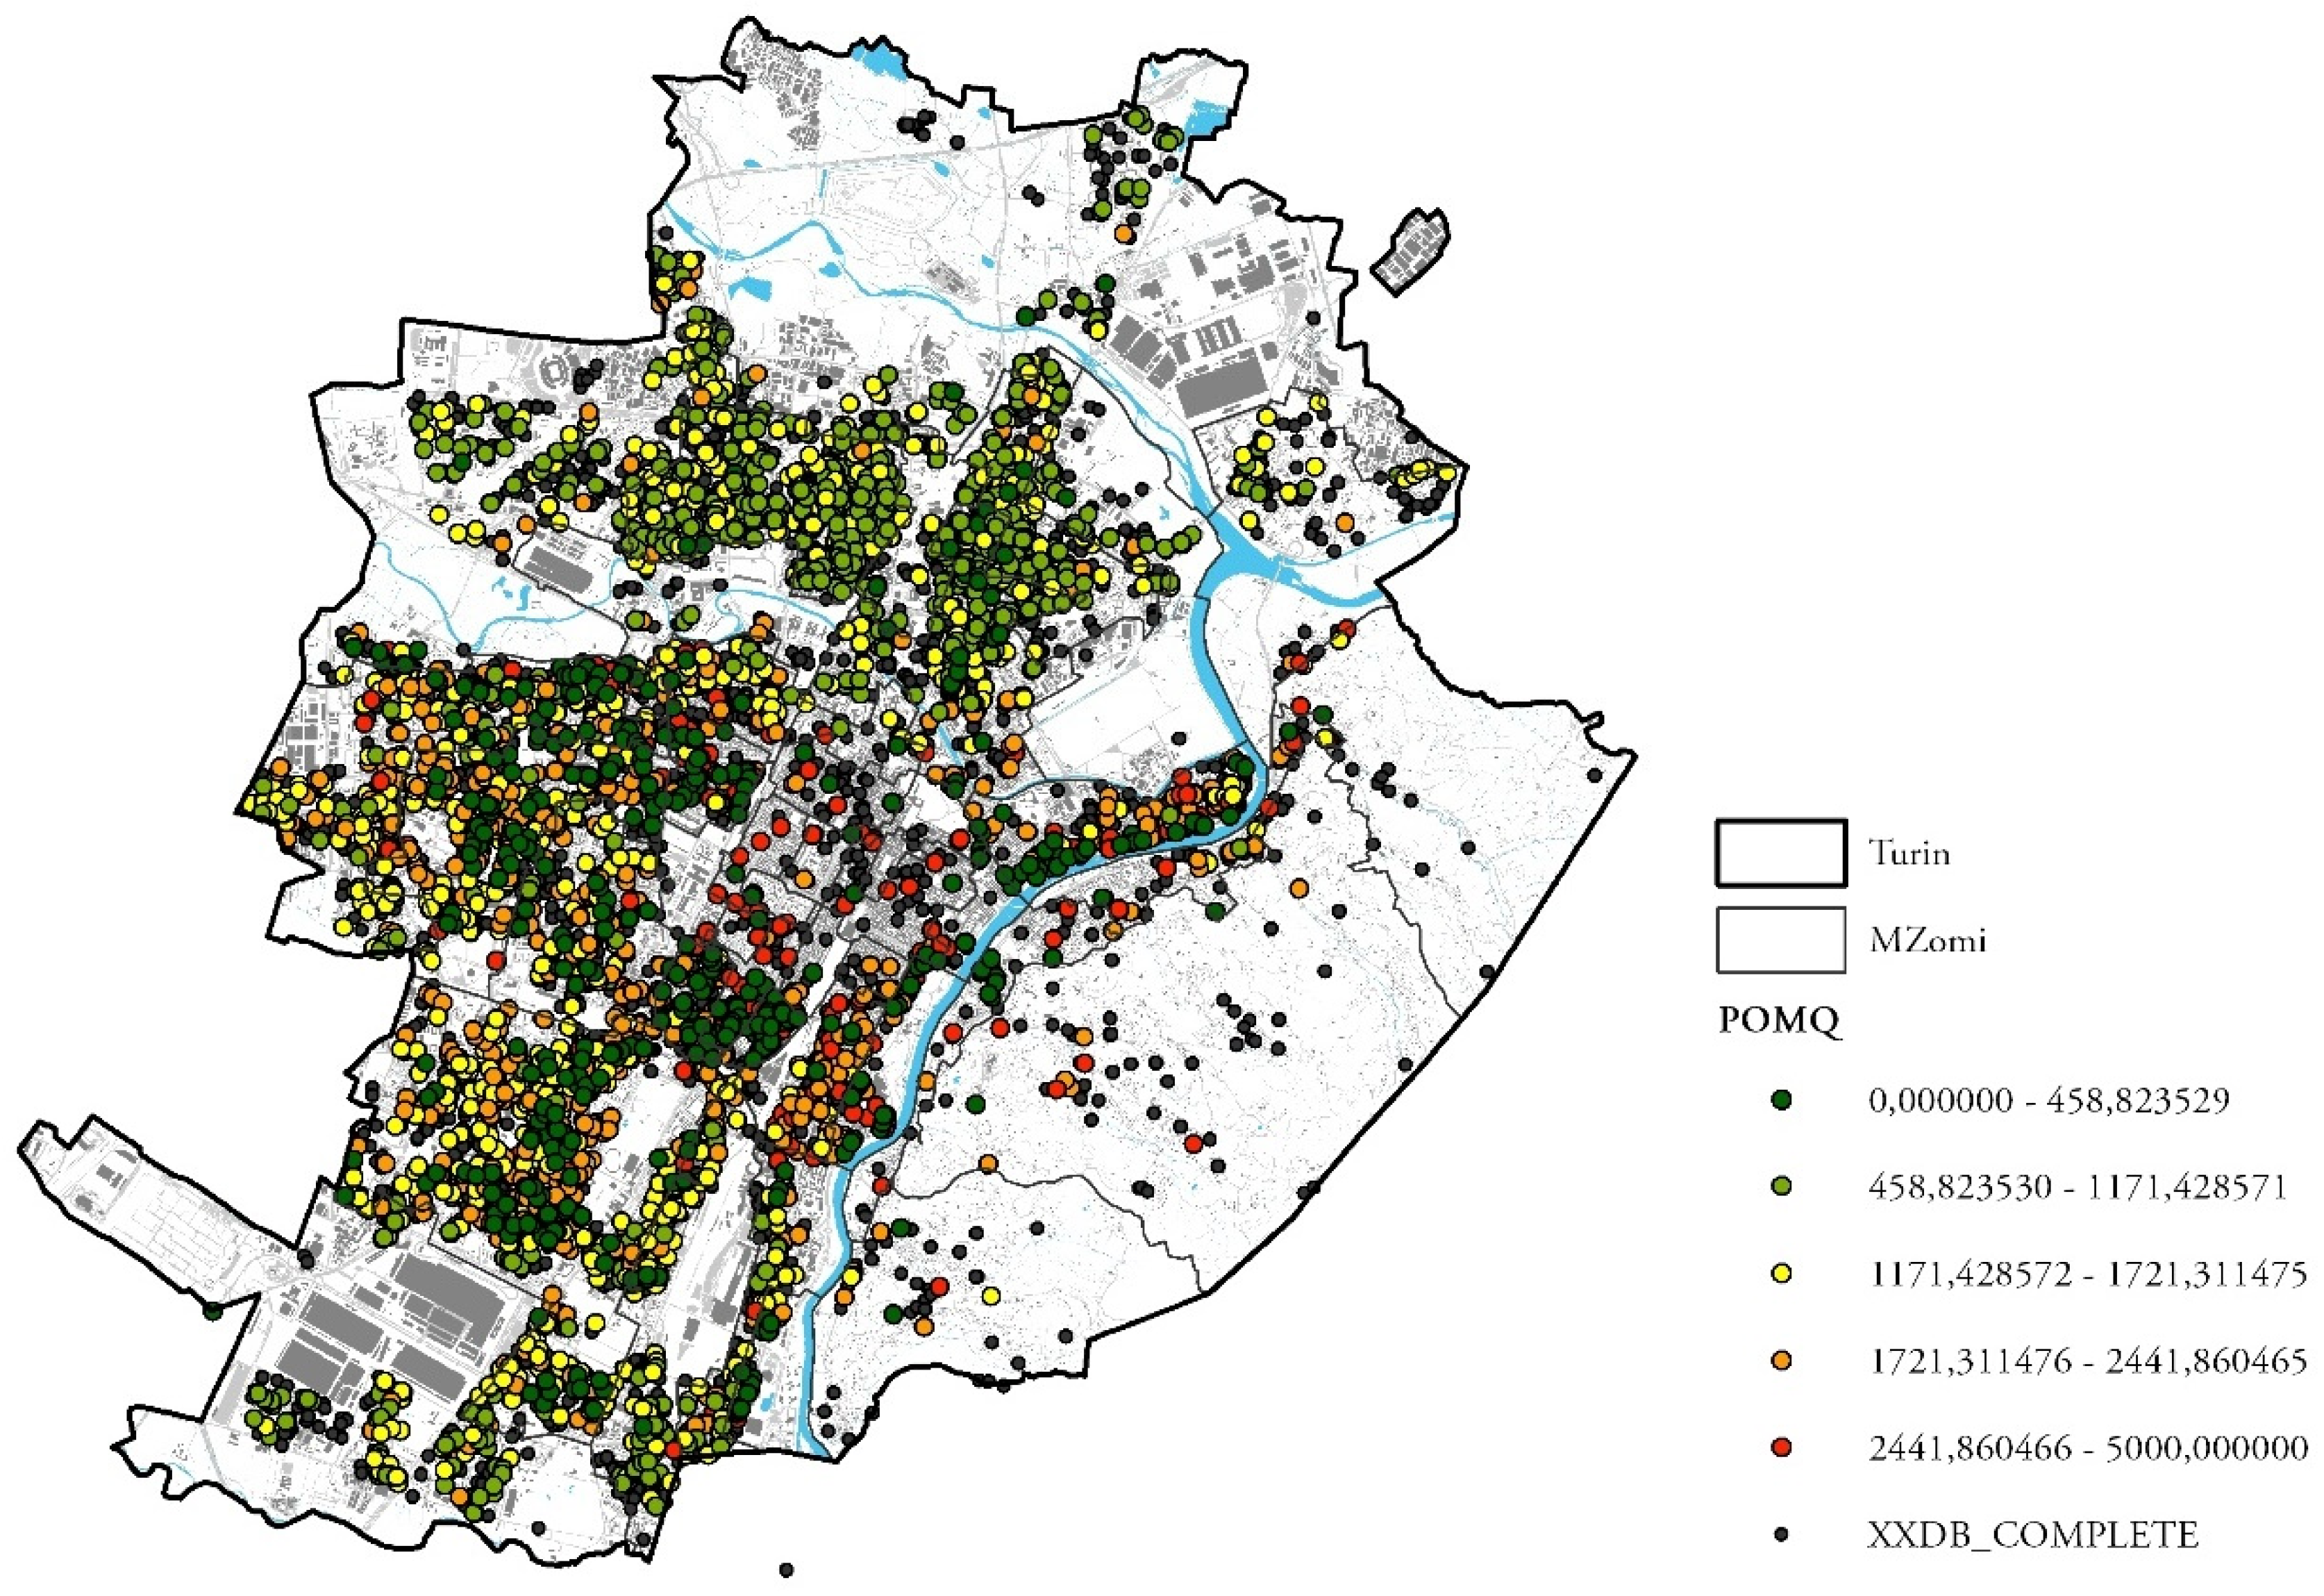
In this study, the city of Turin was used as a case study (
Figure 2), although this methodological approach can be generalized and transferred, with the necessary modifications, to any other study area. This research is one of the many conducted on the real estate market of this city from different points of view: internal migration flows [
4,
58,
59], sub-markets observation and analysis [
60,
61], neighborhood vibrancy and vulnerability [
5,
6,
7,
8], the EPC labels of the existing housing stock [
62,
63,
64], and cadastral policies and property taxation [
65].
In Turin, from 2011 to 2018, the real estate market of the new housing stock suffered a significant drop in prices (−14%), a drop in the total number of construction sites (−30%), and a significant increase in the number of unsold housing units. In the same period, although the number of transactions increased, the listing prices of existing real estate assets significantly and steadily decreased (−25%), with longer negotiation times. Currently, in Turin, the cyclical crisis of the real estate market seems to have become structural; the city is going through a phase of deurbanization, characterized by a series of economic, social, and demographic factors that are determining radical urban transformations, both in the central historical areas of the city and in the peripheral ones. The transformation of urban hierarchies is also modifying the real estate sub-markets, both in terms of dynamism and price trends and in their territorial boundaries.
The great influence of the location variable, in the process of determining the price of houses and in influencing the behavior of buyers and sellers, has been widely recognized; nevertheless, the location paradigm is evolving, taking on different parameters, and buyers’ preferences regarding location and neighborhood characteristics are changing.
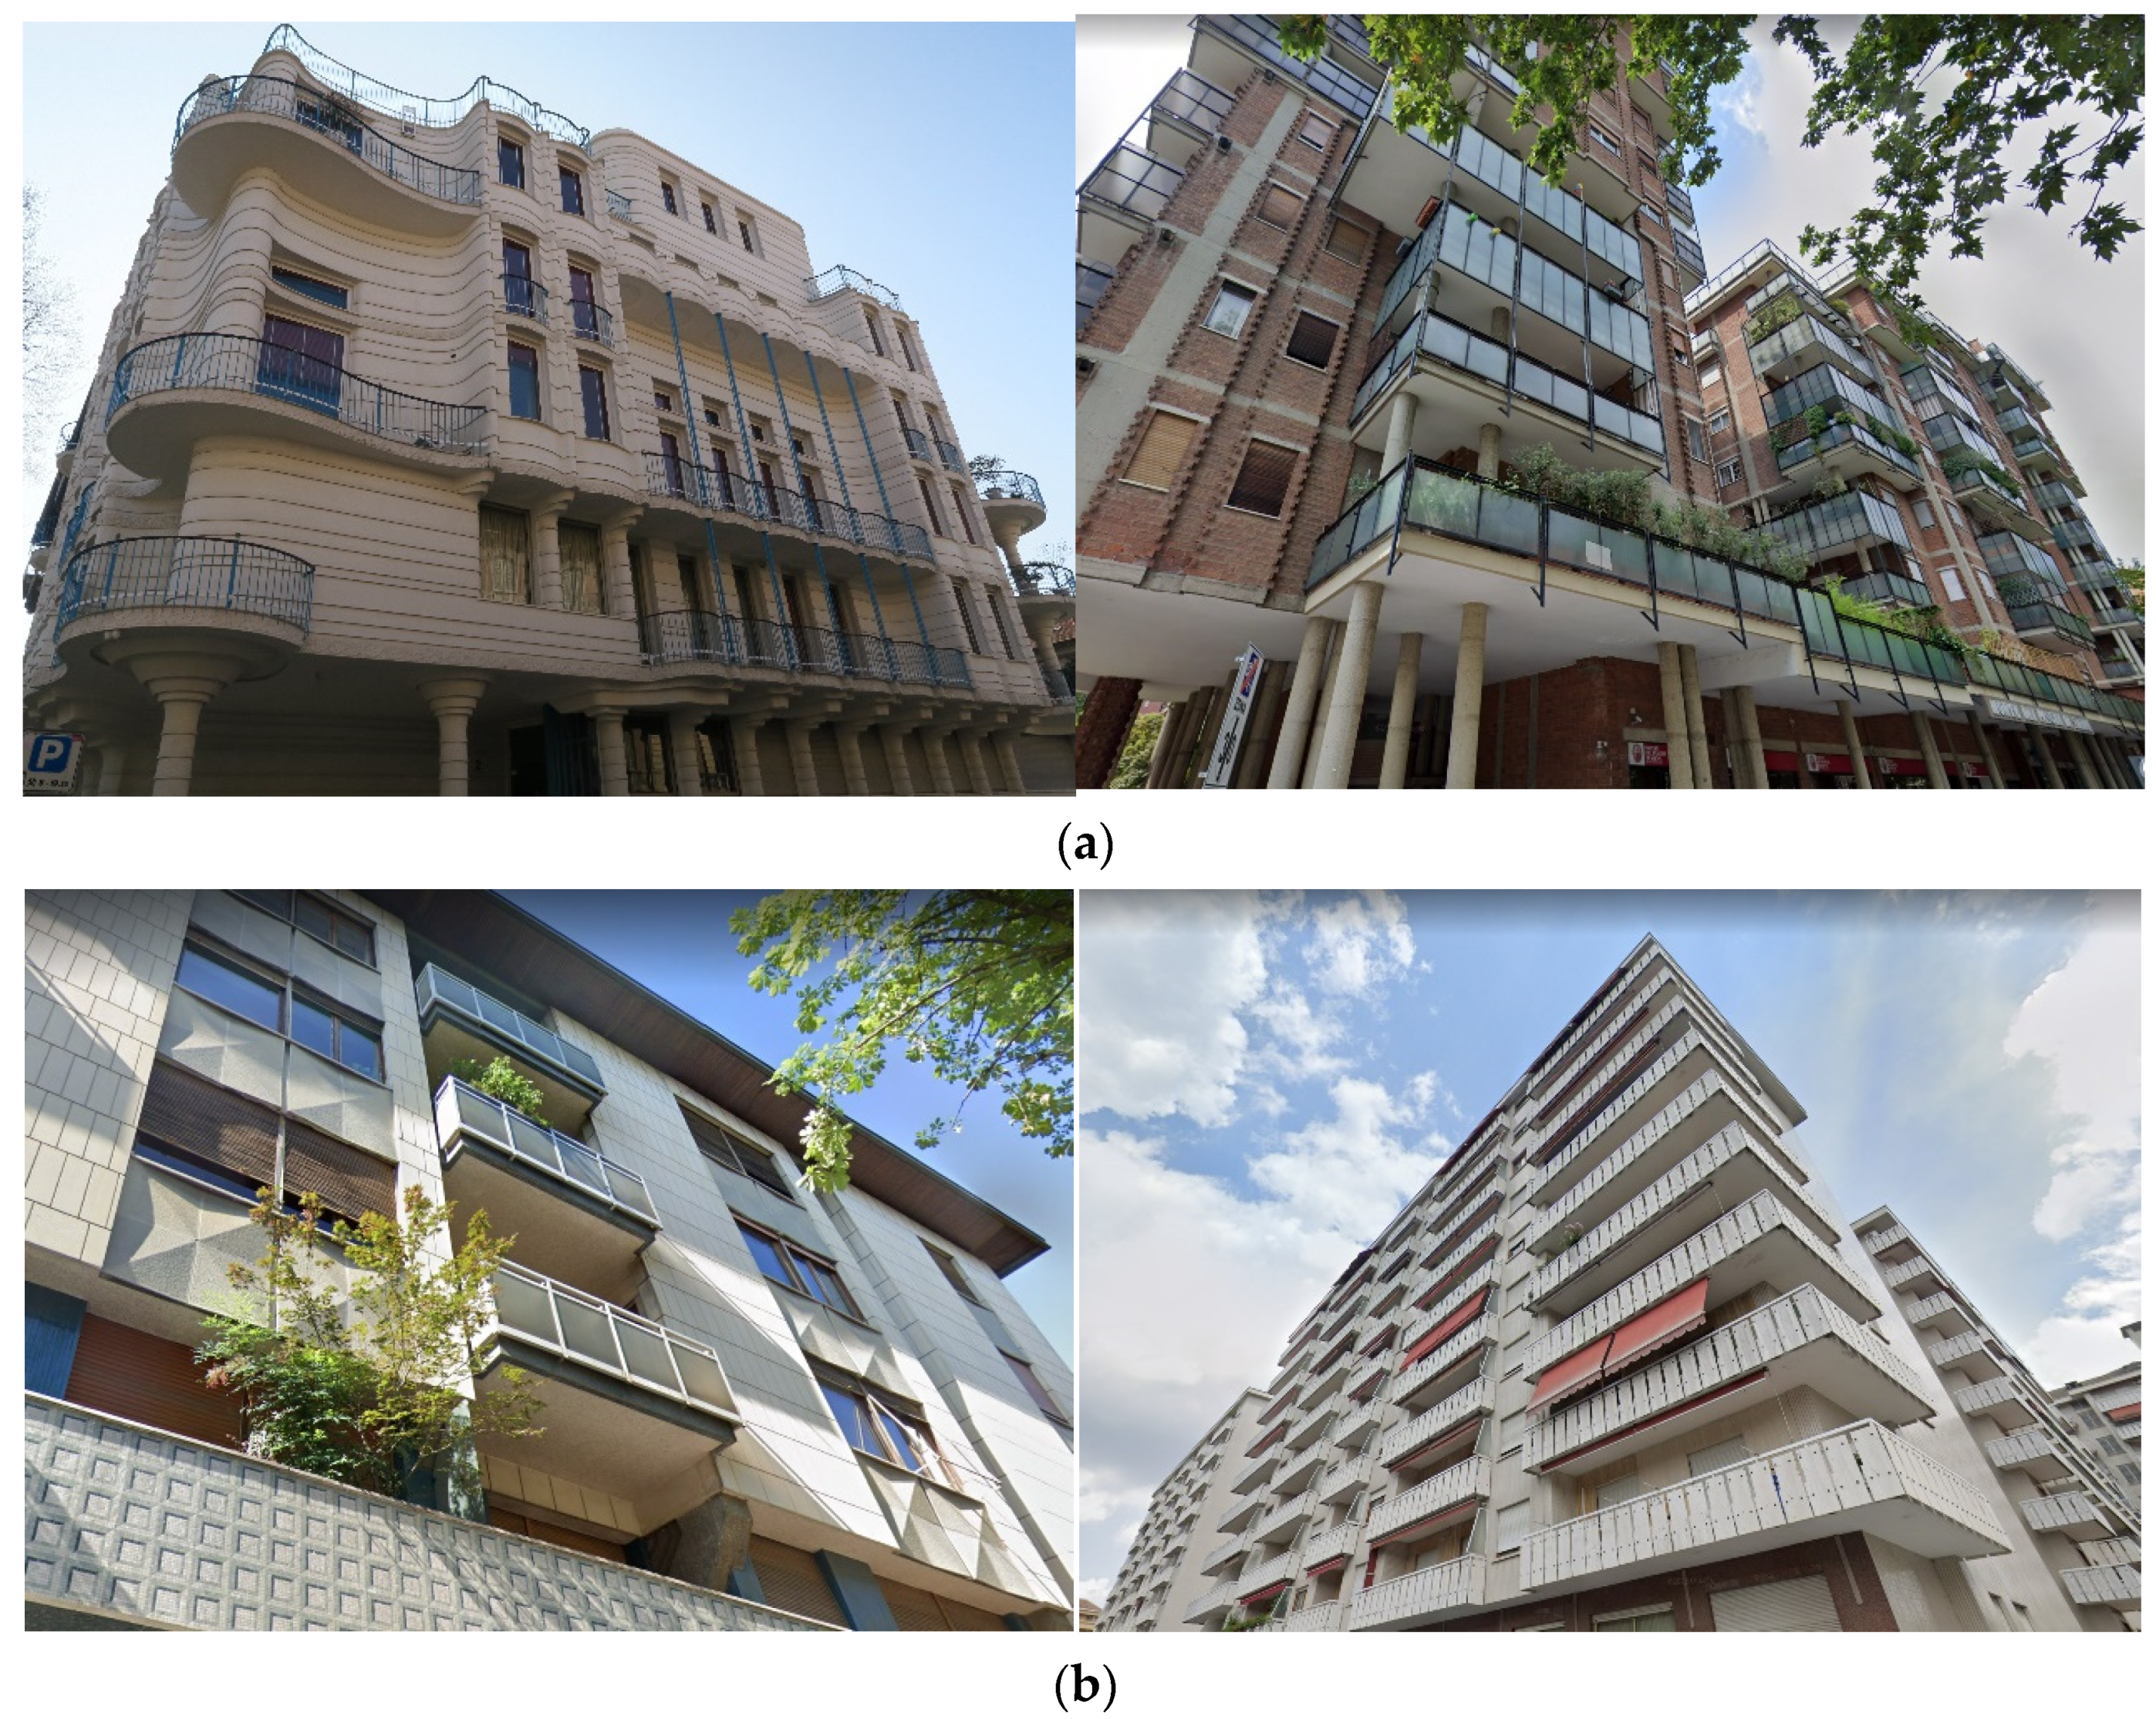
The contemporary residential heritage of high architectural and building quality in the urban landscape generally do not have striking characteristics and shapes that distinguish them in shape and typology from the ‘ordinary’ building stock, but indeed have appreciable elements of architectural and construction quality on their facades, in the use of materials, in the original use of voids and solids, or in the use of compositional facade geometries, etc. On the other hand, the understanding of real estate agents and buyers of the architectural quality of contemporary buildings is low; this implies the publication of real estate advertisements with a classification of buildings standing out for their architectural quality in a building category ‘medium’ or ‘low’, without further specifications, and with the related listing price consequently calculated only on standard characteristics and based on the location. On the demand side, this implies that the buyers are not used to see qualifying characteristics in market announcements, which distinguish prestigious buildings from those of the average standard of the second half of the 20th century; the ‘refinement’ of a building is only attributed to services, such as the presence of a concierge, the presence of double lifts, or the high state of conservation. Finally, architectural and construction companies rarely have the habit of publicly acknowledging the ‘authorship’ of their works, especially for residential houses; indeed, the latter are valued as architecture of secondary importance, compared to other works such as big buildings (schools, theatres, conference hall, etc.) that, if successful, are more easily attributed.
The databases relating to the architecture of historical–architectural quality are extremely fragmented, and it was necessary to use different sources The database of listings was provided by immobiliare.it and refers to all the residential units offered on the market in 2019.
Nevertheless, apart from the 11 sources used (Geoportal of the city of Turin, the Geoportal of the Piedmont Region, the Real Estate Market Observatory of the Agenzia delle Entrate (OMI), the web-portal of Immobiliare.it and the Italian National Institute of Statistics (ISTAT), Sigec Web, and MuseoTorino web-portal), there are no databases that record architectural and building quality, but only some characteristics. The geographical database used in this work was built up using different steps of spatial joining and query selection, which allowed unifying and harmonizing the different initial databases.
The initial data sample, related to buildings of cultural interest and/or of high building and architectural quality built during the whole 20th century in Turin, is made up of 1104 data, of which the sample relating to residential use is equal to 868 data, of which, in turn, the data sample limited to the second half of the 20th century is equal to 562 data (named QDB). In parallel, the universe of data related to real estate listings (Immobiliare.it data) on the market in 2019, for the residential sector was equal to 10,716 units, of which 6441 were buildings built in the second half of the twentieth century. This sample, combined with the previous one (7545 data), and, subjected to the cleaning processes necessary for the application of the models, was then reduced to 3705 data and named XXQDB. The final XXQDB was composed of housing listed on the market in 2019, of which 116 related to quality buildings and 446 data related to real estate units in buildings of architectural and construction quality, not on the market in 2019, the price of which, therefore, for the analyses carried out, was estimated using a Kriging interpolation process (
Table 1).
In the summary statistics, we can see all the variables analyzed: the variables used as dependent in the following models are the listing price of the residential units and its logarithm. The intrinsic physical characteristics are divided into building features and quality building features. Subsequently, the presence of spatial autocorrelation was investigated by calculating the Moran’s index, and LISA statistics were performed to show which types of spatial autocorrelation were present. After LM testing of OLS models, SAR models were performed and, by comparing results, the influence of the spatial effects on the whole explanatory power of the model was analyzed. These analyses were performed as explanatory regressions for the application of the GWR.
5. Results
The principal results of this work are two: the construction of the two quality indicators of recognised quality and observed quality, and the estimation of the influence of the intrinsic building features on the price formation process of each unit estimated in the sample by the GWR model application.
5.1. Recognised Quality (RecQ) and Observed Quality (ObeQ) Indicators
In Step 2 of the methodological approach, the construction of two indicators concerning the architectural and building quality was carried out, which are divided into ‘recognized quality’, which represents the quality attributed to housing buildings by entities for the protection of cultural heritage and by experts, in publications and books; and ‘observed quality’, which represents the quality that the author of this work attributed during this research, through a direct survey, on the basis of a list of about 20 elements and their levels, mainly related to: facade elements, geometries/shape of the building, and the level of workmanship of the construction. The two indicators can be defined as follows:
Recognized quality (RecQ) indicator, refers to the architecture that have already been documented and published in official documents, institutional sites, or architectural guides and magazines, and whose value and authors are known and knowable by all.
Observed quality (ObeQ) indicator. Given the small number of identifiable assets for RecQ, a second indicator was necessary. It is based on the visual surveying of building’s architectural and construction quality; in a future research development, these elements will be verified through archival research.
The percentage of quality architecture built in the second half of the 20th century in Turin is only 15% on the total number of buildings of the same period; this underlines that in the post war period until the 80s, the majority of the city was built quickly and with low expenditure, sacrificing building quality. Among these, only the 20% has a recognized quality; therefore, they are mainly unknown and need to be studied and certified (
Figure 3).
Buildings from the second half of the twentieth century have been studied by various organizations for several years [
66,
67,
68,
69]. In this research, the classification structure of the MIC census ‘National census of Italian architecture of the late twentieth century’ [
70] was adopted and simplified, to allow the surveying and classification of buildings not yet present in the databases of the Italian historical and architectural heritage. To assess the influence of a variable linked to the construction quality of residential buildings on prices, it was necessary to build new (qualitative) indicators, starting from the available variables (
Table 2). Following the main purpose of this research work (the analysis of construction and architectural quality in the real estate market), strictly historical research was delegated to future possible collaborations and insights.
The result of this classification, however limited and expeditious, has already led to obtaining satisfactory results, but it could be implemented and integrated with further insights and studies. The indicators described, being part of the broader group of building characteristics of residential units, were then analyzed using geospatial statistical procedures, which are presented in the next paragraph.
5.2. GWR Model Results
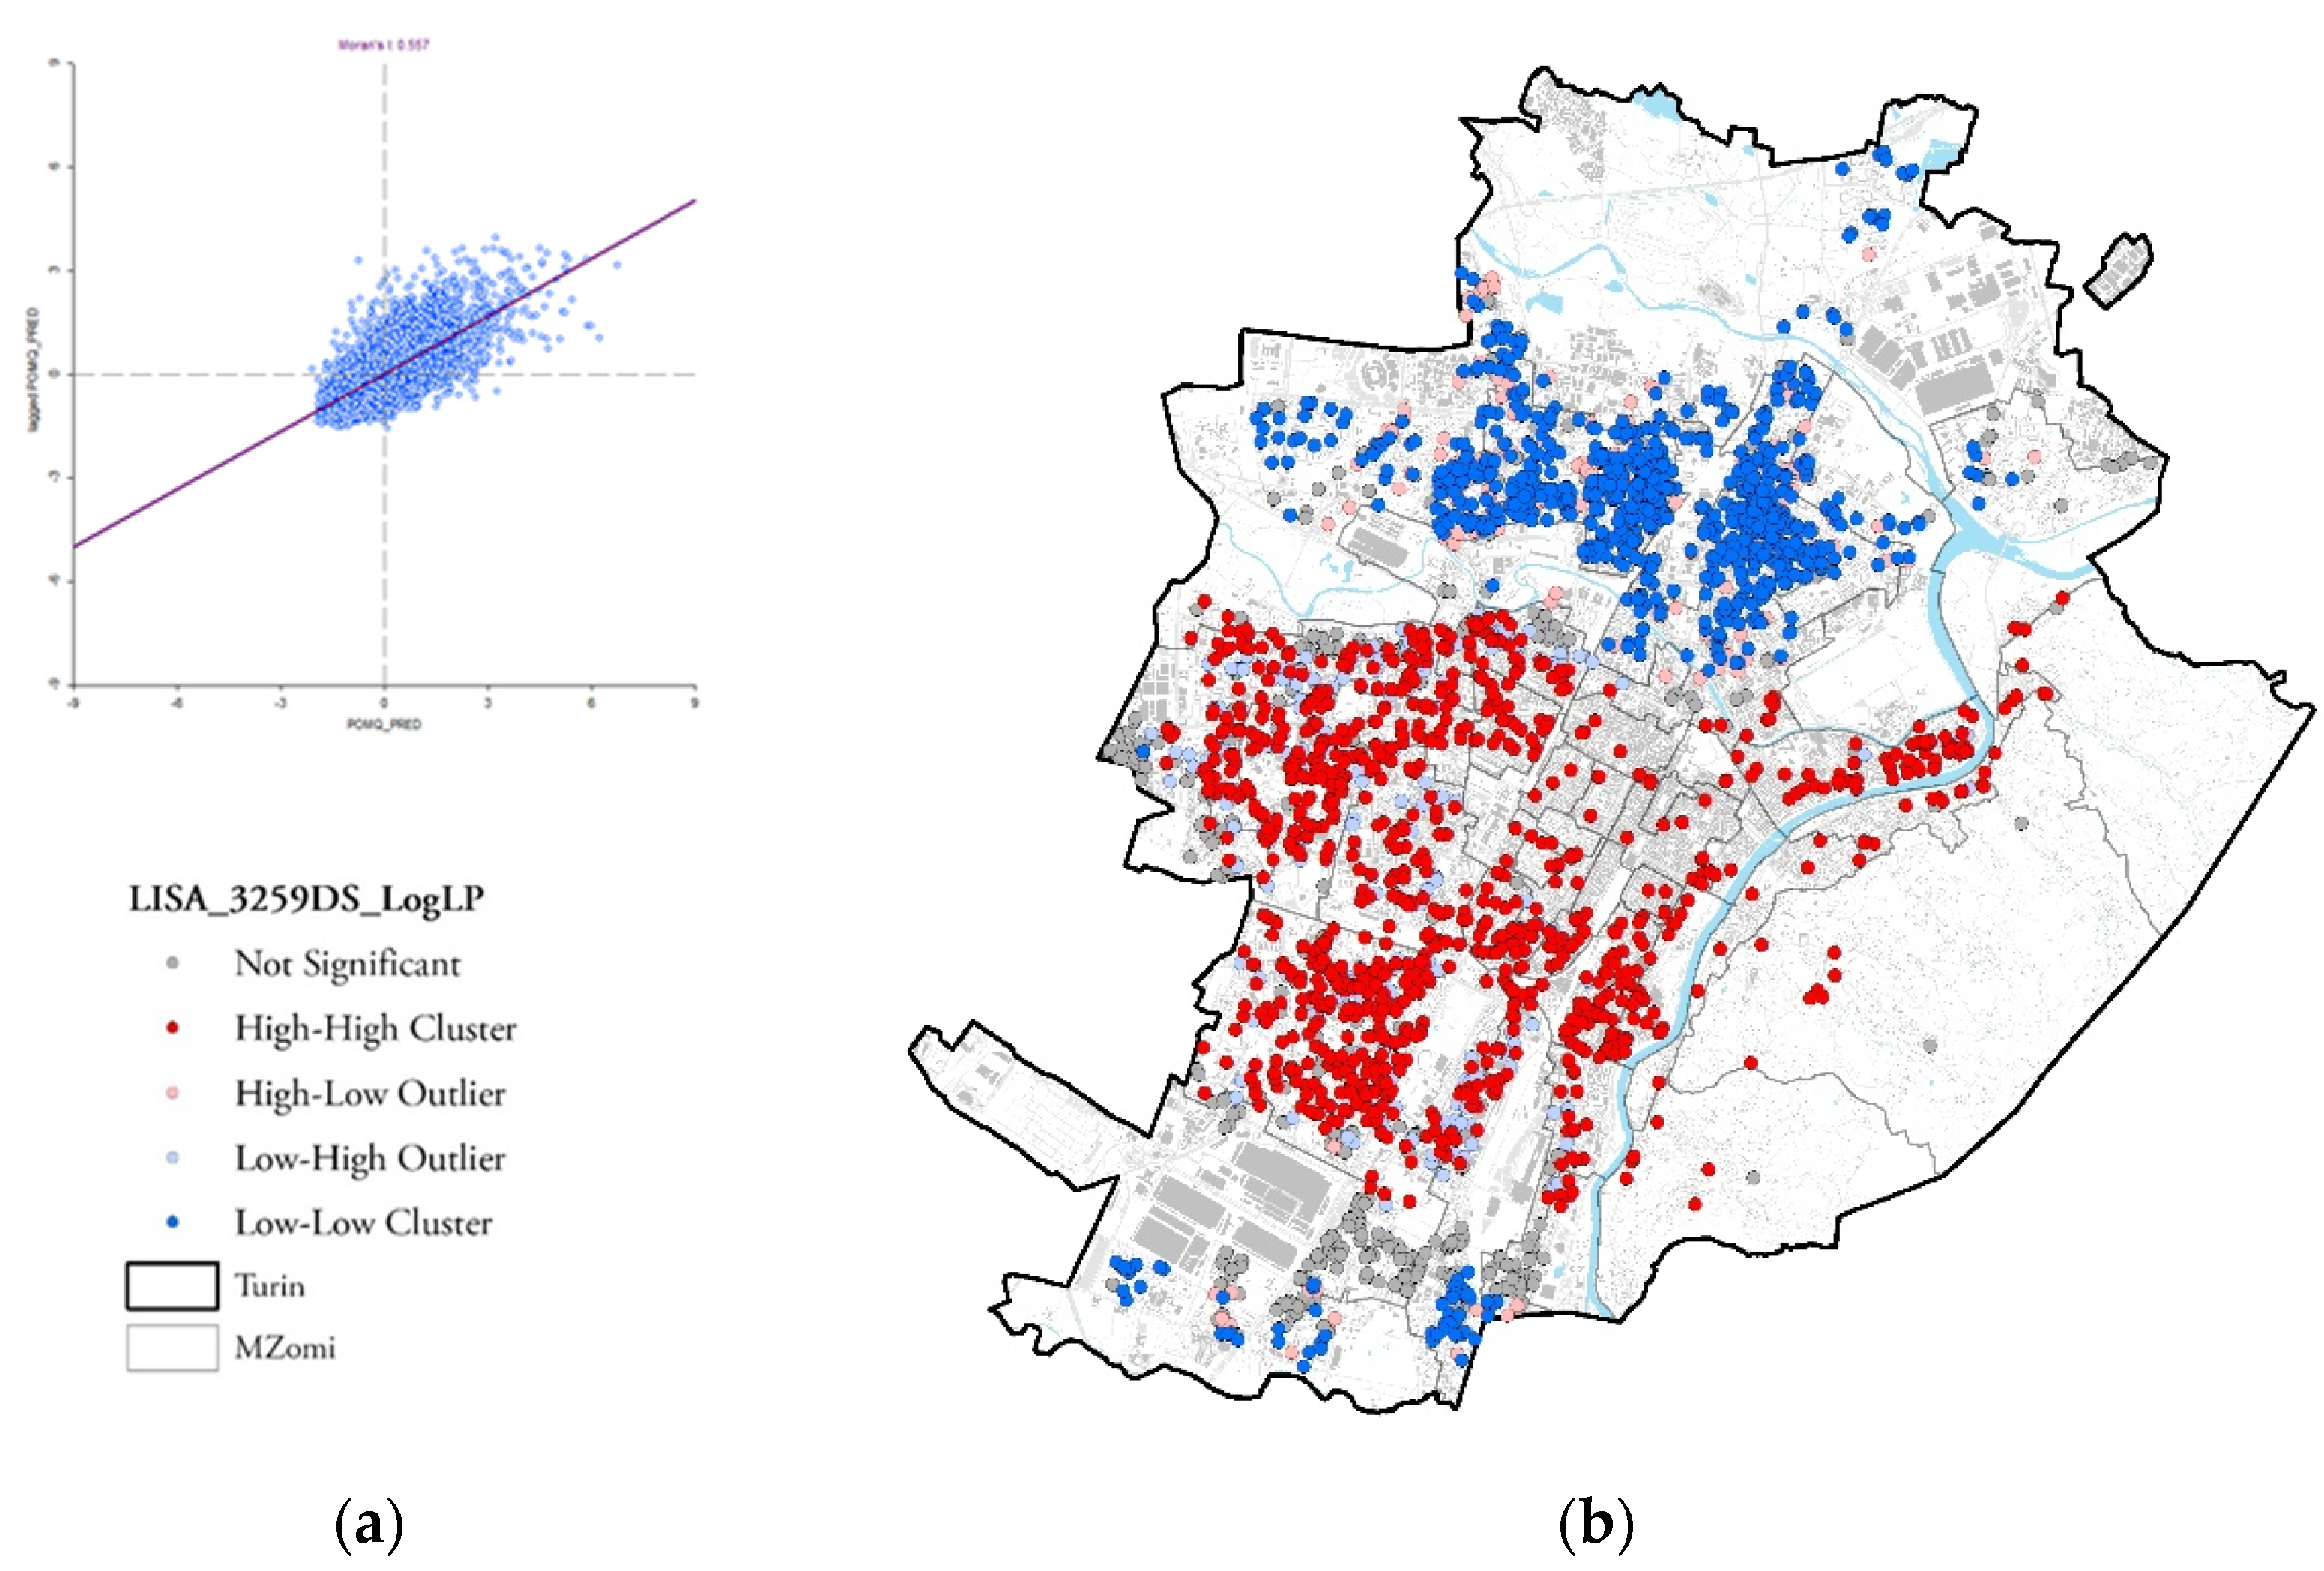
In Step 3 of the methodological process, Pearson and Spearman correlation tests were performed to verify the absence of correlation between variables; the results of the Pearson correlation test confirmed the absence of linear correlations between independent variables. The calculation of the Moran index highlighted the presence of a spatial autocorrelation in listing price (LP) values (Moran’s I = 0.557), and the Moran index scatterplot shows the positive autocorrelation. Furthermore, the cluster and outliers analysis (Anselin Local Morans’I-LISA statistics) identified high–high and low–low clustering of LP values (II and IV quadrants), as shown in
Figure 4.
The results of the LISA statistics (
Figure 4) on listing prices suggested a striking geographic clustering of LP in three urban areas: two clusters, located in the northern and southern zones of Turin, showed positive autocorrelation of lower values; the third cluster, which was mostly condensed around the central areas of the city, presented a positive autocorrelation of higher values.
The exploratory regressions, performed in Step 4 of the methodological process, identified, among the initial 12 exploratory variables, the seven variables able to better explain the LP variation in the regression model. The more effective model, which avoided variables with covariation and minimized multicollinearity, is synthetically reported in
Table 3.
Regression models (OLS, SEM, and GWR) were applied on the data samples. The XXQDB sample was composed of 3705 data and formed by listings from 2019, with the addition of 446 data related to units belonging to architectonical quality building data that were not on the market in 2019. A Kriging interpolation process was performed on the observed LogLP analyzed in the XXQDB sub-sample (2359 data), to estimate LogLP for each point of the 446 quality buildings that were not on the market in 2019. The new completed data sample, composed of 3705 listing prices, was used for all the subsequent analyses. Regressions results are compared in
Table 4.
More specifically, the Spatial Error Model (SEM) results are reported in
Table 5. The SEM model had a better fit than the MRA-OLS model, due to the presence of spatial autocorrelation. Nevertheless, SEM is a global spatial model that can manage the spatial dependence of variables with a homogeneous weight for all observations.
The results show that the SEM model can explain 70% of the price variation (R squared = 0.695), which is extremely significant, even when compared to the explanatory power of the OLS model. The most significant variables and the highest marginal prices were reported for the two ‘locational’ variables: the average MZomi price (MZomi = 0.268), and the Lambda coefficient (Lambda = 0.658) of the error model. The presence of a lift (LFT = 0.137), the maintenance level of the housing unit (MTL 3 = 0.118), and the group of EPC labels (EPC 3 = 0.087) were also significant, with positive marginal coefficients. As concerns the quality indicators, the observed quality (ObeQ) is significant, but has small and negative coefficients, while the variable RecQ has no significance. Other intrinsic features are significant, with small marginal prices. The results of the SEM model, once again, confirm that, based on the property prices, the real estate market recognizes location as a fundamental variable in the price formation process, capable of absorbing most of the price variability.
The final step of the methodological process adopted was the application of the GWR model, to detect if and how marginal coefficients vary in the city of Turin. The results of the GWR model are summarized in
Table 6.
The GWR model can ‘globally’ explain 68% of the price variation, which is almost the same as the SEM model. Nevertheless, the AIC is smaller, thus confirming the GWR as the better model. However, it must be considered that the ‘global’ result of a GWR model is less interesting than the local one, since the value of GWR is precisely that of calculating a regression model for each point in space, while also weighing this compared to the values of other nearby points.
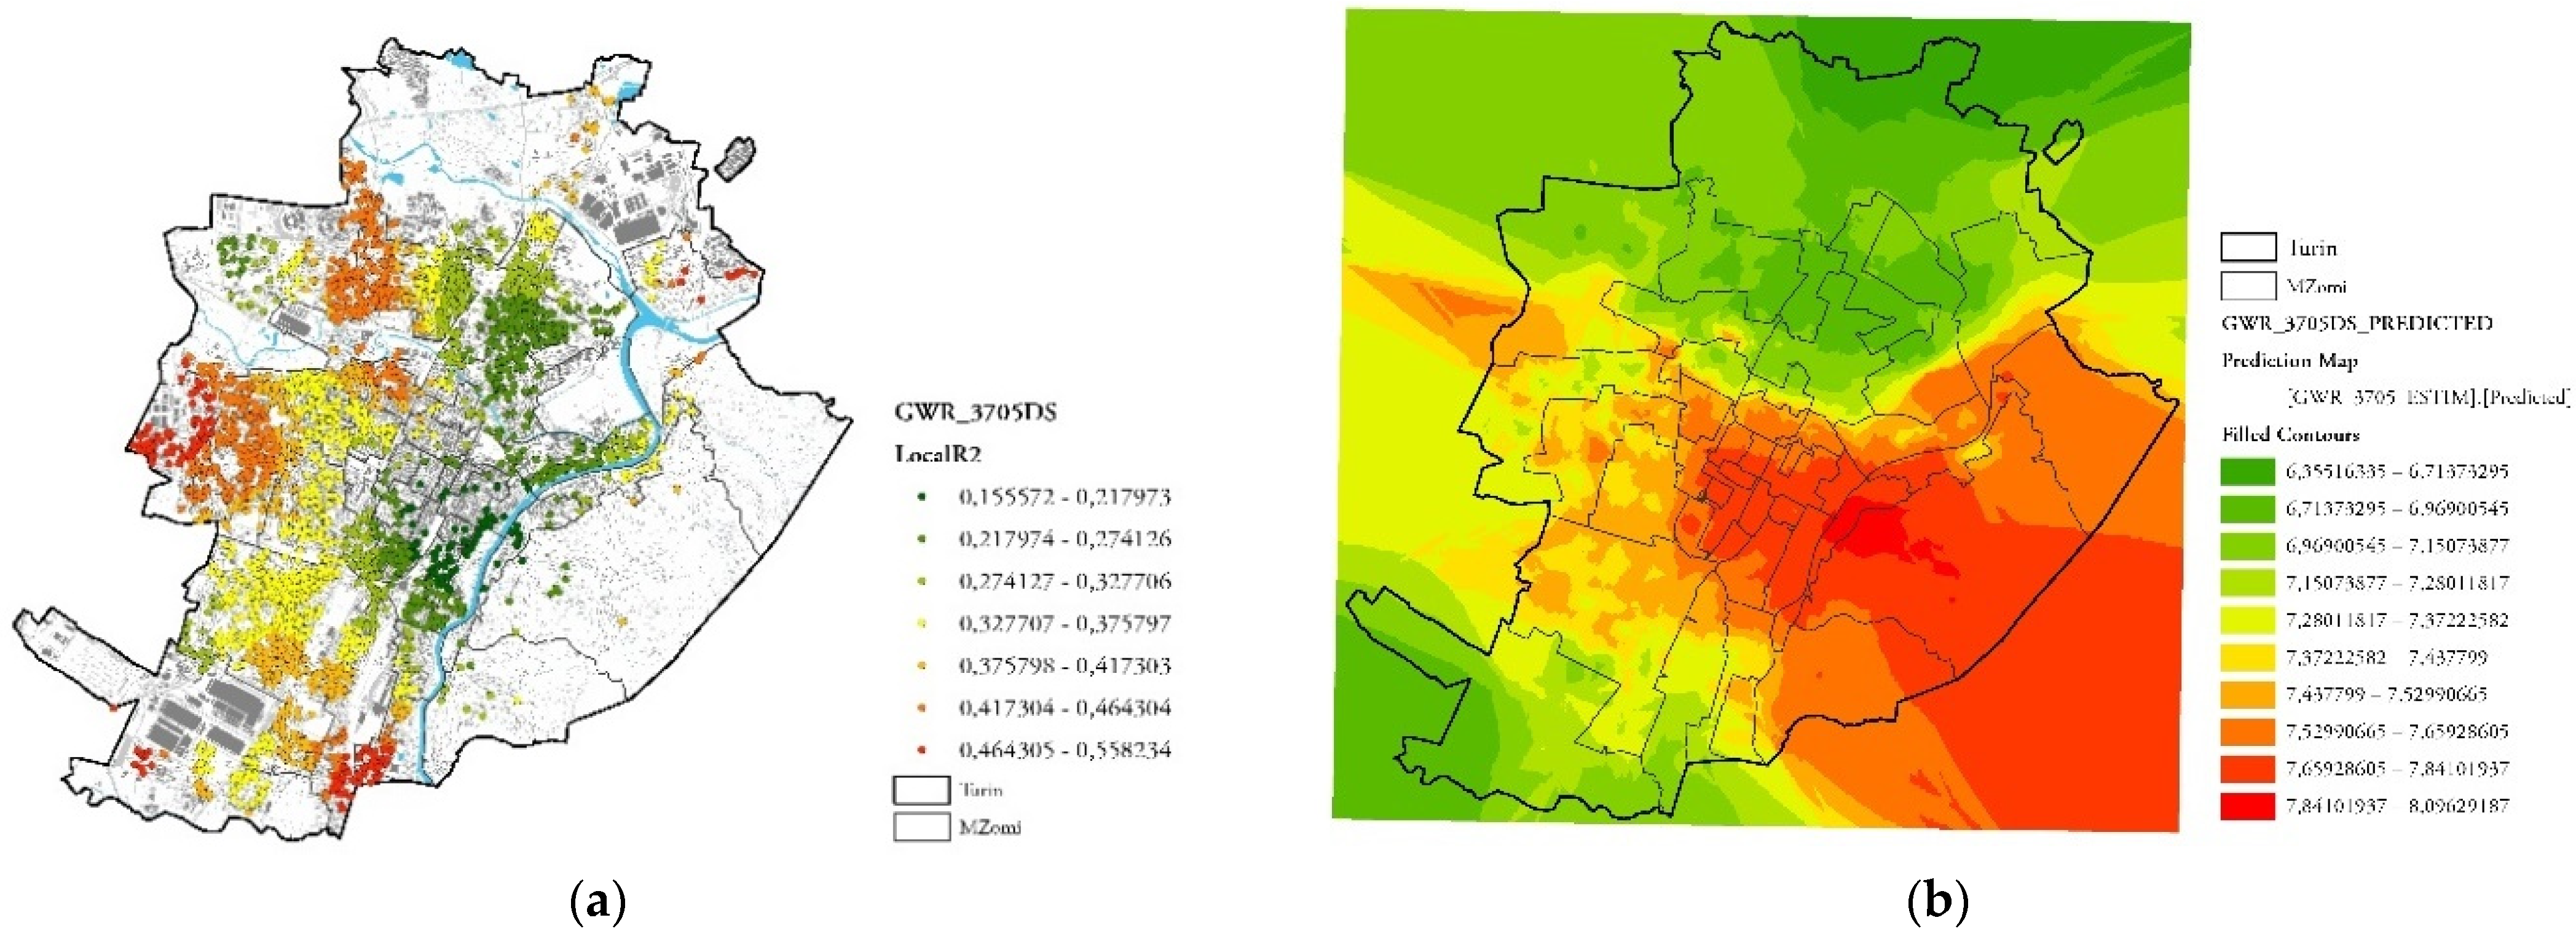
Figure 5 reports the distribution of the Local R2 of the GWR model and the Kriging surface of the predicted values. The pattern of predicted values corresponds to the observed values distribution, and standard errors and residuals appear randomly distributed in the urban area; thus, confirming the good fit of the model.
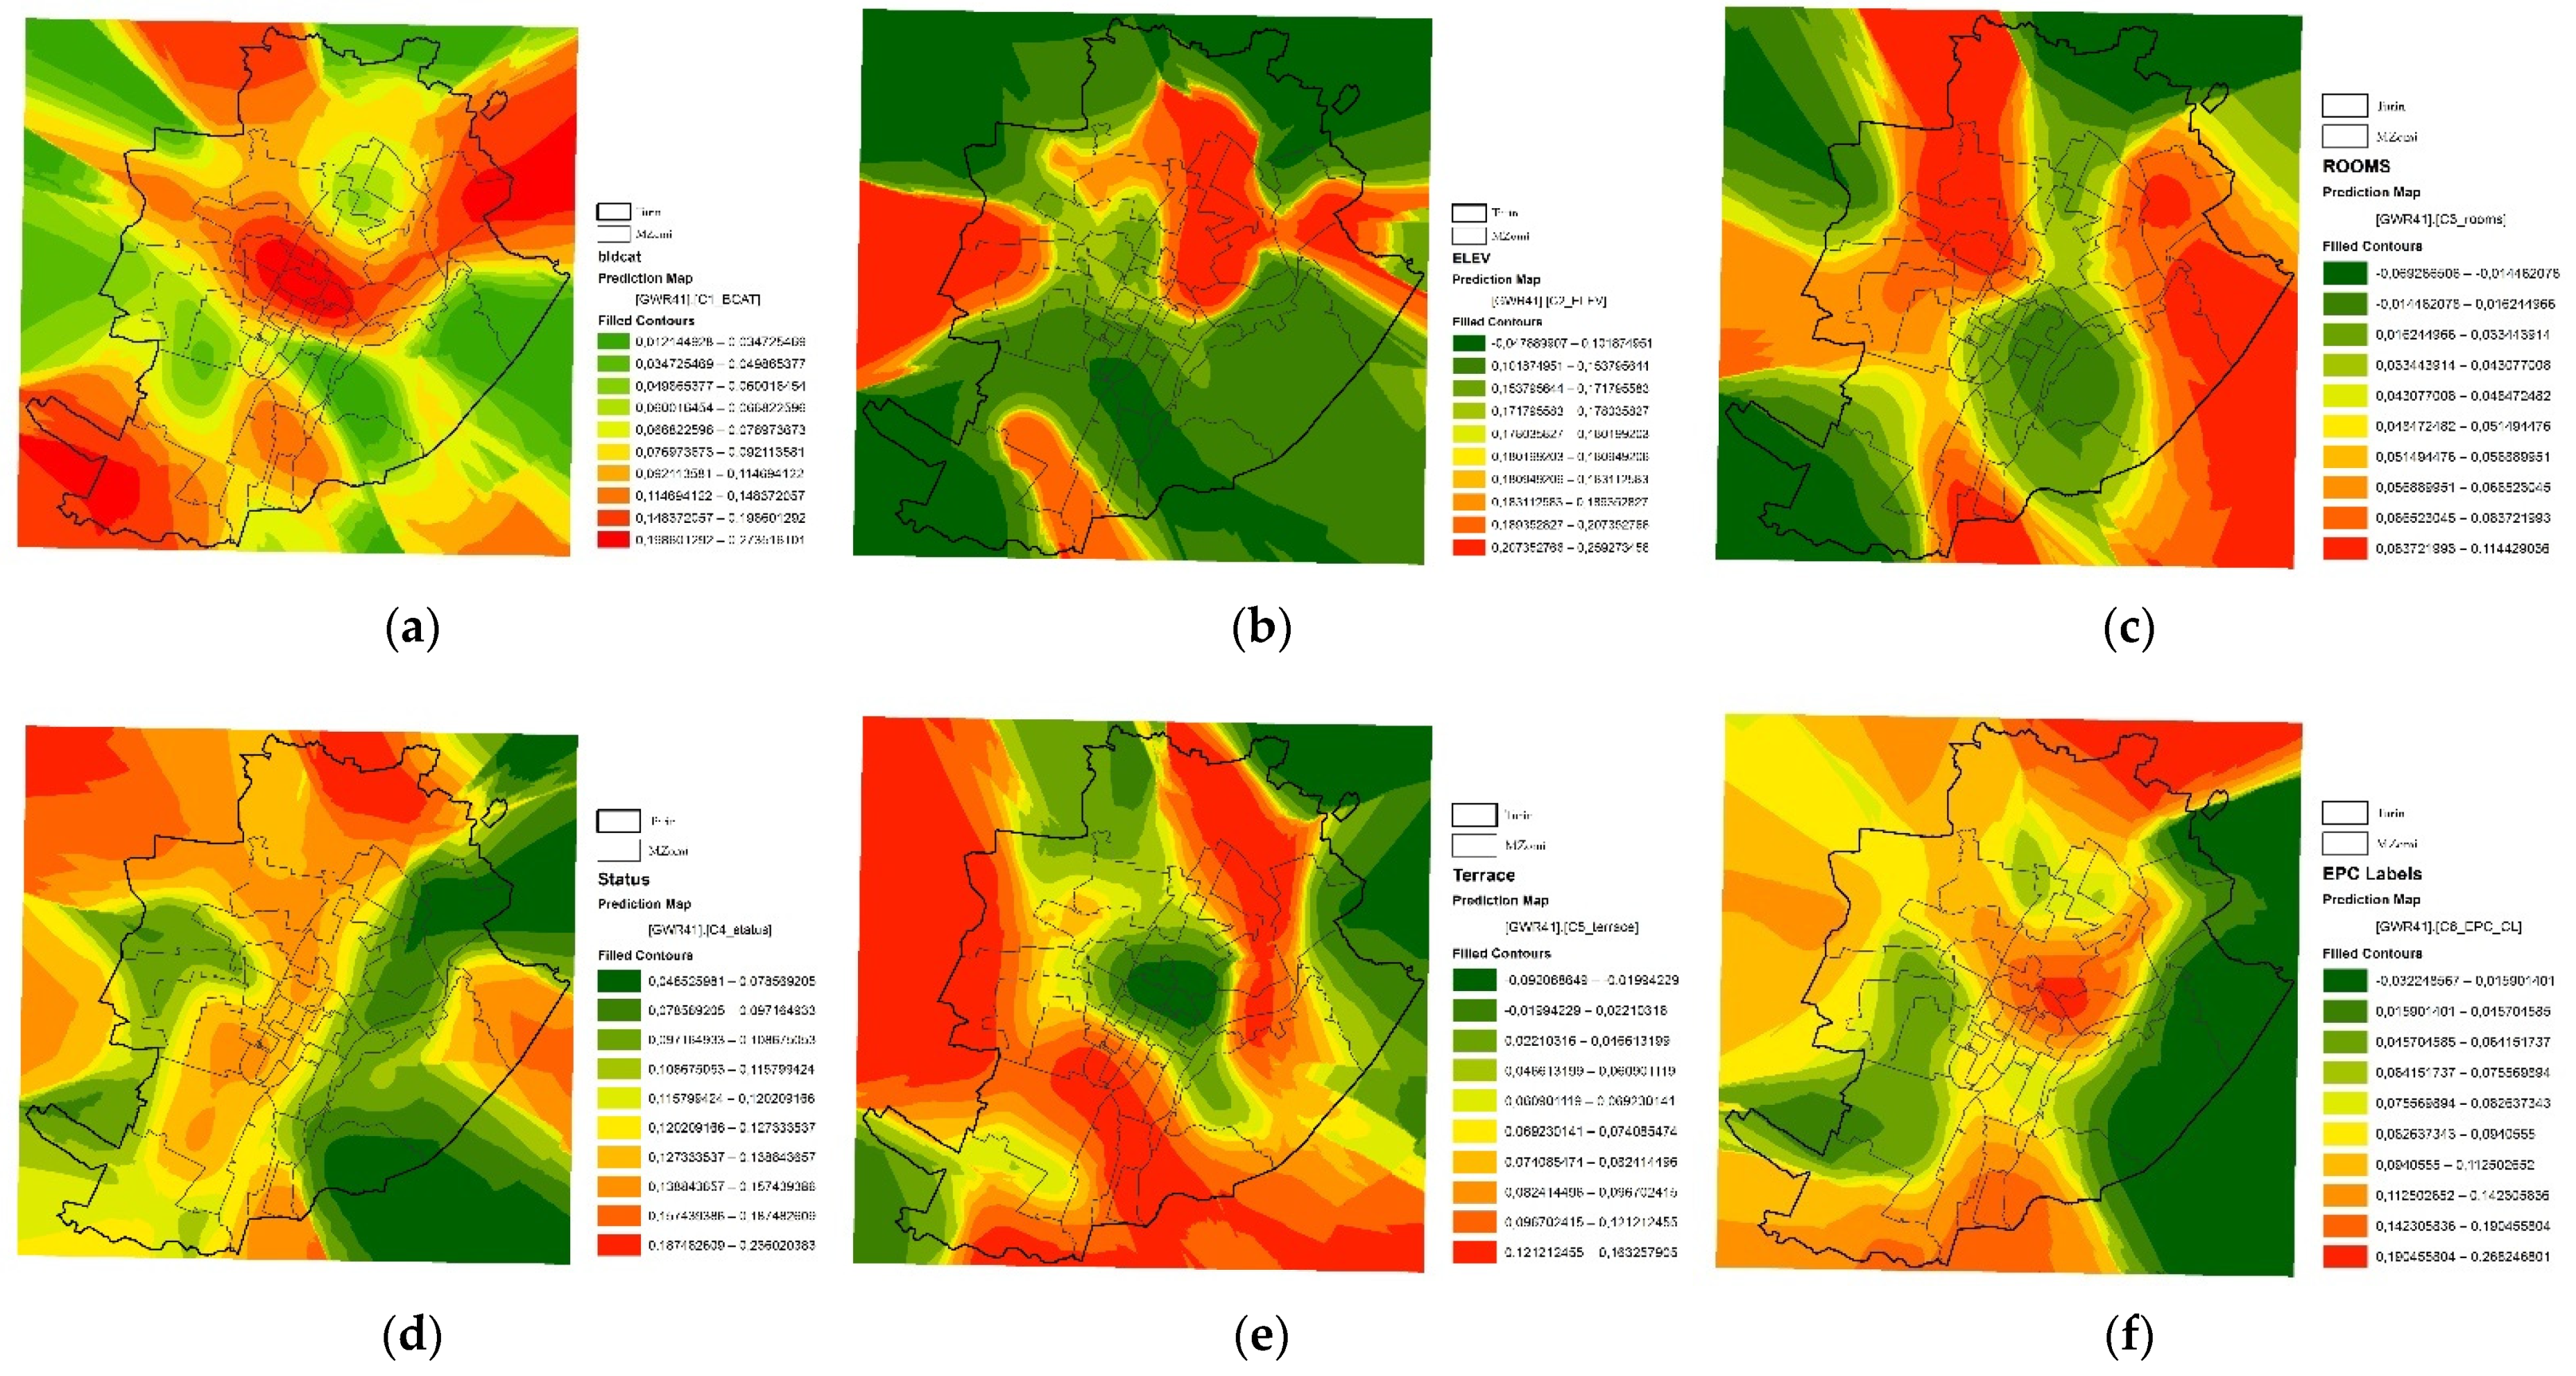
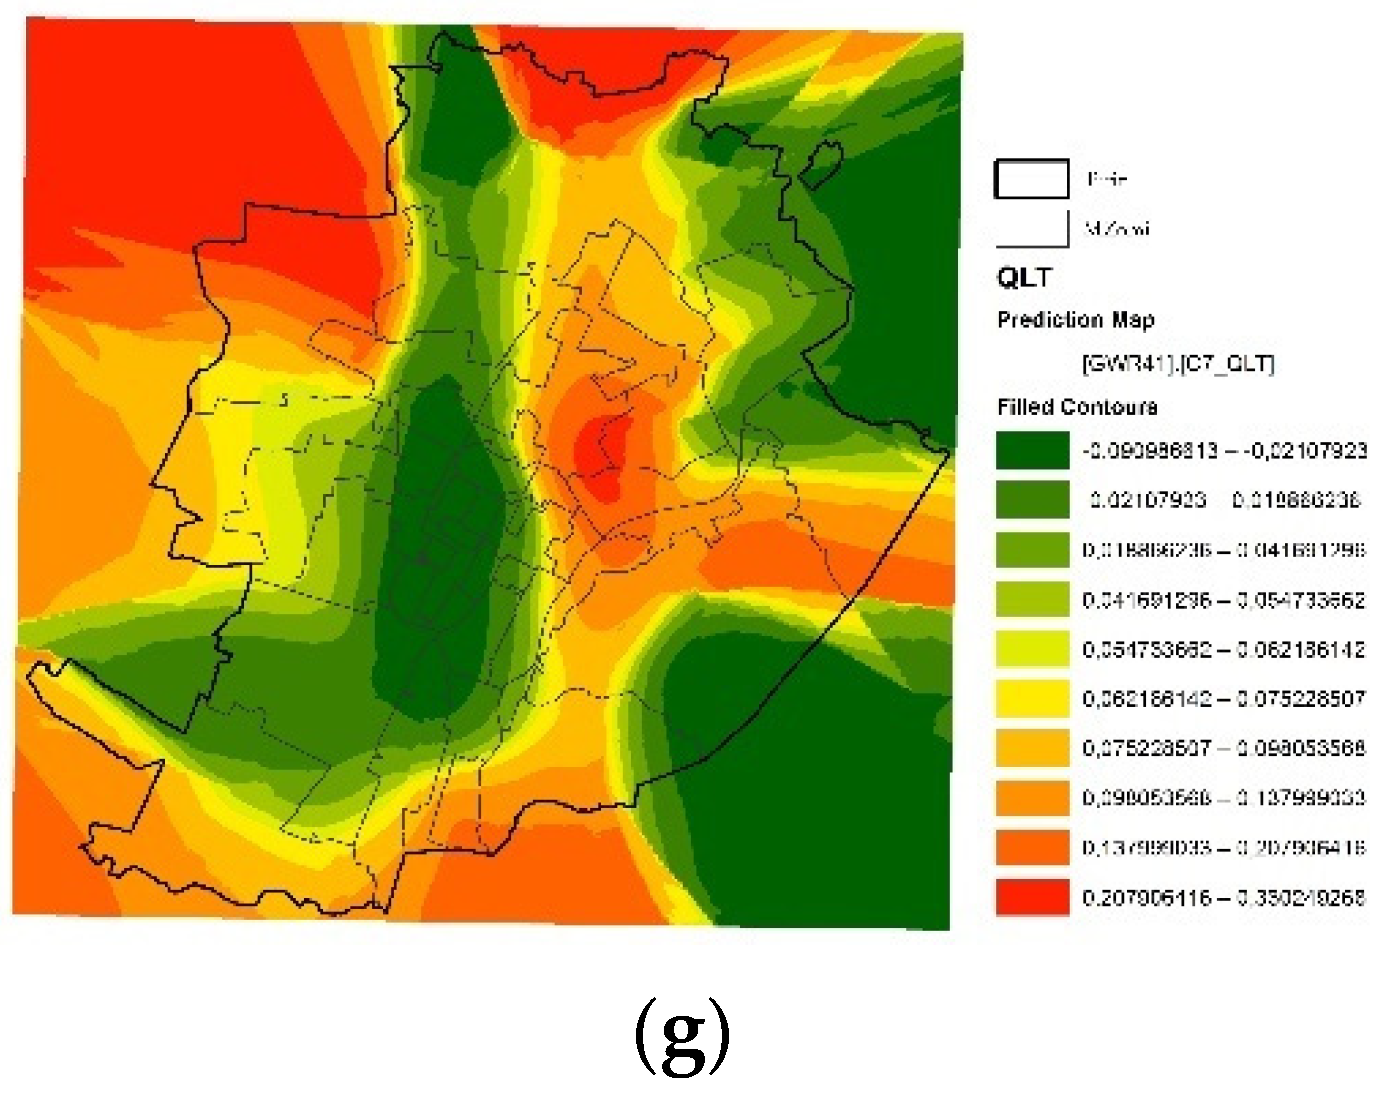
The final results of the GWR model are presented in
Figure 6, where each of the seven explanatory variable’s predicted values are represented in a separated Kriging surface map.
The results of the GWR model confirmed that, based on listing prices, the real estate market considers the location of the building/unit the most significant variable in the price formation process. It is possible to notice that the local R squared has a varying distribution across the urban territory, as well as the good fit of the model predicted values with the observed ones. This allows stating that the formation of prices really takes place in a point-like-way in space, precisely due to the action of many latent variables.
The building category (a) and the presence of a lift (b) have a higher and positive influence on price variability in the northern part of the city, near to the historical city center. The presence of an elevator is appreciated by the market in those few parts of the city where most of the buildings have none. While the number of rooms (c) and the presence of a large terrace (e) seem to have a quite similar pattern, which coincides with the highest positive values in the western and southern zones of Turin, which are characterized by new building stock with larger houses in bigger condominiums, from the 1960s. On the contrary, the level of maintenance (d) seems to have an opposite pattern to that of the architectural quality (g), confirming that the market hardly distinguishes the quality in buildings of low construction category or that are degraded. Finally, EPC level (f) has a distribution of predicted values quite similar to building category (a), also confirming in this case that the higher EPC levels are currently appreciated in the market, in the same manner as the building category. Economic and tenement building often have low EPC labels, while stately buildings have higher EPC labels.
It should be remembered that building production in the second half of the 20th century was based on a segmentation of demand by income levels, which correspond to specific types, well represented by the cadastral categories (classy, prestigious, etc.), and distributed in certain areas of the city [
4]. In recent years, the variable that has gained more attention in the real estate market analysis is the EPC label, and also starting to be monetized by the real estate market. This means that the national energy policies and legal constrains (EPC has been mandatory for all transaction contracts since 2012, and minimum energy requirements have been mandatory for all types of building interventions in Turin since 2007), are increasingly gaining importance among the characteristics that guide the buyers’ choices [
63].
Therefore, new social models are emerging in the Turin real estate market influenced by greater environmental awareness; in turn, there is a simultaneous loss of interest in locations without neighborhood services, despite the presence of natural amenities (e.g., the Turin hills) [
5]. This change, of course, is generally due to modifications in the structure of families and the aging of the population; while, recently, the COVID-19 pandemic crisis has also led to a change in the preferences of buyers looking for larger houses (to have a studio) and with balconies or terraces, if not gardens. In this context, driven by an increasingly selective demand, which favors urban areas characterized by urban vibrancy [
5,
6], architectural and construction qualities seem to be partially neglected.
Architectural quality is only perceived and not yet monetized, as it would be expected, for several interrelated reasons. First, the percentage of buildings of architectural quality is too small compared to the overall building production achieved in the second half of the 20th century. Consequently, the number of buildings of architectural quality offered on the market is too small, and this makes the analyses more complex and, therefore, the models less robust. Second, the architectural quality, authorship, and quality features of buildings are not considered as they should be in the real estate advertisements, a fact that does not help the choices of buyers, who instead perceive other qualities, including the energy features, which is increasingly influencing the market. Last, it should be emphasized that it is often difficult for non-experts to grasp architectural quality by distinguishing it from building quality.
This result can be explained by several reasons, the most probable is that location and building category absorbs the explanatory power of quality attributes. On the other hand, the green qualities expressed by the EPC labels have started to emerge, as also demonstrated in other studies, as an important variable, probably due to the green culture that is becoming even more widespread.
The results of the global spatial regression models that are classically applied in housing market analysis, must be rethought, considering that the price formation mechanism is more articulated and complex than is theoretically simplified. The ‘position’, represented from the POIs corresponding to each building, can determine huge variations in the marginal coefficients of the buildings and in the architectural characteristics.
In other words, the spatial influence and the weight of the marginal coefficients of housing characteristics are not constant at the territorial level, but vary point by point. Consequently, analyses that consider space using position as an explanatory variable or using territorial clusters, corresponding to territorial segments and sub-sets, can lead to distorted results and/or interpretations that underestimate the actual role played by space in the value formation mechanism.
6. Discussion
The impacts of the results of this research work concern two main fields: public protection policies, and the development of analyses on the real estate market. As regards public policies, in fact, it is possible to identify some differentiated and integrated actions aimed at the dissemination and conservation of the twentieth century heritage, to be implemented at the building and territorial levels. In the field of mass appraisal this work confirms the utility of the use of estimation tools capable of enhancing the prediction capacity of statistical models, to better read and foresee real estate market changes.
Public policies relating to cultural heritage (both public and private) may aim at bridging the cultural gap in acknowledging both the value of modern and contemporary architecture and the importance of conservation; moreover, these policies educate about the necessity of energy retrofitting of building heritage and of sustainability for environmental protection. The actions that can be carried out are different for publicly owned or publicly usable assets (large buildings) and private (residential) assets that are bought and sold on the market. The platforms, already existing, inherent to the great architectures built in the twentieth century should be interconnected at an international level and to residential architecture, to promote the diffusion of the values of modern and contemporary architecture.
Actions on energy redevelopment building policies are necessary and urgent. The residential heritage of the 20th century is very energy-consuming, and it therefore needs green retrofit interventions. It is, therefore, necessary to encourage and manage the energy retrofit interventions, also considering that buyers are becoming even more aware of environmental quality (higher EPC labels). Green policies must encourage retrofit interventions and at the same time protect the original value of the assets. The quality of the built heritage of the second half of the 20th century must be distinguished, and the identity of this historical built heritage must be protected and preserved, despite the weaknesses of their socio-economic context.
Italy is implementing fiscal incentive policies aimed at the energy upgrading of building heritage, which can put at risk the architectural features that characterize the heritage of the 20th century not under protection. The ‘Super Eco-bonus’ and ‘SuperSisma-Bonus’ (Italian Law Decree, 19 May 2020, n.34) foreshadow important incentives for the qualification of existing assets, with the objective of increasing environmental sustainability, but without formally considering the architectural quality component of the built heritage, much less of contemporary heritage.
Therefore, it is necessary that the resources that are available today, or that will be available with the ‘Next generation EU’ funds, are territorially concentrated in vulnerable urban areas, in order to favor the processes of urban redevelopment and regeneration and to guide interventions on quality architectures that fall into difficult socio-cultural contexts, which prevent their enhancement.
The presented research work also opens the way to various possible applications and insights for real estate market analysis, on a methodological and theoretical level for the formalization of new hypotheses concerning the mechanisms that regulate the real estate market. The methodological approach presented can be applied, with few changes, to other Italian urban contexts and this would allow its validation, as well as offering interesting comparison results. Moreover, it could be applied to smaller and diversified urban sub-areas, to better read and interpret some micro-phenomena, which influence the transformations and the use of buildings at the district or neighborhood scale.
Models could be strengthened by the introduction of variables related to the extrinsic features of buildings, as commonly suggested in the literature. This would allow describing different aspects of the surrounding/neighborhood quality by the construction of different indicators: e.g., the quality of the views, the quality of public areas in the neighborhood, the quality derived from the vicinity to green areas, the quality of access, etc. This would be useful for real estate operators and valuators for estimating the quality of the surroundings, exactly as in that of the building.
Finally, the use of spatial-temporal statistical models could be considered (GTWR), based on time series, to explain how ancient and modern heritage has been appreciated by different societies over time. Furthermore, other models could be used to analyze the stochastic and non-linear components of housing demand, and to also assess the dynamism of urban and extra-urban areas. This should always be undertaken with the aim of understanding the mechanisms that affect preferences over time and space and, therefore, to directing policies and interventions suitable for satisfying the needs related to living in its many forms.
Other directions are suggested by the results of the analyses, in trying to answer to the following questions: how the energy efficiency interventions of modern designer buildings with a high architectural and historical value can favor their renovation and guarantee their conservation in the time? How is it possible for a retrofit intervention to restore the quality level of the original design, or improve it?
The regulatory documents on the energy efficiency of buildings always specify, for protected heritage, the need for a balance between conservation and environmental issues, but they never specify the implementing of rules and practice; they are not translated into operations aimed explicitly at the development of high-quality interventions of the building and the micro-surrounding. To ensure their historical-architectural value is acknowledged by citizens and buyers, modern and contemporary buildings probably need, not only a higher energy efficiency, but also a qualitative improvement in terms of plant equipment, common spaces, general appearance, and services. In this way, probably, even if their reference market will never be able to compensate the expenditure incurred for energy adaptation with a sufficient increase in value, the transition from an economic to a medium or classy building category could.
7. Conclusions
Economic and environmental sustainability is becoming the main objective of all development policies at national and international level, due to the increasingly urgent changes required by climate change. Energy audits of buildings are starting to be used more and more to evaluate supplementary or replacement energy interventions, only with respect to the adaptation of existing structures. However, while energy audits often confirm the environmental value of conserving more traditional buildings, this usually does not happen for buildings designed from the mid-century onwards, which, conceived and built in an era when energy and economic resources seemed inexhaustible, are now highly inefficient.
As in the rest of Europe, Italian buildings of the twentieth century also seem to require a first general maintenance intervention (of medium level) after only about 25–30 years from the construction, which is about half the time of more traditionally built buildings. In addition, extraordinary maintenance interventions may be required within 50–60 years from the construction, rather than in the 100–120 years commonly documented for the more traditional building heritage [
71,
72]. Therefore, nowadays, virtually all the buildings built between 1950 and 1990 could require such massive interventions.
In Italy, from the point of view of the regulatory framework of protection, private residential buildings under the age of 70 are not subject to protection provisions and, therefore, cannot be the subject of a declaration of cultural interest (Law Decree 42/2004, art. 10, comma 5). Even if contemporary Italian heritage has been widely studied and classified, it is still commonly not present in the official online databases of the sector. In particular, residences (both condominiums and villas) are more frequently absent, even though they constitute a large part of the built heritage of the cities and an important part of the architectural development of the twentieth century. Residential architecture is even less studied but has peculiarities and values that should be highlighted and known. In the residential sector of the second half of the twentieth century, architectures were created both for the public sector (entire neighborhoods with affordable houses mainly for immigrant workers), and for the middle and upper classes (new bourgeoisie). Regardless of the type, the distinction of building quality is not very common, both on the part of demand (of citizens) and on the part of real estate market operators; and even the real estate market itself hardly acknowledges and monetizes its value, allowing the influence of other intrinsic and extrinsic characteristics, as well as the location, to prevail in the price formation mechanism.
The present work aimed at understanding whether, how, and in what measure the qualities that characterize the residential heritage can influence the price formation process. Specifically, the research addresses the role that economic evaluation can play in analyzing how individuals perceive the architectural quality of contemporary architecture and monetize it through the real estate market.
The results showed that neither architectural quality nor building quality are currently variables that are homogeneously monetized by the real estate market, and both were poorly perceived by global and local models, with significant marginal coefficients, as is the case for other physical building features. This result can be explained by various reasons, but, in general terms, led to the affirmation that the residential heritage of the late 20th is neither recognized nor appreciated for its qualities by most buyers, regardless of the reasons. In fact, non-expert buyers, while they can easily recognize the quality of ancient building heritage or the new building stock, commonly undervalue and do not recognize the modern and contemporary architectural elements that characterize the architectural heritage of the twentieth century designed by architects belonging to the modern movement or subsequent architectural currents.
The models results allow making some additional considerations. The results on energy quality demonstrate how consumer preferences are changing regarding appreciating intrinsic buildings characteristics, a fact that does not exclude that, in the future, the market, appropriately solicited, may also consider the architectural quality. Refined cultural tools are required, in order to recognize and distinguish the architectural quality from the building one: their difference is very thin, especially in residential heritage.
Architectural quality is confirmed as a particularly complex variable, as it is often not made explicit by advertisements and as its translation into marginal coefficients depends on the interaction with other variables. In particular, the architectural quality, intended as the design, composition, and construction features of 20th century buildings, is often a proxy variable of the building category and the maintenance level. The recognition of the architectural value of contemporary buildings is still reserved for experts, who can only partially guarantee their protection, above all because these buildings are mainly private assets and, consequently, constant maintenance intervention is in the hands of the owners.
This research work was conditioned by the availability and quality of the existing databases that were essential to pursue the research objectives. The lack of digitized databases relating to the heritage of the twentieth century and the lack of public access to the official databases of the Italian Ministry of Economy and Finance (MEF), which contain a ‘universe of data’ on sales made in all the national municipalities, are not made available to researchers for privacy reasons. The availability of official databases would have made it possible to obtain more solid results from a statistical and predictive point of view. It should also be considered that the results may be partly conditioned by the too small number of quality residences built in the second half of the 20th century in Turin and offered on the market in 2019. This number is explained by the very small percentage of architectural quality housing stock of the total building production carried out between 1950 and 1999.
The results highlighted the need to disseminate and promote the values of modern heritage, with specific actions to overcome the current cultural gap. The most interesting result that emerged from the research is that the system of values of the 1960s and 1970s, that determined the grow of cities, is undergoing a deep modification, precisely from the spatial point of view. This is mainly due to changes that have occurred in the distribution of income and in the structure of the society. The current system of values, in fact, equally depends on the distribution of income which, however, has profoundly changed and is even more polarized, due to a weakening of the middle and middle-upper classes. After all, the urban areas favored by the middle class until a few years ago, are now progressively devaluing, in favor of the attractiveness of more vibrant emerging urban areas. This spatial modification in the system of values is the result of both demographic factors and the emergence of new cultural models, which affect the new population strata entering the real estate market.


