Article

Income Tax for Microenterprises in the COVID-19 Pandemic: A Case Study on Ecuador

by
Maribel Paredes-Torres
1,2,
Ana del Rocío Cando-Zumba
2 and
José Varela-Aldás
1,*
1
SISAu Research Group, Facultad de Ingeniería y Tecnologías de la Información y la Comunicación, Universidad Tecnológica Indoamérica, Ambato 180103, Ecuador
2
Facultad de Contabilidad y Auditoría, Universidad Técnica de Ambato, Ambato 180104, Ecuador
*
Author to whom correspondence should be addressed.
Sustainability 2022, 14(5), 2537; https://doi.org/10.3390/su14052537
Submission received: 23 January 2022 / Revised: 10 February 2022 / Accepted: 11 February 2022 / Published: 22 February 2022
(This article belongs to the Special Issue Economic and Social Consequences of the COVID-19 Pandemic)

Abstract

:
In this work, we analyze the income tax in Ecuador in 2020, which was affected simultaneously by two factors: the economic crisis caused by COVID-19 and the implementation of a new tax system. The objective is to evaluate the effects of these factors on the economic status of a group of taxpayers and the difference in tax payments compared with previous periods. A quantitative study was carried out, collecting financial data from 30 microenterprises for three fiscal periods. We also analyze the relationship between sales and the taxes paid in the same year, as well as the difference between the previous regime and the system applied in the first year of the pandemic to determine income tax. The results indicate an increase in the tax paid despite a noticeable decrease in sales due to confinement and other sanitary measures. In addition, we verified a significant difference between the two analyzed regimes, mainly because the pandemic regime calculates the tax based solely on income and does not consider expenses. We conclude that 43.33% of the microentrepreneurs we analyzed concluded the fiscal year with an accounting loss. This implies a debt for the following period and the risk of bankruptcy in the future.

1. Introduction

Microenterprises are considered highly relevant, representing 90% of all companies worldwide and generating 70% of jobs, according to recent figures from the United Nations, and they are constantly growing [1,2,3,4]. In this context, the study of microenterprises on a global scale is important, as they are part of the economy’s engine and represent monetary growth. Nine out of ten companies belong to this group and autonomously generate two out of three jobs in enterprises, as long as they meet specific characteristics such as annual work units, annual turnover, or annual balance sheets [5,6,7]. However, although microenterprises constitute a large portion of taxpayers, tax collection generated by this group is low (0.1 to 3.9%). Moreover, these microenterprises constantly face economic risks, and there is informality [8,9,10,11].
In Latin America, tax systems are implemented by analyzing the type of economic activity and the size of the company. Thus, there are four categories of taxpayers: micro, small, medium, and large; the first three categories are considered taxpayers of low fiscal significance, according to [12,13]. However, the importance of small- and medium-sized enterprises is not solely based on the collection of taxes but also on the generation of employment, as they represent 99.5% of businesses in the region. Of these companies, 9 out of 10 are classified as microenterprises [3,14].
Among the tax systems affecting microenterprises in South American countries, Chile and Peru have specific regimes for economic activity [15]; Argentina has a simplified regime for small taxpayers, also known as “Fixed Fee”, which replaces three taxes (value-added tax, income tax, and presumed minimum income tax); Colombia has a simplified value-added tax regime, which is voluntary and has formal obligations, such as the issuance of invoices; and finally, Ecuador, which, in 2021, used the general regime (RG) for certain economic activities, the simplified tax regime, and the tax regime for microenterprises (RIM)—the latter was recently added [12].
Tax collection in Ecuador is considered to impose a tax burden of 19.90% concerning the gross domestic product—a value that is below the average in Latin American countries and the Caribbean, according to the Economic Commission for Latin America and the Caribbean [16]. Owing to the low tax collection from microentrepreneurs, the tax administration in Ecuador has employed several regimes such as the simplified tax regime (RISE) that replaced the payment of value-added tax and income tax with a monthly or annual fee depending on the economic activity and its category. To belong to this group, total income must not exceed USD 60,000.00, and the company can only have a maximum of 10 employees. This regime is focused on small businesses, has voluntary registration, and avoids making declarations. On the other hand, the RG determines the income tax through a progressive table based on a taxable base (income minus costs and expenses) for natural people and for societies with 25% tax on the profit, with some special cases.
At the end of 2019, the RIM was created with particular characteristics, including the liquidation of income tax and mandatary acceptance [17]. As a result, the Ecuadorian tax system currently has three regimes, each with peculiarities in the calculation of income tax. The most controversial is the RIM. The responsible entity must publish the registry of microentrepreneurs that belong to the RIM. At the end of 2020, the first list of taxpayers in this group was presented. The new method of calculating income tax for microentrepreneurs begins by obtaining a tax base of income and, based on this, determining 2% income tax. Therefore, by applying this new reform, the tax system aims to help balance fiscal policy with greater simplicity. The payment of income tax for microentrepreneurs under this modality can represent a high fiscal burden, which leads to tax evasion by not invoicing, since sales are the basis of the calculation. Additionally, several taxpayers have decided to eliminate their formal registration and carry out their economic activities clandestinely and informally in order to avoid paying said tax. In addition, this system does not consider losses in the fiscal year, for example, losses during the global economic crisis caused by COVID-19.
According to official numbers, the COVID-19 pandemic exceeded 260 million infected cases worldwide by the end of 2021, with the number of deaths exceeding 5 million. Although the governments took measures, negative effects occurred in all areas. Businesses around the world began to close, services were canceled, and travel was limited [18,19,20,21,22]. Ecuador was no exception; this country suffered significant economic losses, and entrepreneurs had to adapt to survive the new working conditions [23]. Studies carried out in other countries indicated that micro-, small-, and medium-sized companies were more affected than larger companies [24,25]. In [26], the authors found that 85% of these companies could not survive more than three months of the COVID-19 pandemic. Other results found that more than 70% will see worse economic results [27]. In some countries, taxpayers received state support, making it possible for companies to survive these difficult times, although proposals aimed at a more sustainable economy are lacking [28,29,30].
This research is motivated by the COVID-19 pandemic’s negative effects on the world economy. Moreover, paying taxes significantly influences the survival of microenterprises, even more so in developing countries; thus, this type of analysis is required. Studies like this have an impact on future decisions by reporting the incidence of one or more factors in the accounting results of a vulnerable economic group. The main novelty of this paper is the analysis of an unusual case that arose in Ecuador, where microenterprises faced confinement and a new tax regime.

2. Review of Literature

Regarding works similar to this study, there were few investigations into similar conditions. Table 1 describes some of the studies found.
The authors of [31] empirically studied public attitudes about income tax in times of COVID. The results suggested that income is associated with the perception that taxes for the rich are inappropriately high but was not related to perceptions of the adequacy of taxes for the average and poor groups of respondents. Higher satisfaction with state policies was associated with a desire to raise taxes on the wealthy and lower taxes on low-income groups. In addition, preferences for solidarity were associated with higher overall preferred taxation and higher tax progressivity. These findings were projected as an opportunity for improvement through new mechanisms to contribute to sustainable endogenous economic development.
In another study, Ref. [32] investigated the relationship of a favorable tax environment for small businesses with the aim of analyzing the design of simplified tax schemes for small businesses in Georgia, Ukraine, Russia, and Albania, focusing on the expectations of the microentrepreneur and the tax administration. The rapid growth of the small business segment in the countries analyzed was highlighted; they are considered to be “difficult to tax” taxpayers for the tax administration, with Serbia exemplifying a country that has a simplified regime for small businesses as well as for individual entrepreneurs. They opted for a 2% tax on gross income when businesses have 50 or fewer employees, turnover is less than 8000 average gross monthly salaries, and an average value of assets is less than 6000 gross monthly salaries. Another country that has a similar tax is Azerbaijan, calculating the tax at 2% of the gross turnover only when the turnover is less than 300 times the minimum wage. The author pointed out that the problem of tax systems is that the design is the same for legal entities and natural persons. Finally, there are complaints from small business owners about these systems because only one tax is replaced, and they must continue to deal with a large number of taxes and requirements, therefore qualifying the tax system as complicated and cumbersome.
Similarly, the study conducted by [33] analyzed the survival of the simplified tax regime in Brazil and the longevity of Brazilian manufacturing companies, focusing on the survival of two groups: those who opted for and against this optional regime. The research was carried out on 3187 manufacturing companies using the econometric tools of propensity score comparison and survival analysis, and the breakdown by level of intensity. In the end, the study concluded that the establishments that adopted the regime showed faster growth compared to those that did not adopt it. In addition, the application of regression allowed us to identify that the establishments that adopted the regimen have a 30% lower probability of mortality than those that did not adopt it, even when the effects of size, average salary, and average duration of the labor relationship are controlled.
The authors of [13] presented the risk allocation of the tax burden to measure the tax burden outliers. Using a time-varying nonparametric benchmark and path model, this paper measured the fiscal risk allocation of 3552 small and microenterprises in the credit insurance fund from January 2016 to August 2018. The results showed that these outliers have trends of linear drive and nonlinear drive of vibration, and there is some interaction between the two. Along the path of credit and taxation, the excess tax drive mode will change, and it is difficult to wait for the return to normal. In addition, the results provided support for the decision to reduce the tax burden and promote the growth of small and microenterprises.
In this work, the changes in the payment of income tax for 30 Ecuadorian microenterprises in times of COVID-19 are analyzed; to this end, the historical data of the payment of income tax in the last three years from 2018 to 2020 were used, with an emphasis on the last year owing to the implementation of the new payment method established by the RIM. In this context, the objectives of this work are divided into three stages: first, the collection of information from microenterprises; second, the application of instruments to organize the information; and third, the analysis of variation and economic affectation. In addition, we hypothesize that there is a significant difference between the income tax of microentrepreneurs with the RG and that with the RIM during the pandemic. The null and alternative hypotheses are the following:
Hypothesis 1 (H1).
There is no difference between the income tax of microentrepreneurs in the comparison of the RG with the RIM applied in times of COVID-19.
Hypothesis 2 (H2).
There is a difference between the income tax of microentrepreneurs in the comparison of the RG with the RIM applied in times of COVID-19.

3. Data and Methods

This research took a quantitative approach, which allowed the collection, processing, and construction of a financial information base with data on sales, costs, profit, and income tax for 2020, the year the economic crisis caused by the COVID-19 pandemic appeared. Because the income tax was paid during the following year, information was collected in the year 2021.
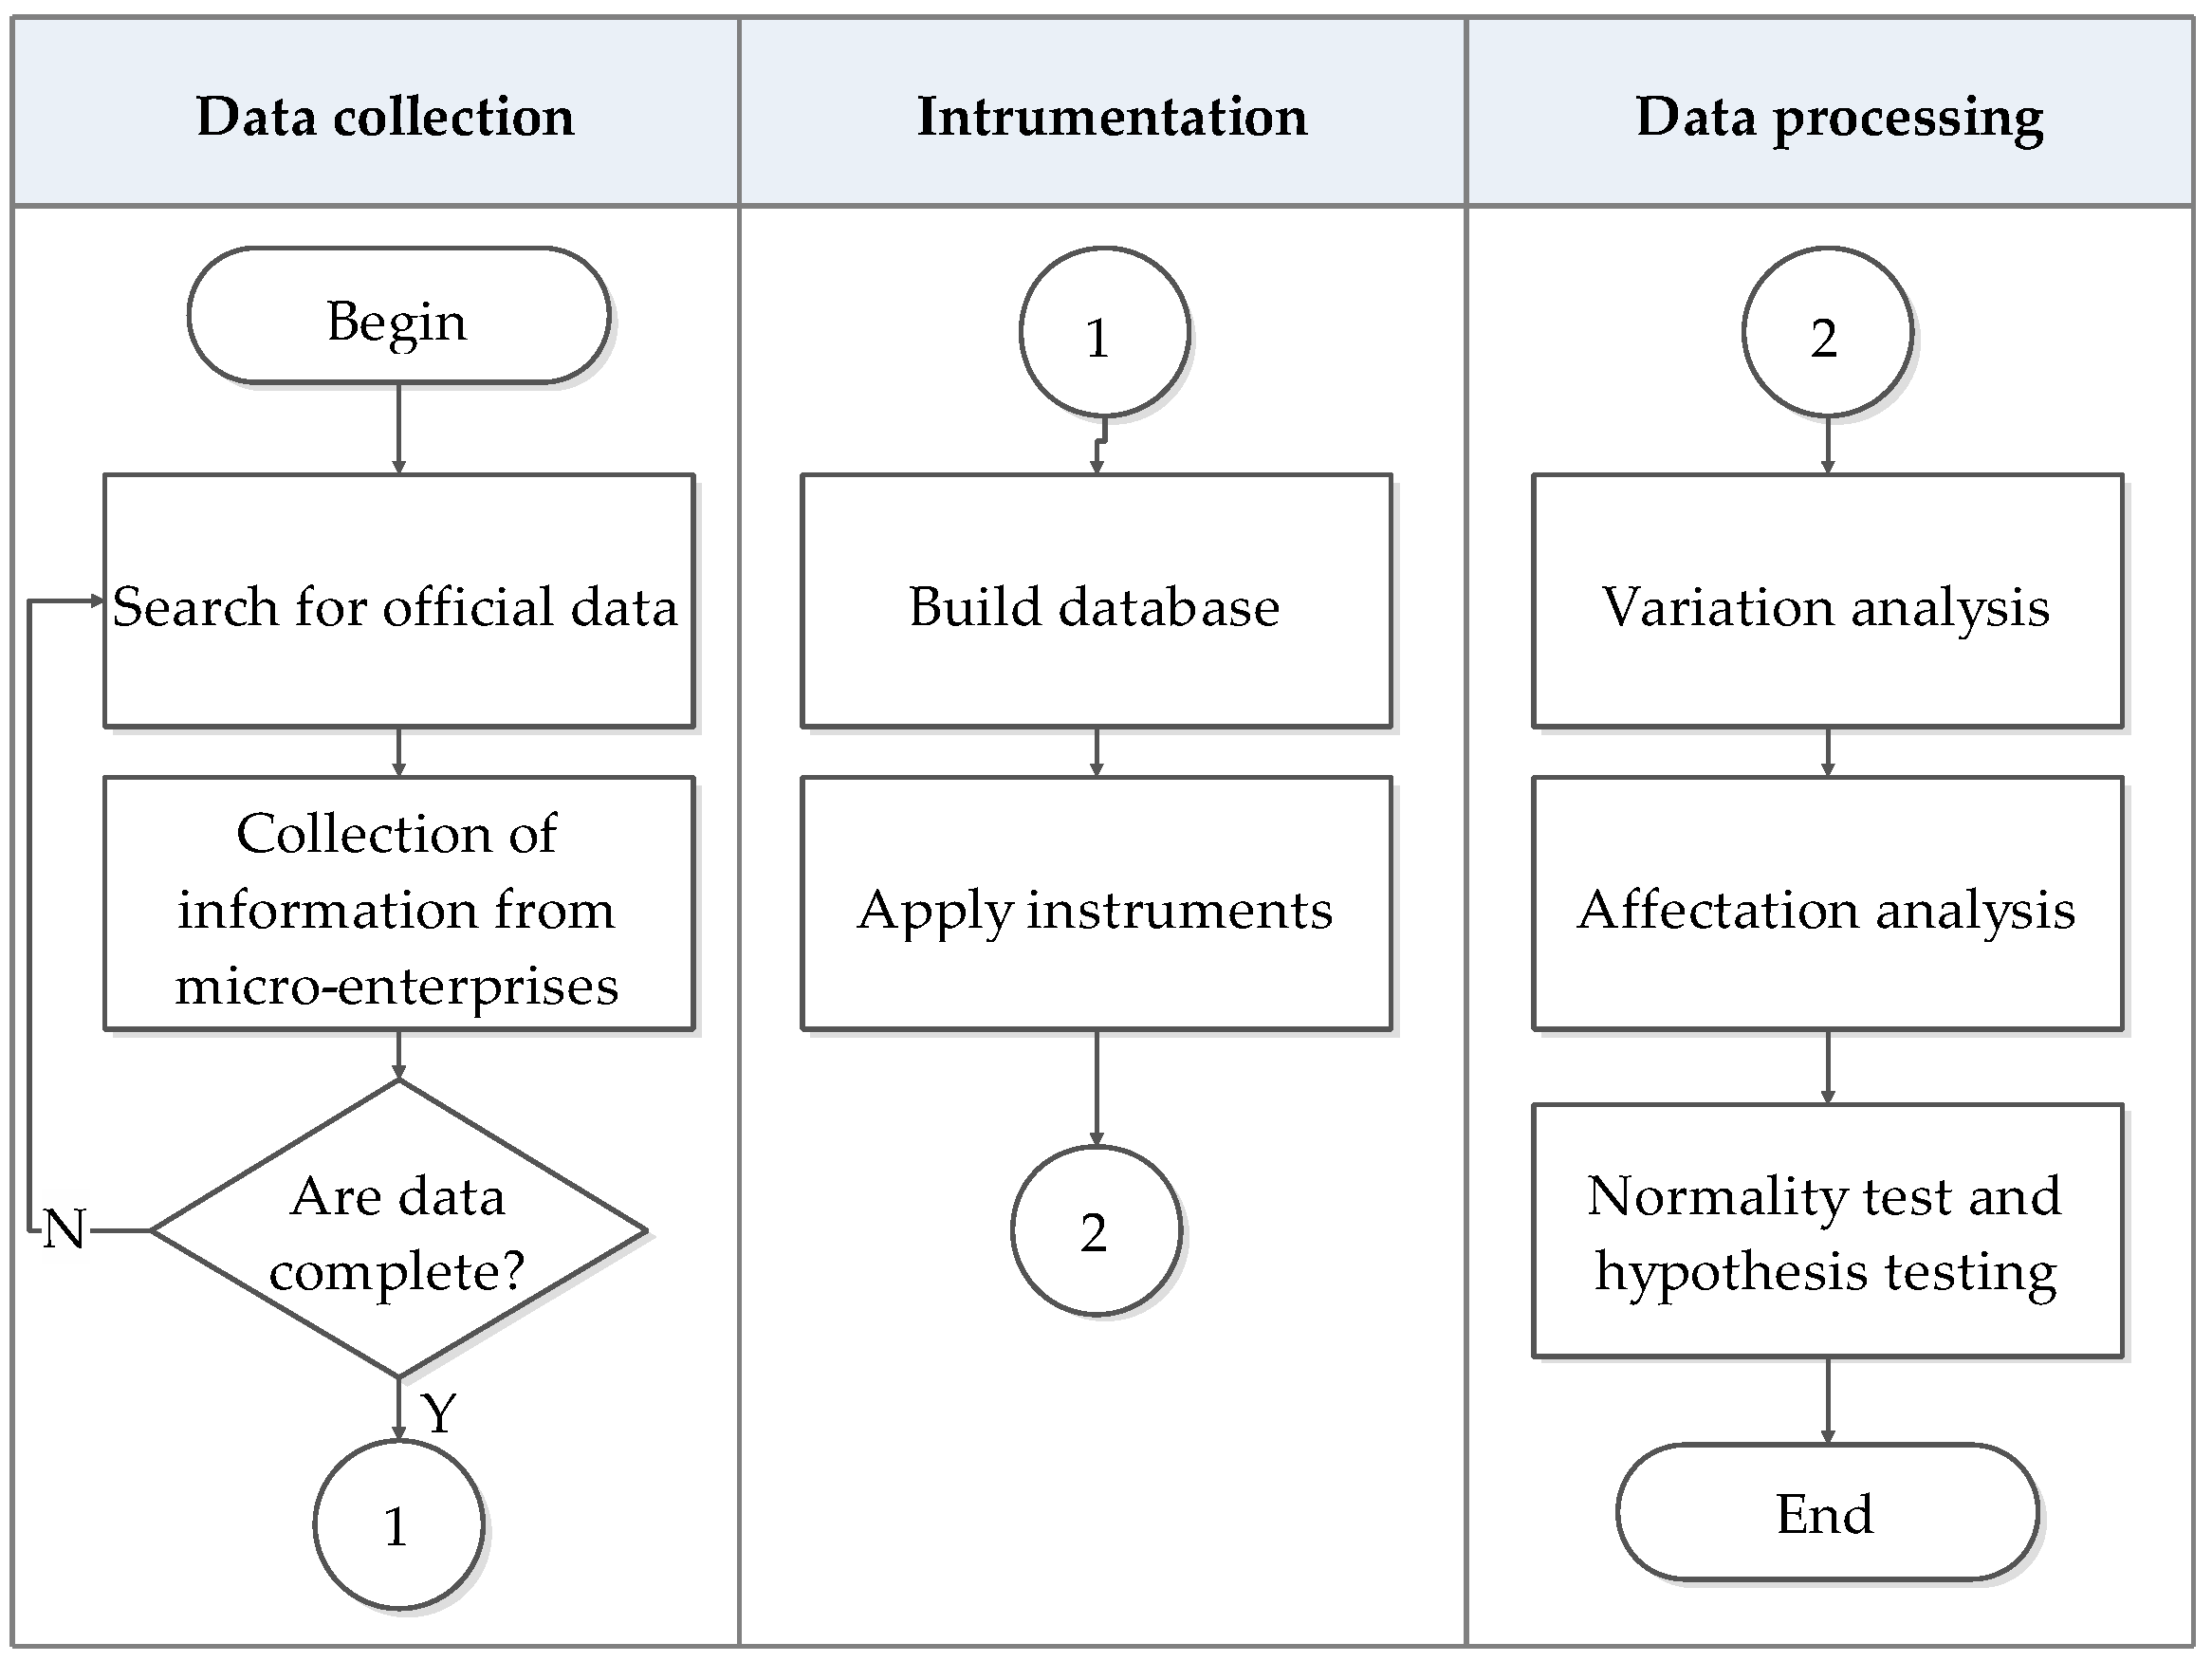
The methodology is presented in Figure 1. The procedures were divided into three stages: collection, instrumentation, and information processing. In the first stage, the data were collected, using the official information of the microenterprises that belonged to the RIM. Then, we collected the financial data of the selected microenterprises, and in cases of not having the complete information, the data collection process was repeated. In the second stage, the designed instruments were applied; for this, a database was built by organizing the microenterprises into three groups. In the third stage, the information was analyzed, obtaining the variation in the income tax generated and the economic impact produced. Finally, a normality test was applied, and a hypothesis was verified.

3.1. Data

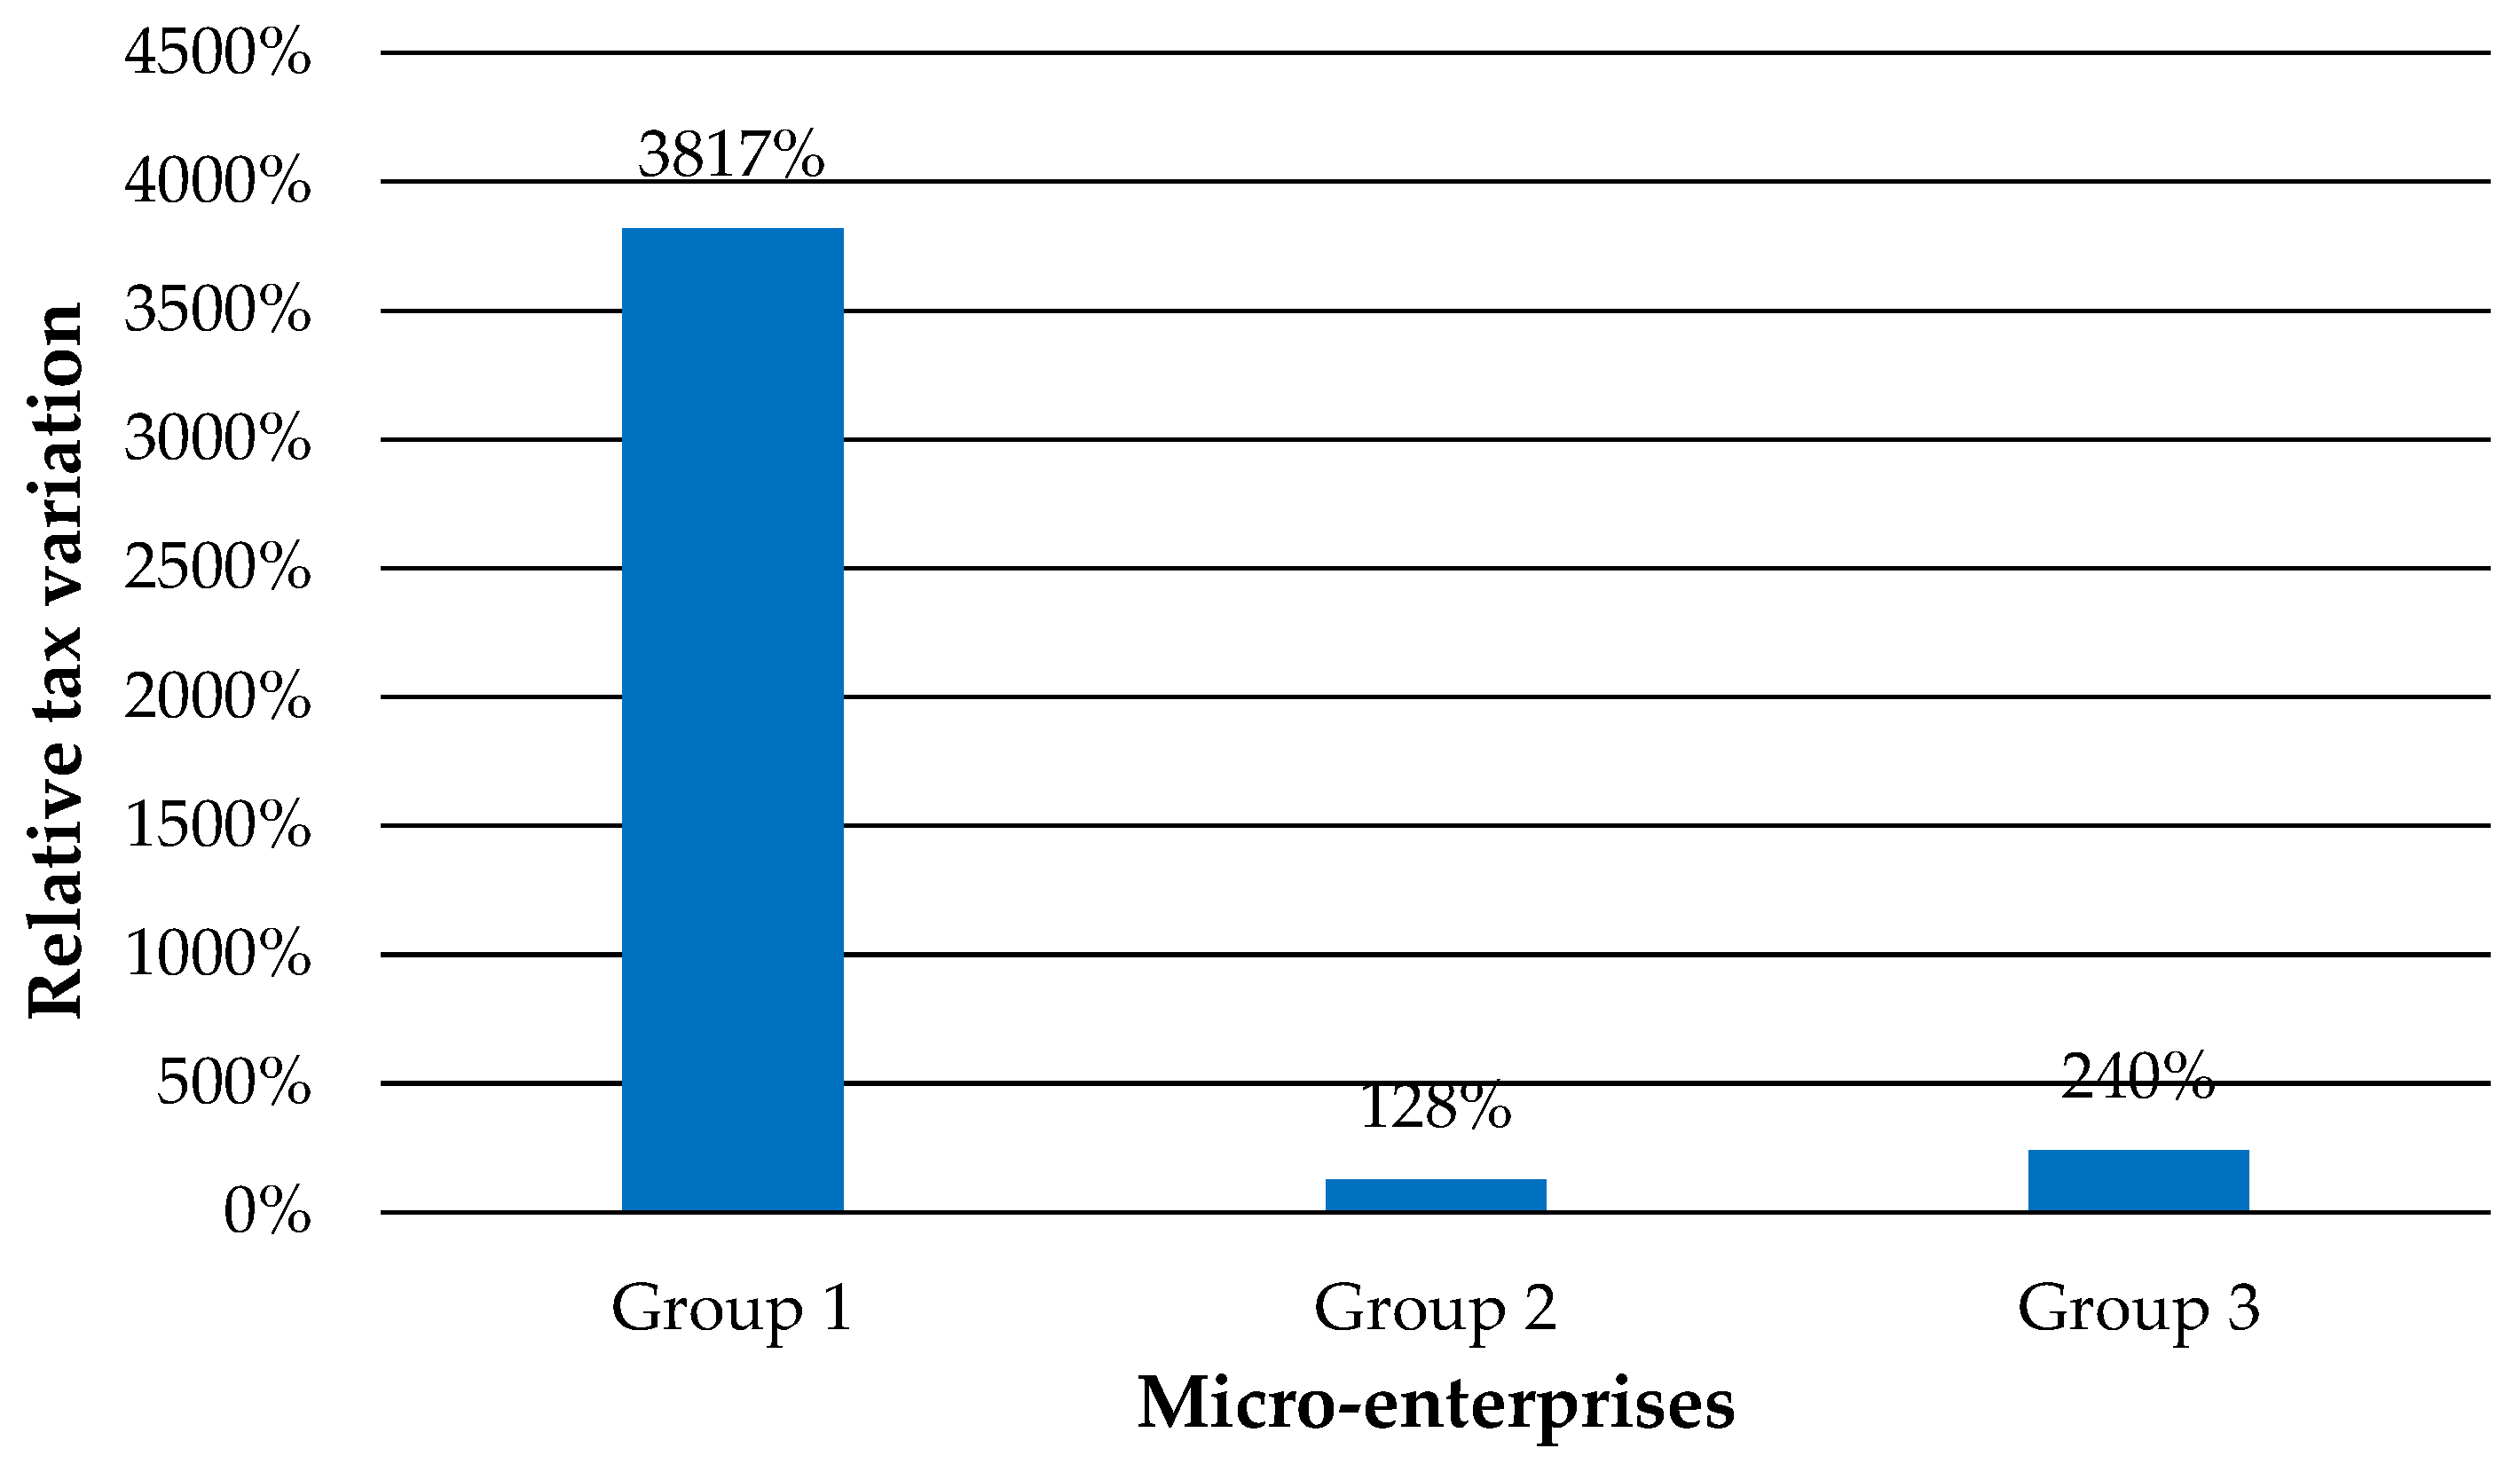
The list of microentrepreneurs subject to the new RIM regime was obtained from official government sources. These taxpayers were registered in the last update of the database on 1 December 2020. A convenience sample of 30 microentrepreneurs was obtained, owing to the complexity of the access to information. This group was divided into 3 groups of 10 microentrepreneurs each, classified according to an economic category. Group 1—Natural persons not required to keep accounts (Table 2); Group 2—Natural persons required to keep accounts (Table 3); and Group 3—Societies controlled by the Superintendence of Companies, Securities, and Insurance of Ecuador (Table 4). Sales for the year 2020 in Table 2, Table 3 and Table 4 are in United States dollars (USD). The data were obtained from the income and expense books that each taxpayer maintained in compliance with the tax administration requirements. From here on, the acronyms G1, G2, and G3 represent the microenterprises of Group 1, Group 2, and Group 3, respectively. For example, G1.01 is Microenterprise 1 of Group 1.

3.2. Instruments

The information collected was organized and structured using two instruments. The first instrument is presented in Table 5; it was a record card of the financial data of the microenterprises in the year 2020. The gross income, costs, expenses, and other deductions were recorded until the tax base and the income tax were obtained with the RIM. A table was completed for each group of microentrepreneurs. As part of the analysis of this information, the income tax was also calculated with the RG; in this way, an estimate of the income tax of microenterprises for the previous regime was known.
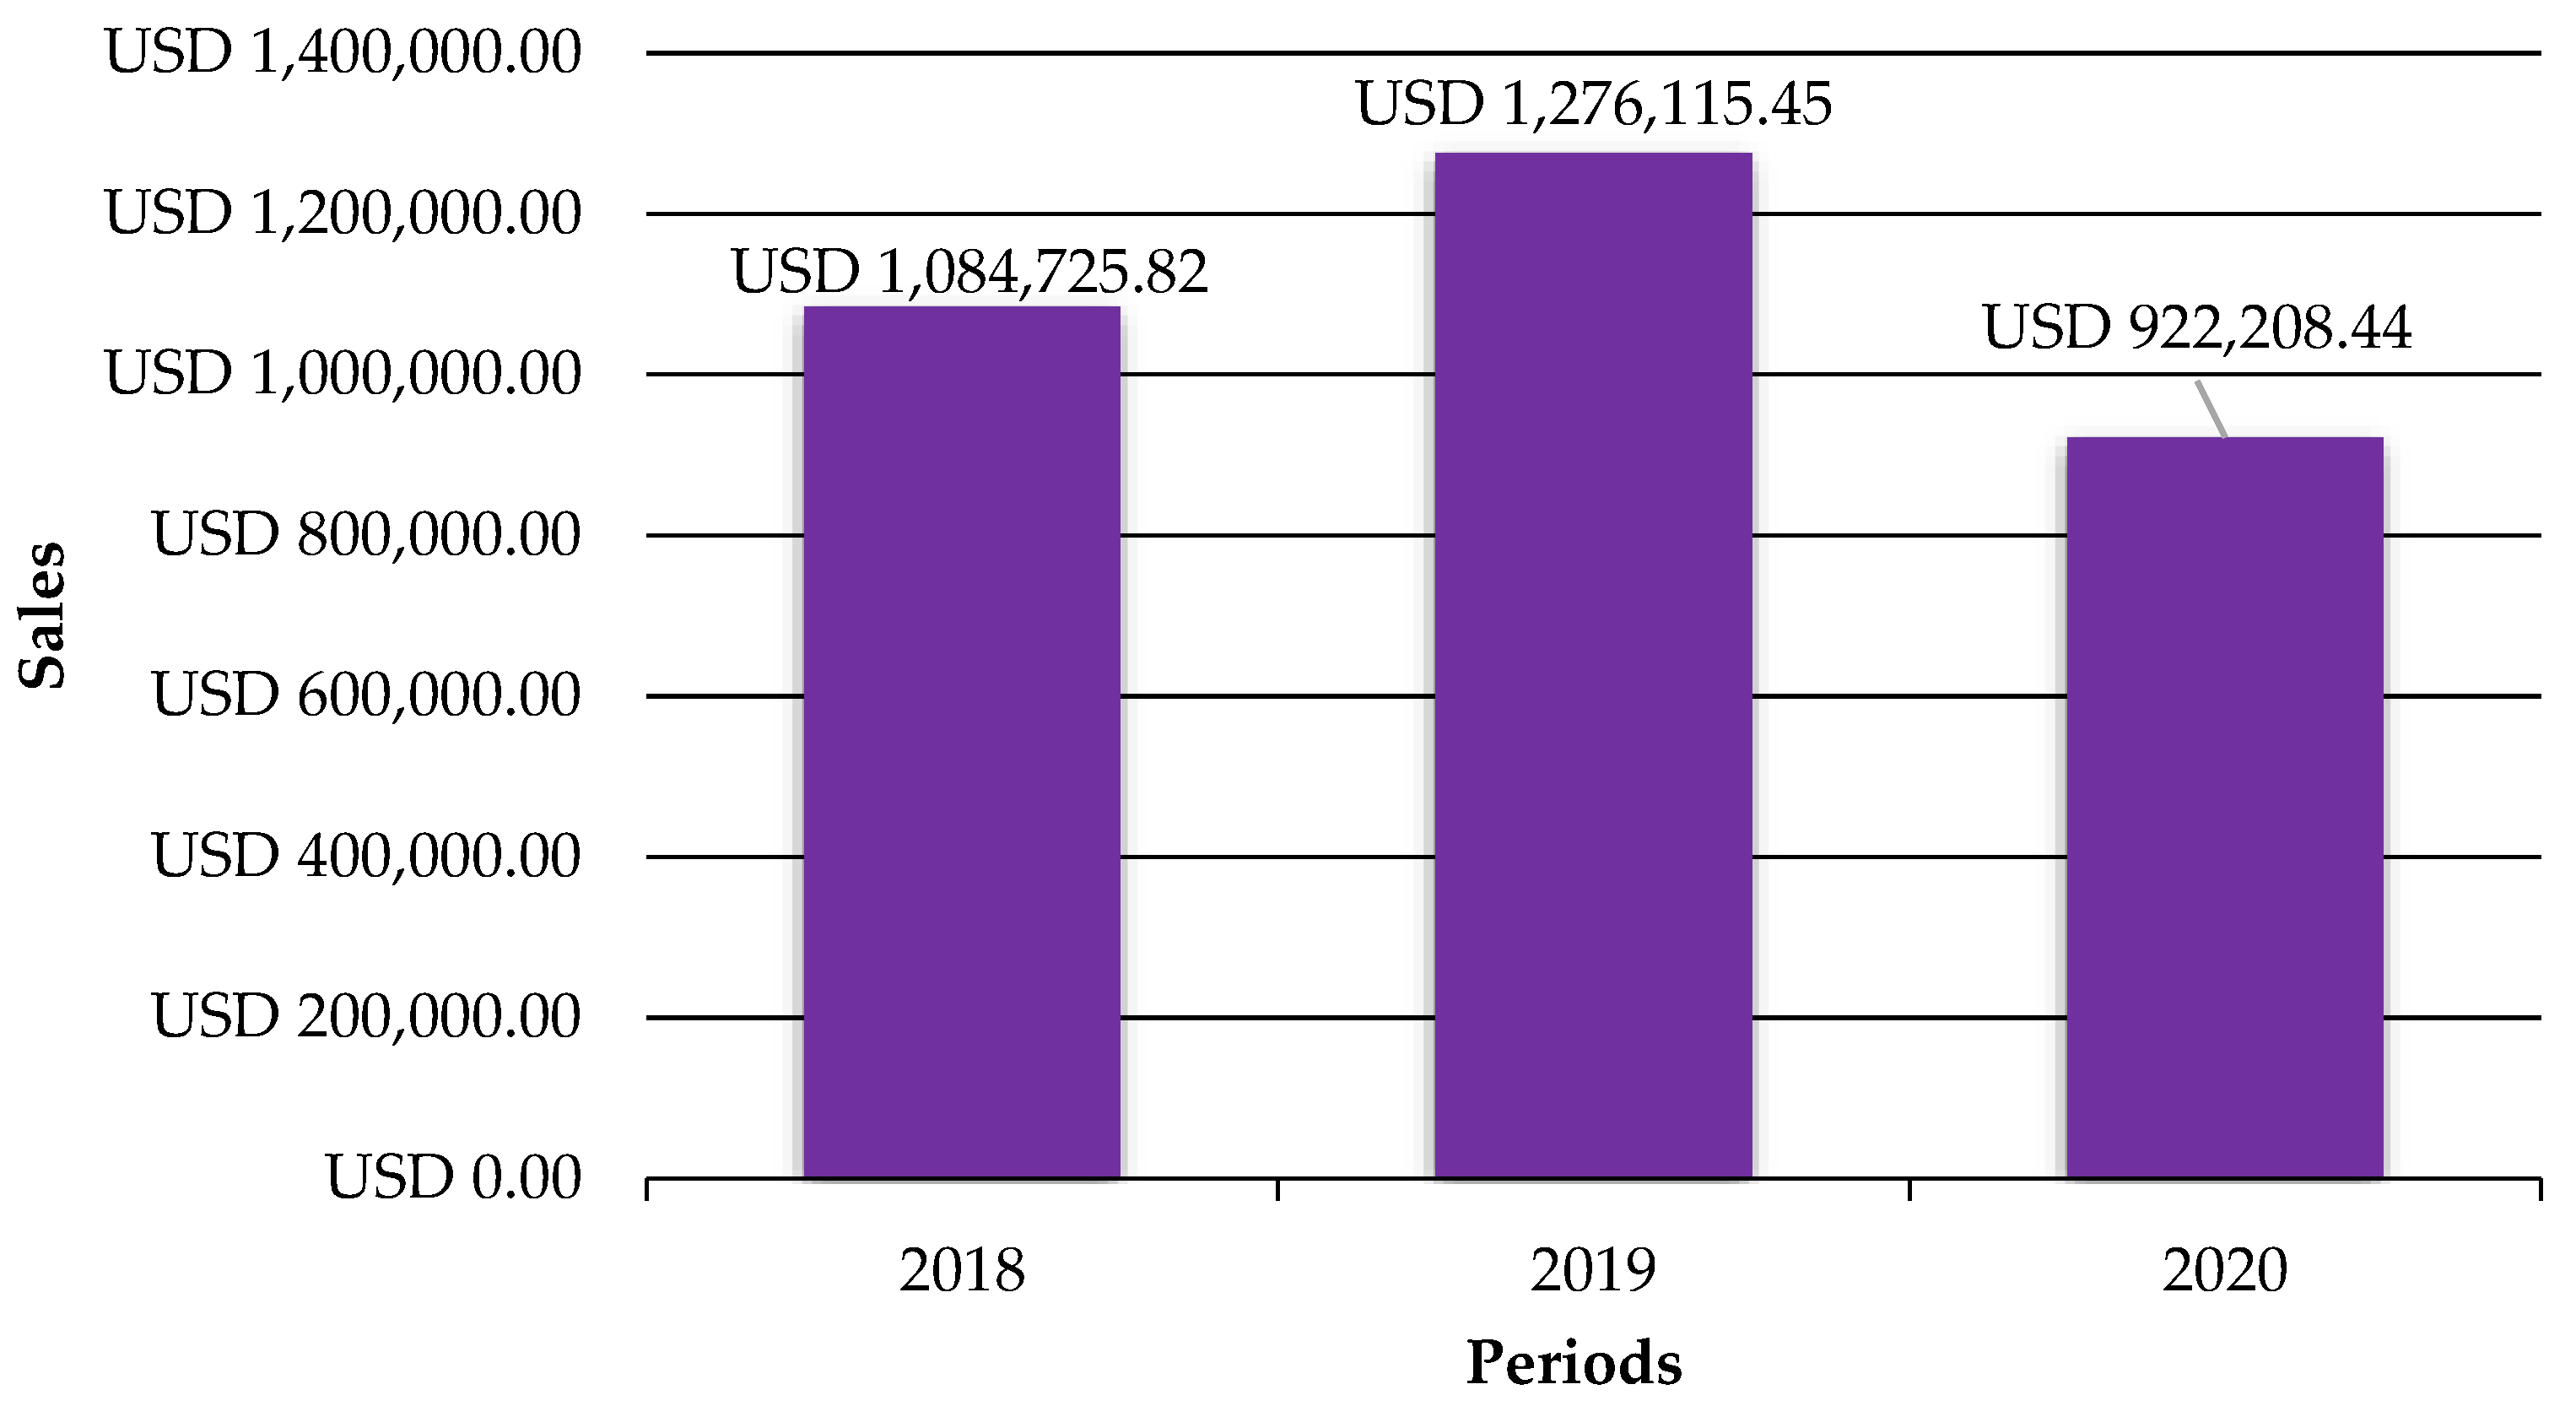
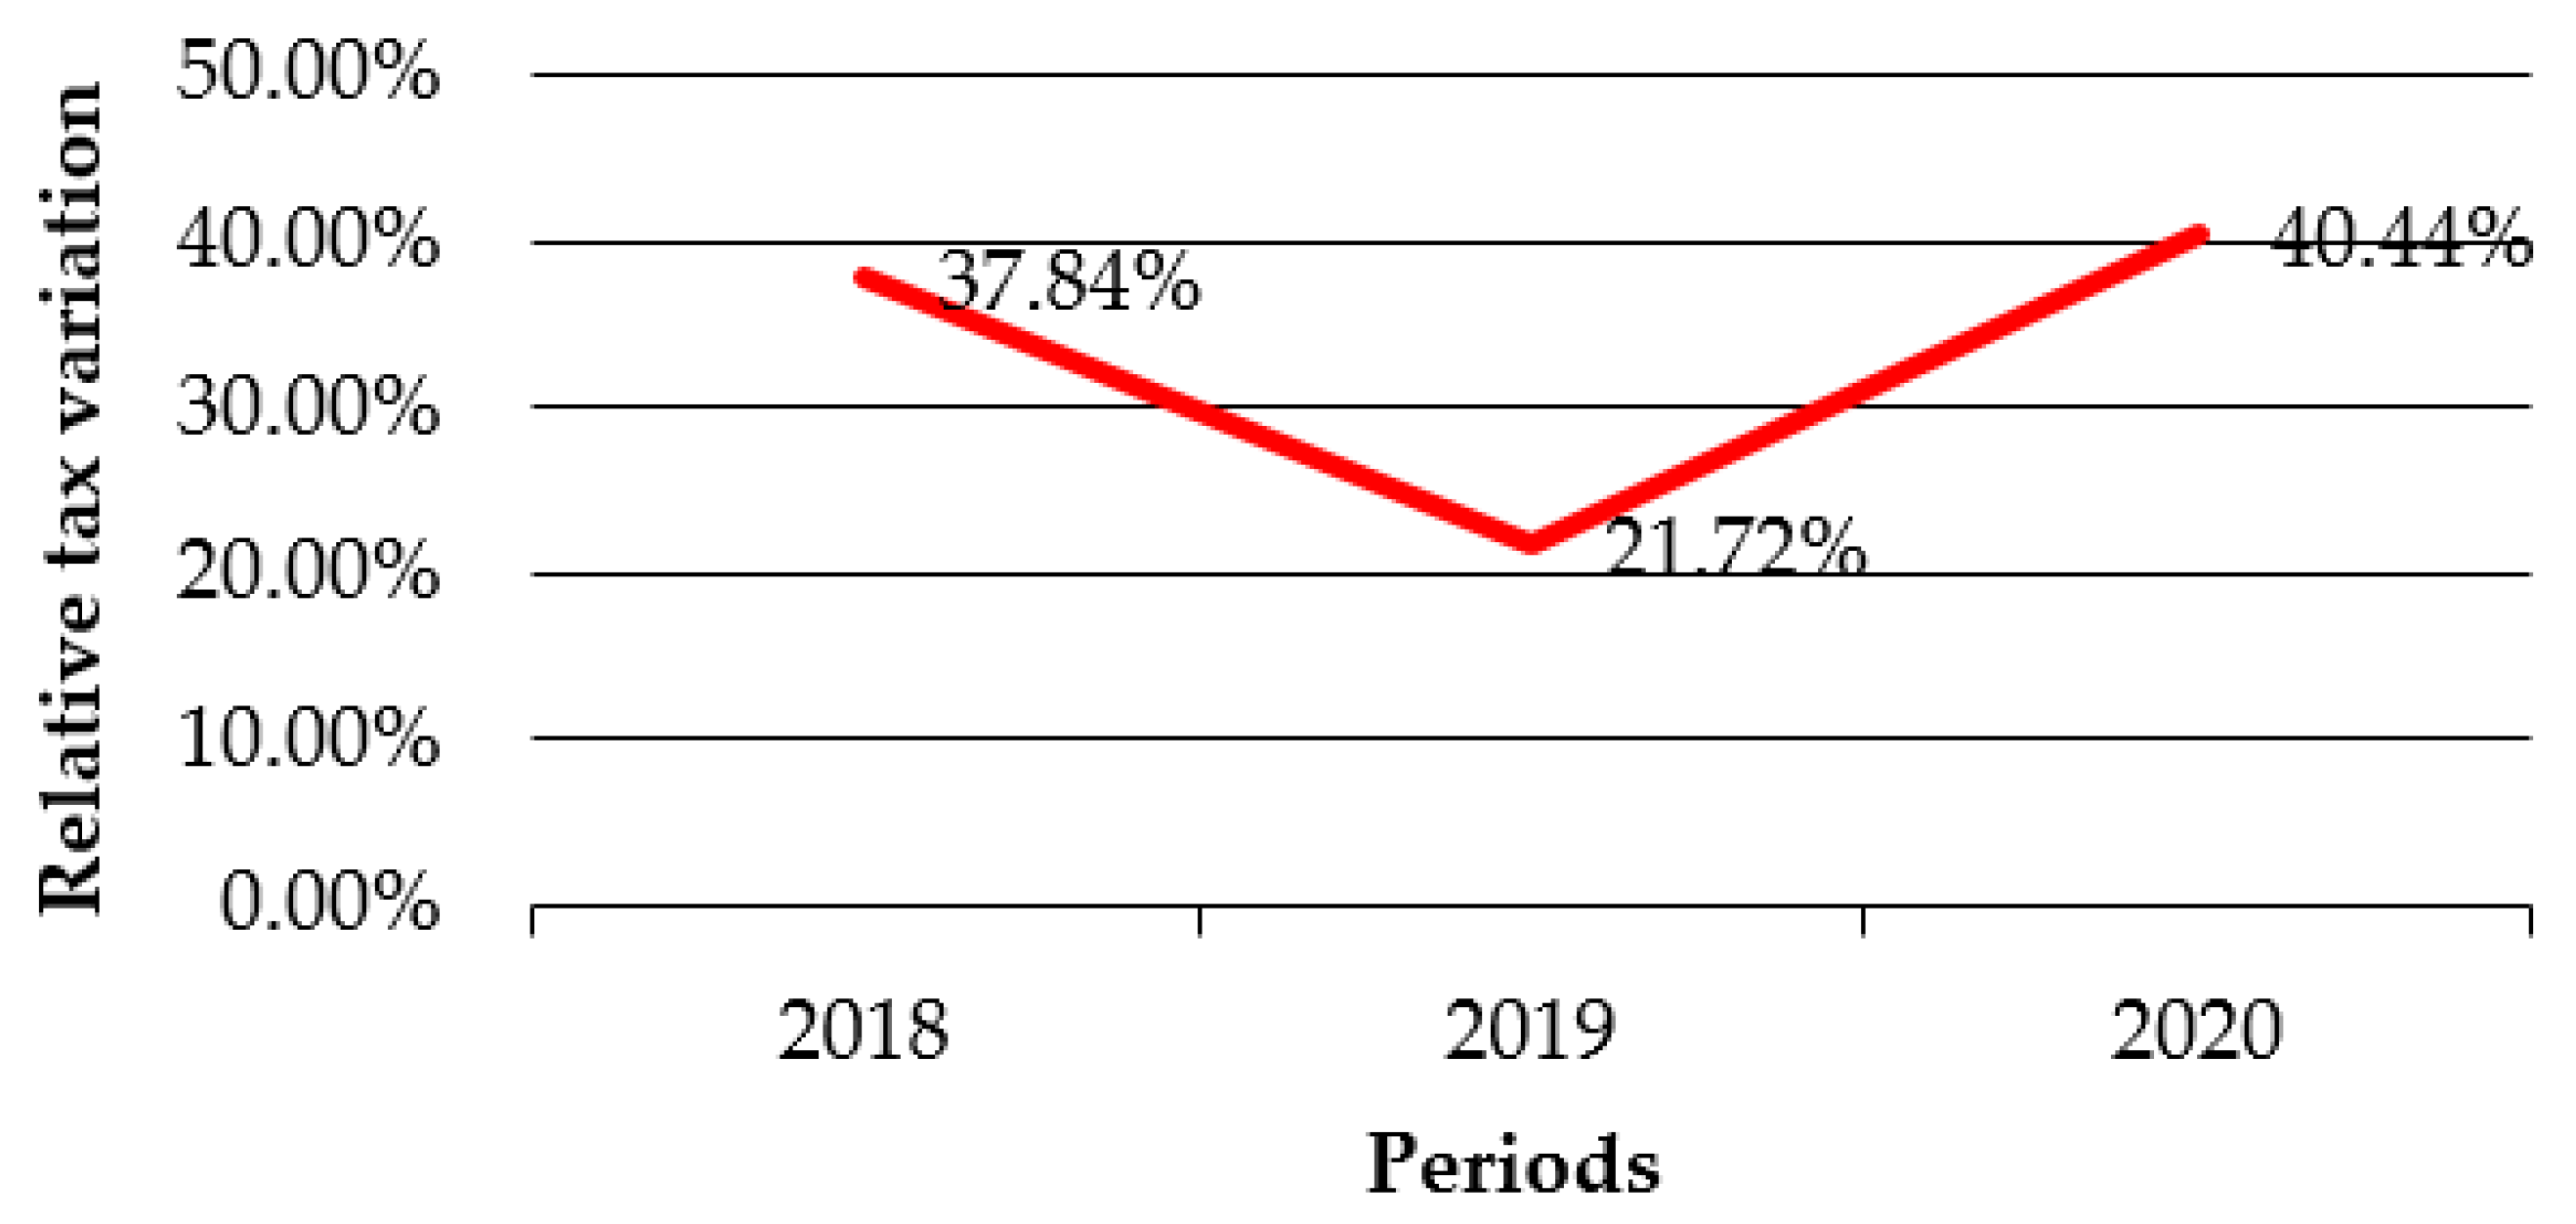
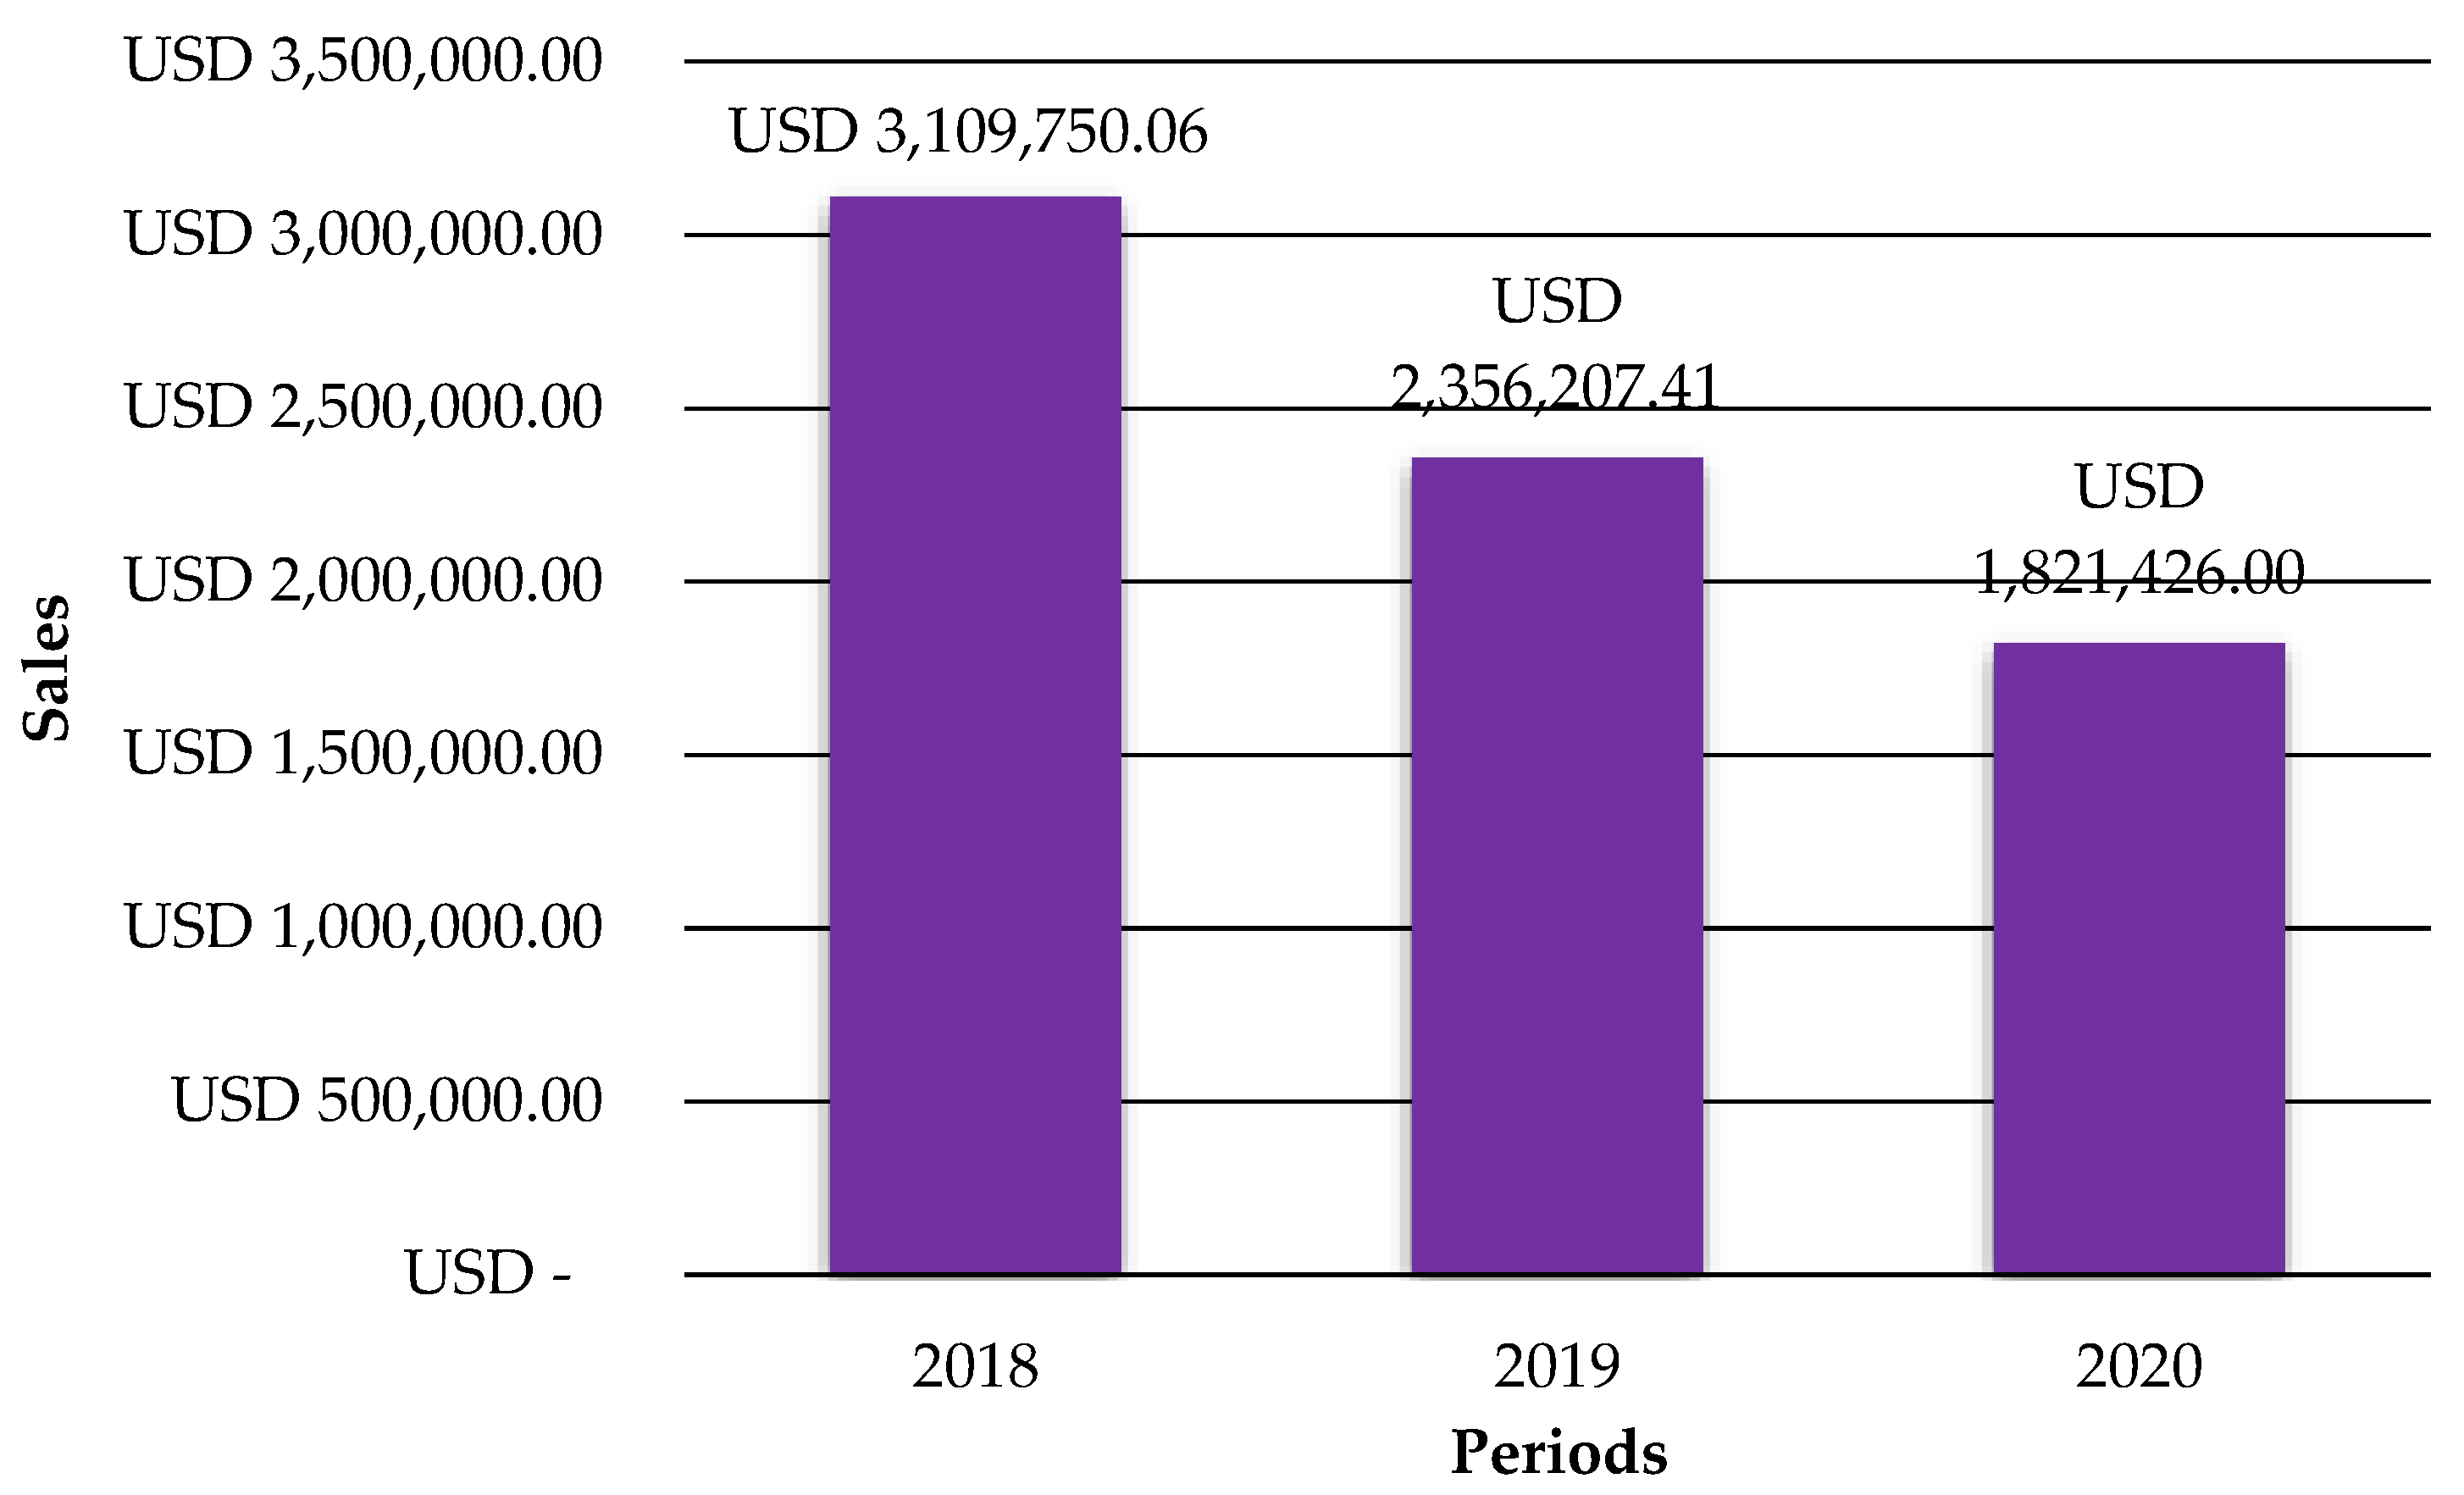
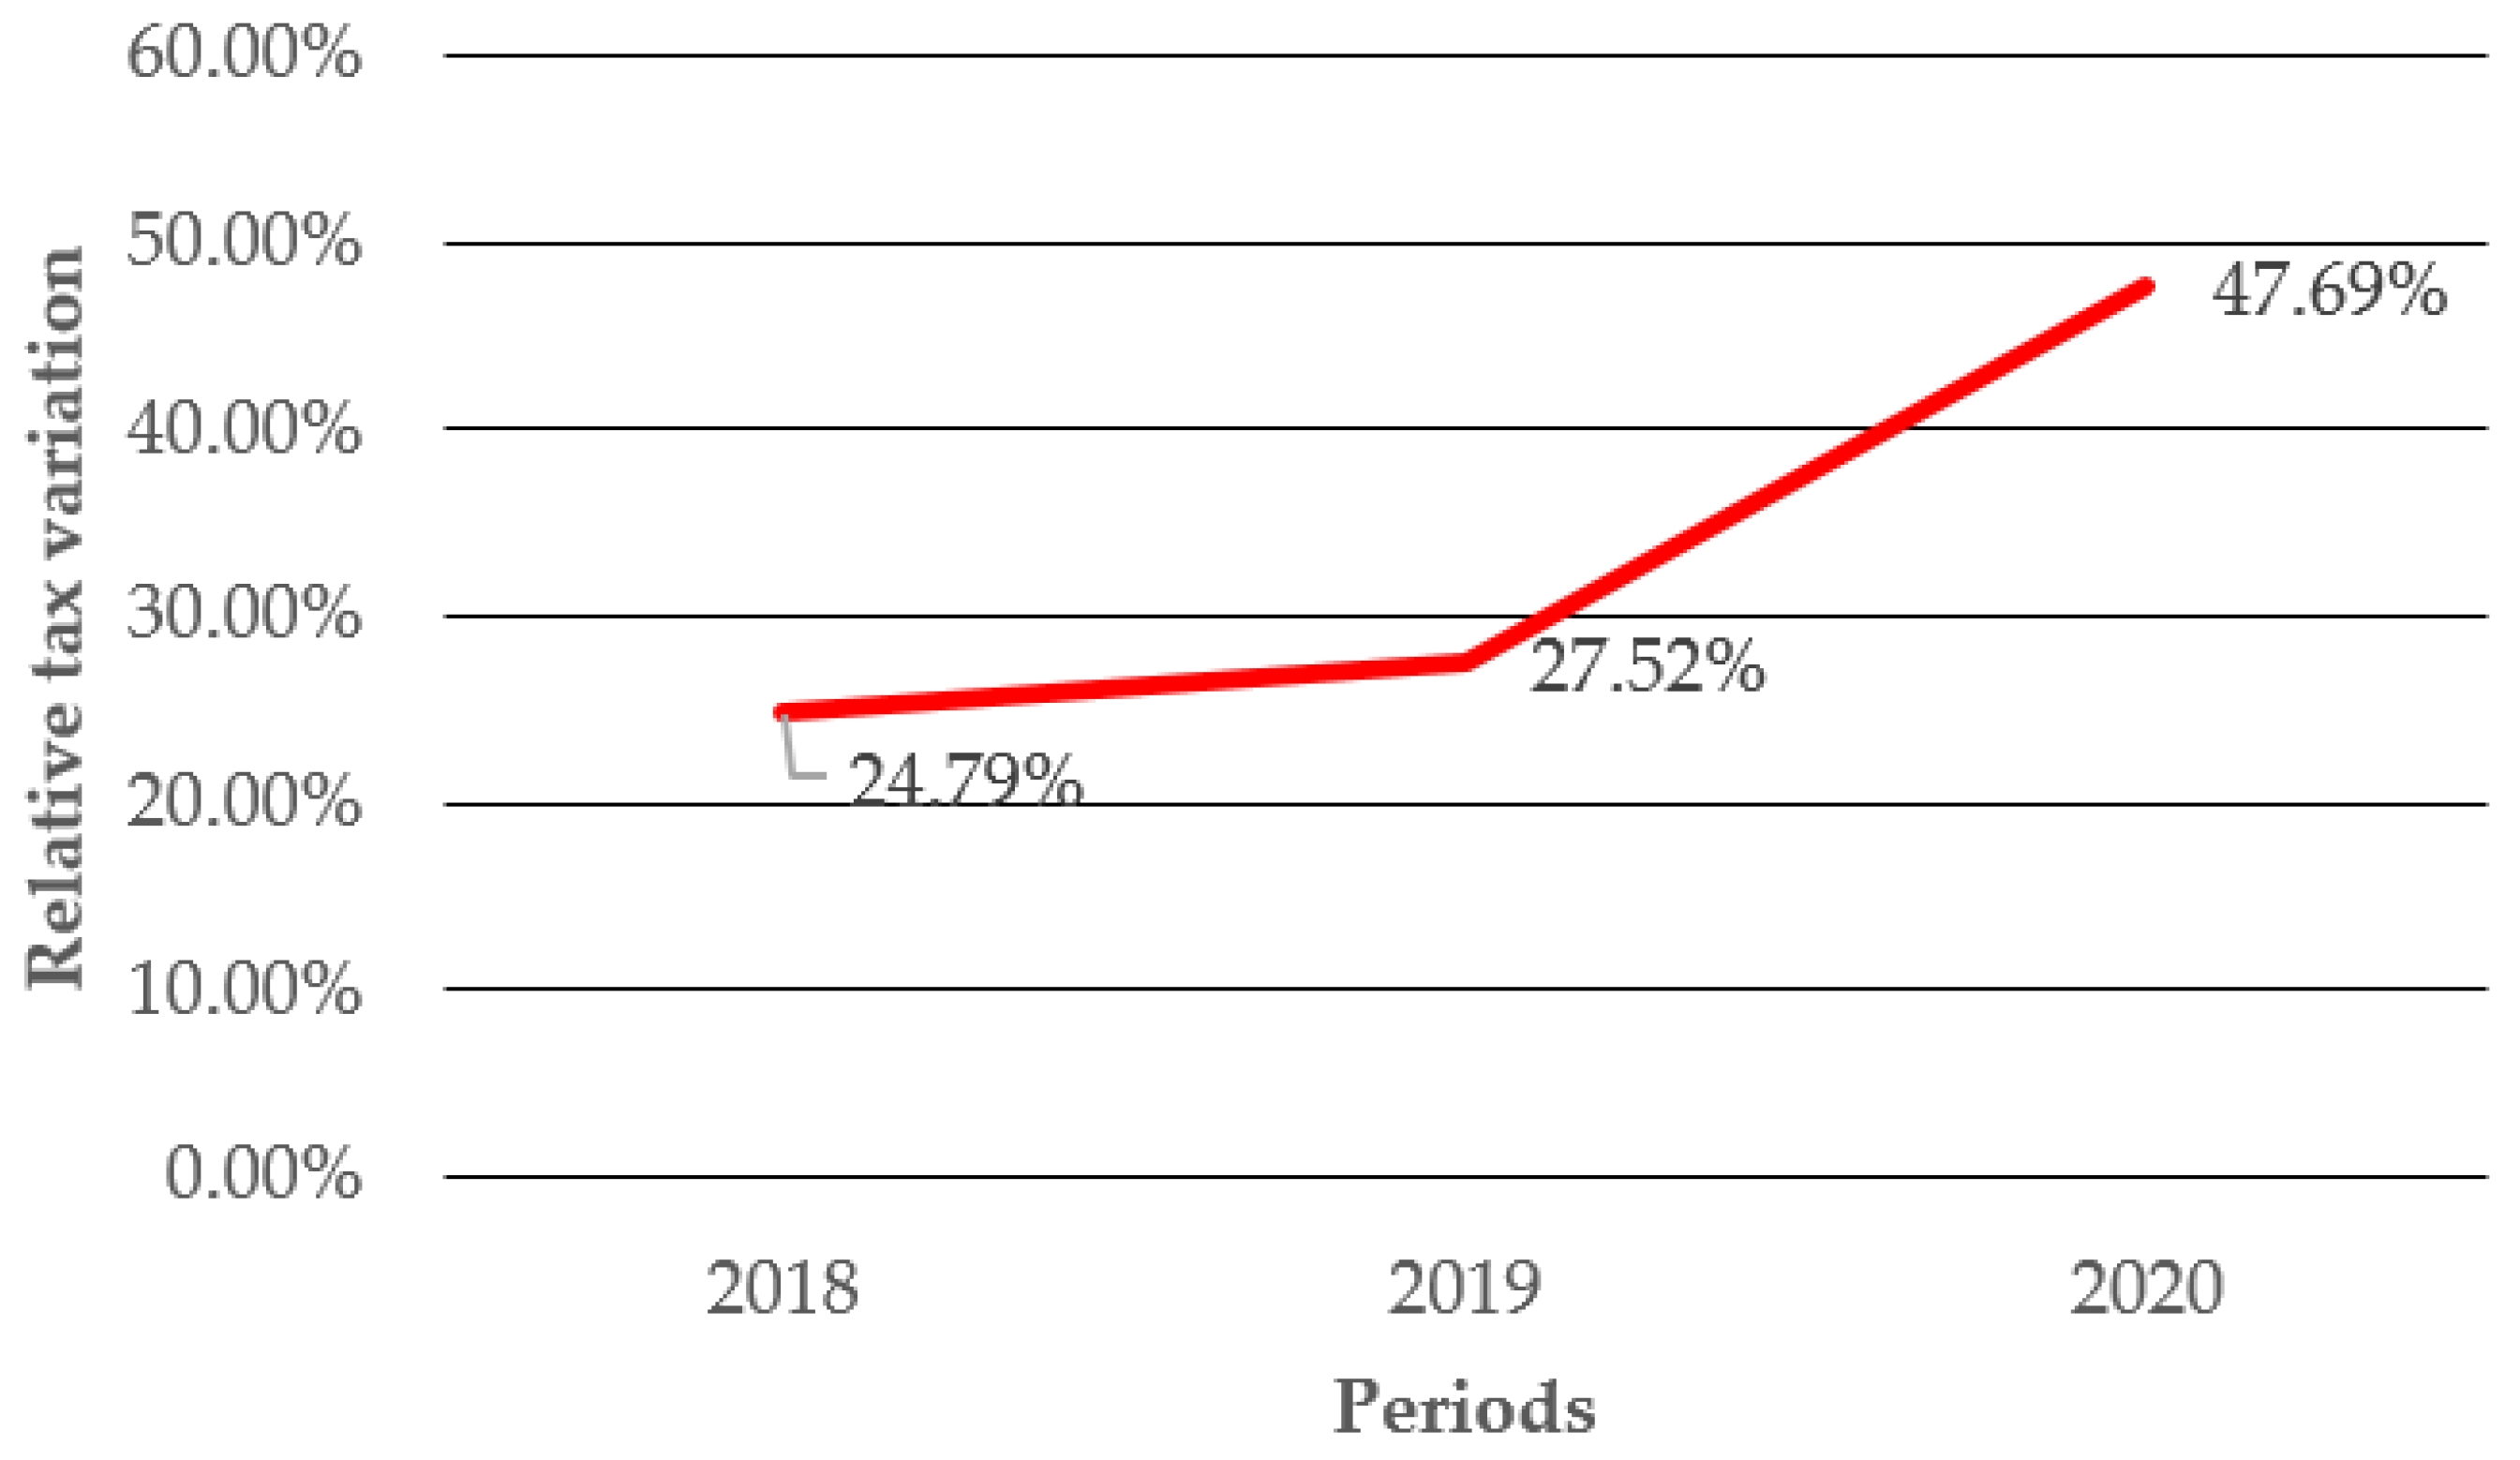
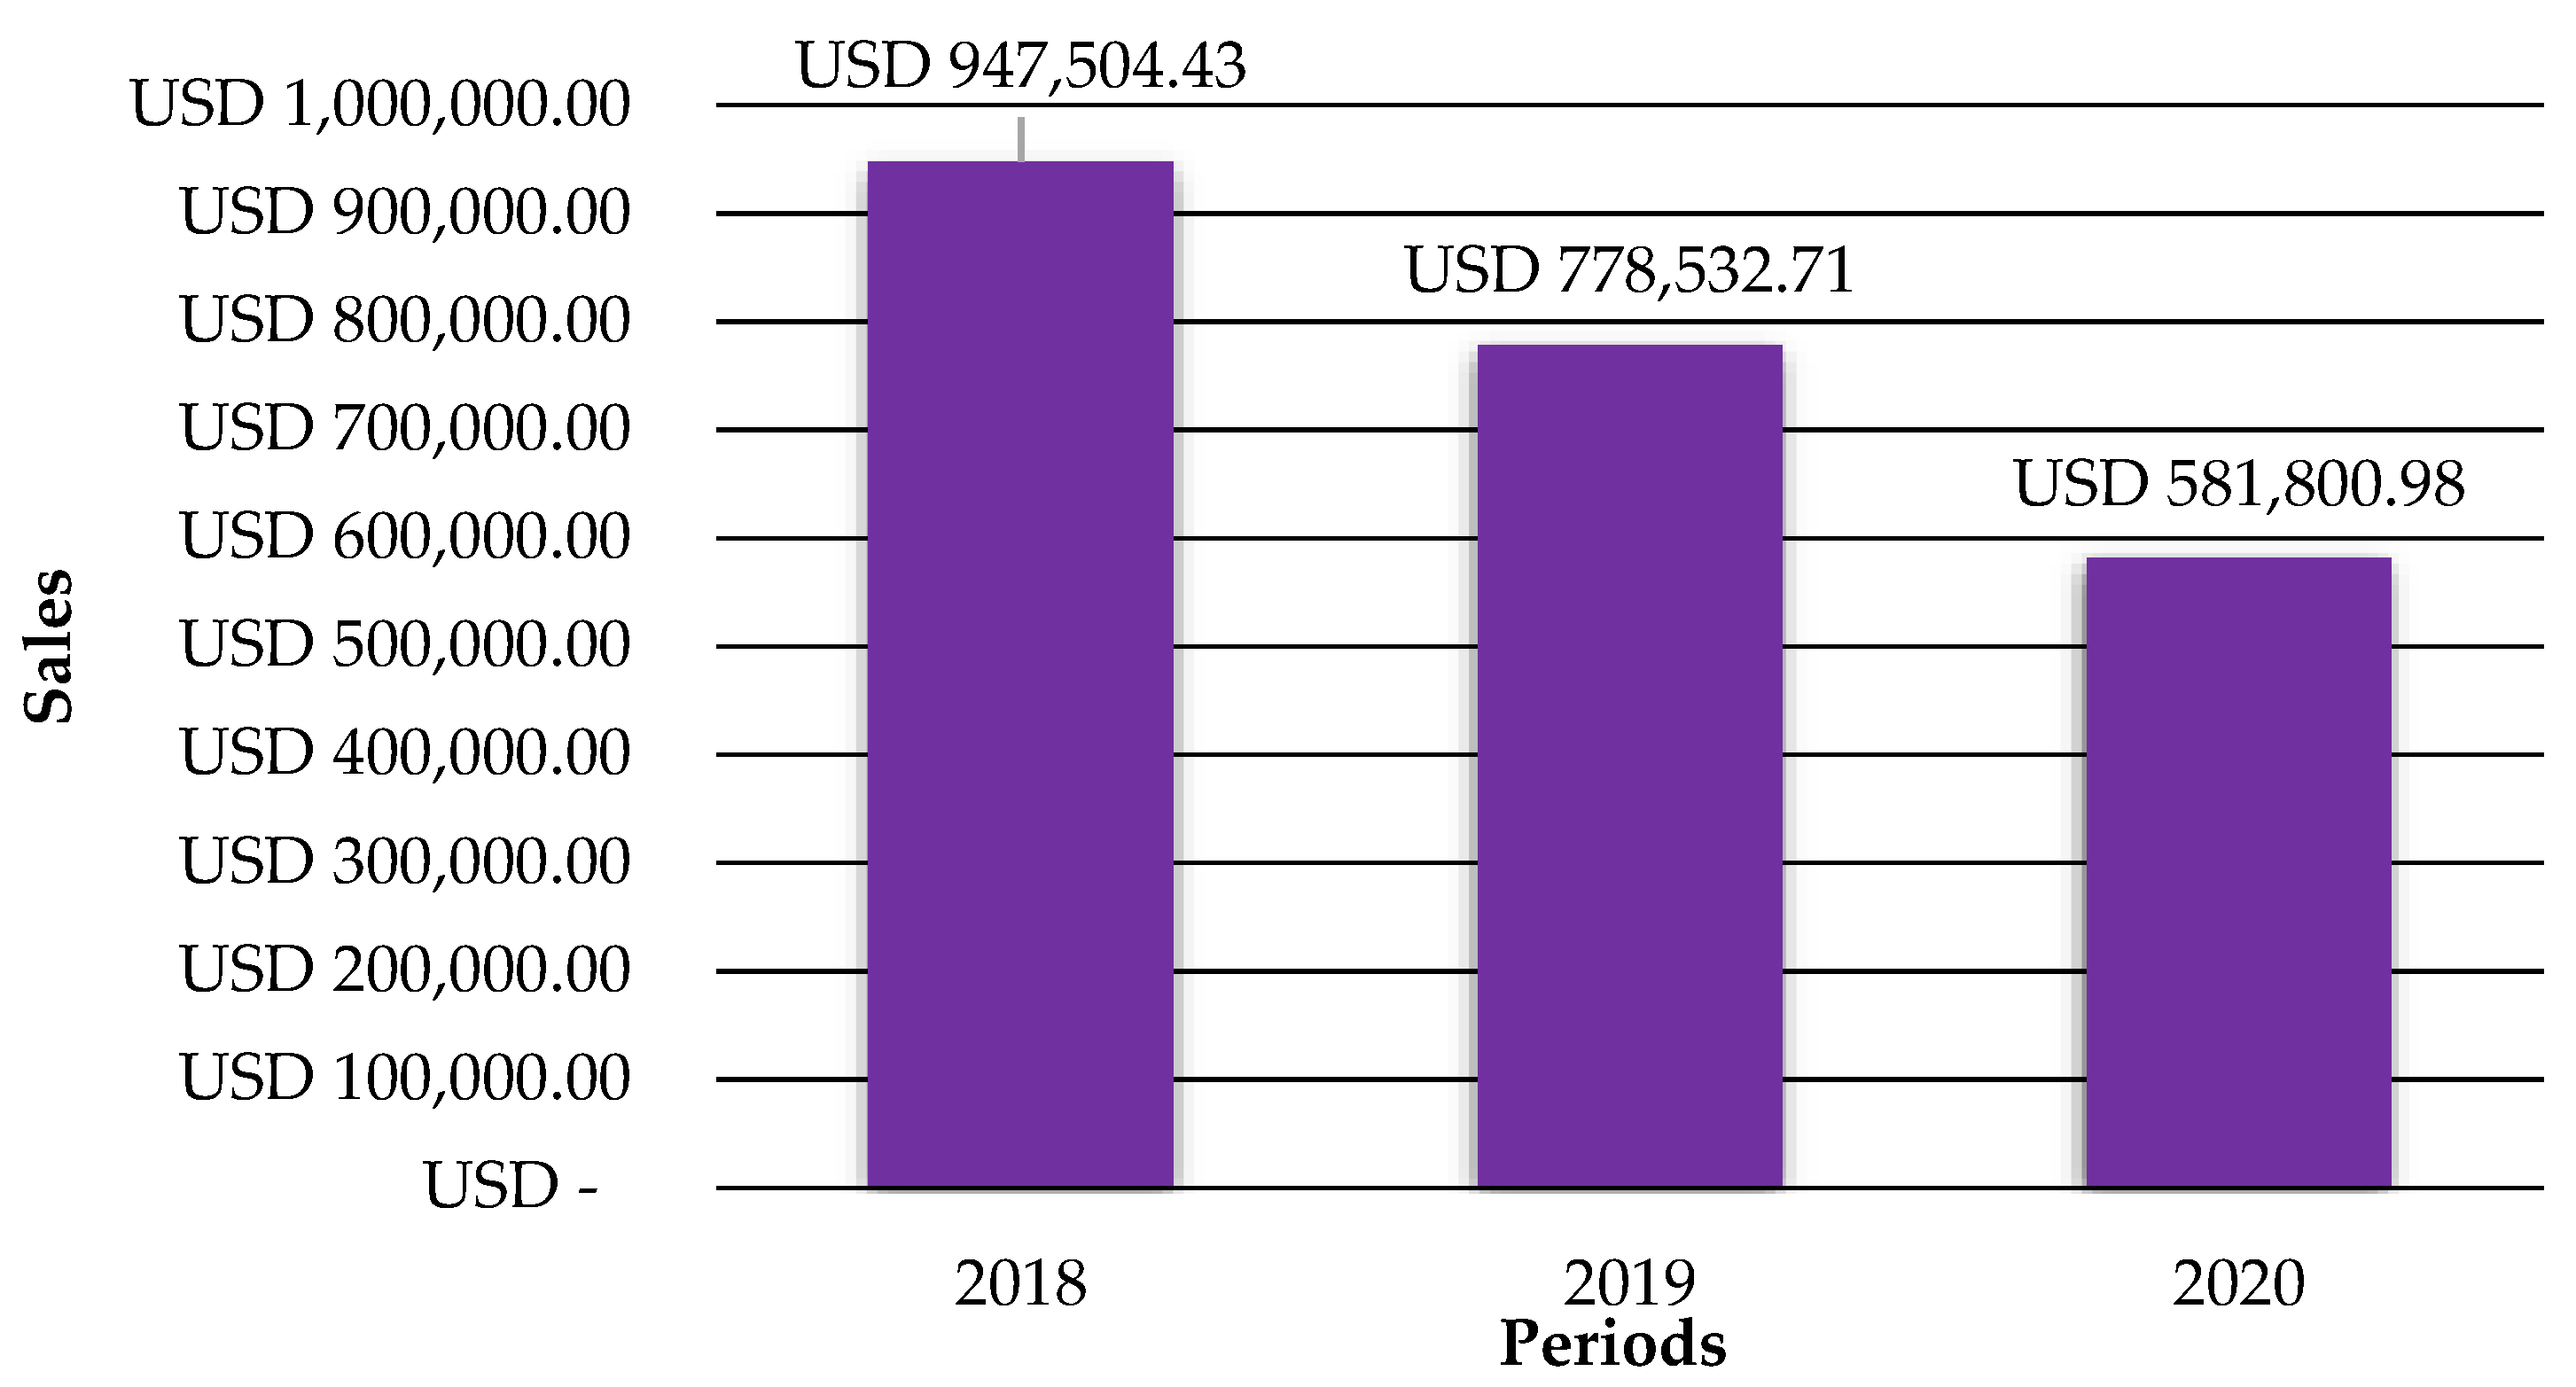
The second instrument is presented in 
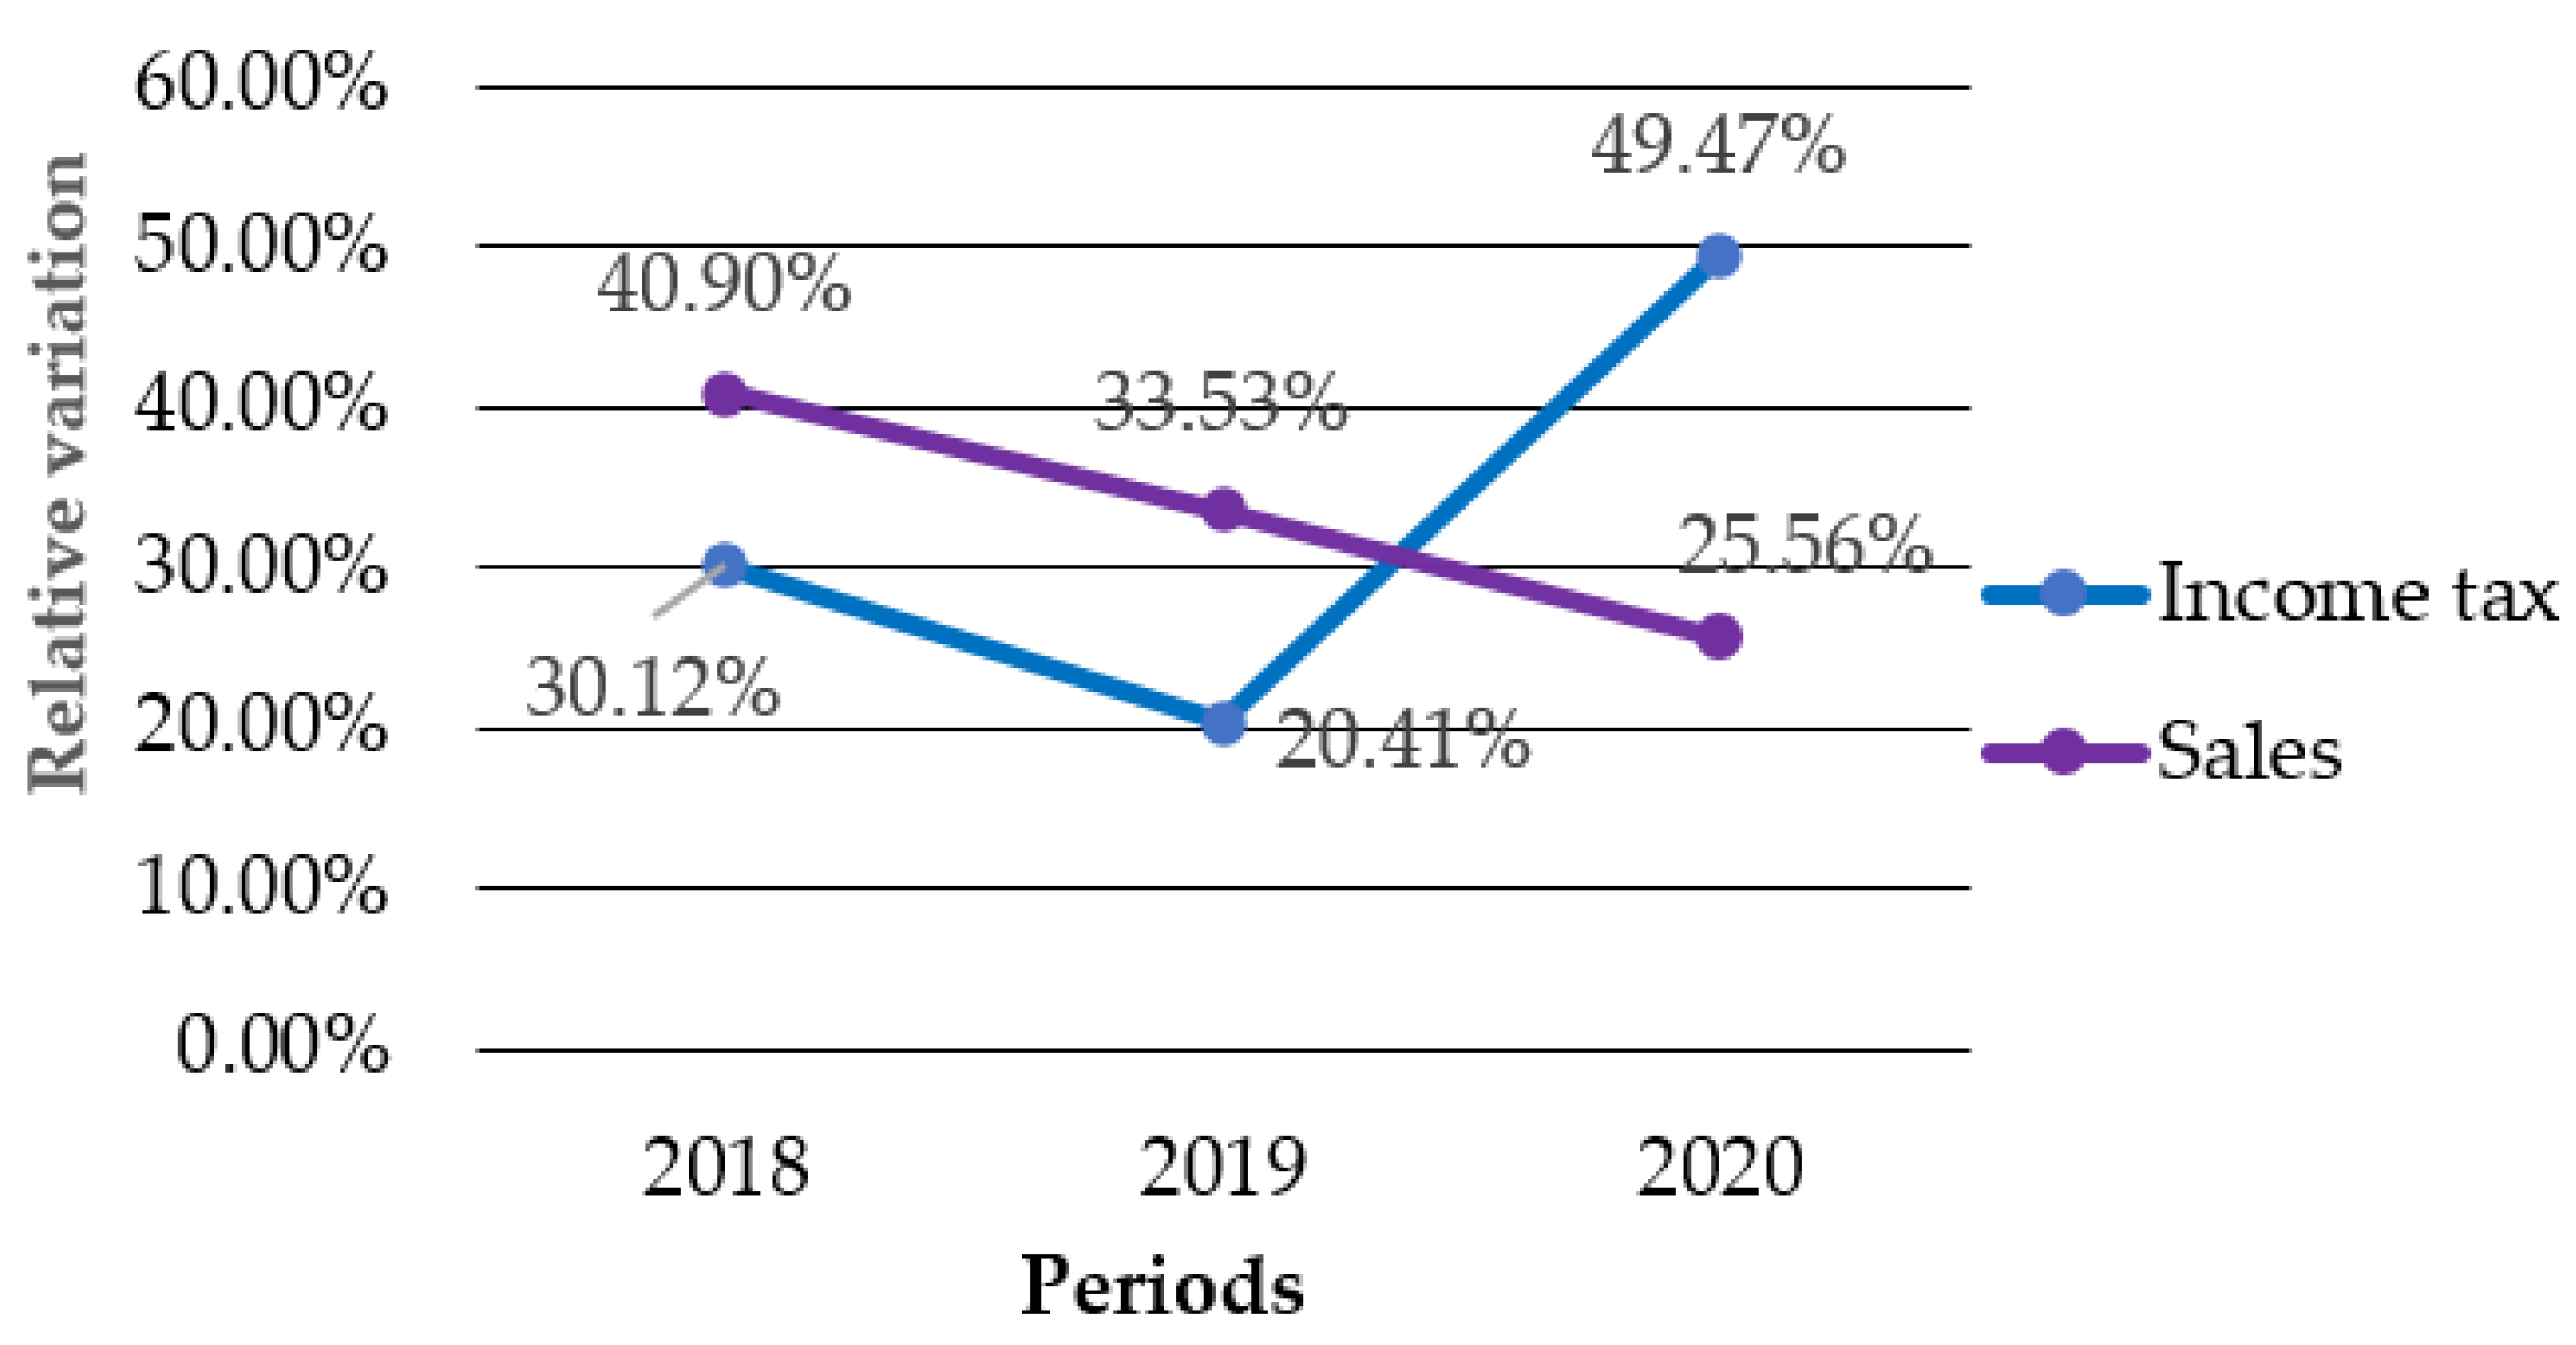
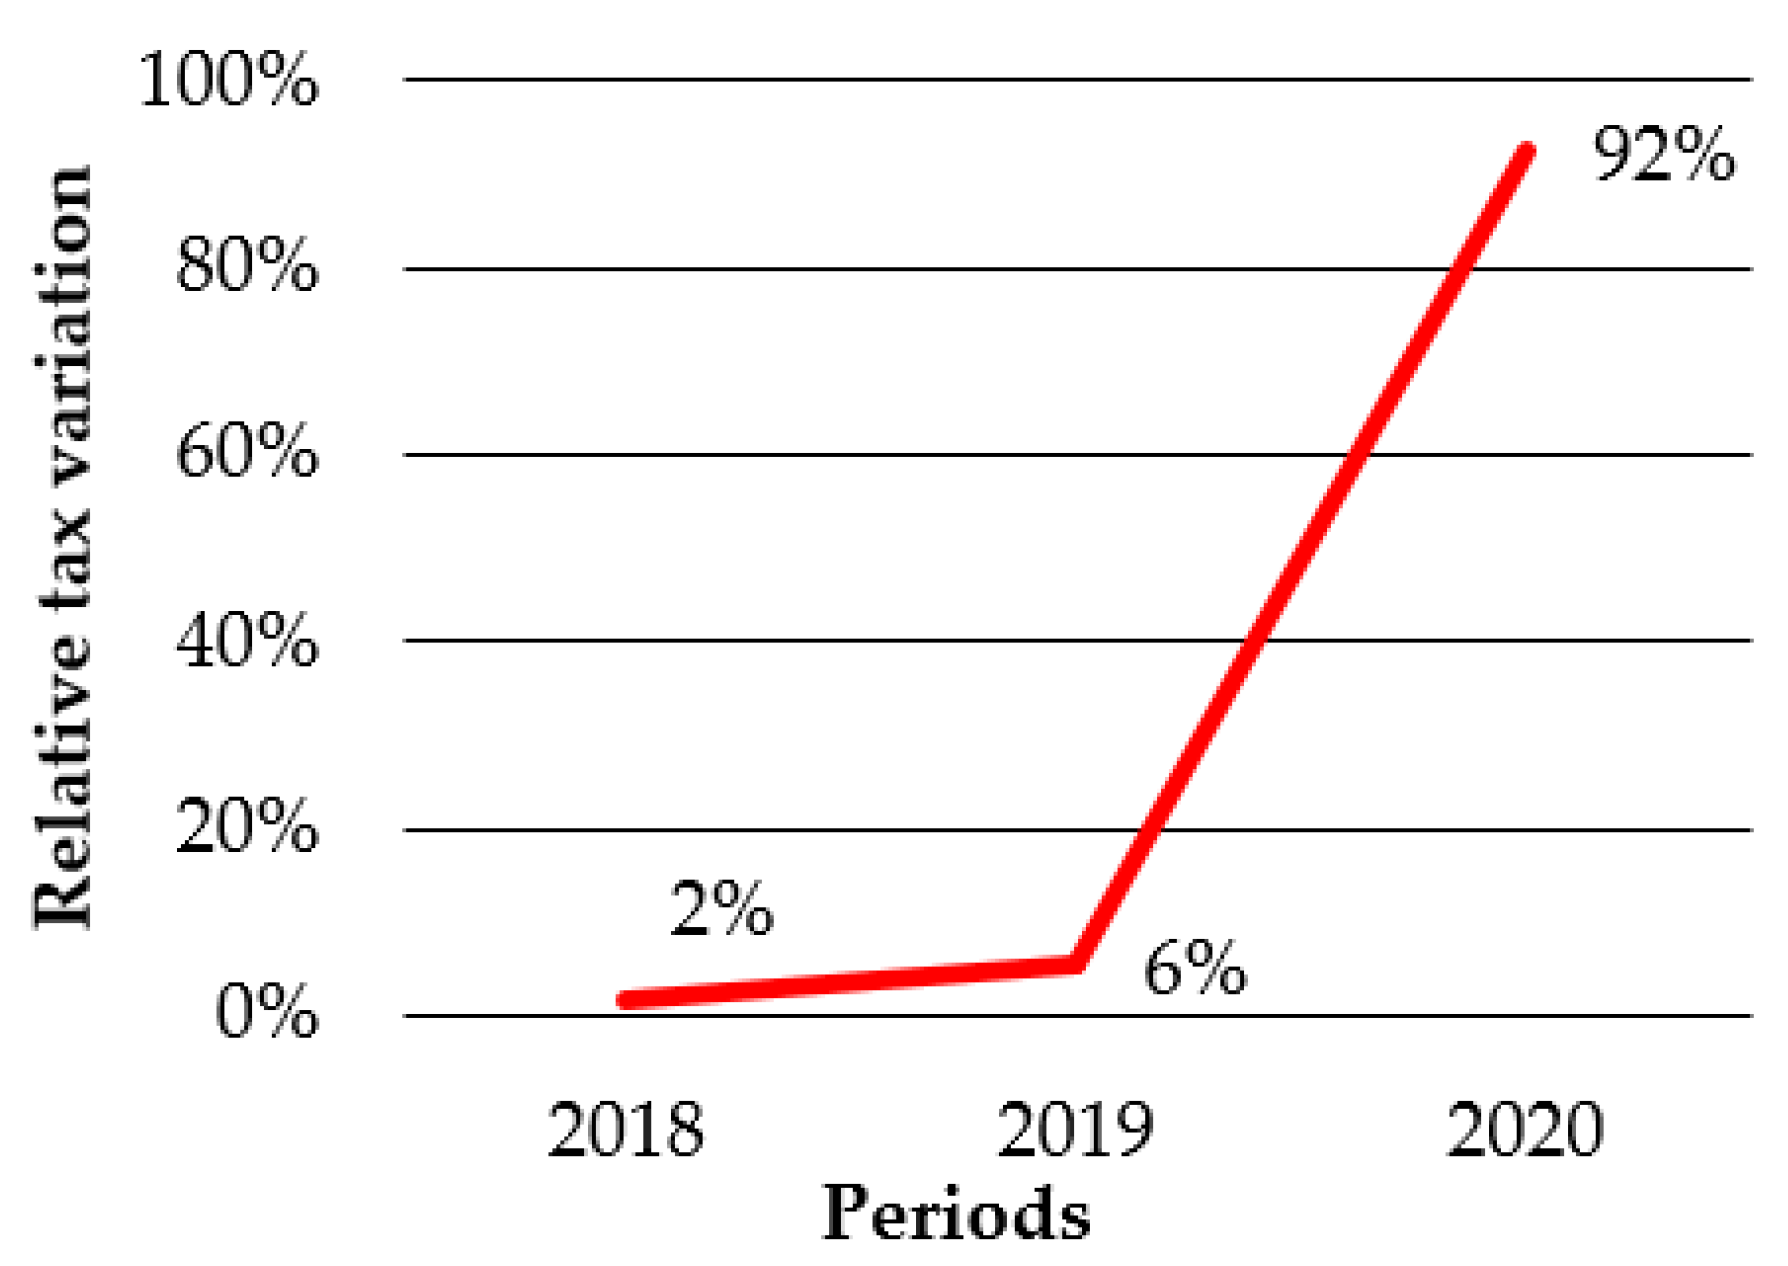
Table 6; it was a record card of the income tax paid by the microenterprises during three periods: in the years 2018 and 2019, when they were under the RG, and in 2020, when the new RIM regime was imposed. This information allowed determining the relative and absolute variation of both schemes with respect to the total value paid for the last three years.
The economic impact of microenterprises was also determined; for this, the economic result of the accounting period 2020 was obtained using the profit or economic loss produced in this period and the income tax paid.

3.3. Hypotheses Testing

The hypotheses test began with a normality test; owing to the number of data, the Shapiro–Wilk method was used as designed for small samples (≤30). A confidence level of α = 0.05 was established. The criteria for determining normality were as follows:
If the p-value is ≥α, it is accepted that the data come from a normal distribution.
If the p-value is <α, it is accepted that the data do NOT come from a normal distribution.
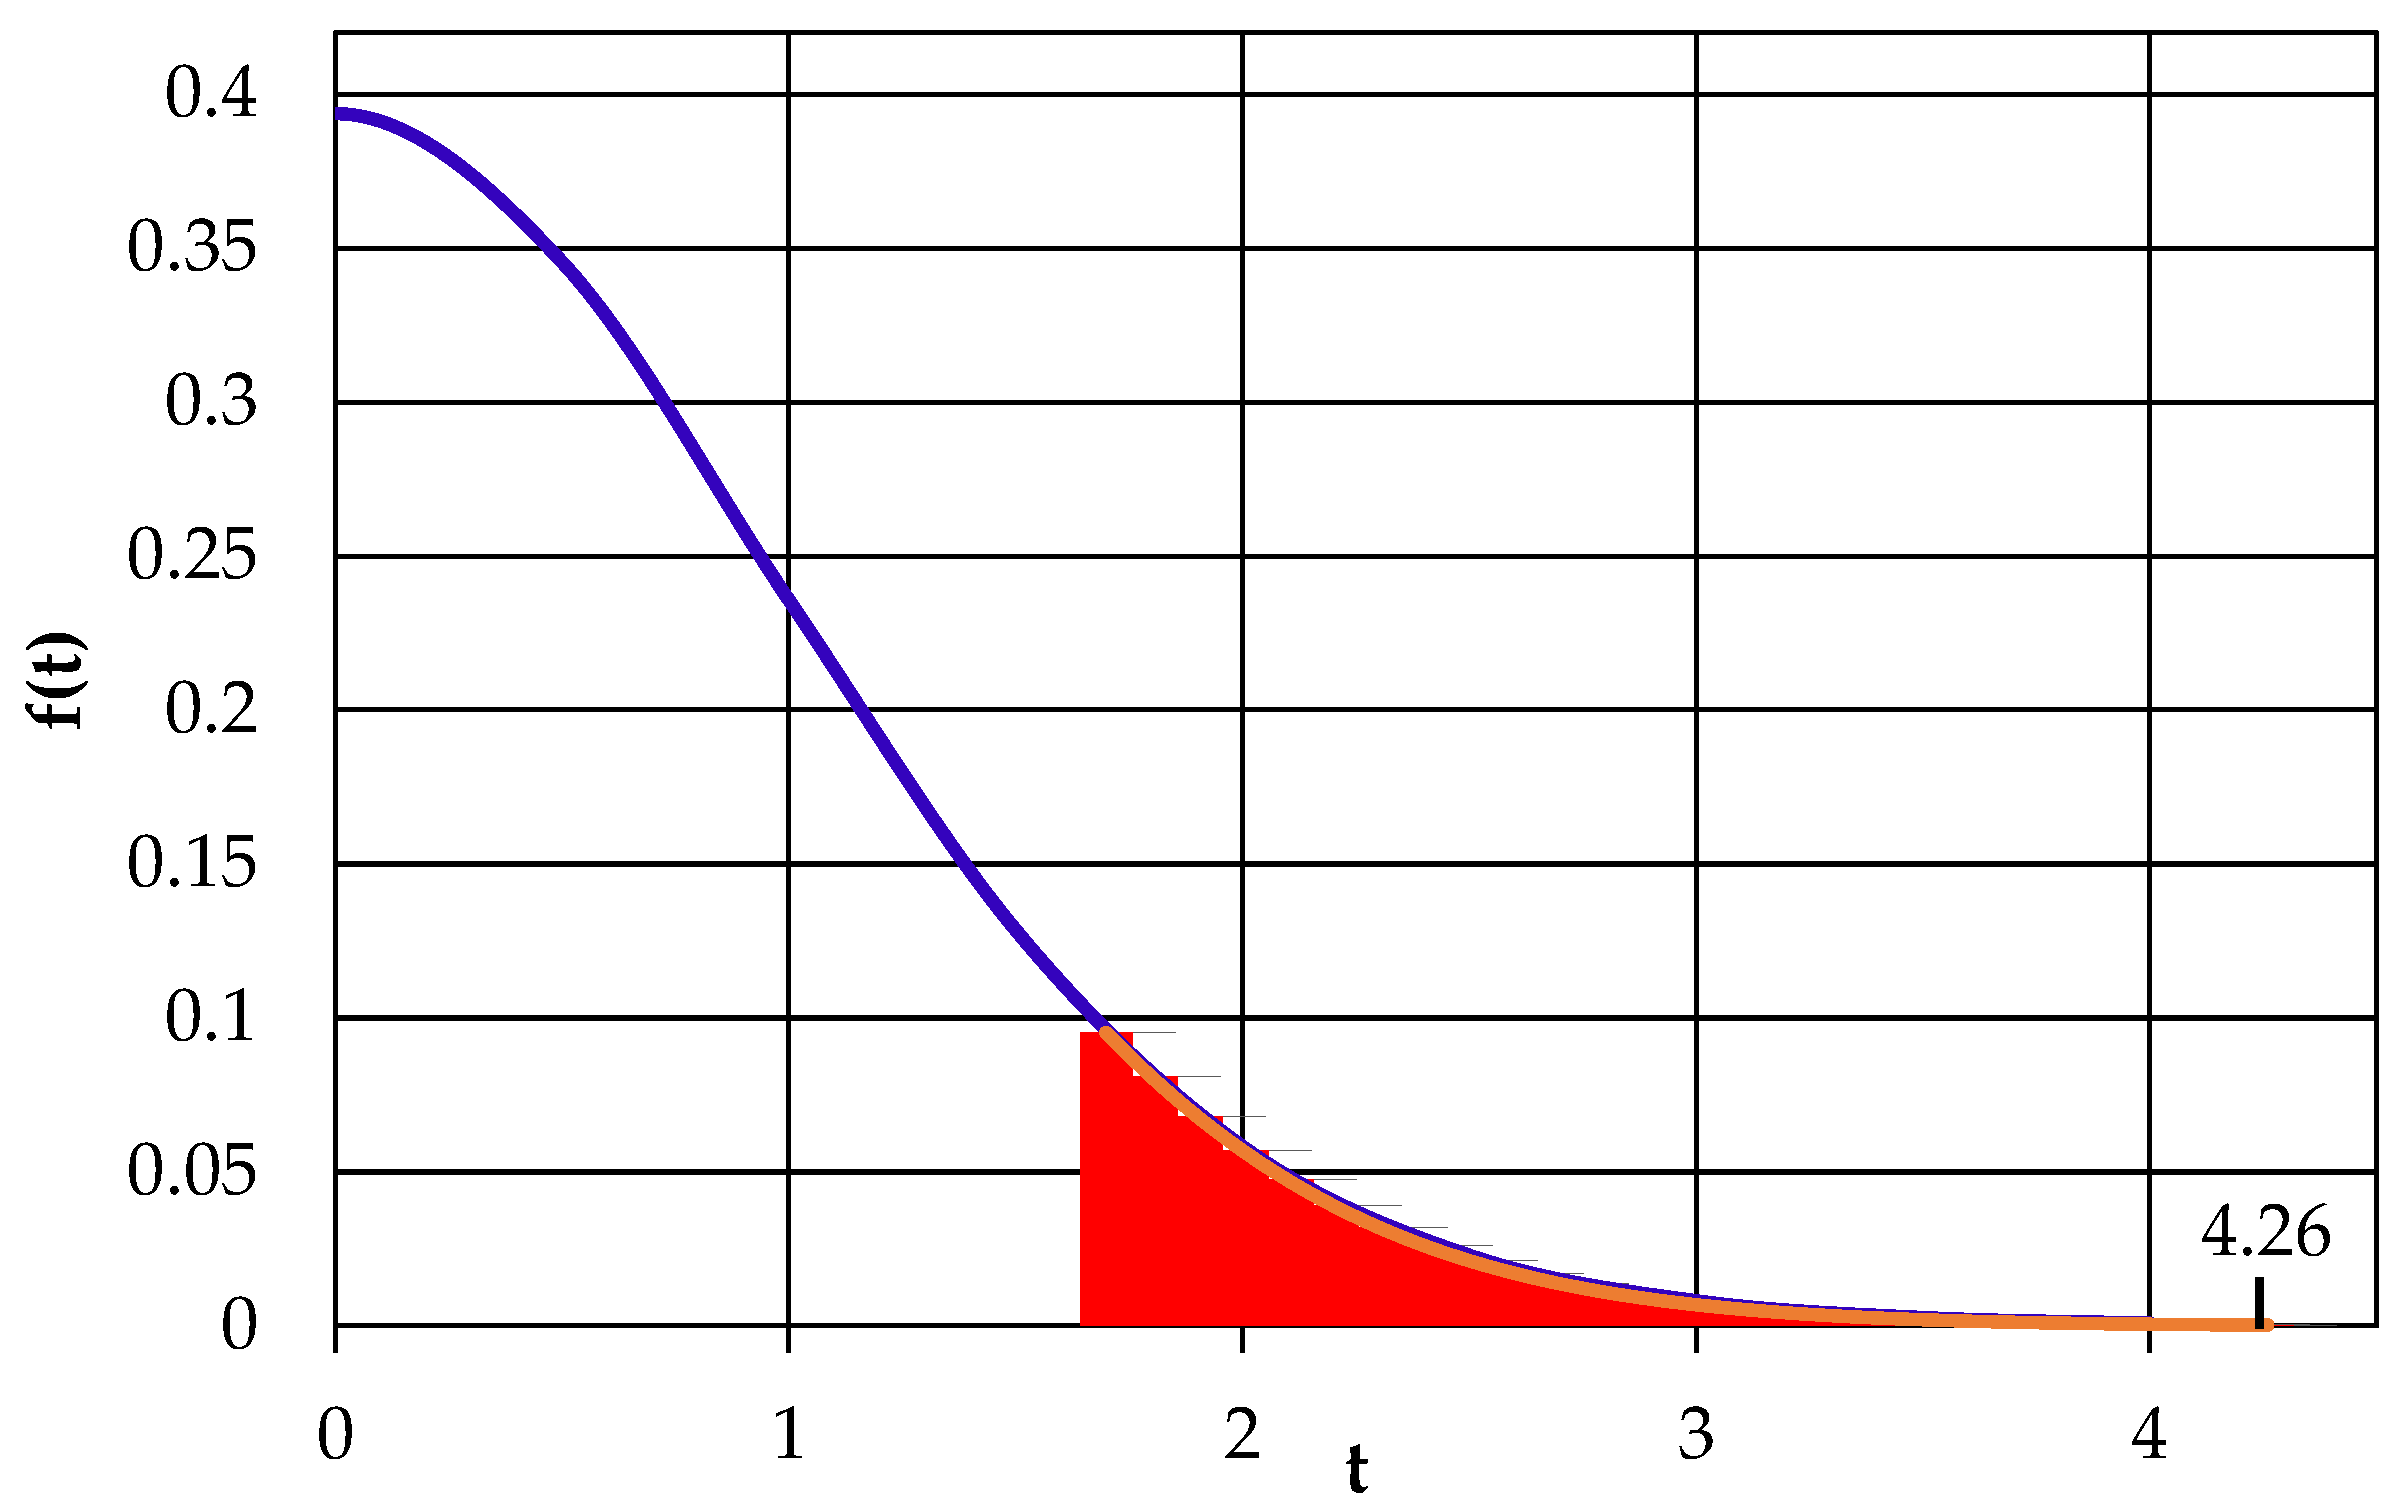
Once the normality of the data was determined, a hypothesis verification technique was applied, either normal distribution or Student’s T, as appropriate. In any case, the rejection zone of the distribution curve was determined for the acceptance or rejection of the null hypothesis H1 and consequently the rejection or acceptance of the alternative hypothesis H2.
To determine the statistical indices of the normality test and the verification of the hypotheses, the SPSS program was used because this software automates all the statistical calculations required.

4. Results

The information collected, the application of the instruments, the analysis of the data, and the verification of the hypotheses are presented as results.

4.1. Data Collected

Table 7 presents the 2020 financial data of the 10 microentrepreneurs in Group 1, including their income tax with the RIM. This was the first year in which this new regime was applied, which coincided with the first year of the pandemic.
Table 8 presents the 2020 financial data for the 10 microentrepreneurs in Group 2, including income tax with the RIM. This table shows that the taxable base subtotal had negative values caused by a decrease in sales with the COVID-19 pandemic, considered an accounting loss. Another possible reason was tax evasion by not billing all sales to avoid the 2% payment related to the RIM.
Regarding the societies being a more formal economic group, they had accounting records where the profits or losses of the particular year were identified, which allowed us to determine more specific data on the economic effect of the application of the RIM. This group tended to record each cost and expense to determine its usefulness for the participation of workers. Table 9 presents the 2020 financial data of the 10 microentrepreneurs in Group 3, including the income tax with the RIM.

4.2. Variation of the Income Tax between the RIM and the RG

Next, the difference in income tax from the previous regime (RG) was analyzed, that is, how much tax would have been paid without the reform. Table 10 presents the income tax for 30 microentrepreneurs for both regimes. Many microenterprises did not have to pay taxes with the RG because the previous regime did not depend directly on sales.
The effect caused by the RIM was significant in relation to the RG; the economic group affected the most was Group 1, with a relative variation of 3817%, and the group affected the least was Group 2 with 128%. These variations can be seen more clearly in Figure 2. This effect was generated because the previous regime (RG) determined the income tax on a taxable base obtained from the total of its income books minus expenses, minus various additional deductions such as personal expenses, causing a lower income tax. The new regime (RIM) determines the income tax using only income.

4.3. Variation of Income Tax over Time

Next, we verified the economic variation according to the income tax payment history of the last three periods for the different groups of microentrepreneurs, considering that until 2019 the income tax calculation was applied under the RG and in 2020 with the RIM.
Table 11 details the income tax amounts paid in the periods from 2018 to 2020 by the 10 microentrepreneur taxpayers in Group 1.
In Table 11, it can be seen that the lowest income tax payment was made in the 2018 period compared to the other years, with a total of USD 362.34. In 2019, the value of the income tax amounted to USD 1129.00. In 2020, a notable increase was obtained, and the income tax was USD 18,217.87 where all 10 taxpayers had to pay some amount. In the three periods, taxpayer G1.03 was the only beneficiary, and the rest of the taxpayers paid a higher income tax in the 2020 period.
Figure 3 shows the percentage paid in each period with respect to the total payment made in the last 3 years by the microentrepreneurs in Group 1, observing a notable increase in income tax.
According to the tax reform applied in 2020, the drivers of the calculation of income tax were the sales of the period. Figure 4 shows the sales of the microentrepreneurs in Group 1 in the last 3 years. When analyzing the total sales of the 10 taxpayers, we determined that the period 2020 had the lowest value owing to the COVID-19 world pandemic. Despite the decrease in sales in this period, a greater payment of income tax was made compared with previous periods.
Microentrepreneurs in Group 2 were required to keep accounts, unlike those in Group 1, which were only required to keep a book of income and expenses. This was because of a higher level of income. This is evident in Table 12, which presents the income tax paid by the microentrepreneurs in Group 2.
In reviewing the income tax in Table 12, we found that, in the 2018 period, USD 33,665.05 was paid, and in the 2020 period, a value of USD 35,975.92 was paid; the income tax payments were similar to those during the crisis economy caused by COVID-19. Figure 5 shows the percentage paid in each period with respect to the total payment made in the last 3 years by the microentrepreneurs in Group 2, confirming the similarity in the payments of the first and last periods.
This apparent similarity in payment in the two periods was not supported by the information on sales presented in Figure 6. The decrease in total sales of the microentrepreneurs in Group 2 from 2018 to 2020 was evident, although the income tax of the last year had no decrease, despite the fact that sales decreased to USD 1,821,426.00 compared to 2018 (USD 3,109,750.06). These values reflected the tax inequity in the country when applying the new tax reform in times of COVID-19.
Table 13 presents the income tax values from 2018 to 2020 for the 10 societies in Group 3. It was observed that the year with the highest income tax was 2020 with a value of USD 11,636.02. In this year, all taxpayers paid more income tax because of the 2019 tax reform that applied to 2020, and the year that generated the least tax was 2018 with USD 6046.99 collected under the RG.
Figure 7 shows the percentage paid in each period with respect to the total payment made in the last 3 years by the microentrepreneurs in Group 3, confirming the increase in income tax for the last year, amounting to 47.69% of the total payment made in the last 3 years.
Figure 8 shows the sales of the microentrepreneurs in Group 3 in the last 3 years. When analyzing the total sales of the 10 taxpayers, we determined that the 2020 period had the lowest value (USD 581,800.98) owing to the global COVID-19 pandemic. Despite the decrease in sales in this period, a higher payment of income tax was made compared to previous periods.
Finally, a global analysis of the 30 microentrepreneurs for the last three periods was carried out. Table 14 shows the gross income tax and sales values, observing the highest income tax values in 2020 and the lowest sales values in the same year.
Figure 9 shows the data of the previous table in percentage form, observing the decrease in sales over time and the income tax decreases in 2018 and 2019, but the tax shoots up in 2020 with the application of the RIM. In the last year, global sales decreased mainly because of the pandemic and income tax increased owing to the new way of calculating, which only considered income.

4.4. Economic Effect on Microenterprises

To analyze the economic impact on microenterprises in the year 2020, the accounting results of the 30 microentrepreneurs were used and the payment of income tax was added to determine if there was a loss or profit in this year. Table 15 presents the economic performance of all microenterprises in this case study. Of the 30 microenterprises, 13 had an accounting loss (43.33%) and another 4 had low profits, below USD 1000 (13.33%). The total economic deficit was USD 141,284.77, and many of these companies resorted to financing with private entities and others signed payment agreements with the Ecuadorian government.

4.5. Hypotheses Testing

Before determining the hypothesis verification tool, a data normality test was performed using the Shapiro–Wilk method. This normality test was applied to the income tax data set of the 30 microentrepreneurs, both in the RG and in the RIM. According to Table 16, in both cases the p-value was less than the confidence level (α = 0.05). In this way, the hypothesis of non-normal distribution was approved, that is, the income tax data for the 30 microentrepreneurs did not have a normal distribution.
To test hypotheses H2, the Student’s t-test was applied to two related samples. Related samples were considered because the same group of 30 microentrepreneur taxpayers was subject to income tax settlement according to both regimes (RG and RIM), being a cross-sectional study. Table 17 contains the results of applying the Student’s T tool. The t-statistic was obtained using the paired differences, with a mean of USD 1542.41 and 29 DOF. The value of t = 4.26 was in the rejection area (tα = 1.699), as shown in Figure 10. This allowed us to conclude that the null hypothesis H1 is rejected and the hypothesis H2 is accepted. In addition, the p-value was well below the confidence level (α), which implied a significant difference in the income tax of the 30 microentrepreneurs before and after the application of the reform.
Figure 10 shows the Student’s T distribution, marking in red the zone of rejection and locating the value of T obtained by the analysis of paired samples (t = 4.26), verifying the rejection of the null hypothesis H1 and consequently approving the alternative hypothesis H2.

5. Discussion

This case study analyzed the income tax during the COVID-19 pandemic for microentrepreneurs in Ecuador, a complex case because this tax was affected by two factors, the economic crisis and the regime change, a unique situation. For this, data from primary sources—direct economic figures from the microenterprises—were used. The vast majority of microenterprises analyzed showed a deficit in their tax returns because they were negatively affected by the COVID-19 pandemic, and few microenterprises made profits, consistent with what happened around the world [18,34]. On the other hand, the new regime, which was applied for the first time during the pandemic, determined the income tax based on the sales made without considering the expenses. This was unfair to companies that made minimal profits on the sale of their products and required high investment capital. Although this analysis was carried out in Ecuador, the negative effects of the COVID-19 pandemic crisis were witnessed throughout the world, closing companies and producing unemployment [35,36]. This particularity generated worse results in this South American country.
The income tax is paid throughout the world, and it must be fair to improve the working conditions of the owners, especially in times of COVID-19 [37]. The results of our research showed an increase in this tax when sales decreased in relation to previous years. There is also no microenterprise classification for the payment of income tax under the RIM. As a result, there is a tax inequity that affects owners unequally, generating greater discontent [38].
Regarding the economic performance of the microenterprises studied in the year 2020, 13 of the 30 microenterprises had economic losses, which implied that their fiscal year ended in debt to banking entities or through agreements with the government when paying their income tax during 2021. The microenterprises also did not receive government support to cover losses or higher taxes during COVID-19. The pandemic continues to affect microentrepreneurs, and the future of these microenterprises is currently doubtful [39]. Faced with these difficulties, other governments made the decision to support companies to save jobs [28,29,30], but this did not happen for microentrepreneurs in Ecuador. On the contrary, in our results, the damage caused by this regime is evident. Income tax continues to be the main means of collecting taxes, and governments need to cover their expenses, but it is necessary to design more sustainable systems oriented to collective well-being [13,31].
The hypothesis test supported the premise that the regime imposed for the year 2020 during COVID-19 was significantly different from the regime applied before the pandemic. Studies have reported a reduction in tax collection as a result of this crisis [28,40], but Ecuador continued to collect similar or higher amounts of taxes from microentrepreneurs during COVID-19. The conditions of our study are unique owing to the effect of multiple combined factors: on the one hand, the COVID-19 pandemic that reduced sales, and on the other, the implementation of a simplified tax system that determines the tax from 2% of the gross income. As part of our findings, a decrease in sales was verified in all the microenterprises analyzed, but these same companies had a higher income tax payment compared to the years before the pandemic and before the change of regime. Related research is scarce and limited because of the particularities of this study.
In Ecuador, around one million microenterprises were registered in the year 2020. The objective of this work was not to generalize the results to the entire sector. Although companies with different economic activities and different types of microenterprises were chosen, the number of microentrepreneurs was very limited. This number could not be increased because most microenterprises refused to provide these data, and the tax administration was not authorized to provide this information.

6. Conclusions

The COVID-19 pandemic has had an economic impact around the world. Microenterprises have experienced difficulties in different areas, but Ecuador faced a tax that was not proportional to the profits received. This case study showed several problems in the income tax paid in the first year of the pandemic: decreased sales, increased tax payments, and economic losses. In short, the RIM was not fair for microenterprises in Ecuador, especially for those that had a minimum profit margin on their products or services because they were taxed on the total value of sales. In addition, the pandemic produced considerable economic losses for some microenterprises, yet these paid equal or higher amounts of income tax, compared to previous years.
In practice, this work reported the impact on these microenterprises, showing negative values in some economic results amid the global economic crisis. As a theoretical contribution, we suggested that the lack of equitable regimes supporting the development of microenterprises is indisputable; thus, studies of the parameters to be considered in the liquidation of income tax are required, both in permanent taxes and in temporary taxes, to prevent future crises. In the sociological area, the importance of microenterprises to the microeconomics of a country is indisputable, especially in underdeveloped and developing countries that depend on the jobs generated by this economic sector. This work establishes a precedent for other developing countries that depend largely on microentrepreneurs, to design progressive and equitable regimes for all economic activities to achieve sustainable tax systems.
As a limitation of this study, it was not possible to increase the amount of data by adding more microenterprises because access to their financial information is always limited by the disposition of the owners, and the government is not authorized to provide these economic details. In future works, these microenterprises can be followed up to identify the long-term effects. In addition, more studies are required on the economics of small and microenterprises as affected by the COVID-19 pandemic.

Author Contributions

Conceptualization, M.P.-T. and A.d.R.C.-Z.; methodology, M.P.-T.; software, M.P.-T. and J.V.-A.; validation, M.P.-T. and A.d.R.C.-Z.; formal analysis, M.P.-T. and J.V.-A.; investigation, M.P.-T.; resources, J.V.-A.; data curation, J.V.-A.; writing—original draft preparation, M.P.-T.; writing—review and editing, J.V.-A.; visualization, M.P.-T. and J.V.-A.; supervision, A.d.R.C.-Z.; project administration, A.d.R.C.-Z. and J.V.-A.; funding acquisition, M.P.-T. and J.V.-A. All authors have read and agreed to the published version of the manuscript.

Funding

This research received no external funding.

Institutional Review Board Statement

Not applicable.

Informed Consent Statement

Not applicable.

Data Availability Statement

All data are available in the tables of this document.

Conflicts of Interest

The authors declare no conflict of interest.

References

  1. United Nations. Micro-, Small and Medium-Sized Enterprises Day. Available online: https://www.un.org/en/observances/micro-small-medium-businesses-day (accessed on 7 December 2021).
  2. Lin, Y.-C.; Chen, C.-L.; Chao, C.-F.; Chen, W.-H.; Pandia, H. The Study of Evaluation Index of Growth Evaluation of Science and Technological Innovation Micro-Enterprises. Sustainability 2020, 12, 6233. [Google Scholar] [CrossRef]
  3. Mukhoryanova, O.; Kuleshova, L.; Rusakova, N.; Mirgorodskaya, O. Sustainability of micro-enterprises in the digital economy. E3S Web Conf. 2021, 250, 06008. [Google Scholar] [CrossRef]
  4. Kevill, A.; Trehan, K.; Harrington, S.; Kars-Unluoglu, S. Dynamic managerial capabilities in micro-enterprises: Stability, vulnerability and the role of managerial time allocation. Int. Small Bus. J. Res. Entrep. 2021, 39, 507–531. [Google Scholar] [CrossRef]
  5. Comisión Europea. Guía del Usuario Sobre la Definición del Concepto de Pyme. Available online: https://op.europa.eu/en/publication-detail/-/publication/756d9260-ee54-11ea-991b-01aa75ed71a1/language-es (accessed on 7 December 2021).
  6. Al Mamun, A.; Ibrahim, M.; Yusoff, M.; Fazal, S. Entrepreneurial Leadership, Performance, and Sustainability of Micro-Enterprises in Malaysia. Sustainability 2018, 10, 1591. [Google Scholar] [CrossRef] [Green Version]
  7. Bvuma, S.; Marnewick, C. Sustainable Livelihoods of Township Small, Medium and Micro Enterprises towards Growth and Development. Sustainability 2020, 12, 3149. [Google Scholar] [CrossRef] [Green Version]
  8. Ridwan Maksum, I.; Yayuk Sri Rahayu, A.; Kusumawardhani, D. A Social Enterprise Approach to Empowering Micro, Small and Medium Enterprises (SMEs) in Indonesia. J. Open Innov. Technol. Mark. Complex. 2020, 6, 50. [Google Scholar] [CrossRef]
  9. Kanapickiene, R.; Spicas, R. Credit Risk Assessment Model for Small and Micro-Enterprises: The Case of Lithuania. Risks 2019, 7, 67. [Google Scholar] [CrossRef] [Green Version]
  10. Benites, M.; González-Díaz, R.R.; Acevedo-Duque, Á.; Becerra-Pérez, L.A.; Tristancho Cediel, G. Latin American Microentrepreneurs: Trajectories and Meanings about Informal Work. Sustainability 2021, 13, 5449. [Google Scholar] [CrossRef]
  11. Acevedo, I.; Castellani, F.; Lotti, G.; Székely, M. Informality in the time of COVID-19 in Latin America: Implications and policy options. PLoS ONE 2021, 16, e0261277. [Google Scholar] [CrossRef]
  12. Gonzales, D. Regímenes Especiales de Tributación para Pequeños Contribuyentes en America Latina; Banco Interamericano de Desarrollo: Lima, Peru, 2006; p. 57. [Google Scholar]
  13. Xu, B.; Li, L.; Liang, Y.; Rahman, M. Measuring Risk Allocation of Tax Burden for Small and Micro Enterprises. Sustainability 2019, 11, 741. [Google Scholar] [CrossRef] [Green Version]
  14. Bank of Latin America. Latin America and the Caribbean 2019: Policies for Competitive SMEs in the Pacific Alliance and Participating South American Countries, SME Policy Index; OECD: Paris, France, 2019; ISBN 9789264495425. [Google Scholar]
  15. Cardoza, G.; Fornes, G.; Farber, V.; Gonzalez Duarte, R.; Ruiz Gutierrez, J. Barriers and public policies affecting the international expansion of Latin American SMEs: Evidence from Brazil, Colombia, and Peru. J. Bus. Res. 2016, 69, 2030–2039. [Google Scholar] [CrossRef]
  16. Naciones Unidas; CEPAL; BID; OCDE. Estadísticas Tributarias en América Latina y el Caribe. Available online: https://www.oecd.org/tax/tax-policy/brochure-estadisticas-tributarias-en-america-latina-y-el-caribe-2019.pdf (accessed on 7 December 2021).
  17. Servicio de Rentas Internas. Régimen Impositivo para Microempresas. Available online: https://www.sri.gob.ec/regimen-impositivo-para-microempresas (accessed on 7 December 2021).
  18. Pak, A.; Adegboye, O.A.; Adekunle, A.I.; Rahman, K.M.; McBryde, E.S.; Eisen, D.P. Economic Consequences of the COVID-19 Outbreak: The Need for Epidemic Preparedness. Front. Public Health 2020, 8, 241. [Google Scholar] [CrossRef]
  19. Fetzer, T.; Hensel, L.; Hermle, J.; Roth, C. Coronavirus Perceptions and Economic Anxiety. Rev. Econ. Stat. 2021, 103, 968–978. [Google Scholar] [CrossRef]
  20. Mann, C.L. Real and financial lenses to assess the economic consequences of COVID-19. Econ. Time COVID-19 2020, 81, 85. [Google Scholar]
  21. Mann, F.D.; Krueger, R.F.; Vohs, K.D. Personal economic anxiety in response to COVID-19. Pers. Individ. Dif. 2020, 167, 110233. [Google Scholar] [CrossRef] [PubMed]
  22. Choi, Y.; Kim, H.; Lee, Y. Economic Consequences of the COVID-19 Pandemic: Will It Be a Barrier to Achieving Sustainability? Sustainability 2022, 14, 1629. [Google Scholar] [CrossRef]
  23. Khan, S.A.R.; Ponce, P.; Tanveer, M.; Aguirre-Padilla, N.; Mahmood, H.; Shah, S.A.A. Technological Innovation and Circular Economy Practices: Business Strategies to Mitigate the Effects of COVID-19. Sustainability 2021, 13, 8479. [Google Scholar] [CrossRef]
  24. Fabeil, N.F.; Pazim, K.H.; Langgat, J. The impact of COVID-19 pandemic crisis on micro-enterprises: Entrepreneurs’ perspective on business continuity and recovery strategy. J. Econ. Bus. 2020, 3, 1–9. [Google Scholar] [CrossRef]
  25. Kong, T.; Yang, X.; Wang, R.; Cheng, Z.; Ren, C.; Liu, S.; Li, Z.; Wang, F.; Ma, X.; Zhang, X. One year after COVID: The challenges and outlook of Chinese micro-and-small enterprises. China Econ. J. 2022, 15, 1–28. [Google Scholar] [CrossRef]
  26. Lima, C.K.T.; de Medeiros Carvalho, P.M.; de Araújo Araruna Silva Lima, I.; de Oliveira Nunes, J.V.A.; Saraiva, J.S.; de Souza, R.I.; Lima, C.K.T.; da Silva, C.G.L.; Neto, M.L.R. The emotional impact of Coronavirus 2019-nCoV (new Coronavirus disease). Psychiatry Res. 2020, 287, 112915. [Google Scholar] [CrossRef]
  27. Huang, C.; Wang, Y.; Li, X.; Ren, L.; Zhao, J.; Hu, Y.; Zhang, L.; Fan, G.; Xu, J.; Gu, X.; et al. Clinical features of patients infected with 2019 novel coronavirus in Wuhan, China. Lancet 2020, 395, 497–506. [Google Scholar] [CrossRef] [Green Version]
  28. Huerta de Soto, J.; Sánchez-Bayón, A.; Bagus, P. Principles of Monetary & Financial Sustainability and Wellbeing in a Post-COVID-19 World: The Crisis and Its Management. Sustainability 2021, 13, 4655. [Google Scholar] [CrossRef]
  29. Cabelkova, I. Sustainability of State Budgetary Expenses: Tax Compliance of Low-, Middle-, and High-Income Groups—The Evidence from the Czech Republic. Sustainability 2021, 13, 8966. [Google Scholar] [CrossRef]
  30. Larrimore, J.; Mortenson, J.; Splinter, D. Earnings shocks and stabilization during COVID-19. J. Public Econ. 2022, 206, 104597. [Google Scholar] [CrossRef] [PubMed]
  31. Cabelkova, I.; Smutka, L. The Effects of Solidarity, Income, and Reliance on the State on Personal Income Tax Preferences. The Case of the Czech Republic. Sustainability 2021, 13, 10141. [Google Scholar] [CrossRef]
  32. Engelschalk, M. Creating a Favorable Tax Environment for Small Business. Contrib. Econ. Anal. 2004, 268, 275–311. [Google Scholar] [CrossRef]
  33. Conceição, O.C.; Saraiva, M.V.; Fochezatto, A.; Aniceto França, M.T. Brazil’s Simplified Tax Regime and the longevity of Brazilian manufacturing companies: A survival analysis based on RAIS microdata. EconomiA 2018, 19, 164–186. [Google Scholar] [CrossRef]
  34. Phillipson, J.; Gorton, M.; Turner, R.; Shucksmith, M.; Aitken-McDermott, K.; Areal, F.; Cowie, P.; Hubbard, C.; Maioli, S.; McAreavey, R.; et al. The COVID-19 Pandemic and Its Implications for Rural Economies. Sustainability 2020, 12, 3973. [Google Scholar] [CrossRef]
  35. Sarmah, A.; Saikia, B.; Tripathi, D. Can unemployment be answered by Micro Small and Medium Enterprises? Evidences from Assam. Indian Growth Dev. Rev. 2021, 14, 199–222. [Google Scholar] [CrossRef]
  36. Czainska, K.; Sus, A.; Thalassinos, E.I. Sustainable Survival: Resource Management Strategy in Micro and Small Enterprises in the Rubber Products Market in Poland during the COVID-19 Pandemic. Resources 2021, 10, 85. [Google Scholar] [CrossRef]
  37. Karnon, J. The Case for a Temporary COVID-19 Income Tax Levy Now, During the Crisis. Appl. Health Econ. Health Policy 2020, 18, 335–337. [Google Scholar] [CrossRef] [PubMed] [Green Version]
  38. Stephenson, A.V. The Impact of Personal Income Tax Structure on Income Inequality for Belgium, Bulgaria, Germany, Lithuania, and Poland: A Comparison of Flat and Graduated Income Tax Structures. Atl. Econ. J. 2018, 46, 405–417. [Google Scholar] [CrossRef]
  39. Rajagopal, K.; Mahajan, V. Current and Post-COVID-19 Impact on SME Business Growth and Sustainability Trajectory. In Handbook of Research on Strategies and Interventions to Mitigate COVID-19 Impact on SMEs; IGI Global: Hershey, PA, USA, 2021; pp. 126–149. [Google Scholar]
  40. Oravský, R.; Tóth, P.; Bánociová, A. The Ability of Selected European Countries to Face the Impending Economic Crisis Caused by COVID-19 in the Context of the Global Economic Crisis of 2008. J. Risk Financ. Manag. 2020, 13, 179. [Google Scholar] [CrossRef]
Figure 1. Processes of the applied methodology.
Sustainability 14 02537 g001
Figure 2. Relative variations in income tax in the three groups of microentrepreneurs.
Sustainability 14 02537 g002
Figure 3. Relative variation of income tax in the three periods for the microentrepreneurs in Group 1.
Sustainability 14 02537 g003
Figure 4. Sales in the three periods for the microentrepreneurs in Group 1.
Sustainability 14 02537 g004
Figure 5. Relative variation of income tax in the three periods for the microentrepreneurs in Group 2.
Sustainability 14 02537 g005
Figure 6. Sales in the three periods for the microentrepreneurs in Group 2.
Sustainability 14 02537 g006
Figure 7. Relative variation of income tax in the three periods for the microentrepreneurs in Group 3.
Sustainability 14 02537 g007
Figure 8. Sales in the three periods for the microentrepreneurs in Group 3.
Sustainability 14 02537 g008
Figure 9. Relative variation of sales and income tax in the three periods.
Sustainability 14 02537 g009
Figure 10. Student’s T distribution.
Sustainability 14 02537 g010
Table 1. Similar studies audit form.
CiteAuthorYearObjectiveMethodResults
[31]Inna Cabelkova and Lubos Smutka2021Assess the impact of the preferences for solidarity, reliance on the state, and individual income on the preferences for the size and progressivity of income tax.Hierarchical linear and ordinal regression analysis, with ordinal smoothing spline transformations or ordinal predictors.The results suggest that higher incomes prefer less progressive taxation and lower overall taxation rates. Similarly, high incomes were associated with the perception that taxes for the high-income bracket are too high.
[32]Michael Engelschalk2004Analyze design options and examine the key problems and weaknesses in the design of simplified small business taxation schemes in transition countries.Literature review and data analysis.As the simplified systems operating in transition countries generally not only reduce compliance costs, bookkeeping, and reporting standards but also considerably lower the actual small business tax burden, revenue yields mostly are minor and represent a negligible share of total tax collection.
[33]Otavio Canozzi Conceição, Maurício Vitorino Saraiva, Adelar Fochezatto, and Marco Tulio Aniceto Francia2018Analyze the impact of the Brazilian Simplified Regime on the survival rate of two groups of establishments set up in the year 2007: those that opted for the regime and those that did not.The Survival Analysis technique was applied to a cohort of 3187 establishments that are included in the microdata of the Relação Anual de Informações Sociais (RAIS, Ministry of Labour, Brazil) system between 2007 and 2013.Survival analysis showed a high mortality of establishments in the first years of activity. The comparison between those opting for the regime and those not opting for it showed a statistically significant difference in the pattern of longevity between the two groups.
[13]Bing Xu, Lili Li, Yan Liang, and Mohib Ur Rahman2019Introduce the risk allocation of the tax burden to measure the tax burden outlier for small and microenterprises.A time-varying nonparametric benchmark and path model used to measure the tax risk allocation of 3552 small and microenterprises, during the period of January 2016 to August 2018.The study found that these outliers have a trend of linear drive and nonlinear drive of vibration, and there is a certain interaction between the two. In the time path and, if it is caused by a time variable, after some period of time, it may return to a reasonable level again.
Table 2. List of microenterprise taxpayers of Group 1.
TaxpayersEconomic ActivitySales 2020 (USD)
G1.01Retail sale of all kinds of parts, components, supplies, tools, and accessories for motor vehicles such as: tires (rims), inner tubes for tires (tubes). Includes spark plugs, batteries, lighting equipment parts, and electrical parts.96,255.46
G1.02Retail sale of paints, varnishes, and lacquers in specialized establishments.160,238.75
G1.03Support services for the manufacture of other types of general-purpose machinery on a fee or contract basis.27,598.23
G1.04Retail sale of meat derivatives.48,402.84
G1.05Rental for operational purposes of machinery and equipment for construction and civil engineering without operators: crane trucks, scaffolding and work platforms, without long-term assembly or dismantling.26,936.34
G1.06Retail sale of balanced products and fertilizers in specialized establishments.205,880.00
G1.07Retail sale of hardware items: hammers, saws, screwdrivers, and small tools in general, prefabricated equipment and materials for home assembly (DIY equipment); electrical wires and cables, locks, assemblies and decorations, fire extinguishers, lawn mowers of any kind, etc., in specialized establishments.103,615.60
G1.08Wholesale of construction materials: stone, sand, gravel, cement, etc.200,496.72
G1.09Retail sale of clothing and furs in specialized establishments.31,829.70
G1.10Retail sale of footwear material (insoles, heel cups, soles, and similar articles) in specialized establishments.20,954.80
Table 3. List of microenterprise taxpayers of Group 2.
TaxpayersEconomic ActivitySales 2020 (USD)
G2.01Wholesale alcoholic beverages, including bulk wine packaging without transformation.152,841.62
G2.02Fast food restaurants, snack bars, and establishments offering takeout, pizza delivery, etc.; ice cream parlors, soda fountains, etc.91,915.55
G2.03Mixed exploitation of crops and animals without specialization in any of the activities. The size of the farm as a whole is not a determining factor. If the cultivation of agricultural products or the raising of animals represents in a given unit a proportion equal to or greater than 66% of the current gross margins, the mixed activity should not be classified in this class, but between the cultivation or the raising of animals.269,764.35
G2.04Retail sale of all kinds of parts, components, supplies, tools, and accessories for motor vehicles such as: tires (rims), inner tubes for tires (tubes). Includes spark plugs, batteries, lighting equipment parts, and electrical parts.116,435.93
G2.05Wholesale computer-controlled or non-computer-controlled machine tools for the textile industry, including wholesale parts and components.230,908.76
G2.06Screen printing service for textile products and clothing, carried out by third parties in exchange for a fee or by contract.167,753.95
G2.07Retail sale of paints, varnishes, and lacquers in specialized establishments.127,157.59
G2.08Wholesale cereals (grains).301,570.06
G2.09Manufacture of garments made of leather or regenerated leather, of outerwear.290,014.31
G2.10Retail sale of pharmaceutical products in specialized establishments.73,063.88
Table 4. List of microenterprise taxpayers of Group 3.
TaxpayersEconomic ActivitySales 2020 (USD)
G3.01Data registration service provision and processing activities: complete processing of data provided by customers, generation of specialized reports based on data provided by customers.8510.71
G3.02Wholesale fertilizers.93,419.87
G3.03Activities of Radiology Laboratories (X-rays) and other diagnostic imaging centers.16,515.13
G3.04Purchase—sale, rental, and exploitation of owned or leased real estate, such as apartment buildings and homes; non-residential buildings, including exhibition halls; storage facilities, shopping centers, and land, including the rental of furnished or unfurnished houses and apartments for long periods, generally for months or years.102,500.30
G3.05Primary education (develops the capacities, abilities, skills, and competencies of girls, boys, and adolescents, is made up of seven years of studies, includes providing academic training and other related tasks to students from first to seventh grade, which provide a solid education for reading, writing, and mathematics, as well as an elementary level of understanding of disciplines such as history, geography, science, etc., can be provided in classrooms or through radio, television, Internet, correspondence or at home, includes the activities of single-teacher schools).26,051.89
G3.06Construction activities specializing in one aspect common to different types of structures and requiring specialized knowledge or equipment: foundations, including pile driving.10,981.86
G3.07Manufacture of confectionery products: candies, etc.2778.53
G3.08Wholesale meat and meat products.185,946.79
G3.09Activities of travel agencies principally engaged in selling wholesale or retail travel, package tour, transportation, and accommodation services to the general public and commercial customers.12,054.00
G3.10Radio network activities, that is, the collection of sound programs and their transmission to affiliates or subscribers over the air, by cable or by satellite; Internet radio broadcasts (Internet radio stations). Includes integrated data transmission with radio transmissions.123,041.90
Table 5. Record sheet for financial data of microentrepreneurs.
TaxpayerTaxable Income (USD)Costs and Deductible Expenses (USD)Subtotal Taxable Base (USD)Other Deductions and ExemptionsTaxable Base (USD)RIM Tax Income
(USD)
Personal Expenses (USD)Disability/Elderly (USD)
G1.01
G1.02
….
G1.10
Table 6. Microentrepreneur income tax registration form for three periods.
Taxpayer2018 (USD)2019 (USD)2020 (USD)Total (USD)
G2.01
G2.02
G2.03
G2.10
Total (USD)
Table 7. Financial data and income tax of microentrepreneurs in Group 1.
TaxpayerTaxable Income (USD)Costs and Deductible Expenses (USD)Subtotal Taxable Base (USD)Other Deductions and EXEMPTIONSTaxable Base (USD)RIM Tax Income
(USD)
Personal Expenses (USD)Disability/Elderly (USD)
G1.0196,255.46107,419.11−11,163.650.000.000.001925.11
G1.02160,238.75181,983.44−21,744.690.000.000.003204.78
G1.0327,598.2314,142.2713,455.960.000.0013,455.96551.96
G1.0448,402.8466,893.11−18,490.270.0011,315.000.00741.76
G1.0526,936.3441,853.57−14,917.230.000.000.00538.73
G1.06205,880.00218,281.87−12,401.870.000.000.004117.60
G1.07103,615.6091,659.9811,955.620.000.0011,955.622072.31
G1.08200,496.72195,764.354732.370.000.000.004009.93
G1.0931,829.708921.4822,908.226782.490.0016,125.73636.59
G1.1020,954.8020,906.5848.220.000.0048.22419.10
18,217.87
Table 8. Financial data and income tax of microentrepreneurs in Group 2.
TaxpayerIncome (USD)Cost of Sales (USD) Expenses (USD)Profit/Loss for the Year (USD)Tax ReconciliationTaxable Income (USD)Other Deductions and ExemptionsTaxable Base (USD)RIM Tax Income
(USD)
Employee Participation (USD)Other Exempt Income (USD)Local Non-Deductible Expenses (USD)Disability/Elderly (USD)Personal Expenses (USD)
G2.01152,841.62133,819.3521,512.47−2490.200.000.00948.78−1541.4211,315.000.000.002830.53
G2.0291,915.5526,932.1262,638.322345.11351.7718.647395.249721.710.000.009721.711838.31
G2.03269,764.35120,335.66103,803.7445,624.956843.740.00128.4345,753.3811,315.000.0034,438.385168.99
G2.04116,435.9343,365.8044,368.5828,701.554305.230.002654.5031,356.050.000.0031,356.052328.72
G2.05230,908.76141,130.3683,263.726514.68977.200.0020,420.8226,935.500.0012,023.5014,912.004618.18
G2.06167,753.9596,655.9443,450.5027,647.514147.130.009637.7637,285.270.007359.2329,926.043355.08
G2.07127,157.5982,660.3825,279.5219,217.692882.650.006962.3426,180.030.005657.5020,522.532543.15
G2.08301,570.06221,716.6857,465.6822,387.700.000.001638.0424,025.740.0011,029.3212,996.426031.40
G2.09290,014.31220,623.3239,897.7929,493.200.000.000.0029,493.200.000.0029,493.205800.29
G2.1073,063.8891,446.093420.57−21,802.780.000.000.00−21,802.70.000.00−21,802.71461.28
35,975.92
Table 9. Financial data and income tax of microentrepreneurs in Group 3.
TaxpayerIncome (USD)Cost of Sales (USD) Expenses (USD)Profit/Loss for the Year (USD)Tax ReconciliationTaxable Base (USD)RIM Tax Income
(USD)
Employee Participation (USD)Other Exempt Income (USD)Local Non-Deductible Expenses (USD)
G3.018510.710.001246.657264.061089.610.000.006174.45170.21
G3.0293,419.8751,915.1039,410.752094.020.00452.670.001641.351868.40
G3.0316,515.13694.9611,852.663967.520.000.000.003967.52330.30
G3.04102,500.3075,281.2225,750.081469.00220.350.000.001248.652050.01
G3.0526,051.89 28,367.96−2316.070.000.000.000.00521.04
G3.0610,981.86909.5715,778.53−5706.240.000.000.000.00219.64
G3.072778.532196.79327.65254.0938.110.000.00215.9855.57
G3.08185,946.79156,834.2632,586.80−3474.270.000.000.000.003718.94
G3.0912,054.000.009214.872839.13425.8796.210.002317.05241.08
G3.10123,041.900.00126,906.94−3865.040.000.000.000.002460.84
11,636.02
Table 10. RIM income tax and RG income tax.
TaxpayerRG (USD)RIM (USD)TaxpayerRG (USD)RIM (USD)TaxpayerRG (USD)RIM (USD)
G1.010.001925.11G2.010.002830.53G3.011358.38170.21
G1.020.003204.78G2.020.001838.31G3.02361.101868.40
G1.03107.05551.96G2.032869.915168.99G3.03872.85330.30
G1.040.00741.76G2.047502.492328.72G3.04274.702050.01
G1.050.00538.73G2.05204.604618.18G3.050.00521.04
G1.060.004117.60G2.062193.063355.08G3.060.00219.64
G1.0732.032072.31G2.07815.542543.15G3.0747.5155.57
G1.080.004009.93G2.0884.076031.40G3.080.003718.94
G1.09325.97636.59G2.092128.135800.29G3.09509.75241.08
G1.100.00419.10G2.100.001461.28G3.100.002460.84
Total465.0518,217.87TOTAL15,797.8035,975.92TOTAL3424.3011,636.02
Absolute Variation 17,752.82 20,178.12 8211.72
Relative Variation 3817% 128% 240%
Table 11. Income tax in the three periods for microentrepreneurs in Group 1.
Tax Income2018 (USD)2019 (USD)2020 (USD)Total (USD)
Microenterprises
G1.01131.120.001925.112056.23
G1.020.000.003204.783204.78
G1.03229.971129551.961910.93
G1.040.000.00741.76741.76
G1.050.000.00538.73538.73
G1.061.250.004117.64118.85
G1.070.000.002072.312072.31
G1.080.000.004009.934009.93
G1.090.000.00636.59636.59
G1.100.000.00419.1419.1
Total362.34112918,217.8719,709.21
Table 12. Income tax in the three periods for microentrepreneurs in Group 2.
Tax Income2018 (USD)2019 (USD)2020 (USD)Total (USD)
Microenterprises
G2.012170.7245.732830.535046.98
G2.022236.33792.721838.314867.36
G2.034931.940.005168.9910,100.92
G2.040.003171.562328.725500.28
G2.058414.265567.234618.1818,599.67
G2.062882.640.003355.086237.72
G2.073637.444284.862543.1510,465.45
G2.082640.631303.216031.49975.24
G2.096751.093912.95800.2916,464.28
G2.100.00244.821461.281706.1
Total33,665.0519,323.0335,975.9288,964.09
Table 13. Income tax in the three periods for microentrepreneurs in Group 3.
Tax Income2018 (USD)2019 (USD)2020 (USD)Total (USD)
Microenterprises
G3.010.00236.17170.21406.38
G3.022266.97133.141868.404268.51
G3.031236.832.49330.301569.63
G3.04276.762959.492050.015286.26
G3.05116.500.00521.04637.54
G3.06172.64687.21219.641079.49
G3.0731.7648.6855.57136.01
G3.08273.76305.303718.944298.00
G3.0979.8535.94241.08356.87
G3.101591.922305.662460.846358.42
Total6046.996714.1011,636.0224,397.11
Table 14. Sales and income tax in the last three periods.
Details2018 (USD)2019 (USD)2020 (USD)Total (USD)
Income tax40,074.3827,166.1365,829.82133,070.33
Sales7,304,225.945,988,530.274,565,060.4417,857,816.65
Table 15. Economic performance of microentrepreneurs in the year 2020.
TaxpayerAccounting Profit/Loss (USD)Employee Participation (USD)RIM Tax Income (USD)Accounting Profit (USD)Accounting Loss (USD)
G1.01−11,163.650.001925.110.00−13,088.76
G1.02−21,744.690.003204.780.00−24,949.47
G1.0313,455.960.00551.9612,904.000.00
G1.04−18,490.270.00741.760.00−19,232.03
G1.05−14,917.230.00538.730.00−15,455.96
G1.06−12,401.870.004117.600.00−16,519.47
G1.0711,955.620.002072.319883.310.00
G1.084732.370.004009.934110.490.00
G1.0922,908.220.00636.5922,271.630.00
G1.1048.220.00419.100.00−370.88
G2.01−2490.200.002830.530.00−5320.73
G2.022345.11351.771838.31155.030.00
G2.0345,624.956843.745168.9933,612.220.00
G2.0428,701.554305.232328.7222,067.600.00
G2.056514.68977.204618.18919.300.00
G2.0627,647.514147.133355.0820,145.300.00
G2.0719,217.692882.652543.1513,791.890.00
G2.0822,387.700.006031.4016,356.300.00
G2.0929,493.200.005800.2923,692.910.00
G2.10−21,802.780.001461.280.00−23,264.06
G3.017264.061089.61170.216004.240.00
G3.022094.020.001868.40225.620.00
G3.033967.520.00330.303637.220.00
G3.041469.00220.352050.010.00−801.36
G3.05−2316.070.00521.040.00−2837.11
G3.06−5706.240.00219.640.00−5925.88
G3.07254.0938.1155.57160.410.00
G3.08−3474.270.003718.940.00−7193.21
G3.092839.13425.87241.082172.180.00
G3.10−3865.040.002460.840.00−6325.88
Total134,548.2921,281.6765,829.81192,109.64−141,284.77
Table 16. Normality test results.
Statistic (W)DOFp-Value
RG0.461300.000
RIM0.900300.008
Table 17. Hypotheses testing.
Paired DifferencestDOFp-Value
MeanStandard DeviationMean Standard Error95% Confidence Interval of the Difference
LowerUpper
1542.411983.76362.18801.662283.164.26290.0000
Publisher’s Note: MDPI stays neutral with regard to jurisdictional claims in published maps and institutional affiliations.

