Abstract
The cryosphere in the Himalaya-Karakoram (H-K) is widespread, and its services significantly affect the SDGs implementation in the region, in particular related to the ‘No poverty’ (SDG 1), ‘zero hunger’ (SDG 2), ‘good health and well-being’ (SDG 3), ‘work and economic’ (SDG 8) and ‘partnership for the goals’ (SDG 17). We here established the networks to illustrate the complex relationship of cryosphere services with national SDG priorities in the countries of H-K, including Afghanistan, Pakistan, India, China, Nepal and Bhutan. The cryosphere services contributing to the national SDG priorities and the key targets were elucidated in line with the centralities of the network. It was found that ‘freshwater’, ‘clean energy’, ‘runoff regulation’, ‘climate regulation’, ‘research and education’ and ‘infrastructure and engineering’ are the services that play critical roles in H-K, and they were then applied to assess the impact of cryosphere services on the national SDG priorities. We subsequently identified a set of principal indicators in relation to the key targets of national SDG priorities, which has the explanation up to 85% of six entry points (SEPs) to advance SDGs of each country in H-K. In conjunction with the centrality of the key targets to be contributed by the overall cryosphere services in the network for each country, the dependency of SEPs on the cryosphere services can be established through principal indicators in association with the national SDG priorities in H-K countries.
1. Introduction
The ‘Cryosphere service’ emphasizes the benefits of human well-being provided by the interaction between the cryosphere and anthroposphere [1,2]. In Himalaya-Karakoram (H-K), there is an extensive coverage by the cryosphere [3,4] with their services, not only related to the water supply [5,6], but also to the climate regulation [2]. Almost hundreds of millions of populations benefit from the cryosphere services in Indus, Tarim, Ganges and Brahmaputra river basins [7] and beyond [8,9]. The cryosphere services are crucial to the transformations towards the 2030 sustainable development goals (SDGs) in H-K, as highlighted in the Hindu Kush Himalaya Assessment report by the International Centre for Integrated Mountain Development [10].
Notwithstanding the countries have consistently reiterated their commitment and determination to implement the UN’s 2030 sustainable development agenda, the overall progress in H-K is considerably lagging behind [11]. It becomes even more challenging to achieve all 17 sustainable development goals (SDGs) with the latest hurdles represented by the Public Health Emergency of International Concern (PHEIC) of COVID-19 [12,13]. Taking into account the national circumstances in policy-making is critical to enhance its effective implementation [14]. The Voluntary National Reviews (VNRs), presented at the High-level Political Forum on sustainable development (HLPF), called member states to conduct national assessment and develop the pathways to adapt to their circumstances [15]. In responding to the call, all countries in the H-K had issued national SDG priorities until 2021 to strengthen the integration of natural resources and policies. The effective pathways to meet the national SDG priorities are crucial to the transformations towards 2030 agency in H-K [10].
The extensive linkage between cryosphere services and SDGs indicate that the cryosphere is irreplaceable in sustainable development in high mountains [16]. Overall, 62 of 167 targets in SDGs are affected directly or indirectly by the cryosphere services [17]. The cryosphere services are also considered to be essential in the process that transforms cryospheric resources to the benefit that societies can obtain [2,18]. It underlines that importance to understand the cryosphere services for regional approaches in meeting its priorities of sustainability development. The interconnection among SDG targets [19,20,21] should also be taken into account. Moreover, monitoring and evaluation of the progress towards SDGs remain a vital priority [22]. The Tier Classification for Global SDG Indicators by the Inter-agency and Expert Group on SDG Indicators (IAEG-SDGs) provided a systematic set of evaluation indicators for the detailed assessment at the national levels [23]. Although the methodological development and the data availability are continuously improving, the insufficient consideration of extensive interconnection among the indicators and the weakness of statistical approaches in their assessment cause difficulty in the full progress appraisal of SDGs [24]. The optimization of an approach to accommodate the multicollinearity can efficiently track the progress of cryosphere services to the national SDG priorities in H-K.
Therefore, we established the network involving cryosphere services and the national SDG priorities in the countries of H-K, including Afghanistan, Pakistan, India, China, Nepal and Bhutan, and applied the centrality through social network analysis (SNA) to identify the cryosphere services that critically contributes to the national SDG priorities as well as the key targets that are contributed most by the cryosphere services. In addition, a set of principal indicators are then selected by principal component analysis (PCA) in alignment with six entry points (SEPs) for the implementation to advance SDGs [25]. Consequently, we can then demonstrate the dependency of SEPs on cryosphere services through each principal indicator in association with the SDG priorities of H-K countries.
2. Materials and Methods
2.1. Study Region
The H-K mountain ranges extend covered 1,550,000 km2, across Afghanistan, Pakistan, China, India, Nepal, and Bhutan as shown in Figure 1 [26]. This area is one of the regions mostly affected by the cryosphere in the low latitudes around the world, with 32,637 glaciers covering a total area of 41,514 km2 in this region [3]. The H-K mountain cryosphere is also the origin of the Indus, Tarim, Ganges and Brahmaputra rivers to benefit human well-being on a large scale. Approximately 869 million people living in these river basins rely on various services [7]. The stability of cryosphere service is crucial to the essential needs, social development and biodiversity protection in the H-K [10].
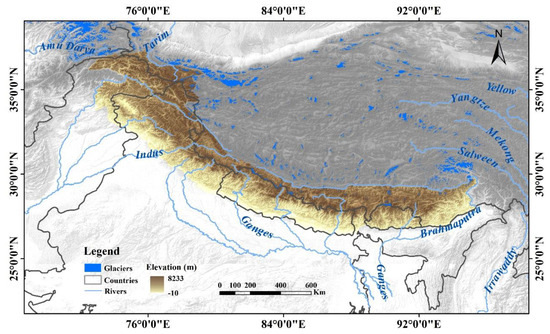
Figure 1.
Six countries (Afghanistan, Pakistan, China, India, Nepal, Bhutan) and four river basins (Indus, Tarim, Ganges and Brahmaputra) in the H-K mountains.
2.2. Data and Materials
The cryosphere services, encompassing four categories and 12 types, are applied to establish the relationship with 15 SDGs and 62 targets in total. It includes provisioning (freshwater, clean energy, ice and snow material), regulating (climate, runoff, environment, and hydrothermal regulation), cultural (aesthetic and recreational, research and education, religion, spirit, and cultural), and supporting services (habitation, infrastructure and engineering) [17].
The quantification of the interlinkages among the national SDG targets were implemented by the Institute for Global Environmental Strategies (IGES) [27]. The national SDG priorities were mapped with the Voluntary National Reviews (VNRs) in High-level Political Forum (HLPF) (https://sustainabledevelopment.un.org/, accessed on 15 December 2021). The Tier Classification for Global SDG Indicators by the Inter-agency and Expert Group on SDG Indicators (IAEG-SDGs) provided a systematic set of evaluation indicators for the detailed assessment at the national levels [24]. Additionally, the time-series SDG indicators database provides a detailed assessment of tracks progress at the national level (https://unstats.un.org/sdgs/metadata/, accessed on 15 December 2021).
2.3. Methods
2.3.1. Network Approach to Identify Cryosphere Service Contributions to National SDG Priorities
A comprehensive approach is needed for the implementation of the SDGs with consideration of complex interconnection [19,28,29]. Social Network Analysis (SNA) provides a systematic approach to describe the interconnection between cryosphere services and the national SDG priorities. Moreover, we use clusters in the network to identify the roles of services and SDG targets on the basis of modularity and centrality. The network communities emerged when multiple services clustering around the SDG priorities to form a module in the network [30]. The centrality based on SNA identifies the nodes (or vertices) that have a significant roles in the network [31], either in association with critical cryosphere services or key SDG targets.
More specifically, eigenvector centrality is a measurement to evaluate a node’s influence in a network [32]. The eigenvector centrality of the nodes depends on the weight and number of neighbors, xi is:
where c is the proportional constant, x = []T, and T is the matrix transpose. is the adjacency matrix assigned by the score of adjacent nodes in the network. represents there is a link between nodes and and zero otherwise. x is the eigenvector corresponding to the eigenvalue c−1 of the matrix A. The eigenvector centrality of cryosphere services does not merely count how many targets are linked, but it also considers the degree of those targets.
The community modularity algorithm measures the quality of the partitions and the resolution limit in community detection [33]. The Newman–Girvan algorithm (2004) for discovering the modules of a network consists in optimizing modularity with the largest value Q [34]. Cryosphere services that influence the SDGs are directed and weighted networks. It has been proposed to account for the directionality of the links summarized as follows:
where are the sum of the weights of the degrees of the vertices attached to vertex , is the sum of the weights of the links from to nodes in community C and . is the sum of the weights of all the links in the network.
2.3.2. PCA Approach to Identify Principal Indicators in SEPs
There is significant redundancy with high correlation coefficients among SDG indicators [22]. The Global Sustainable Development Report 2019 proposed the six entry points (SEPs) to advance the national SDG progress [25]. We may apply the principal component analysis (PCA) [35,36] to cluster and calculate the indicators weight in alignment with SEPs, to overcome the redundancy.
PCA is the eigenvector-based multivariate method to reduce the dimension, calculate weight and make a comprehensive comparison of explanatory variables [37]. The indicators of the national SDG priorities identified by SNA are converted into the independent principal components in alignment with SEPs. The cumulative variance contribution rate of m principal component to measure the degree of interpretation is:
where is the variance contribution rate of principal component i (). The cumulative variance contribution rate and the eigenvalue as the criterion for the principal components of cryosphere services to the national SDG priorities.
Each SEP is described by a set of independent principal components, and then the matrix of component score to establish the relationship between principal components and indicators for the weight calculation. The comprehensive score, which is the cumulative variance multiplied by component score, is used as a weight to describe the significance of each indicator in each SEP, demonstrating their importance to the SDG implementation pathways on the aspect of human, economy, food, energy, society and environment. The dependence of SEPs on cryosphere services through each principal indicator considering the individual priorities at a national scale can then be identified based on the score, which is the comprehensive score multiplied by the centralities of the network. The comprehensive score in PCA represents the explainability of an indicator in SEPs, and the centralities in SNA represent the importance of an indicator in the network of cryosphere services to advance the national SDG priorities.
3. Result
3.1. National SDG Priorities in H-K Region
Six countries in H-K, including Afghanistan, Pakistan, India, China, Nepal, and Bhutan, submitted the VNRs to integrated the SDGs into its national development strategies during 2016–2021. We illustrated the national SDG priorities and the overall priorities in H-K as shown in Figure 2. The commitment to multi-poverty alleviation remains a crucial focus to the greatest regional challenge and sustainable development. ‘No poverty’ (SDG 1), ‘Zero hunger’ (SDG 2), ‘Good health and well-being’ (SDG 3), and ‘work and economic’ (SDG 8) constitute the main priorities to human well-being. All countries are concerned about fairness. Specifically, some countries (e.g., Nepal, India, Pakistan) are priorities to ‘gender equality’ (SDG 5), while others (e.g., Afghanistan, Bhutan, China) are priorities to ‘reduce inequalities’ (SDG 10). ‘Partnership for the goals’ (SDG 17) acts as the lever in coordinating governance, financing, individual and collective actions, science and technology to promoting sustainable development.
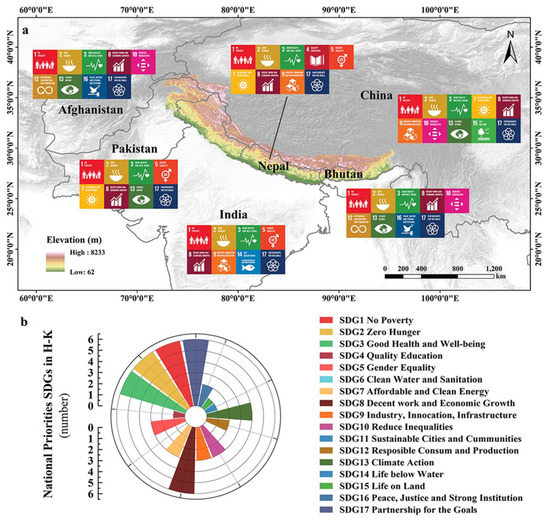
Figure 2.
The identification of the national SDG priorities (a) and their overall (b) in H-K. Afghanistan (2017, 2021), Bhutan (2018, 2021), China (2016, 2021), Nepal (2017, 2020), India (2017, 2020) and Pakistan (2019) have issued the VNRs at the HLPF reports (https://sustainabledevelopment.un.org/vnrs/) (accessed on 15 December 2021).
From the national standpoint, Afghanistan and Bhutan are committed to the ‘work and economic’ (SDG 8) and ‘production and consumption’ (SDG 12) to eliminate the multidimensional poverty. A ‘peace, justice and strong institution’ (SDG 16) is fundamental in coordinating resource allocation to reduce inequalities (SDG 10). Pakistan prioritizes the human basic needs, like SDG 2 (i.e., zero hunger), SDG 3 (i.e., health), SDG 7 (i.e., clean energy), etc. In addition to the common SDG priorities, India is also concerned with the services of marine ecosystem (SDG 14). The combination of ‘clean energy’ (SDG 7) and ‘infrastructure’ (SDG 9) are priorities (e.g., China, Nepal) to the energy supply and transition towards low-carbon development. Moreover, China is also committed action towards environmental and biodiversity conservation (SDG 15). ‘Climate action’ (SDG 13) prioritizes to the co-benefits of biodiversity and livelihood generation (e.g., Afghanistan, Bhutan, China, Pakistan).
3.2. Network of Cryosphere Services and National SDG Priorities
The multiple services are interconnected with the national SDG priorities. Meanwhile, a large number of inherent interlinkage among SDG targets (Figure S1) should also be considered. The network of cryosphere services to the national SDG priorities in H-K is shown in Figure 3. The services to advance the key targets are elucidated with the centralities of SNA (Table 1), as well as the key targets (Table S1). The specific analysis method is detailed in Section 2.2.
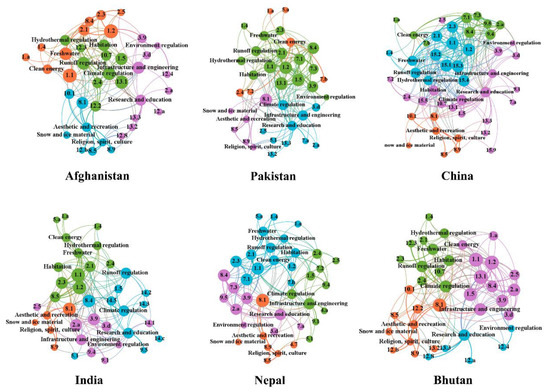
Figure 3.
The network of cryosphere services to advance the national priorities SDG targets in H-K. The scale of the dots represents the eigenvalue centrality, and the color represents the communities. To some extent, the communities of the services imply their central roles in the implication of the clusters of targets: the smaller the resolution, the more communities, and vice versa. The modularities of Afghanistan (0.299), Pakistan (0.241), China (0.241), India (0.25), Nepal (0.316) and Bhutan (0.305) with the standard comparison resolution of 1.0, separately.

Table 1.
The centralities of cryosphere services to advance the national SDG priorities.
Cryosphere services beneficial to the SDG priorities and key targets are different at the national level (Figure 3). As for Afghanistan, ‘freshwater’ (0.933), ‘runoff regulating’ (0.969) and ‘climate regulation’ (0.960) have higher centralities to promote agricultural development (targets 2.1, 2.3, 2.4, etc.) and eradicate extreme poverty for all (target 1.1 and 1.2). ‘Habitation’ (0.796) has the supporting services associate with the others to support the agricultural ecosystem and enhance the ability to prevent or reduce natural disasters (target 1.5, 10.7, 12.3, etc.). Additionally, ‘research and education’ (0.745) are associate with ‘infrastructure and engineering’ (0.876) to strengthen the measures (target 12.a, 13.2, 13.3, etc.) and minimize the adverse impacts of natural disasters (target 3.9, 3.d, 12.4, etc.).
As for Pakistan, agricultural development (target 2.1, 2.3, 2.4, etc.) and eradicate extreme poverty (target 1.1, 1.2) are mainly the key targets in the network of cryosphere services to promote the national SDG priorities. ‘Freshwater’ (0.582), ‘runoff regulating’ (0.636), ‘climate regulation’ (0.641), ‘research and education’ (0.585) and ‘habitation’ (0.557), related to cryospheric meltwater, are mainly services to promote these targets. ‘Research and education’ (0.585), ‘infrastructure and engineering’ (0.666) and ‘climate regulation’ (0.641) are in the network community to strengthen resilience and adaptive capacity to climate-related hazards and natural disasters (target 13.1, 3.9, 3.d, etc.).
As for China, the target 15.1 (terrestrial and inland freshwater ecosystems), 15.2 (sustainable management of forests), 15.3 (combat desertification, restore degraded land and soil) and 15.5 (reduce the degradation of natural habitats) are the key targets for the ecosystem conservation and management in the network. ‘Freshwater’ (0.693), ‘runoff regulating’ (0.743) and ‘hydrothermal regulation’ (0.590) are in the network community to restore the ecosystems environment (target 6.6, 15.1, 15.2, 15.4, 15.5, etc.), which are also significant affect the agricultural system and human health (target 2.1, 2.3, 2.4, etc.). In addition to supporting these ecosystem targets, ‘climate regulation’ (0.697) ‘habitation’ (0.686) ‘research and education’ (0.737) and ‘infrastructure and engineering’ (0.503) are also associated to reduce the impact of natural disasters (target 13.1, 3.9, 3.d, etc.).
As for India, economic growth and employment opportunities (target 8.1, 8.4) and eradication of extreme poverty for all (target 1.1 and 1.2) are the priorities with the highest centralities in the network. ‘Freshwater’ (0.51), ‘habitation’ (0.504), and ‘runoff regulation’ (0.680) are associated to establish the sustainable agricultural system (target 2.1, 2.3, 2.4, etc.) and further promote the economic growth (target 8.1, 8.4, etc.). ‘Research and education’ (0.585), ‘infrastructure and engineering’ (0.666), ‘climate regulation’ (0.641), and ‘research and education’ (0.627) are in the network community to strengthen resilience and adaptive capacity to climate-related hazards and natural disasters (target 13.1, 3.9, 3.d, etc.).
As for Nepal, achieving the economic growth (target 8.1) has the highest centralities among the national priorities. ‘Aesthetic and recreation’ (0.252), ‘religious, spirit, culture’ (0.153) and ‘snow and ice material’ (0.100) are grouped to the tourism economy (target 8.1, 8.5, 8.9). ‘Freshwater’ (0.540), ‘runoff regulating’ (0.596), ‘clean energy’ (0.578) and ‘habitation’ (0.507) are in the network community for agricultural economic development (target 2.1, 2.3, 2.4) and eradication of extreme poverty (target 1.1 and 1.2). ‘Infrastructure and engineering’ (0.744) and ‘climate regulation’ (0.567) are communities for infrastructure (e.g., house, transportation, etc.) to strengthen the resilience and adaptive capacity (target 9.1, 4.a, 9.4). ‘Research and education’ (0.745) is associated with the other services to promote the most targets in this network.
As for Bhutan, ‘strengthen resilience and adaptive capacity’ (target 13.1), ‘build the resilience of the poor and those in vulnerable situations’ (target 1.5), ‘decouple economic growth from environmental degradation’ (target 8.4), ‘substantially reduce the number from hazardous and contamination’ (target 3.9) and ‘strengthen the capacity and management of risk’ (target 3.d) showed significant synergies characteristics. ‘Infrastructure and engineering’ (0.794) and ‘climate regulation’ (0.738) with the highest centralities to promote these priorities. In addition, ‘freshwater’ (0.666), ‘runoff regulating’ (0.690) and ‘habitation’ (0.603) are associated to the support of the agricultural ecosystem (targets 2.1, 2.3, 2.4, 10.7).
3.3. Principal Indicators in Relation to the National SDG Priorities
The key targets with the centralities (Table S1) in Afghanistan (27), China (35), Bhutan (27), Pakistan (26), Nepal (28), and India (26) represent their dependency on the cryosphere services to advance the national SDG priorities. By considering the centralities and comprehensive score of PCA (Table S2), the principal indicators of cryosphere services to implement the national pathways in SEPs are shown in Figure 4 for all H-K countries. See Table S3 for details. The specific method is detailed in Section 2.3.
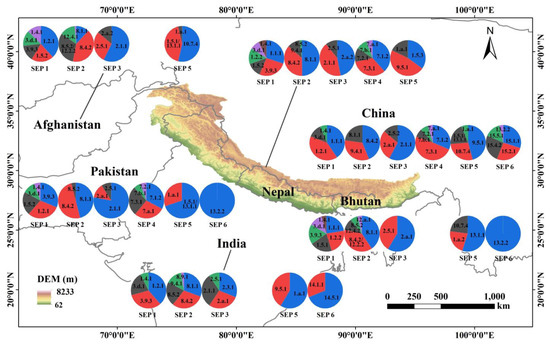
Figure 4.
The principal indicators and their weights of cryosphere services to advance the national SDG priorities on the aspect of SEPs. The pie charts for each country in order represent entry point 1 (human well-being and capabilities), entry point 2 (sustainable and just economies), entry point 3 (sustainable food systems and healthy nutrition patterns), entry point 4 (energy decarbonization and universal access to energy), entry point 5 (urban and peri-urban development) and entry point 6 (global environmental commons). The areas of each sector represent the amount of weights of each indicator in six entry points and the colors of blue, red, grey, green, purple, brown represent the order in the amount of weight, i.e., the first, second, third, fourth, fifth, and sixth. The indicators with the same series (UN, 2020) are merged, such as 1.5.1 and 13.1.1, 8.4.2 and 12.2.2.
In Afghanistan, four SEPs are involved (without entry point 4 and 6). The indicators 1.2.1 (proportion of population living below the national poverty line), 1.5.2 (direct economic loss attributed to disasters), 3.9.3 (unintentional mortality rate) and 3.d.1 (international health regulations (IHR) capacity) explain 87.28% of the pathway to strengthen the human well-being and capabilities (entry point 1). The indicators 8.1.1 (annual growth rate of real GDP per capita), 8.4.2 (domestic material consumption per GDP) and 8.5.2/12.2.2 (unemployment rate) explain 84.50% of the pathway to shift towards sustainable and just economies (entry point 2). The cumulative weight of the indicators 2.1.1 (prevalence of undernourishment) and 2.5.1 (genetic resources for food and agriculture secured) account for 86.07% of the pathway to build sustainable food systems and healthy nutrition patterns (entry point 3). The indicators 10.7.4 (proportion of the refugee population) and 1.5.1/13.1.1 (number of affected persons attributed to disasters) account for 96.21% of the pathway to promote urban and peri-urban development (entry point 5).
In Bhutan, five SEPs are involved (without entry point 4). The indicators 1.1.1 (proportion of population living below the international poverty line), 1.2.2 (proportion of all ages living in national poverty in all its dimensions), 1.5.1 (number of affected persons attributed to disasters) and 3.9.3 (unintentional mortality rate) explain 83.35% of the pathway to strengthen the human well-being and capabilities (entry point 1). The indicators 8.1.1 (annual growth rate of real GDP per capita), 8.4.2/12.2.2 (domestic material consumption per GDP) and 12.4.2 (hazardous waste generated per capita) explain 89.08% of the pathway to shift towards sustainable and just economies (entry point 2). The cumulative weight of the indicators 2.a.1 (the agriculture orientation index for government expenditures) and 2.5.1 (genetic resources for food and agriculture secured) account for 86.07% of the pathway to build sustainable food systems and healthy nutrition patterns (entry point 3). The indicators 13.1.1 (number of affected persons attributed to disasters), 1.a.2 (proportion of total government spending on essential services) and 10.7.4 (proportion of the refugee population) explain 96.21% of the pathway to promote urban and peri-urban development (entry point 5). The indicator 13.2.2 (total greenhouse gas emissions per year) is the unique indicator of the pathway to secure the global environmental commons (entry point 6).
In Pakistan, all SEPs are involved. The indicators 3.9.3 (unintentional mortality rate), 1.2.1 (proportion of population living below the national poverty line) and 1.5.2 (direct economic loss attributed to disasters) account for 82.7% of the pathway to strengthen the human well-being and capabilities (entry point 1). The indicators 8.1.1 (annual growth rate of real GDP per capita) and 8.4.2 (domestic material consumption per GDP) explain 95.86% of the pathway to shift towards sustainable and just economies (entry point 2). The indicators 2.1.1 (prevalence of undernourishment) and 2.a.1 (the agriculture orientation index for government expenditures) account for 86.07% of the pathway to build sustainable food systems and healthy nutrition patterns (entry point 3). The indicators 7.1.2 (proportion of population with primary reliance on clean fuels and technology), 7.a.1 (international financial to support of clean energy research and production) and 7.3.1 (energy intensity measured in terms of primary energy and GDP) explain 87.93% of the pathway to the energy decarbonization and universal access to energy (entry point 4). The cumulative weight of the indicators 1.5.1/13.1.1 (number of affected persons attributed to disasters) and 1.a.1 (total official development assistance) account for 96.21% of the pathway to promote urban and peri-urban development (entry point 5). The indicator 13.2.2 (total greenhouse gas emissions per year) is the unique indicator of services to secure the global environmental commons (entry point 6).
In China, six SEPs are involved. The indicators 1.2.1 (proportion of population living below the national poverty line) and 1.1.1 (proportion of population living below the international poverty line) explain 80.84% of the pathway to strengthen human well-being and capabilities (entry point 1). The indicators 8.4.2 (domestic material consumption per GDP), 9.4.1 (CO2 emission per unit of value added) and 8.1.1 (annual growth rate of real GDP per capita) consist of the minimize indicator subsets of services to shift towards sustainable and just economies (entry point 2). The cumulative weight of the indicators 2.1.1 (prevalence of undernourishment) and 2.a.1 (the agriculture orientation index for government expenditures) account for 86.30% of the pathway to build food systems and healthy nutrition patterns (entry point 3). The indicators 7.1.2 (proportion of population with primary reliance on clean fuels and technology) and 7.3.1 (energy intensity measured in terms of primary energy and GDP) explain 80.61% of the pathway to the energy decarbonization and universal access to energy (entry point 4). The indicators 9.5.1 (research and development expenditure as a proportion of GDP), 10.7.4 (proportion of the refugee population) and 1.5.1/13.1.1 (number of affected persons attributed to disasters) account for 93.68% of the pathway to promote urban and peri-urban development (entry point 5). The indicators 15.1.1 (forest area as a proportion of total land area), 15.2.1 (progress towards sustainable forest management) and 15.4.2 (mountain green cover index) explain 81.44% of the pathway to secure global environmental commons (entry point 6).
In India, five SEPs are involved (without entry point 4). The indicators 1.2.1 (proportion of population living below the national poverty line), 3.9.3 (unintentional mortality rate) and 3.d.1 (International Health Regulations (IHR) capacity and health emergency preparedness) explain 92.37% of the pathway to strengthen the human well-being and capabilities (entry point 1). The indicators 8.1.1 (annual growth rate of real GDP per capita), 8.4.2 (domestic material consumption per GDP) and 8.5.2 (unemployment rate) explain 82.68% of the pathway to shift towards sustainable and just economies (entry point 2). The cumulative weight of the indicators 2.3.1 (volume of production per labor unit), 2.a.1 (the agriculture orientation index for government expenditures) and 2.1.1 (prevalence of undernourishment) explain 90.33% of the pathway to build food systems and healthy nutrition patterns (entry point 3). The indicators 1.a.1 (total official development assistance) and 9.5.1 (research and development expenditure as a proportion of GDP) constitute the minimize indicator subsets of the pathway to promote urban and peri-urban development (entry point 5). Marine conservation (SDG 14) is the priority of the global environment commons in India. The indicators 14.5.1 (coverage of protected areas in relation to marine areas) and 14.1.1 (index of coastal eutrophication and plastic debris density) constitute the minimize indicator subsets of the pathway to secure global environmental commons (entry point 6).
In Nepal, five entry points are involved (without entry point 6). The indicators 1.1.1 (proportion of population living below the international poverty line), 3.9.3 (unintentional mortality rate), 1.5.2 (direct economic loss attributed to disasters) and 1.2.2 (proportion of all ages living in national poverty in all its dimensions) explain 83.96% of the pathway to strengthen the human well-being and capabilities (entry point 1). The cumulative weight of indicators 8.1.1 (annual growth rate of real GDP per capita), 8.4.2 (domestic material consumption per GDP) and 9.4.1 (CO2 emission per unit of value added) account for 97.85% of the pathway to shift towards sustainable and just economies (entry point 2). The indicators 2.a.1 (the agriculture orientation index for government expenditures) and 2.1.1 (prevalence of undernourishment) explain 89.14% of the pathway to build food systems and healthy nutrition patterns (entry point 3). The indicators 7.1.2 (proportion of population with primary reliance on clean fuels and technology), 7.3.1 (energy intensity measured in terms of primary energy and GDP) and 7.2.1 (renewable energy share in the total final energy consumption) explain 84.30% of the pathway to the energy decarbonization and universal access to energy (entry point 4). The cumulative weight of indicators 1.5.3 (number of countries that adopt and implement national disaster risk reduction strategies) and 9.5.1 (research and development expenditure as a proportion of GDP) account for 82.09% of the pathway to promote urban and peri-urban development (entry point 5).
4. Discussions
Enabling policies and sustainable solutions have to be developed in alignment with the national circumstance [14]. Commitment to poverty alleviation remains the greatest challenge of global sustainable development [11]. The Human Development Index (HDI) in H-K is significantly lower than the global average [38]. SDG 1 (i.e., no poverty), SDG 2 (i.e., end hungry), SDG 3 (i.e., good health and well-being), SDG 8 (i.e., decent work and economic growth) and SDG 9 (i.e., infrastructure), as the unfinished Millennium Development Goals (MDGs), are continues of the priorities to eliminate multi-dimension poverty [39]. Moreover, all these SDG priorities are more commonly associated with another [40]. Low income, food shortage, low levels of education, lack of water sanitation and energy supplies, unemployment, and other deprivations have a mutually reinforcing effect and impact on human well-being [25]. The success to tackle one issue would have to involve others that are interlinked [41]. The attainment of the national SDGs will significantly depend on whether the identified synergies among the goals can be leveraged [42,43].
4.1. Concerns of Cryosphere Service Change Effects on National SDG Priorities
Generally, warming climate, extended drought and rapid population growth are three main threats faced in developing countries [44]. The cryosphere is sensitive to climate change with warming occurring at a rate twice the global average [45,46]. There is high confidence that the cryosphere will decrease over the coming decades in H-K [10]. Climate change may profoundly reshape this process [47,48]. The dependence of cryosphere services to advance the national SDG priorities are compared between different countries with the normalization of the centralities as shown in Figure 5. ‘Freshwater’, ‘clean energy’, ‘runoff regulation’, ‘climate regulation’, ‘research and education’ and ‘infrastructure and engineering’ play vital roles to promote the national SDG priorities in H-K countries.

Figure 5.
The dependence on the cryosphere services to advance the national SDG priorities in H-K countries.
H-K is vulnerable to food insecurity considering the relevant countries normally with a high poverty rate [10]. An increase in agriculture development is efficient to end hunger (SDG 2) and improve healthy nutrition patterns (SDG 3), and eliminate multi-dimensional poverty (SDG 1). The meltwater associated with ‘runoff regulation’ critically affects the prevailing agriculture and sustainable food systems, especially in the dry season [8,9]. The meltwater accounts for 40 percent of the river’s flow and plays a vital role in socio-economic development (e.g., Pakistan, Afghanistan) [10]. The changes in cryosphere would harness the impact on meltwater supply paralleled with the declining ability to serve the demand of societies, which would increase the risks faced in high mountains [49,50,51]. Seasonal changes mismatch with the supply will significantly affect the water efficiency and exacerbate the risks of water resources dispatch [6]. ‘Runoff regulation’ is significant to the regional water regulation (e.g., India, Bhutan, Nepal). In addition, the ‘freshwater’, ‘runoff regulation’ associated with the ‘hydrothermal regulation’ and ‘habitation’ are essential to the biodiversity protection. However, the environment targets with lower centralities reflect the fragile ecosystem have not received enough attention in most countries (e.g., Afghanistan, Pakistan, India, Nepal, Bhutan).
The adverse impacts of climate change could be considerable in the H-K mountains [10]. The food supply system, economic and trade chains, tourism, and industries in H-K are vulnerable to climate change and natural disasters [11]. Meanwhile, the climate adaptation capacity and resilience of the poor are relatively low [10]. ‘Research and education’, ‘infrastructure and engineering’ and ‘climate regulation’ are engaged in the resilience and adaptive capacity to the climate-related hazards and natural disasters. Especially the ‘infrastructure and engineering’ with the highest centralities are vital to the water supply fluctuations and variability (e.g., India, Pakistan, Nepal, Bhutan). ‘Research and education’ are associated with other services to improve the awareness of disaster prevention and thus reduce the impact of natural disasters. In addition, hydropower remains the driver of the economy with enormous potential to the national priorities in H-K (e.g., Nepal, Bhutan, India, Pakistan) [52,53], which heavily relies on the large infrastructure constructure (e.g., reservoirs, dams) in mountains [54]. The ‘clean energy’, ‘infrastructure and engineering’ and ‘freshwater’ are communities to universal access to freshwater (SDG 6) and clean energy (SDG 7), and further increase water efficiency (SDG 6) to promote employment and economic development (SDG 8, 9).
Although ‘ice and snow material’, ‘aesthetic and recreation’, and ‘religious, spiritual, culture’ with the lower centralities, the combination of these services has a stable community to serve the specific targets (e.g., Afghanistan, Pakistan, China, India, Nepal, Bhutan). The spectacular cryospheric scenery [55] and religious heritages (e.g., Hindu and Buddhist, etc.) in H-K countries (e.g., India, Nepal, Bhutan, China) have the tremendous potential to promote sustainable tourism (target 8.9) and ‘create employment opportunities’ (target 8.5) to meet the sustain economic growth (target 8.1), which also contribute to ‘protect the cultural and natural heritage’ (target 11.4) and ‘sustainable management and efficient use of natural resources’ (target 12.2). We emphasize that the stability of domestic political and social systems is the prerequisite for cultural services to promote the national SDG priorities (e.g., Afghanistan, Pakistan).
4.2. Multi-Dimensional Implementation Pathways to Meet SDGs
Monitoring and evaluation of progress towards SDGs remains a vital priority [22]. From the indicators perspective, the pathway of cryosphere services to strengthen human wellbeing and capabilities (entry point 1) includes two aspects: one is engaging livelihood to eliminate poverty (i.e., indicator 1.1.1, 1.2.1, etc.); the other is improving the capabilities to resist the disasters under climate change (i.e., indicator 3.9.3, 3.d.1, 1.5.1/1.5.2, etc.). The specific concepts of welfare, such as human wellbeing function (HWF) [56] and sustainable wellbeing index (SWI) [57], are comprehensive measurements to the entry point 1. The pathway of cryosphere services to shift towards sustainable and just economies (entry point 2) has scaled up its nationally determined contributions (i.e., indicator 8.1.1, 8.5.2/12.2.2, etc.) and carbon neutrality (i.e., indicator 8.4.2, 9.4.1, etc.). Net output considering environmental damages [58,59,60] is helpful to match the sustainable economy. The pathway of cryosphere services to build food systems and healthy nutrition patterns (entry point 3) aims to end hunger and undernourishment (i.e., indicator 2.1.1, 2.3.1, 2.a.1). The agriculture yields rely on the meltwater and other services are directly reduce hunger and malnutrition for mountain people [9,50]. The pathway of cryosphere services to the energy decarbonization and universal access to energy (entry point 4) are mainly concentrated on energy supply (i.e., indicator 7.1.2, 7.2.1, 7.3.1) and technology capacity (i.e., indicator 7.a.1, 7.b.1). The hydropower potentials converse into generating capacity affects the energy supply in H-K to a certain extent [7,53]. The pathways of cryosphere services to promote urban and peri-urban development (entry point 5) are prone to the essential services (i.e., indicator 1.a.1, 1.a.2, 9.5.1) and disasters risk reduction (i.e., indicator 10.7.4, 1.5.1/13.1.1, 1.5.3). Multiple cryosphere services to the essential needs are the nature-based solution to enhance the ability to resist risks of climate change [10]. The pathway of cryosphere services to secure global environmental commons (entry point 6) are concentrated on the biodiversity conservation (i.e., indicator 15.1.1, 15.2.1, 15.4.2, 15.5.1) (e.g., China) and marine protection (i.e., the indicator 14.1.1, 14.5.1) (e.g., India). Notwithstanding that biodiversity contributes to the fulfillment of most SDG targets [61], the principal indicators are more inclined to economy development. Total greenhouse gas emissions (indicator 13.2.2) is an important complement in this path (e.g., Bhutan, Pakistan).
5. Conclusions
The national SDG priorities reflect the most urgent needs of sustainable development in H-K countries. ‘No poverty’ (SDG 1), ‘zero hunger’ (SDG 2), ‘good health and well-being’ (SDG 3) and ‘work and economic’ (SDG 8) are mostly relevant in H-K. ‘Partnership for the goals’ (SDG 17) can take an important role in coordinating governance, financing, individual and collective actions, science and technology, to eliminate the multidimensional poverty (SDG 1, 2, 3, 8) and achieve equality (SDG 5, 10).
Cryosphere services demonstrate significance to advance the national SDG priorities. As illustrated by the SNA for the roles of cryosphere services, ‘climate regulation’, ‘research and education’, ‘runoff regulation’, ‘freshwater’ and ‘infrastructure and engineering’ with the highest centralities to promote the national SDG priorities in H-K. Specifically, ‘runoff regulation’, ‘climate regulation’, ‘freshwater’, and ‘infrastructure and engineering’ are priorities to the sustainable agriculture (SDG 2) and economic development (SDG 8, 12) (e.g., Afghanistan, Pakistan, China, India, Nepal, Bhutan), which are also efficient to the climate action (SDG 13) and ecosystem conservation (SDG 15) (e.g., China). ‘Research and education’, ‘infrastructure and engineering’ and ‘climate regulation’ are engaged in the resilience and adaptive capacity to the climate-related hazards and natural disasters for all the H-K countries.
The principal indicators in association with the SDG priorities and key targets constitute the implementation pathway of cryosphere services to the national SDG priorities. The principal indicators identified with the comprehensive score of PCA multiplied by the centralities in the network with an explanation rate of more than 85% in Afghanistan (11), Pakistan (13), India (13), China (15), Nepal (14), and Bhutan (12). The dependency of SEPs on cryosphere services to advance the national SDG priorities through a set of principal indicators in alignment with SEPs, including human wellbeing and capabilities (indicator 1.1.1, 1.2.1, 1.5.2, 3.9.3, etc.); sustainable and just economies (indicator 8.1.1, 8.5.2/12.2.2, 8.4.2, 9.4.1, etc.); food systems and healthy nutrition patterns (indicator 2.1.1, 2.3.1, 2.a.1, 2.5.1, etc.); energy decarbonization and universal access to energy (indicator 7.1.2, 7.3.1, 7.a.1, etc.); urban and peri-urban development (indicator 10.7.4, 1.5.1/13.1.1, 1.5.3, 9.5.1, etc.); and global environmental commons (indicator 13.2.2, 15.1.1, 15.2.1, 14.1.1, etc.).
Supplementary Materials
The following supporting information can be downloaded at: https://www.mdpi.com/article/10.3390/su14052532/s1, Figure S1: The synergies among targets related to cryosphere services in H-K countries. Table S1: The key targets (centralities) related to cryosphere services in H-K countries; Table S2: The indicators (PCA weight) of cryosphere service in achieving the national SDG priorities in SEPs. Table S3: The principal indicators of cryosphere service to promote the national priorities SDGs in SEPs.
Author Contributions
Funding acquisition, W.Z. (Wei Zhang, zhangw06@lzb.ac.cn); writing—original draft, J.Z., W.Z. (Wei Zhang, zhangwei2015@lzb.ac.cn); writing—review and editing, J.Z., W.Z. (Wei Zhang, zhangwei2015@lzb.ac.cn), S.L., W.K. and W.Z. (Wei Zhang, zhangw06@lzb.ac.cn). All authors have read and agreed to the published version of the manuscript.
Funding
This research was funded by the Second Tibetan Plateau Scientific Expedition and Research Program (STEP), grant number 2019QZKK0208; Strategic Priority Research Program of Chinese Academy of Sciences, grant number XDA20100305; and the National Science Foundation of China, grant number 41971083.
Institutional Review Board Statement
Not applicable.
Informed Consent Statement
Not applicable.
Data Availability Statement
The data presented in this study are available at the Supplementary Materials.
Acknowledgments
The completion of this article benefited from the efforts of all authors. Support was obtained from other researchers who provided valuable insights into the link between cryosphere services and SDGs; we express our sincere gratitude to them.
Conflicts of Interest
The authors declare that they have no conflict of interest.
References
- Xiao, C.; Wang, S.; Qin, D. A preliminary study on cryosphere service function and its value estimation. Clim. Change Res. 2016, 12, 45–52. [Google Scholar]
- Wang, X.; Liu, S.; Zhang, J. A new look at roles of the cryosphere in sustainable development. Adv. Clim. Change Res. 2019, 10, 124–131. [Google Scholar] [CrossRef]
- RGI Consortium. Randolph glacier inventory-A dataset of global glacier Outlines: Version 6.0: Technical report. In Global Land Ice Measurements from Space; Digital Media: Boulder, CO, USA, 2017. [Google Scholar] [CrossRef]
- Pfeffer, W.; Arendt, A.; Bliss, A.; Bolch, T.; Cogley, J.; Gardner, A.; Hagen, J.; Hock, R.; Kaser, G.; Kienholz, C.; et al. The Randolph Glacier Inventory: A globally complete inventory of glaciers. J. Glaciol. 2014, 60, 537–552. [Google Scholar] [CrossRef] [Green Version]
- Viviroli, D.; Kummu, M.; Meybeck, M.; Kallio, M.; Wada, Y. Increasing dependence of lowland populations on mountain water resources. Nat. Sustain. 2020, 3, 917–928. [Google Scholar] [CrossRef]
- Immerzeel, W.; Lutz, A.; Andrade, M.; Bahl, A.; Biemans, H.; Bolch, T.; Hyde, S.; Brumby, S.; Davies, B.; Elmore, A. Importance and vulnerability of the world’s water towers. Nature 2020, 577, 364–369. [Google Scholar] [CrossRef]
- Nie, Y.; Pritchard, H.; Liu, Q.; Hennig, T.; Wang, W.; Wang, X.; Liu, S.; Nepal, S.; Samyn, D.; Hewitt, K. Glacial change and hydrological implications in the Himalaya and Karakoram. Nat. Rev. Earth Environ. 2021, 2, 91–106. [Google Scholar] [CrossRef]
- Biemans, H.; Siderius, C.; Lutz, A.; Nepal, S.; Ahmad, B.; Hassan, T.; VonBloh, W.; Wijngaard, R.; Wester, P.; Shrestha, A.; et al. Importance of snow and glacier meltwater for agriculture on the Indo–Gangetic plain. Nat. Sustain. 2019, 2, 594–601. [Google Scholar] [CrossRef]
- Pritchard, H. Asia’s shrinking glaciers protect large populations from drought stress. Nature 2019, 569, 649–654. [Google Scholar] [CrossRef]
- Wester, P.; Mishra, A.; Mukherji, A.; Shrestha, A. (Eds.) International Centre for Integrated Mountain Development (ICIMOD). In The Hindu Kush Himalaya Assessment: Mountains, Climate Change, Sustainability and People; Springer Nature Switzerland AG: Cham, Switzerland, 2019. [Google Scholar]
- United Nations. Sustainable Development Goals Report 2021; United Nations: New York, NY, USA, 2021. [Google Scholar]
- Barbier, E.; Burgess, J. Sustainability and development after COVID-19. World Dev. 2020, 135, 105082. [Google Scholar] [CrossRef]
- Ibn-Mohammed, T.; Mustapha, K.; Godsell, J.; Adamu, Z.; Babatunde, K.; Akintade, D.; Acquaye, A.; Fujii, H.; Ndiaye, M.; Yamoah, F. A critical analysis of the impacts of COVID-19 on the global economy and ecosystems and opportunities for circular economy strategies. Resour. Conserv. Recycl. 2021, 164, 105169. [Google Scholar] [CrossRef]
- United Nations. Department of economic and social affairs. In Synthesis of Voluntary National Reviews 2021; United Nations: New York, NY, USA, 2021. [Google Scholar]
- United Nations. Department of economic and social affairs. In Synthesis of Voluntary National Reviews 2016; United Nations: New York, NY, USA, 2016. [Google Scholar]
- Wang, X.; Zhang, J.; Liu, S.; Li, C.; Kong, W. Socio-economic significance of Asian water tower in high Asia region. Bull. Chin. Acad. Sci. 2019, 34, 1332–1340. [Google Scholar]
- Zhang, J.; Zhang, W.; Liu, S.; Kong, W. Cryosphere Services to Support SDGs in High Mountains. Sustainability 2022, 14, 791. [Google Scholar] [CrossRef]
- Su, B.; Xiao, C.; Chen, D.; Qin, D.; Ding, Y. Cryosphere services and human well-being. Sustainability 2019, 11, 4365. [Google Scholar] [CrossRef] [Green Version]
- Griggs, D.; Nilsson, M.; Stevance, A.; McCollum, D. International Council for Science (ICSU): A Guide to SDG Interactions: From Science to Implementation; International Council for Science: Paris, France, 2017. [Google Scholar]
- Pedercini, M.; Arquitt, S.; Collste, D.; Herren, H. Harvesting synergy from sustainable development goal interactions. Proc. Natl. Acad. Sci. USA 2019, 116, 23021–23028. [Google Scholar] [CrossRef] [Green Version]
- Dawes, J. SDG interlinkage networks: Analysis, robustness, sensitivities, and hierarchies. World Dev. 2022, 149, 105693. [Google Scholar] [CrossRef]
- United Nations. Economic and social council. Progress towards the sustainable development goals report of the secretary-general 2021. In High-Level Political Forum on Sustainable Development, Convened Under the Auspices of the Economic and Social Council; United Nations: New York, NY, USA, 2021; Available online: https://unstats.un.org/sdgs/files/report/2021/secretary-general-sdg-report-2021--EN.pdf (accessed on 23 January 2022).
- United Nations. Inter-agency and expert group on SDG indicators (IAEG-SDGs). Tier classification for global SDGs indicators 2017. In Working Group on Interlinkages of SDG Statistics to Allow for Integrated Analyses in the Monitoring; United Nations: New York, NY, USA, 2017; Available online: https://unstats.un.org/sdgs/files/Working-Group-ToR--Interlinkages.pdf (accessed on 23 January 2022).
- United Nations. Inter-agency and expert group on SDG indicators (IAEG-SDGs). Tier classification for global SDGs indicators 2021. In Working Group on Interlinkages of SDG Statistics to Allow for Integrated Analyses in the Monitoring; United Nations: New York, NY, USA, 2021; Available online: https://unstats.un.org/sdgs/iaeg-sdgs/tier-classification/ (accessed on 23 January 2022).
- United Nations. Independent Group of Scientists appointed by the Secretary-General. In Global Sustainable Development Report 2019: The Future is Now—Science for Achieving Sustainable Development; United Nations: New York, NY, USA, 2019. [Google Scholar]
- Bolch, T.; Kulkarni, A.; Kääb, A.; Huggel, C.; Paul, F.; Gogley, J.G.; Frey, H.; Kargel, J.S.; Fujita, K.; Scheel, M. The state and fate of Himalayan glaciers. Science 2012, 336, 310–314. [Google Scholar] [CrossRef] [Green Version]
- Zhou, X.; Moinuddin, M. (Eds.) Sustainable development goals interlinkages and network analysis: A practical tool for SDG integration and policy coherence. In Institute for Global Environmental Strategies (IGES) Research Report; Institute for Global Environmental Strategies: Hayama, Japan, 2017. [Google Scholar]
- Blanc, D.L. Towards integration at last? The sustainable development goals as a network of targets. Sustain. Dev. 2015, 23, 176–187. [Google Scholar] [CrossRef]
- Liu, J.; Hull, V.; Godfray, H.C.J.; Tilman, D.; Gleick, P.; Hoff, H.; Wostl, C.P.; Xu, Z.; Chung, M.; Sun, J. Nexus approaches to global sustainable development. Nat. Sustain. 2018, 1, 466–476. [Google Scholar] [CrossRef]
- Newman, M. Modularity and community structure in networks. Proc. Natl. Acad. Sci. USA 2006, 103, 8577–8582. [Google Scholar] [CrossRef] [Green Version]
- Newman, M.E.J. Networks: An Introduction; Oxford University Press: New York, NY, USA, 2010. [Google Scholar] [CrossRef] [Green Version]
- Bonacich, P.F. Factoring and Weighting Approaches to Status Scores and Clique Identification. J. Math. Sociol. 1972, 2, 113–120. [Google Scholar] [CrossRef]
- Radicchi, F.; Fortunato, S.; Castellano, C. Universality of citation distributions: Towards an objective measure of scientific impact. Proc. Natl. Acad. Sci. USA 2008, 105, 17268–17272. [Google Scholar] [CrossRef] [PubMed] [Green Version]
- David, M. Hierarchical modularity in human brain functional networks. Front. Neuroinform. 2010, 3, 37. [Google Scholar]
- Pearson, K. On Lines and Planes of Closest Fit to Systems of Points in Space. Philos. Mag. 1901, 2, 559–572. [Google Scholar] [CrossRef] [Green Version]
- Hotelling, H. Analysis of a complex of statistical variables into principal components. J. Educ. Psychol. 1933, 24, 417. [Google Scholar] [CrossRef]
- Abdi, H.; Williams, L.J. Principal component analysis. In Wiley Interdisciplinary Reviews: Computational Statistics; John Wiley & Sons, Inc.: Hoboken, NJ, USA, 2010. [Google Scholar]
- United Nations. Human Development Index (HDI); United Nations: New York, NY, USA, 2020. [Google Scholar]
- Chambers, R. Poverty Research: Methodologies, Mindsets and Multidimensionality; IDS Working Paper 293; Institute of Development Studies (IDS), University of Sussex: Brighton, UK, 2007. [Google Scholar]
- Fonseca, L.; Domingues, J.; Dima, A. Mapping the Sustainable Development Goals Relationships. Sustainability 2020, 12, 3359. [Google Scholar] [CrossRef] [Green Version]
- United Nations. The Sustainable Development Goals Report 2018; United Nations: New York, NY, USA, 2018. [Google Scholar]
- Nilsson, M.; Griggs, D.; Visbeck, M. Map the interactions between sustainable development goals. Nature 2016, 534, 320–322. [Google Scholar] [CrossRef] [PubMed]
- Pradhan, P.; Costa, L.; Rybski, D.; Lucht, W.; Kropp, J. A systematic study of sustainable development goal (SDG) Interactions. Earths Future 2017, 5, 1169–1179. [Google Scholar] [CrossRef] [Green Version]
- Huang, J.; Yu, H.; Guan, X.; Wang, G.; Guo, R. Accelerated dryland expansion under climate change. Nat. Clim. Change 2016, 6, 166–171. [Google Scholar] [CrossRef]
- IPCC. Climate Change 2014: Impacts, Adaptation, and Vulnerability. Part A: Global and Sectoral Aspects, Contribution of Working Group II to the Fifth Assessment Report of the Intergovernmental Panel on Climate Change (IPCC); Cambridge University Press: Cambridge, UK, 2014. [Google Scholar]
- IPCC. IPCC Special Report on the Ocean and Cryosphere in a Changing Climate (SROCC); Cambridge University Press: Cambridge, UK, 2019. [Google Scholar]
- Kraaijenbrink, P.; Bierkens, M.; Lutz, A.; Immerzeel, W. Impact of a global temperature rise of 1.5 degrees Celsius on Asia’s glaciers. Nature 2017, 549, 257–260. [Google Scholar] [CrossRef] [PubMed]
- IPCC. Special Report on Global Warming of 1.5 °C; Cambridge University Press: Cambridge, UK, 2018. [Google Scholar]
- Huss, M.; Hock, R. Global-scale hydrological response to future glacier mass loss. Nat. Clim. Change 2018, 8, 135–140. [Google Scholar] [CrossRef] [Green Version]
- Rodell, M.; Famiglietti, J.S.; Wiese, D.N.; Reager, J.T.; Beaudoing, H.K.; Landerer, F.W.; Lo, M.H. Emerging trends in global freshwater availability. Nature 2018, 557, 651–659. [Google Scholar] [CrossRef] [PubMed]
- Su, B.; Xiao, C.; Chen, D.; Ying, X.; Huang, Y.; Guo, R.; Zhao, H.; Chen, A.; Che, Y. Mismatch between the population and meltwater changes creates opportunities and risks for global glacier-fed basins. Sci. Bull. 2021, 67, 9–12. [Google Scholar] [CrossRef]
- Gernaat, D.E.H.J.; Bogaart, P.W.; Vuuren, D.P.V.; Biemans, H.; Niessink, R. High-resolution assessment of global technical and economic hydropower potential. Nat. Energy 2017, 2, 821–828. [Google Scholar] [CrossRef]
- Farinotti, D.; Round, V.; Huss, M.; Compagno, L.; Zekollari, H. Large hydropower and water-storage potential in future glacier-free basins. Nature 2019, 575, 341–344. [Google Scholar] [CrossRef] [PubMed] [Green Version]
- Zarfl, C.; Lumsdon, A.E.; Berlekamp, J.; Tydecks, L.; Tockner, K. A global boom in hydropower dam construction. Aquat. Sci. 2015, 77, 161–170. [Google Scholar] [CrossRef]
- Nuesser, M. Socio-hydrology: A new perspective on mountain waterscapes at the nexus of natural and social processes. Mt. Res. Dev. 2017, 37, 518–520. [Google Scholar] [CrossRef]
- Nordhaus, W.; Sztorc, P. DICE 2013R: Introduction and User’s Manual, 2nd ed. October 2013. Available online: https://www.climateissues.org/news-details/dice-2013r-introduction-and-user-s-manual (accessed on 21 February 2022).
- Costanza, R.; Daly, L.; Fioramonti, L.; Giovannini, E.; Kubiszewski, I.; Mortensen, L.F.; Pickett, K.E.; Ragnarsdottir, V.; Vogli, R.D.; Wilkinson, R. Modelling and measuring sustainable well-being in connection with the UN Sustainable Development Goals. Ecol. Econ. 2016, 130, 350–355. [Google Scholar] [CrossRef]
- Nordhaus, W. Estimates of the Social Cost of Carbon: Concepts and Results from the DICE-2013R Model and Alternative Approaches. J. Assoc. Environ. Reso. 2014, 1, 273–312. [Google Scholar]
- Nordhaus, W. Revisiting the social cost of carbon. Proc. Natl. Acad. Sci. USA 2017, 114, 1518–1523. [Google Scholar] [CrossRef] [PubMed] [Green Version]
- Nordhaus, W. Economics of the disintegration of the Greenland ice sheet. Proc. Natl. Acad. Sci. USA 2019, 116, 12261–12269. [Google Scholar] [CrossRef] [Green Version]
- Blicharska, M.; Smithers, R.J.; Mikusiński, G.; Rönnbäck, K.; Harrison, P.; Nilsson, M.; Stutherland, W. Biodiversity’s contributions to sustainable development. Nat. Sustain. 2019, 2, 1083–1093. [Google Scholar] [CrossRef]
Publisher’s Note: MDPI stays neutral with regard to jurisdictional claims in published maps and institutional affiliations. |
© 2022 by the authors. Licensee MDPI, Basel, Switzerland. This article is an open access article distributed under the terms and conditions of the Creative Commons Attribution (CC BY) license (https://creativecommons.org/licenses/by/4.0/).