
Exploring the Influence of Culture in the Present and Future of Multicultural Organizations: Comparing the Case of Spain and Latin America


Abstract
:1. Introduction
Literature Review
- (1)
- Power Distance (PD): this shows how accepted hierarchies are in a society. In a project management example, it could be considered as the authority exercised by the project manager to their team.
- (2)
- Individualism-Collectivism (ID): this represents preferences based on concern for oneself and one’s relatives or for a broader group of people. Individualism in a project team is the preference for individual and self-organized work.
- (3)
- Masculinity-Feminity (MA): this measures the inclination to compete or to co-operate. In project management, it could be seen as the pursuit of goal accomplishment versus team welfare.
- (4)
- Uncertainty Avoidance (UA): this expresses discomfort in the presence of uncertainty. In professional environments, it is usually shown through strict codes of conduct and excessive bureaucracy.
- (5)
- Long-Term Orientation (LT): this demonstrates a preference for long-term planning. It is especially useful for the strategic vision of projects in an organization.
- (6)
- Indulgence-Restraint (IN): this refers to the freedom to express feelings and enjoy life. In a project, it would have a strong relationship with team management: the communication, trust, and good relationships that are built between team members.
2. Methodology
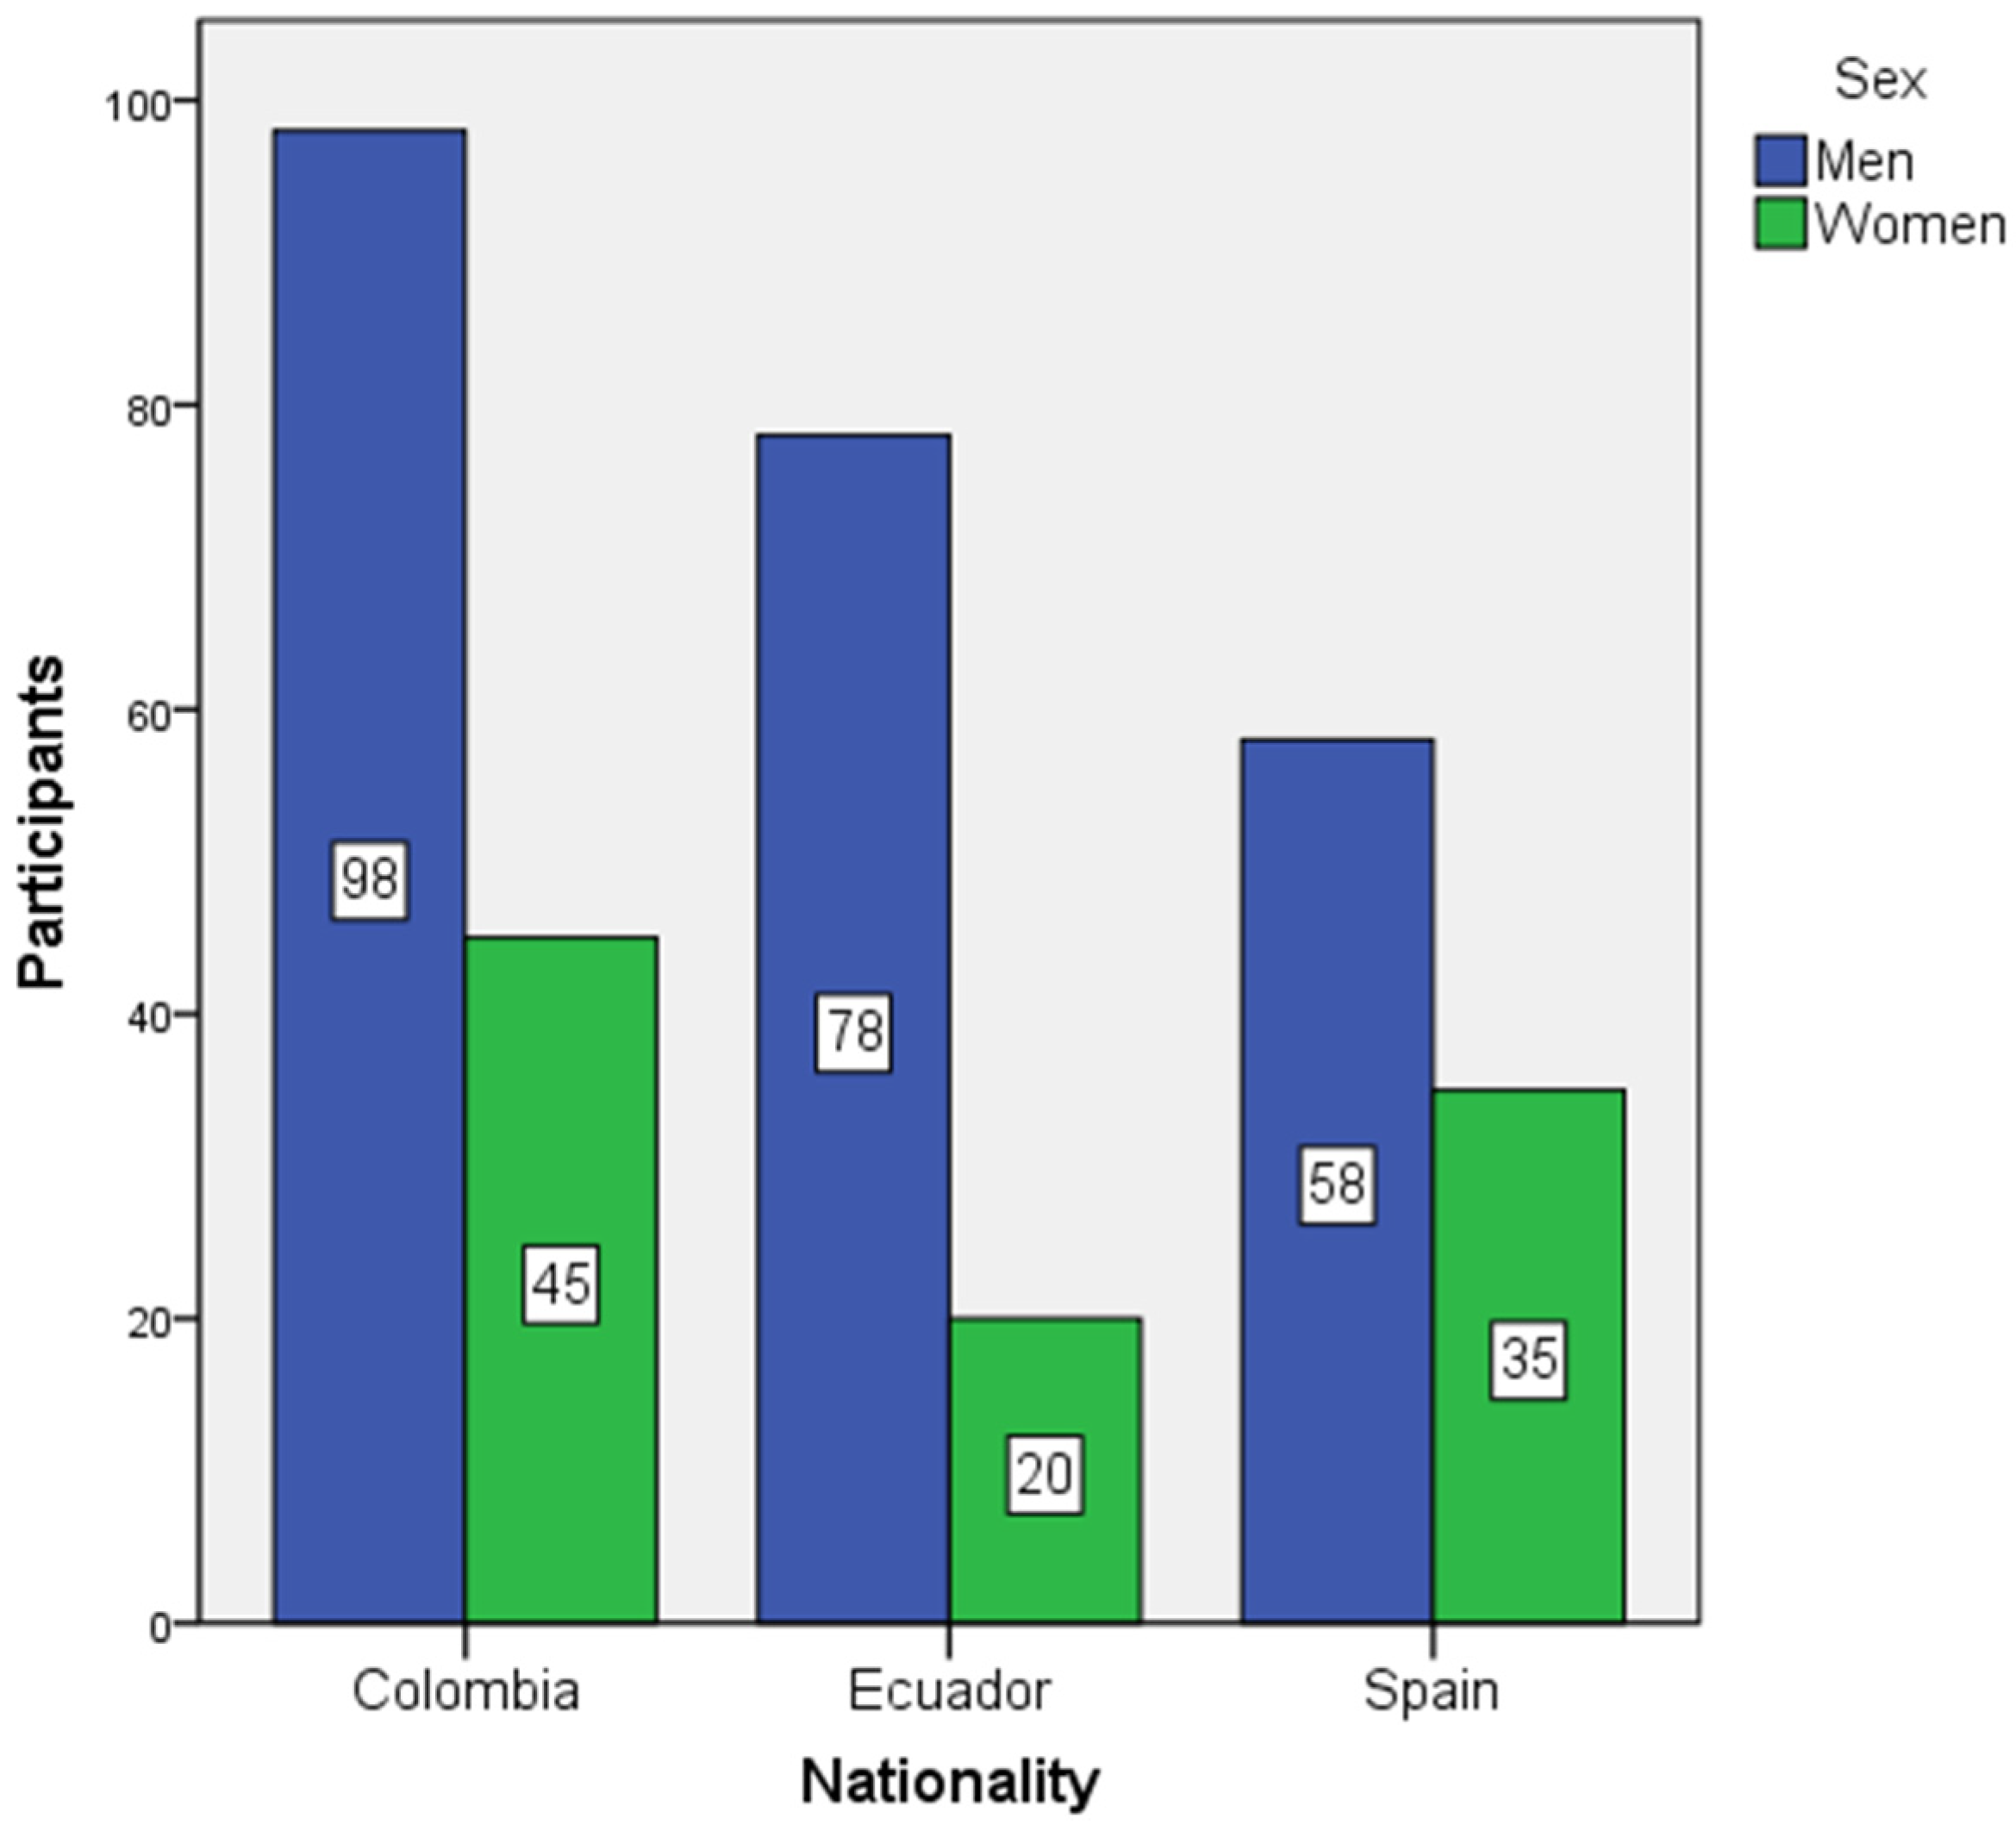
2.1. Sample Features
2.2. Validity of the Survey
2.3. Data Analysis
3. Results and Discussion
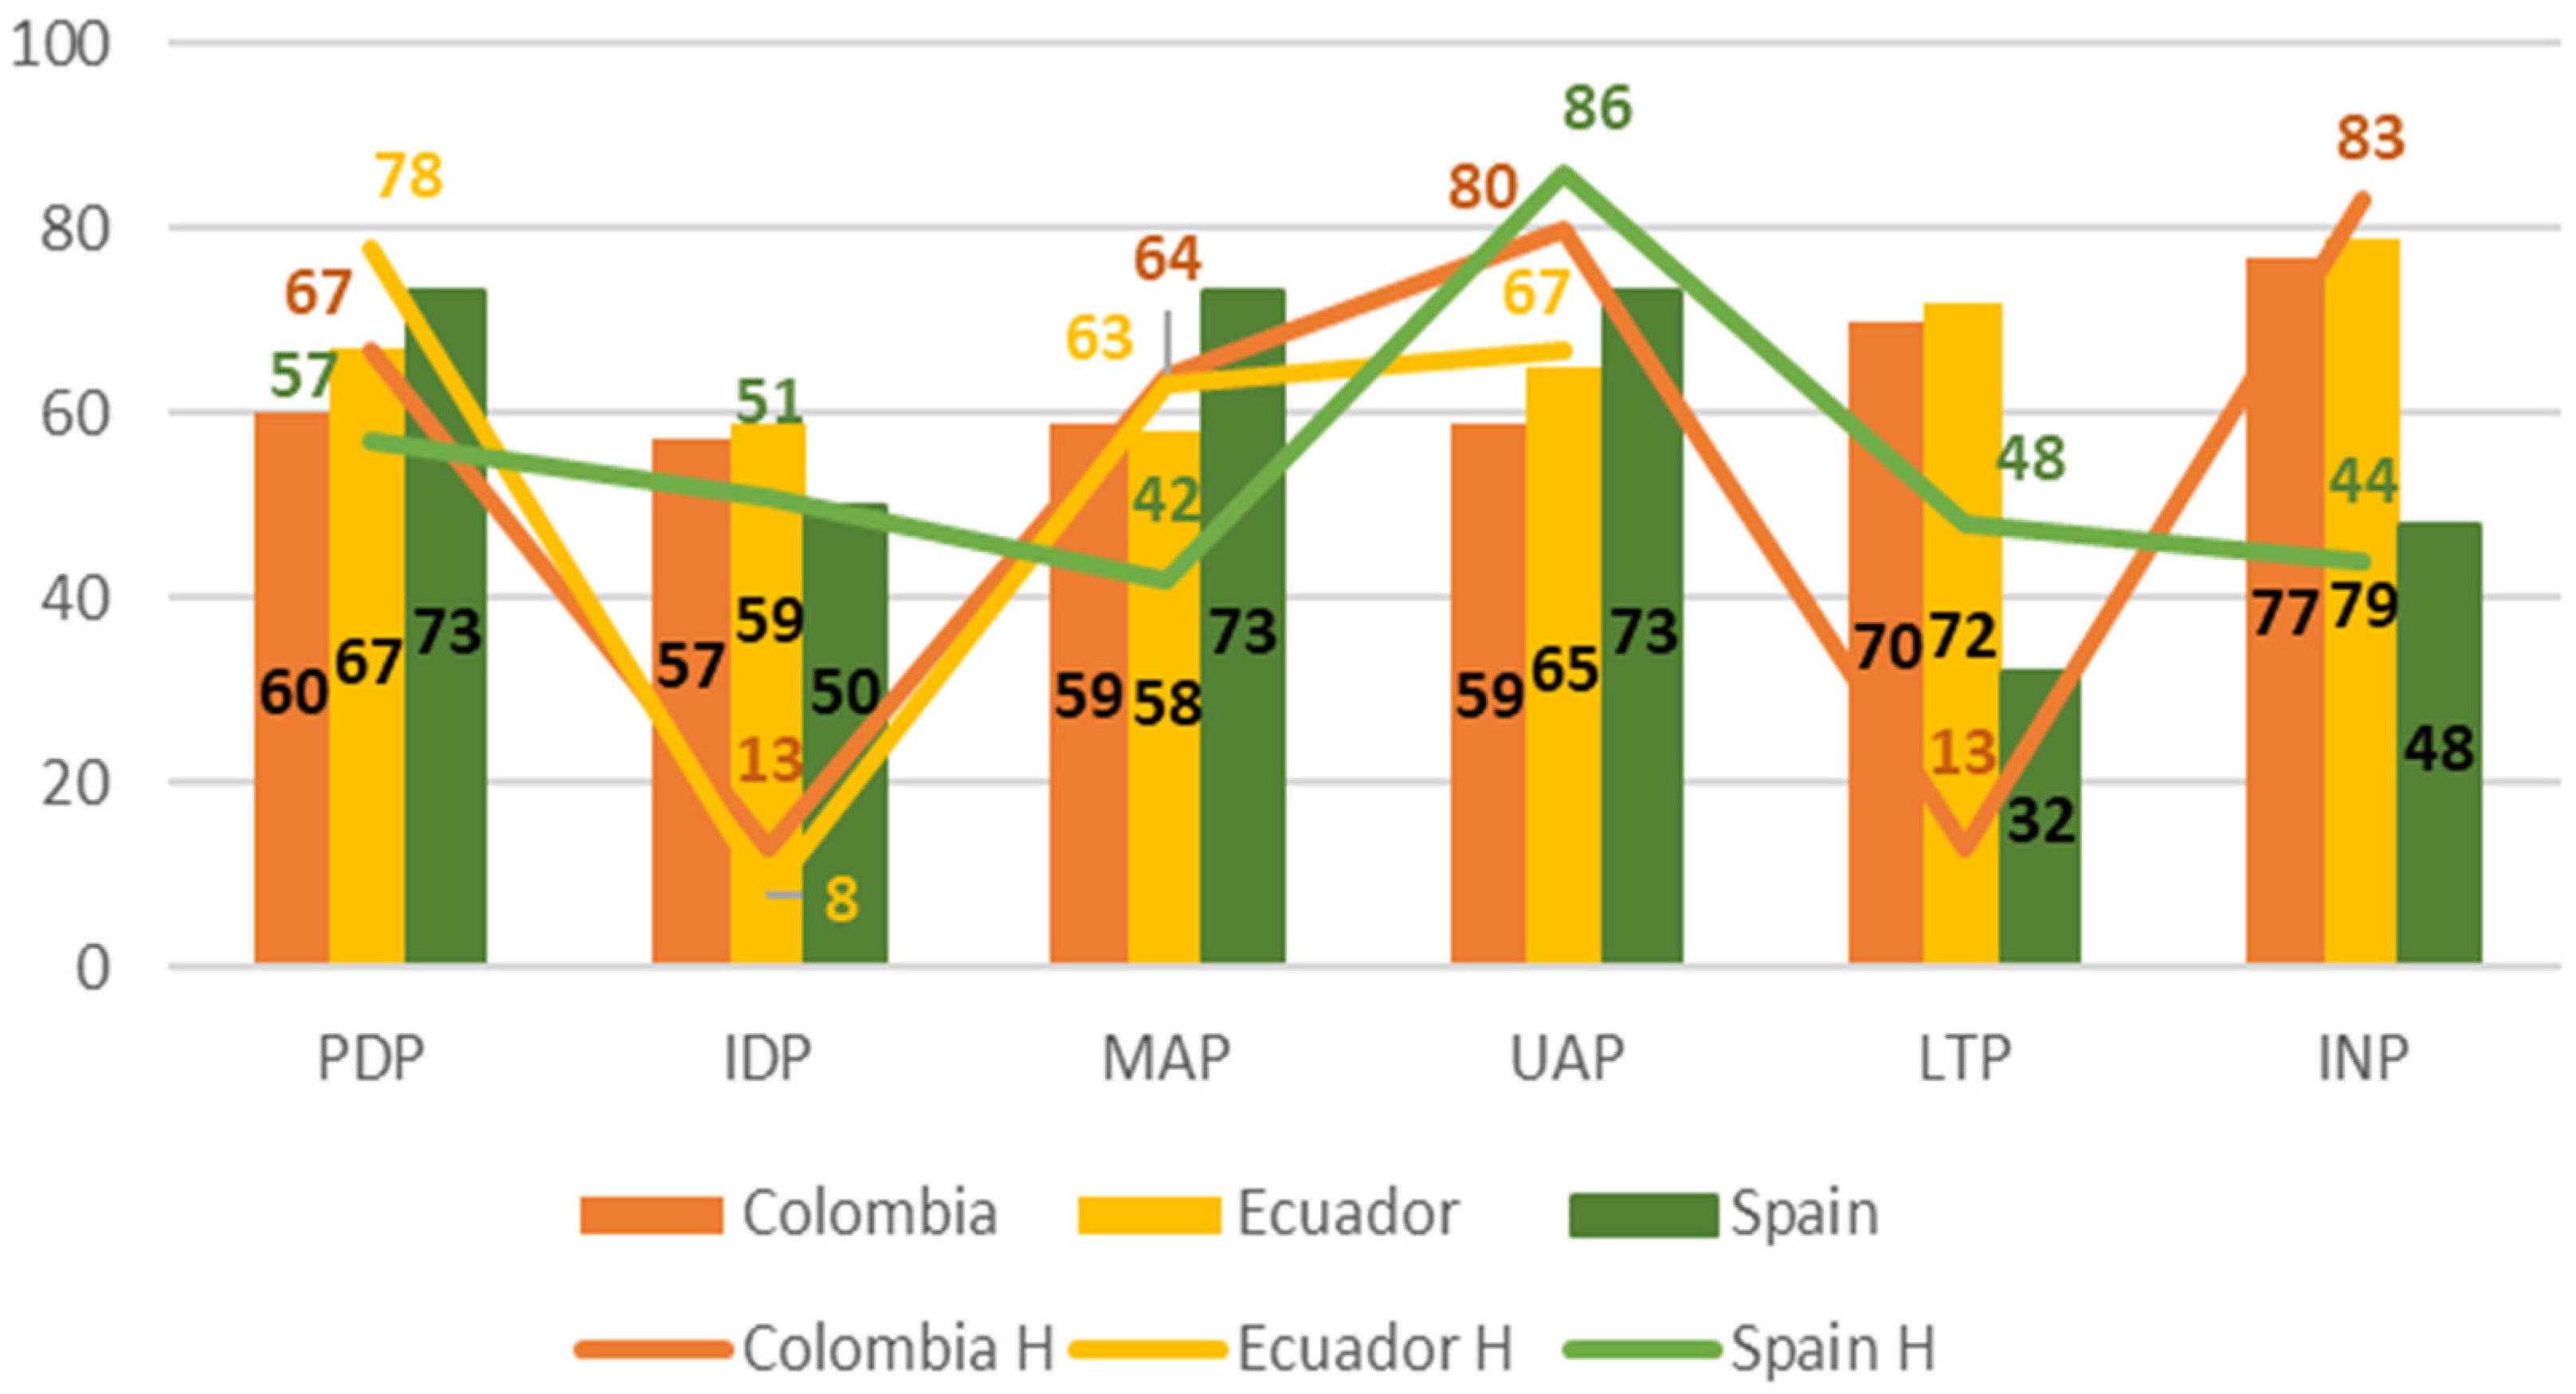
3.1. Comparison with Previous Studies
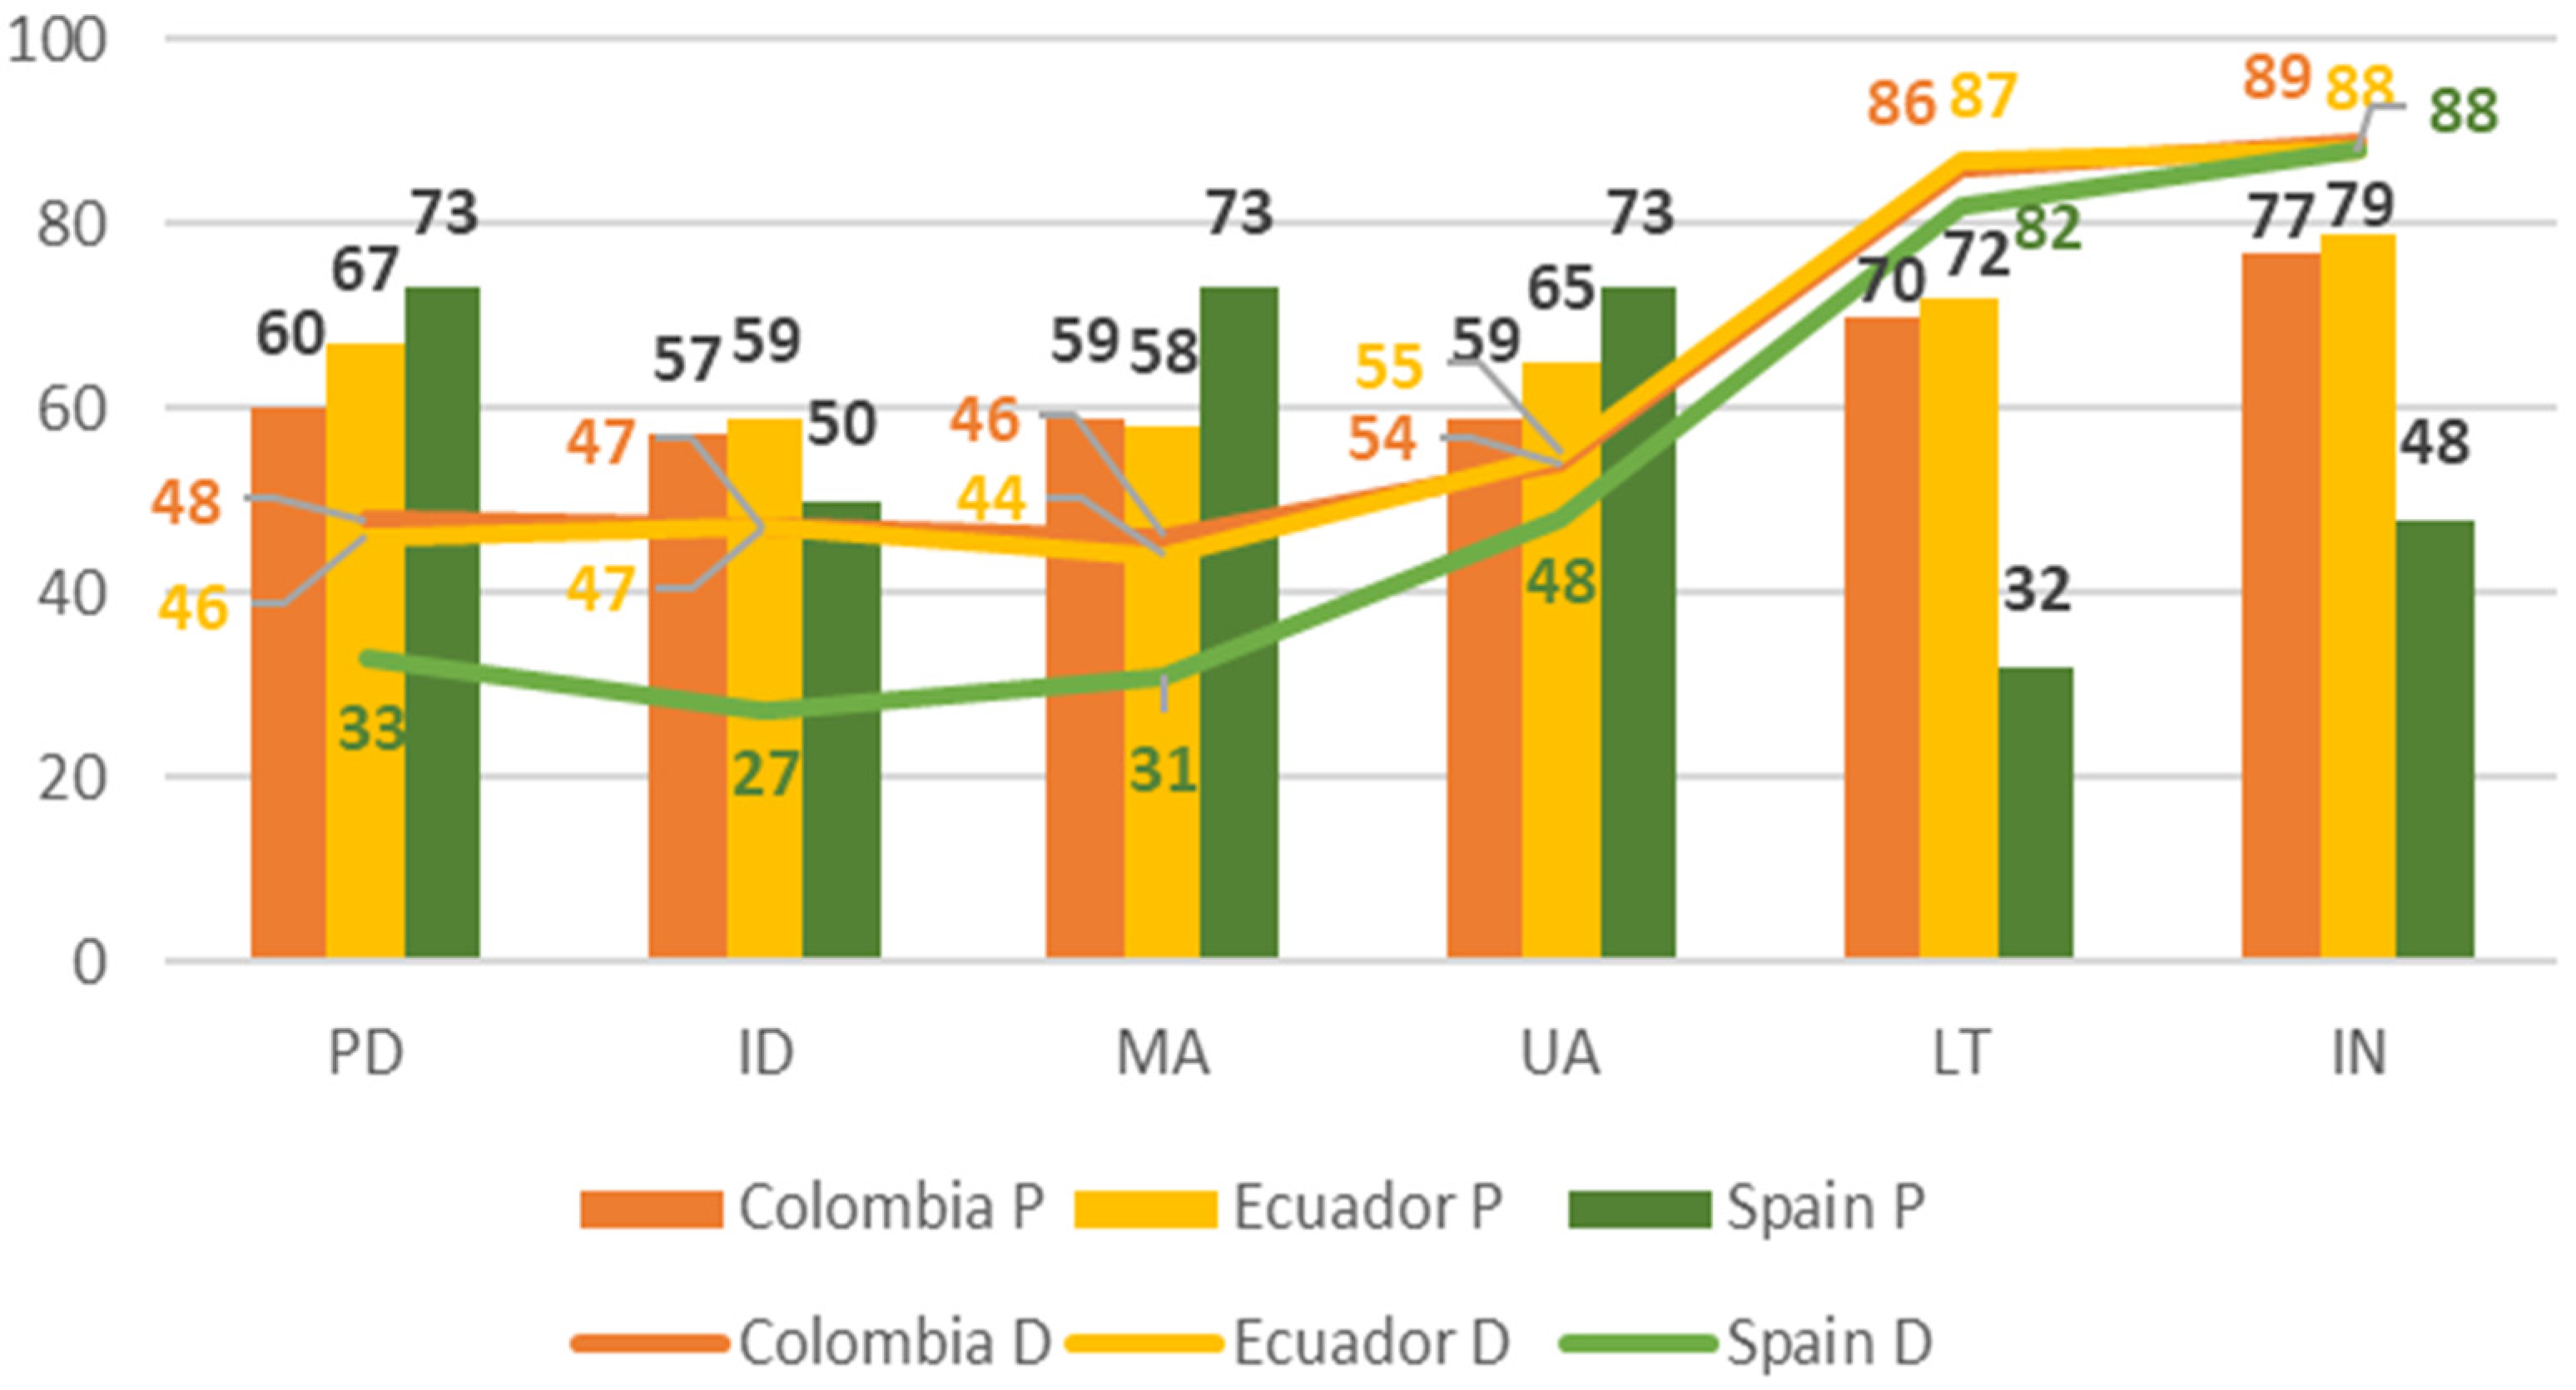
3.2. Comparison of Perceived vs. Desired Values
4. Discussion
4.1. Comparison with Previous Studies
4.2. Comparison Perceived vs. Desired Values
5. Conclusions
Author Contributions
Funding
Institutional Review Board Statement
Informed Consent Statement
Data Availability Statement
Acknowledgments
Conflicts of Interest
Appendix A. Survey

| Previous Questions: | ||||||||||||
|---|---|---|---|---|---|---|---|---|---|---|---|---|
| Age | Gender | Nationality | ||||||||||
| Rate from 1 (strongly disagree) to 10 (strongly agree) the following statements TWICE: first, what you OBSERVE (Obs.), and second, what you WOULD DESIRE (Des.) | ||||||||||||
| Dimension | Statement | 1 | 2 | 3 | 4 | 5 | 6 | 7 | 8 | 9 | 10 | |
| Indulgence | In general, students have an optimistic and positive view of their university and consider that it is possible to have fun there | Obs. | ||||||||||
| Des. | ||||||||||||
| Both professors and other students willingly accept questions in class and the atmosphere is very participative and relaxed. | Obs. | |||||||||||
| Des. | ||||||||||||
| The university offers a wide range of cultural and sports activities. Many students and professors participate in this offer. | Obs. | |||||||||||
| Des. | ||||||||||||
| The university is a niche of freedom of expression and tolerance in all its facets. | Obs. | |||||||||||
| Des. | ||||||||||||
| Individualism | The feeling of individual competitiveness among students is intense; the university does not encourage teamwork. | Obs. | ||||||||||
| Des. | ||||||||||||
| There is no collective sense of identity (class or promotion): for example, students do not care whether the results of their class are good or bad. | Obs. | |||||||||||
| Des. | ||||||||||||
| There are very few platforms or resources for sharing information. Each student is only concerned with his or her studies | Obs. | |||||||||||
| Des. | ||||||||||||
| Students do not ask for help or help those who do not belong to their direct group of friends. | Obs. | |||||||||||
| Des. | ||||||||||||
| Masculinity | While they are studying, for students the career is more important than family or friends. | Obs. | ||||||||||
| Des. | ||||||||||||
| The university offers hardly any resources for less advantaged students. Neither students nor professors care about them | Obs. | |||||||||||
| Des. | ||||||||||||
| Professors are not interested in the personal situation or other concerns of their students. | Obs. | |||||||||||
| Des. | ||||||||||||
| Students believe that getting good grades is more important for their future than learning and having a good college experience. | Obs. | |||||||||||
| Des. | ||||||||||||
| Uncertainty avoidance | The evaluation system gives little freedom to the student to organize his study plan as he/she wishes: the evaluation is continuous (many small tests) and there are few voluntary activities. | Obs. | ||||||||||
| Des. | ||||||||||||
| Students know exactly how they will be assessed: tests from other years or very precise information about the tests are available. | Obs. | |||||||||||
| Des. | ||||||||||||
| Students have a lot of freedom to choose different subjects (1), or, on the contrary, almost all students must take the same subjects (10). | Obs. | |||||||||||
| Des. | ||||||||||||
| Bureaucracy is a big problem for professors and also takes up a lot of students’ time. | Obs. | |||||||||||
| Des. | ||||||||||||
| Long-term orientation | In most subjects, a large part of the syllabus is devoted to contents on current affairs or future in engineering/science/business, as well as to the student’s professional future. | Obs. | ||||||||||
| Des. | ||||||||||||
| The university is generally self-critical and looks to others in its environment to introduce changes. | Obs. | |||||||||||
| Des. | ||||||||||||
| Complementary subjects or activities, such as volunteering, internships, language courses, are important and can be validated in order to train good professionals and good citizens for the future. | Obs. | |||||||||||
| Des. | ||||||||||||
| When it comes to preparing for assignments and exams, students plan from day one and work steadily. | Obs. | |||||||||||
| Des. | ||||||||||||
| Power distance | There are very few and ineffective mechanisms for students to express their opinion and influence university decisions. | Obs. | ||||||||||
| Des. | ||||||||||||
| The treatment of the professor is rather distant. He is considered an authority and is rarely questioned. | Obs. | |||||||||||
| Des. | ||||||||||||
| Departments are not very transparent and not very open: it is difficult for students to know what activities and projects the professors are involved in. | Obs. | |||||||||||
| Des. | ||||||||||||
| The departments have a hierarchical structure and very few young people and students work in them. | Obs. | |||||||||||
| Des. | ||||||||||||
References
- Hofstede, G.; Hofstede, G.J.; Minkov, M. Cultures and Organizations: Software of the Mind, 3rd ed.; McGraw-Hill: New York, NY, USA, 2010. [Google Scholar]
- Zwikael, O.; Pathak, R.D.; Ling, F.Y.Y.; Titov, S.; Husain, Z.; Sharma, B.; Tay, C.Y.; Samson, D. Variation in project management practices across borders. Prod. Plan. Control 2021, 1–13. [Google Scholar] [CrossRef]
- House, R.J.; Hanges, P.J.; Ruiz, Q.; Antonio, S. Cultural influences on leadership and organizations: Project GLOBE. In Project Globe Report; Advances in Global Leadership: Cincinnati, OH, USA, 1997. [Google Scholar]
- Müller, R.; Turner, J.R. Leadership competency profiles of successful project managers. Int. J. Proj. Manag. 2010, 28, 437–448. [Google Scholar] [CrossRef]
- Müller, R.; Turner, J.R. Cultural Differences in Project Owner-Manager Communication; Project Management Institute Conference Proceedings: London, UK, 2004. [Google Scholar]
- Peltokorpi, V.; Vaara, E. Language policies and practices in wholly owned foreign subsidiaries: A recontextualization perspective. J. Int. Bus. Stud. 2012, 43, 808–833. [Google Scholar] [CrossRef]
- Rees-Caldwell, K.; Pinnington, A.H. National culture differences in project management: Comparing British and Arab project managers’ perceptions of different planning areas. Int. J. Proj. Manag. 2013, 31, 212–227. [Google Scholar] [CrossRef]
- Liu, J.; Meng, F.; Fellows, R. An exploratory study of understanding project risk management from the perspective of national culture. Int. J. Proj. Manag. 2015, 33, 564–575. [Google Scholar] [CrossRef]
- Rodríguez-Rivero, R.; Ortiz-Marcos, I.; Ballesteros-Sánchez, L.; Romero, J. The opportunity to improve psychological competences of project managers in international businesses. Psychol. Market. 2018, 35, 150–159. [Google Scholar] [CrossRef]
- Rodríguez-Rivero, R.; Ortiz-Marcos, I.; Ballesteros-Sánchez, L.; Martínez-Beneitez, X. Identifying risks for better project management between two different cultures: The Chinese and the Spanish. Sustainability 2020, 12, 7588. [Google Scholar] [CrossRef]
- A Guide to the Project Management Book of Knowledge (PMBOK® Guide). Available online: https://book.akij.net/eBooks/2018/March/5abcc35b666f7/a%20guide%20to%20the%20project%20management%20body%20of%20knowledge%206e.pdf (accessed on 1 January 2022).
- International Project Management Association (IPMA). Individual Competence Baseline for Project Management (ICB V.4); IPMA: Amsterdam, The Netherlands, 2018. [Google Scholar]
- Project Management Association of Japan (PMAJ). A Guidebook of Program & Project Management for Enterprise Innovation (International Edition), 3rd ed.; PMAJ: Tokyo, Japan, 2017. [Google Scholar]
- Office of Government Commerce. Managing Successful Projects with PRINCE2, 5th ed.; The Stationery Office: London, UK, 2009.
- Muriithi, N.; Crawford, L. Approaches to project management in Africa: Implications for international development projects. Int. J. Proj. Manag. 2003, 21, 309–319. [Google Scholar] [CrossRef]
- Meyer, E. The Culture Map; Public Affairs: New York, NY, USA, 2015. [Google Scholar]
- Bredillet, C.; Yatim, F.; Ruiz, P. Project management deployment: The role of cultural factors. Int. J. Proj. Manag. 2010, 28, 183–193. [Google Scholar] [CrossRef] [Green Version]
- Hall, E.T. Beyond Culture; Garden City: New York, NY, USA, 1976. [Google Scholar]
- Trompenaars, F. Riding the Waves of Culture: Understanding Cultural Diversity in Business; Nicholas Brealey: London, UK, 1993. [Google Scholar]
- Nisbett, R.E.; Miyamoto, Y. The influence of culture: Holistic versus analytic perception. Trends Cogn. Sci. 2005, 9, 467–473. [Google Scholar] [CrossRef]
- Chipulu, M.; Ojiako, U.; Gardiner, P.; Williams, T.; Mota, C.; Maguire, S.; Shou, Y.; Stamati, T.; Marshall, A. Exploring the impact of cultural values on project performance. Int. J. Oper. Prod. Manag. 2014, 34, 364–389. [Google Scholar] [CrossRef] [Green Version]
- Hobday, M. The project-based organisation: An ideal form for managing complex products and systems? Res. Policy 2000, 29, 871–893. [Google Scholar] [CrossRef]
- Chen, C.C.; Law, C.; Yang, S.C. Managing ERP implementation failure: A project management perspective. IEEE Trans. Eng. Manag. 2009, 56, 157–170. [Google Scholar] [CrossRef] [Green Version]
- Scott-Young, C.; Samson, D. Project success and project team management: Evidence from capital projects in the process industries. J. Oper. Manag. 2008, 26, 749–766. [Google Scholar] [CrossRef]
- Motwani, J.; Mirchandani, D.; Madan, M.; Gunasekaran, A. Successful implementation of ERP projects: Evidence from two case studies. Int. J. Prod. Econ. 2002, 75, 83–96. [Google Scholar] [CrossRef]
- Jugdev, K.; Müller, R. A retrospective look at our evolving understanding of project success. Proj. Manag. J. 2005, 36, 19–34. [Google Scholar] [CrossRef]
- Miller, D.M.; Fields, R.; Kumar, A.; Ortiz, R. Leadership and organizational vision in managing a multiethnic and multicultural project team. J. Manag. Eng. 2000, 16, 18–22. [Google Scholar] [CrossRef]
- Ramburuth, P.; Mccormick, J. Learning diversity in higher education: A comparative study of Asian international and Australian students. High. Educ. 2001, 42, 333–350. [Google Scholar] [CrossRef]
- Cagliano, R.; Caniato, F.; Golini, R.; Longoni, A.; Micelotta, A. The impact of country culture on the adoption of new forms of work organization. Int. J. Oper. Prod. Manag. 2011, 31, 297–323. [Google Scholar] [CrossRef] [Green Version]
- Wiengarten, F.; Fynes, B.; Pagell, M.; De Burca, S. Exploring the impact of national culture on investments in manufacturing practices and performance: An empirical multi-country study. Int. J. Oper. Prod. Manag. 2011, 31, 554–578. [Google Scholar] [CrossRef]
- Harris, P.R. European leadership in cultural synergy. Eur. Bus. Rev. 2004, 16, 358–380. [Google Scholar] [CrossRef]
- Hofstede, G. Cultural dimensions in management and planning. Asia Pac. J. Manag. 1984, 1, 81–99. [Google Scholar] [CrossRef]
- Taras, V.; Kirkman, B.L.; Steel, P. Examining the impact of culture’s consequences: A three-decade, multi-level, meta-analytic review of Hofstede’s cultural value dimensions. J. Appl. Psychol. 2010, 95, 405–439. [Google Scholar] [CrossRef] [PubMed] [Green Version]
- Chakrabarty, S. The influence of national culture and institutional voids on family ownership of large firms: A country level empirical study. J. Int. Manag. 2009, 15, 32–45. [Google Scholar] [CrossRef]
- Newburry, W.; Yakova, N. Standardization preferences: A function of national culture work interdependence and local embeddedness. J. Int. Bus Stud. 2006, 37, 44–60. [Google Scholar] [CrossRef]
- Ng, T.W.H.; Sorensen, K.L.; Yim, F.H.K. Does the job satisfaction–job performance relationship vary across cultures? J. Cross Cult. Psychol. 2009, 40, 1–36. [Google Scholar] [CrossRef]
- Kim, Y.; Kim, S.-Y. The Influence of Cultural Values on Perceptions of Corporate Social Responsibility: Application of Hofstede’s Dimensions to Korean Public Relations Practitioners. J. Bus. Ethics 2010, 91, 485–500. [Google Scholar] [CrossRef]
- Gouveia, V.V.; Clemente, M.; Espinosa, P. The Horizontal and Vertical Attributes of Individualism and Collectivism in a Spanish Population. J. Soc. Psychol. 2003, 143, 43–63. [Google Scholar] [CrossRef]
- Kacen, J.J.; Lee, J. The Influence of Culture on Consumer Impulsive Buying Behavior. J. Consum. 2002, 12, 163–176. [Google Scholar] [CrossRef]
- van Oudenhoven, J.P. Do organizations reflect national cultures? A 10-nation study. Int. J. Intercul. Relat. 2001, 25, 89–107. [Google Scholar] [CrossRef]
- Schwartz, S.H. Beyond individualism/collectivism: New cultural dimensions of values. In Individualism and Collectivism: Theory, Method, and Applications; Kim, U., Triandis, H.C., Kagitçibasi, C., Choi, S.C., Yoon, G., Eds.; SAGE Publications: Thousand Oaks, CA, USA, 1994; pp. 85–119. [Google Scholar]
- Schwartz, S.H. A theory of cultural value orientations: Explication and applications. Comp. Sociol. 2006, 5, 137–182. [Google Scholar] [CrossRef] [Green Version]
- Inglehart, R. Culture Shift in Advanced Industrial Society; Princeton University Press: Princeton, NJ, USA, 1990. [Google Scholar]
- Inglehart, R. Modernization and Postmodernization: Cultural, Economic and Political Change in 43 Societies; Princeton University Press: Princeton, NJ, USA, 1997. [Google Scholar]
- Kirkman, B.L.; Lowe, K.B.; Gibson, C.B. A quarter century of Culture’s Consequences: A review of empirical research incorporating Hofstede’s cultural values framework. J. Int. Bus Stud. 2006, 37, 285–320. [Google Scholar] [CrossRef]
- McSweeney, B. Hofstede’s model of national cultural differences and their consequences: A triumph of faith—A failure of analysis. Hum. Relat. 2002, 55, 89–118. [Google Scholar] [CrossRef]
- Winch, G.; Millar, C.; Clifton, N. Culture and organization: The case of Transmanche-Link. Br. J. Manag. 1997, 8, 237–249. [Google Scholar] [CrossRef]
- Hofstede, G.H. Culture’s Consequences; SAGE: Beverly Hills, CA, USA, 1980. [Google Scholar]
- Taras, V.; Steel, P.; Kirkman, B. Improving national cultural indices using a longitudinal meta-analysis of Hofstede’s dimensions. J. World Bus. 2012, 47, 329–341. [Google Scholar] [CrossRef] [Green Version]
- Voronov, M.; Singer, J.A. The myth of individualism–collectivism: A critical review. J. Soc. Psychol. 2002, 142, 461–480. [Google Scholar] [CrossRef]
- Inglehart, R.; Baker, W.E. Modernization, cultural change, and the persistence of traditional values. Am. Sociol. Rev. 2020, 65, 19–51. [Google Scholar] [CrossRef] [Green Version]
- Ralston, D.A.; Holt, D.H.; Terpstra, R.H.; Kai-Cheng, Y. The impact of national culture and economic ideology on managerial work values: A study of the United States, Russia, Japan and China. J. Int. Bus Stud. 1997, 28, 177–207. [Google Scholar] [CrossRef]
- Beugelsdijk, S.; Maseland, R.; Van Hoorn, A. Are Scores on Hofstede’s Dimensions of National Culture Stable over Time? A Cohort Analysis. Glob. Strategy J. Glob. Strat. J. 2015, 5, 223–240. [Google Scholar] [CrossRef]
- Hofstede, G. What did GLOBE really measure? Researchers’ minds versus respondents’ minds. J. Int. Bus Stud. 2006, 37, 882–896. [Google Scholar] [CrossRef] [Green Version]
- Javidan, M.; House, R.J.; Dorfman, P.W.; Hanges, P.J.; de Luque, M.S. Conceptualizing and measuring cultures and their consequences: A comparative review of GLOBE’s and Hofstede’s approaches. J. Int. Bus. Stud. 2006, 37, 897–914. [Google Scholar] [CrossRef]
- Nakata, C.; Sivakumar, K. Instituting the Marketing Concept in a Multinational Setting: The Role of National Culture. J. Acad. Mark. Sci. 2001, 29, 255–276. [Google Scholar] [CrossRef]
- Minkov, M.; Kaasa, A. A test of Hofstede’s model of culture following his own approach. Cross Cult. Strat. Manag. 2021, 28, 384–406. [Google Scholar] [CrossRef]
- Minkov, M.; Hofstede, G. The evolution of Hofstede’s doctrine. Cross Cult. Manag. Int. J. 2011, 18, 10–20. [Google Scholar] [CrossRef]
- Adler, N.J. Cross-cultural management research: The ostrich and the trend. Acad. Manag. Rev. 1983, 8, 226–232. [Google Scholar] [CrossRef]
- UNESCO. Cracking the Code: Girls’ 715 and Women’s Education in Science, Technology, Engineering and Mathematics (STEM); UNESCO: Paris, France, 2017; ISBN 978-92-3-100233-5. [Google Scholar]
- Botella, C.; Rueda, S.; López-Iñesta, E.; Marzal, P. Gender Diversity in STEM Disciplines: A Multiple Factor Problem. Entropy 2010, 21, 30. [Google Scholar] [CrossRef] [Green Version]
- Schwartz, S.H. National Culture as Value Orientations: Consequences of Value Differences and Cultural Distance. In Handbook of the Economics Art and Culture; Elsevier: Amsterdam, The Netherlands, 2014. [Google Scholar]
- Hofstede, G. National Culture Dimensions. 2013. Available online: http://geert-hofstede.com/dimensions.html (accessed on 18 January 2021).
- Hofstede Insights Compare Countries. Available online: https://www.hofstedeinsights.com/product/compare-countries/ (accessed on 18 January 2021).
- Magano, J.; Silva, C.S.; Figueiredo, C.; Vitoria, A.; Nogueira, T.; Dinis, M.A. Generation Z: Fitting Project Management Soft Skills Competencies—A Mixed-Method Approach. Educ. Sci. 2020, 10, 187. [Google Scholar] [CrossRef]
- Karakas, F.; Manisaligil, A.; Sarigollu, E. Management learning at speed of life: Designing reflective, creative, and collaborative spaces for millennials. Int. J. Manag. Educ. 2015, 13, 237–248. [Google Scholar] [CrossRef] [Green Version]


| PD1P | PD2P | PD3P | PD4P | ID1P | ID2P | ID3P | ID4P | MA1P | MA2P | MA3P | MA4P | UA1P | UA2P | UA3P | UA4P | LT1P | LT2P | LT3P | LT4P | IN1P | IN2P | IN3P | IN4P | |
|---|---|---|---|---|---|---|---|---|---|---|---|---|---|---|---|---|---|---|---|---|---|---|---|---|
| PD1P | 1 | 0.195 ** | 0.348 ** | 0.332 ** | 0.159 ** | 0.167 ** | 0.201 ** | 0.092 | 0.121 * | 0.254 ** | 0.333 ** | 0.188 ** | 0.355 ** | −0.085 | 0.275 ** | 0.274 ** | −0.220 ** | −0.249 ** | −0.173 ** | −0.226 ** | −0.281 ** | −0.149 ** | −0.114 * | −0.228 ** |
| PD2P | 1 | 0.433 ** | 0.304 ** | 0.208 ** | 0.190 ** | 0.242 ** | 0.180 ** | 0.164 ** | 0.384 ** | 0.522 ** | 0.240 ** | 0.258 ** | 0.009 | 0.223 ** | 0.239 ** | −0.210 ** | −0.156 ** | −0.144 ** | −0.04 | −0.146 ** | −0.265 ** | −0.03 | −0.184 ** | |
| PD3P | 1 | 0.521 ** | 0.257 ** | 0.166 ** | 0.252 ** | 0.224 ** | 0.141 ** | 0.434 ** | 0.506 ** | 0.241 ** | 0.425 ** | −0.01 | 0.383 ** | 0.346 ** | −0.263 ** | −0.247 ** | −0.266 ** | −0.130 * | −0.263 ** | −0.334 ** | −0.202 ** | −0.260 ** | ||
| PD4P | 1 | 0.180 ** | 0.128 * | 0.241 ** | 0.283 ** | 0.06 | 0.288 ** | 0.306 ** | 0.196 ** | 0.269 ** | −0.089 | 0.196 ** | 0.283 ** | 0.09 | −0.08 | −0.07 | −0.01 | −0.04 | −0.124 * | −0.118 * | −0.112 * | |||
| ID1P | 1 | 0.297 ** | 0.377 ** | 0.303 ** | 0.162 ** | 0.192 ** | 0.180 ** | 0.197 ** | 0.123 * | 0.036 | 0.069 | 0.122 * | 0.037 | 0.044 | −0.025 | 0.055 | 0.044 | −0.02 | 0 | 0.032 | ||||
| ID2P | 1 | 0.303 ** | 0.229 ** | 0.137 * | 0.267 ** | 0.209 ** | 0.106 | 0.148 ** | 0.055 | 0.161 ** | 0.178 ** | 0.103 | 0.141 * | 0.075 | 0.067 | 0.097 | −0.03 | 0.067 | 0.011 | |||||
| ID3P | 1 | 0.263 ** | 0.114 * | 0.323 ** | 0.210 ** | 0.035 | 0.256 ** | −0.054 | 0.087 | 0.199 ** | 0.062 | 0.084 | 0.051 | 0.109 * | 0.055 | −0.09 | 0.003 | 0.065 | ||||||
| ID4P | 1 | 0.111 * | 0.259 ** | 0.124 * | 0.202 ** | 0.168 ** | −0.048 | 0.114 * | 0.202 ** | 0.079 | 0.101 | 0.174 ** | 0.116 * | 0.140 * | 0.122 * | −0.02 | 0.067 | |||||||
| MA1P | 1 | 0.154 ** | 0.218 ** | .221 ** | 0.212 ** | 0.142 ** | 0.167 ** | 0.146 ** | 0.006 | −0.045 | −0.075 | 0.057 | −0.152 ** | −0.129 * | −0.08 | −0.122 * | ||||||||
| MA2P | 1 | 0.566 ** | 0.187 ** | 0.331 ** | 0.018 | 0.273 ** | 0.276 ** | −0.090 | −0.128 * | −0.105 | −0.032 | −0.214 ** | −0.199 ** | −0.05 | −0.268 ** | |||||||||
| MA3P | 1 | 0.221 ** | 0.443 ** | 0.051 | 0.344 ** | 0.321 ** | −0.402 ** | −0.319 ** | −0.338 ** | −0.202 ** | −0.381 ** | −0.410 ** | −0.157 ** | −0.406 ** | ||||||||||
| MA4P | 1 | 0.233 ** | 0.042 | 0.016 | 0.123 * | −0.130 * | −0.198 ** | −0.130 * | −0.135 * | −0.127 * | −0.135 * | −0.09 | −0.155 ** | |||||||||||
| UA1P | 1 | 0.010 | 0.341 ** | 0.287 ** | −0.261 ** | −0.236 ** | −0.272 ** | −0.109 * | −0.326 ** | −0.310 ** | −0.153 ** | −0.244 ** | ||||||||||||
| UA2P | 1 | 0.034 | 0.055 | 0.118 * | 0.093 | 0.010 | 0.191 ** | 0.008 | 0.115 * | 0.117 * | −0.004 | |||||||||||||
| UA3P | 1 | 0.231 ** | −0.124 * | −0.074 | −0.191 ** | −0.099 | −0.209 ** | −0.180 ** | −0.07 | −0.176 ** | ||||||||||||||
| UA4P | 1 | −0.020 | 0.060 | 0.025 | −0.048 | −0.181 ** | −0.230 ** | −0.05 | −0.120 * | |||||||||||||||
| LT1P | 1 | 0.689 ** | 0.568 ** | 0.509 ** | 0.556 ** | 0.564 ** | 0.330 ** | 0.477 ** | ||||||||||||||||
| LT2P | 1 | 0.598 ** | 0.542 ** | 0.551 ** | 0.488 ** | 0.335 ** | 0.523 ** | |||||||||||||||||
| LT3P | 1 | 0.445 ** | 0.573 ** | 0.478 ** | 0.298 ** | 0.439 ** | ||||||||||||||||||
| LT4P | 1 | 0.522 ** | 0.487 ** | 0.317 ** | 0.421 ** | |||||||||||||||||||
| IN1P | 1 | 0.583 ** | 0.490 ** | 0.671 ** | ||||||||||||||||||||
| IN2P | 1 | 0.410 ** | 0.552 ** | |||||||||||||||||||||
| IN3P | 1 | 0.403 ** | ||||||||||||||||||||||
| IN4P | 1 |
| Perceived Dimension | Country | N | Mean | Standard Deviation | Sig. | Desired Dimension | Mean | Standard Deviation | Sig. |
|---|---|---|---|---|---|---|---|---|---|
| PD | Colombia | 143 | 6.015 | 1.869 | 0.000 * | PD | 4.832 | 2.540 | 0.000 * |
| Ecuador | 98 | 6.683 | 1.727 | 4.625 | 2.467 | ||||
| Spain | 93 | 7.314 | 1.544 | 3.309 | 1.445 | ||||
| Total | 334 | 6.573 | 1.819 | 4.347 | 2.351 | ||||
| ID | Colombia | 143 | 5.737 | 1.951 | 0.002 * | ID | 4.671 | 2.731 | 0.000 * |
| Ecuador | 98 | 5.897 | 1.695 | 4.739 | 2.629 | ||||
| Spain | 93 | 5.005 | 1.907 | 2.733 | 1.270 | ||||
| Total | 334 | 5.580 | 1.896 | 4.151 | 2.534 | ||||
| MA | Colombia | 143 | 5.896 | 1.910 | 0.000 * | MA | 4.585 | 2.242 | 0.000 * |
| Ecuador | 98 | 5.765 | 1.832 | 4.426 | 2.252 | ||||
| Spain | 93 | 7.279 | 1.424 | 3.110 | 1.391 | ||||
| Total | 334 | 6.243 | 1.874 | 4.127 | 2.136 | ||||
| UA | Colombia | 143 | 5.926 | 1.667 | 0.000 * | UA | 5.372 | 1.851 | 0.007 * |
| Ecuador | 98 | 6.522 | 1.484 | 5.535 | 1.657 | ||||
| Spain | 93 | 7.263 | 1.165 | 4.838 | 1.023 | ||||
| Total | 334 | 6.473 | 1.583 | 5.271 | 1.621 | ||||
| LT | Colombia | 143 | 6.986 | 1.721 | 0.000 * | LT | 8.631 | 1.326 | 0.011 |
| Ecuador | 98 | 7.209 | 1.674 | 8.658 | 1.272 | ||||
| Spain | 93 | 3.163 | 1.369 | 8.174 | 1.185 | ||||
| Total | 334 | 5.987 | 2.385 | 8.511 | 1.286 | ||||
| IN | Colombia | 143 | 7.685 | 1.451 | 0.000 * | IN | 8.882 | 1.143 | 0.886 |
| Ecuador | 98 | 7.931 | 1.457 | 8.831 | 1.433 | ||||
| Spain | 93 | 4.790 | 1.404 | 8.811 | 0.765 | ||||
| Total | 334 | 6.951 | 1.969 | 8.848 | 1.148 |
| Perceived Dimension | Sex | N | Mean | Standard Deviation | Sig. | Desired Dimension | Mean | Standard Deviation | Sig. |
|---|---|---|---|---|---|---|---|---|---|
| PD | Men | 234 | 6.565 | 1.834 | 0.900 | PD | 4.442 | 2.409 | 0.259 |
| Women | 100 | 6.592 | 1.791 | 4.125 | 2.202 | ||||
| Total | 334 | 6.573 | 1.819 | 4.347 | 2.351 | ||||
| ID | Men | 234 | 5.518 | 1.880 | 0.356 | ID | 4.322 | 2.585 | 0.060 |
| Women | 100 | 5.727 | 1.935 | 3.752 | 2.374 | ||||
| Total | 334 | 5.580 | 1.896 | 4.151 | 2.534 | ||||
| MA | Men | 234 | 6.149 | 1.792 | 0.163 | MA | 4.268 | 2.120 | 0.066 |
| Women | 100 | 6.462 | 2.045 | 3.800 | 2.146 | ||||
| Total | 334 | 6.243 | 1.874 | 4.127 | 2.136 | ||||
| UA | Men | 234 | 6.440 | 1.569 | 0.553 | UA | 5.285 | 1.626 | 0.816 |
| Women | 100 | 6.552 | 1.621 | 5.240 | 1.617 | ||||
| Total | 334 | 6.473 | 1.583 | 5.271 | 1.621 | ||||
| LT | Men | 234 | 6.217 | 2.285 | 0.007 | LT | 8.504 | 1.368 | 0.867 |
| Women | 100 | 5.447 | 2.535 | 8.530 | 1.076 | ||||
| Total | 334 | 5.987 | 2.385 | 8.511 | 1.286 | ||||
| IN | Men | 234 | 7.153 | 1.925 | 0.004 | IN | 8.845 | 1.171 | 0.943 |
| Women | 100 | 6.477 | 2.000 | 8.855 | 1.098 | ||||
| Total | 334 | 6.951 | 1.969 | 8.848 | 1.148 |
Publisher’s Note: MDPI stays neutral with regard to jurisdictional claims in published maps and institutional affiliations. |
© 2022 by the authors. Licensee MDPI, Basel, Switzerland. This article is an open access article distributed under the terms and conditions of the Creative Commons Attribution (CC BY) license (https://creativecommons.org/licenses/by/4.0/).
Share and Cite
Rodríguez-Rivero, R.; Ortiz-Marcos, I.; Patiño-Arenas, V.E. Exploring the Influence of Culture in the Present and Future of Multicultural Organizations: Comparing the Case of Spain and Latin America. Sustainability 2022, 14, 2327. https://doi.org/10.3390/su14042327
Rodríguez-Rivero R, Ortiz-Marcos I, Patiño-Arenas VE. Exploring the Influence of Culture in the Present and Future of Multicultural Organizations: Comparing the Case of Spain and Latin America. Sustainability. 2022; 14(4):2327. https://doi.org/10.3390/su14042327
Chicago/Turabian StyleRodríguez-Rivero, Rocío, Isabel Ortiz-Marcos, and Victoria E. Patiño-Arenas. 2022. "Exploring the Influence of Culture in the Present and Future of Multicultural Organizations: Comparing the Case of Spain and Latin America" Sustainability 14, no. 4: 2327. https://doi.org/10.3390/su14042327
APA StyleRodríguez-Rivero, R., Ortiz-Marcos, I., & Patiño-Arenas, V. E. (2022). Exploring the Influence of Culture in the Present and Future of Multicultural Organizations: Comparing the Case of Spain and Latin America. Sustainability, 14(4), 2327. https://doi.org/10.3390/su14042327