
Investigation on Mechanism of Tetracycline Removal from Wastewater by Sinusoidal Alternating Electro-Fenton Technique

Abstract
:1. Introduction
2. Materials and Methods
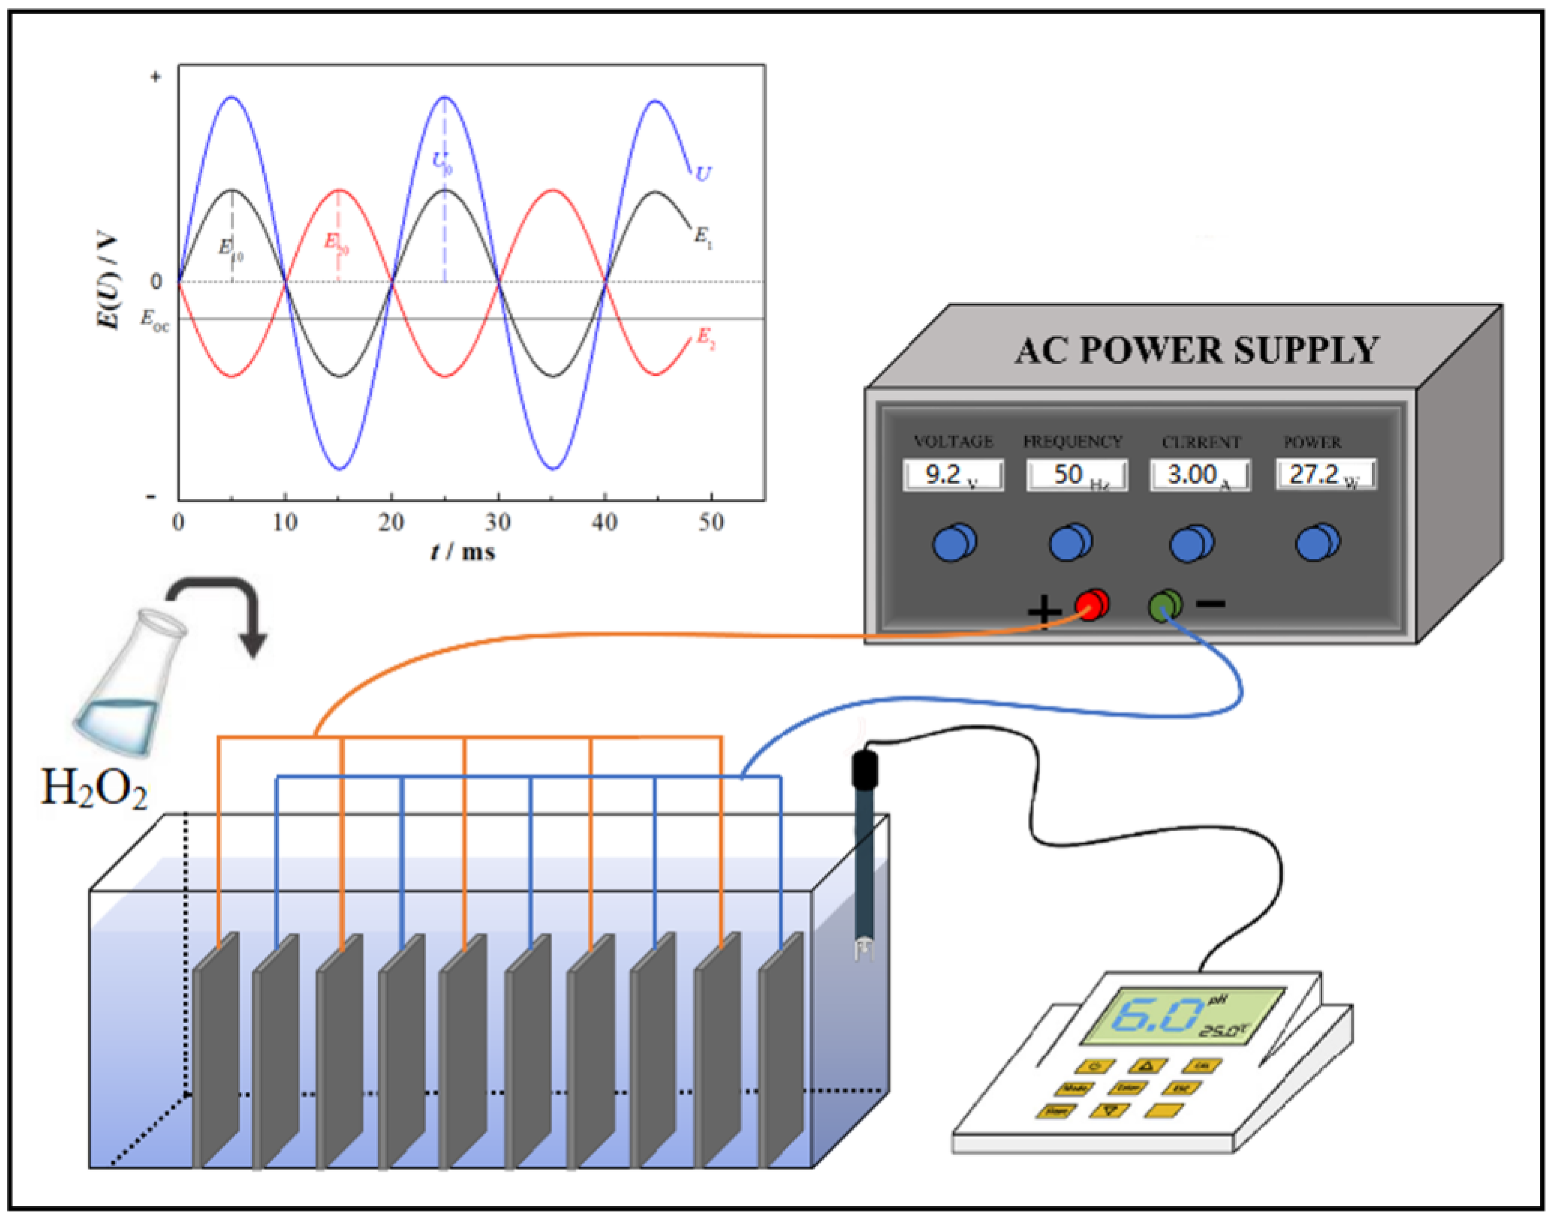
2.1. Experimental Device
2.2. Chemicals and Regents
2.3. Experimental Method
2.4. Measurement
3. Results and Discussion
3.1. Optimization of Process Conditions
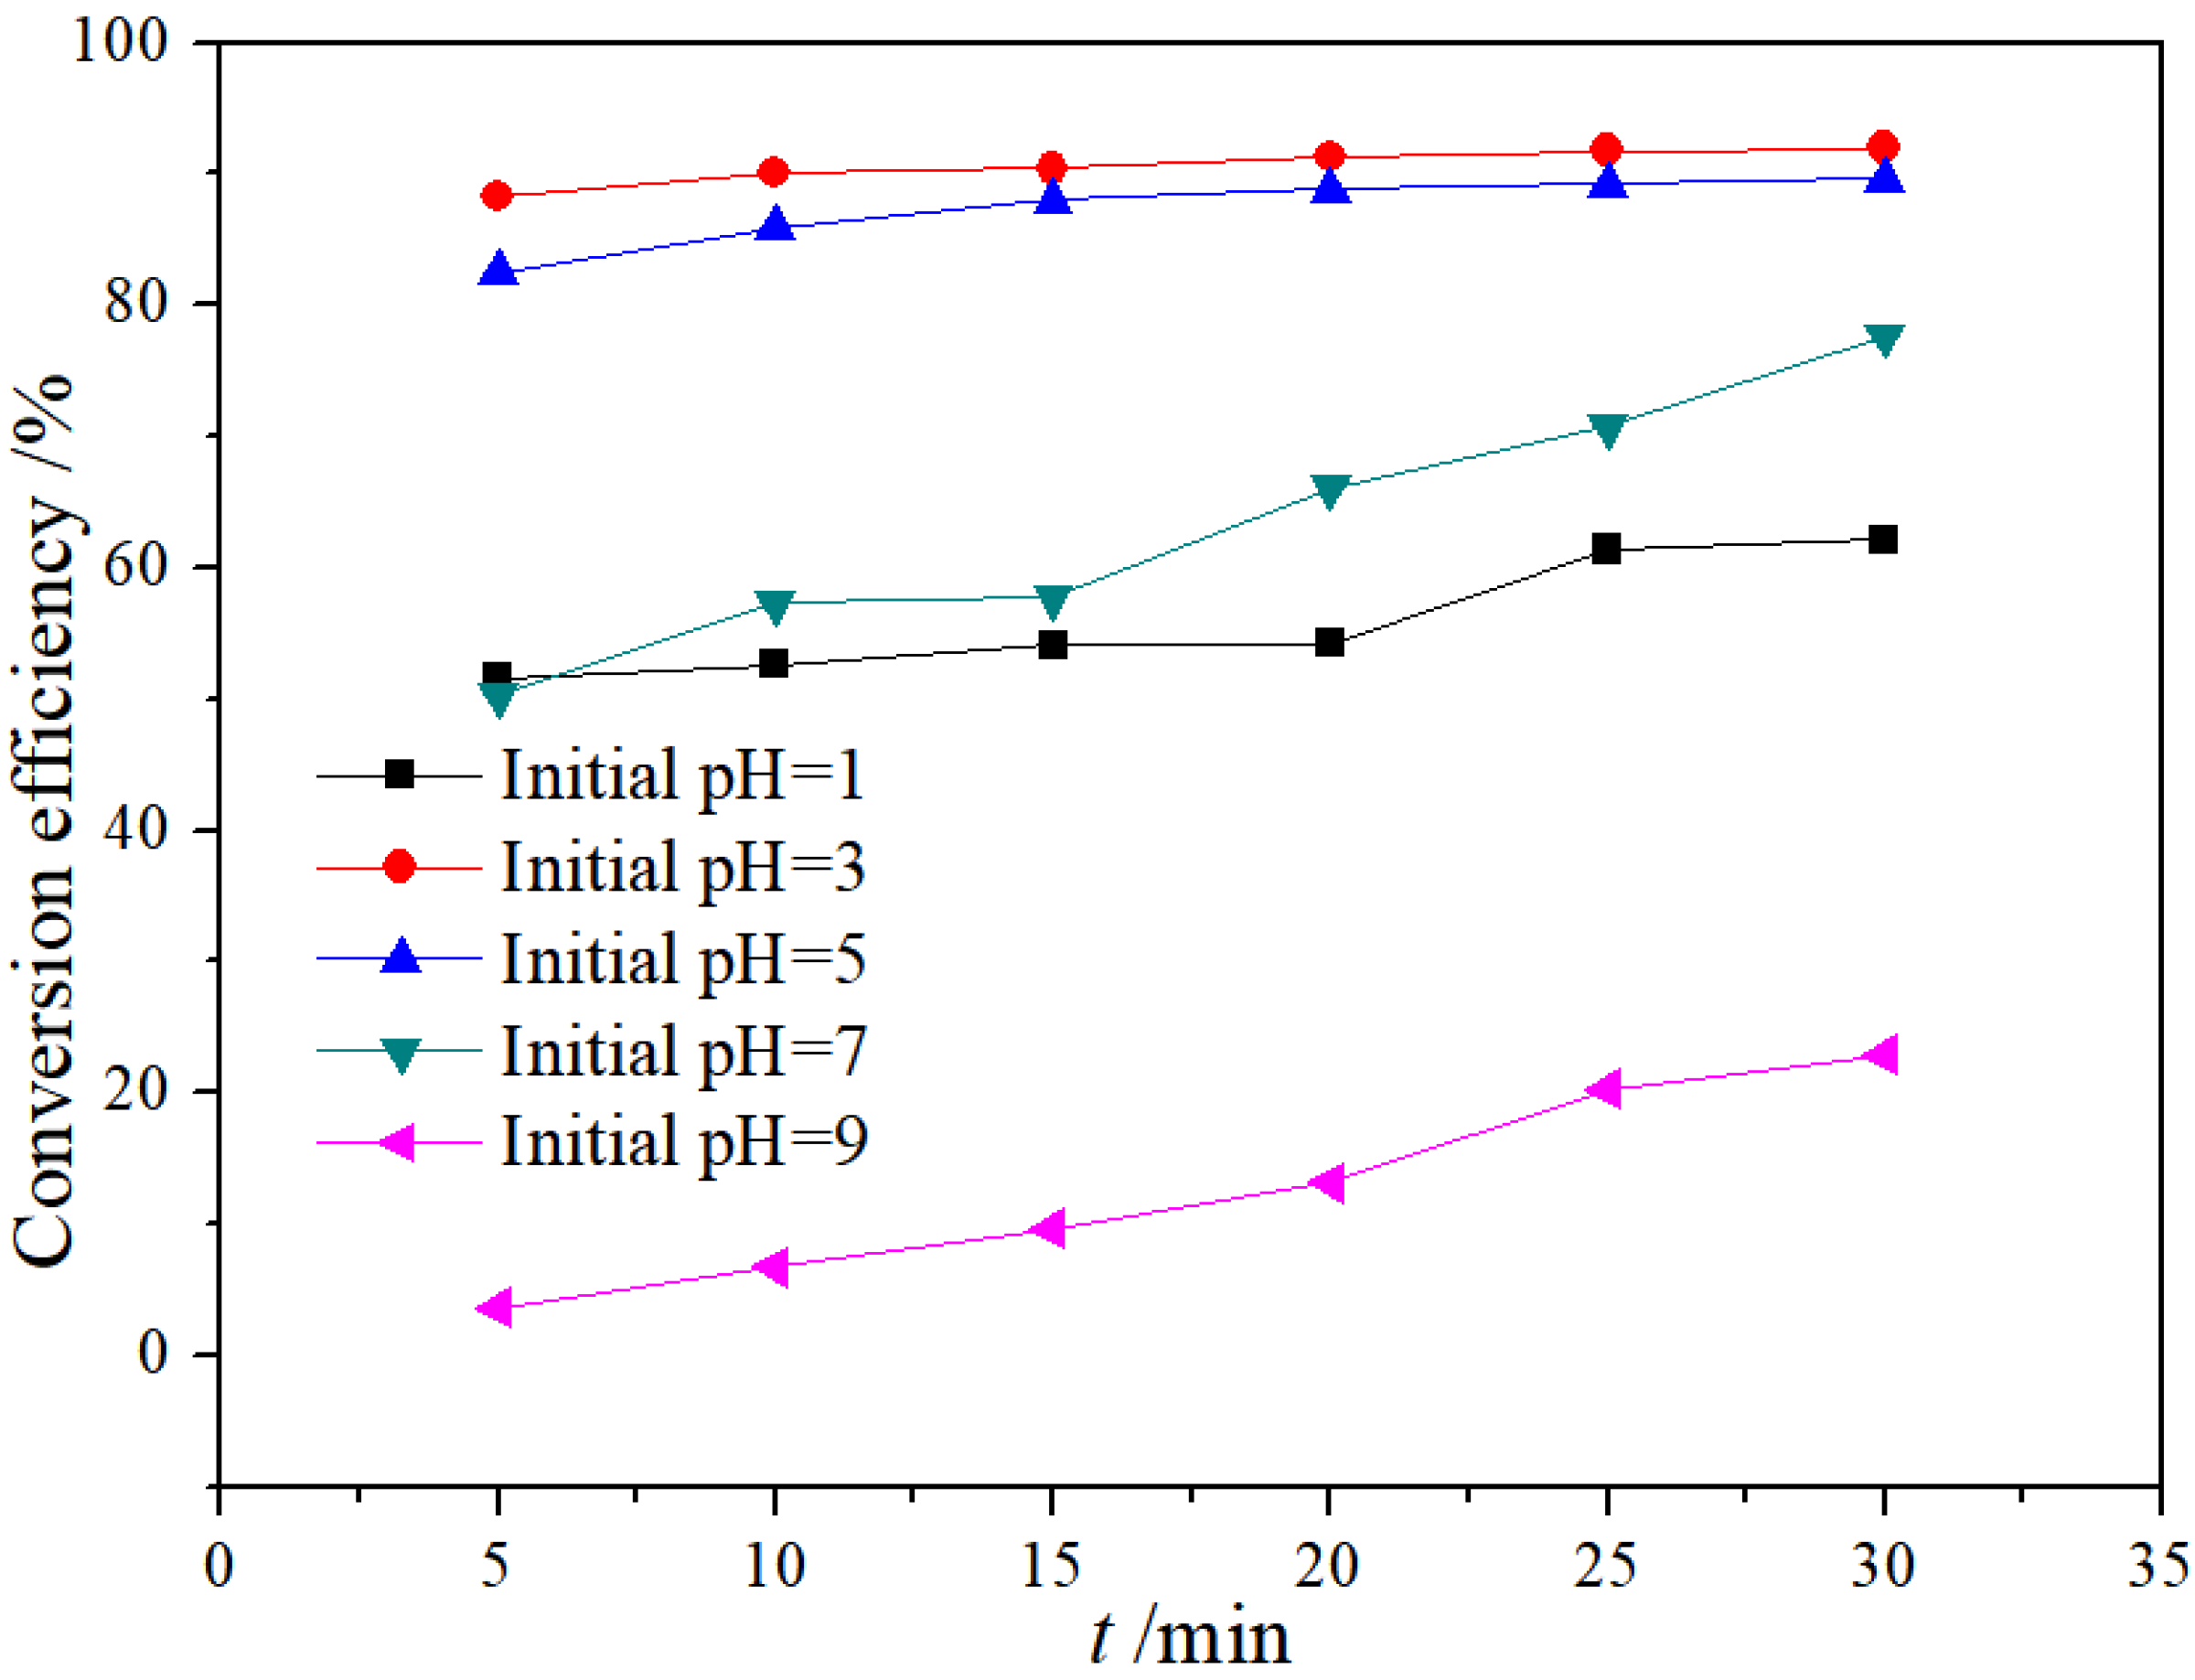
3.1.1. Effect of Initial pH Value
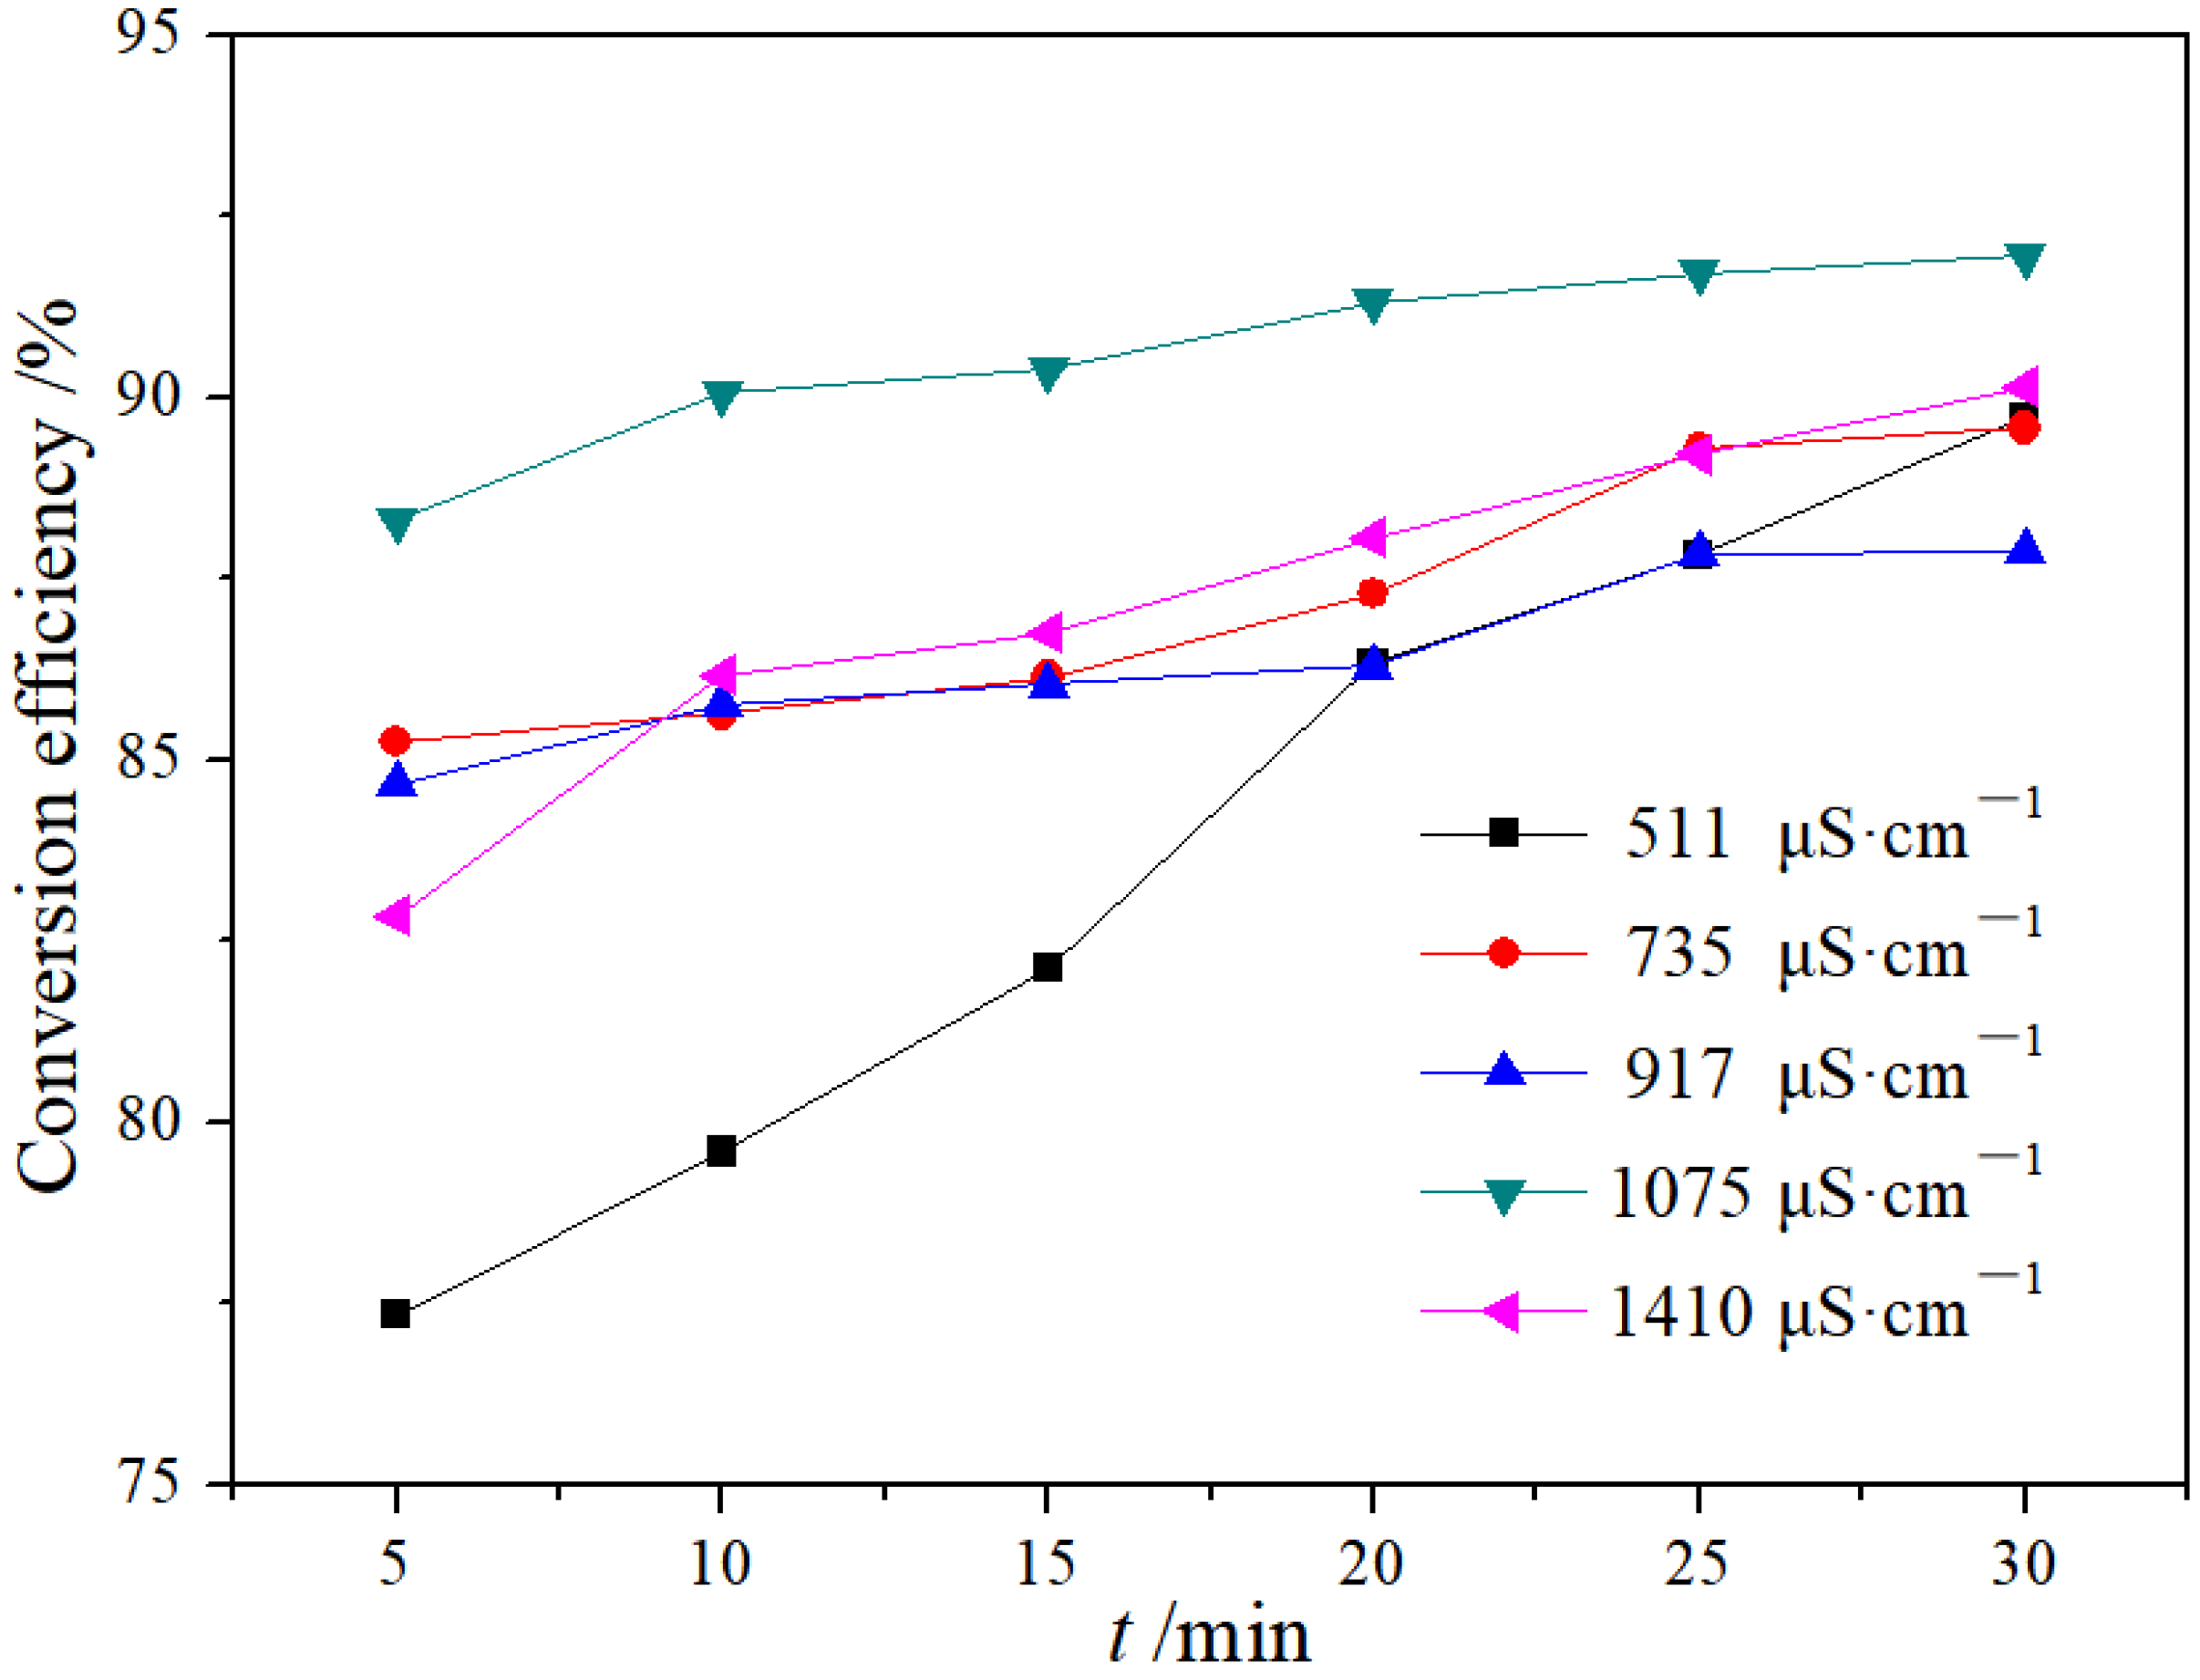
3.1.2. Effect of Conductivity
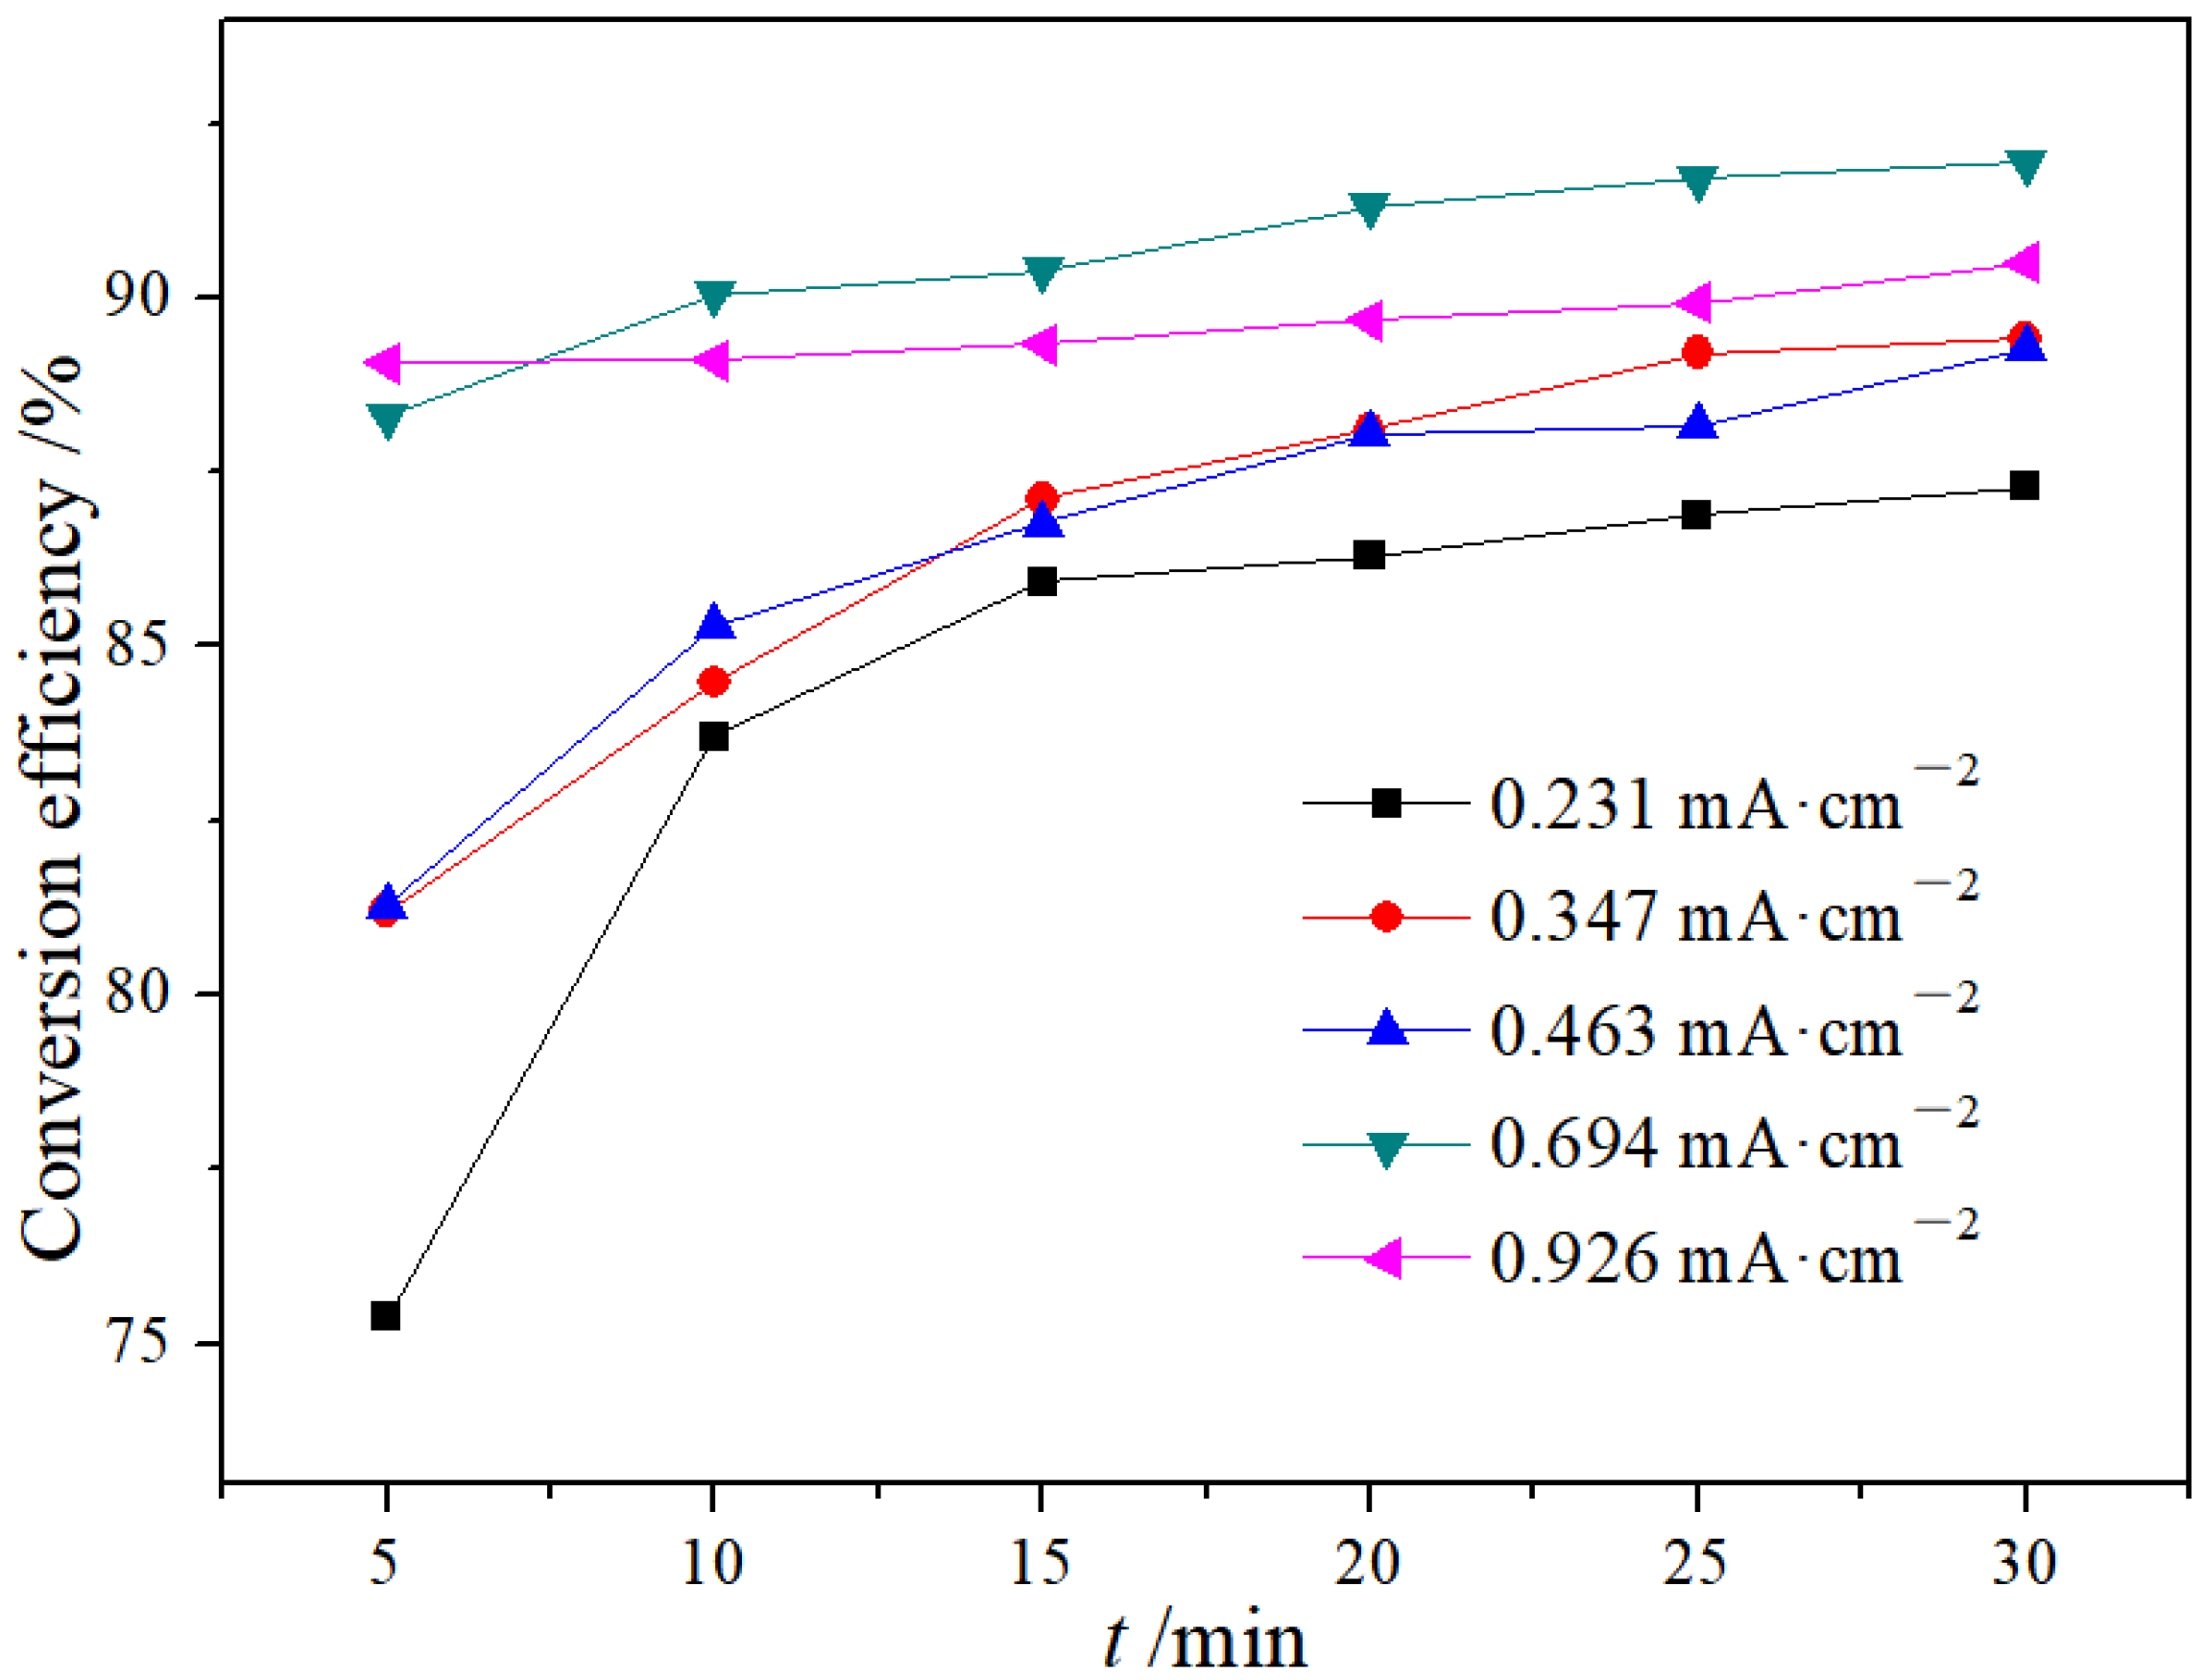
3.1.3. Effect of Current Density
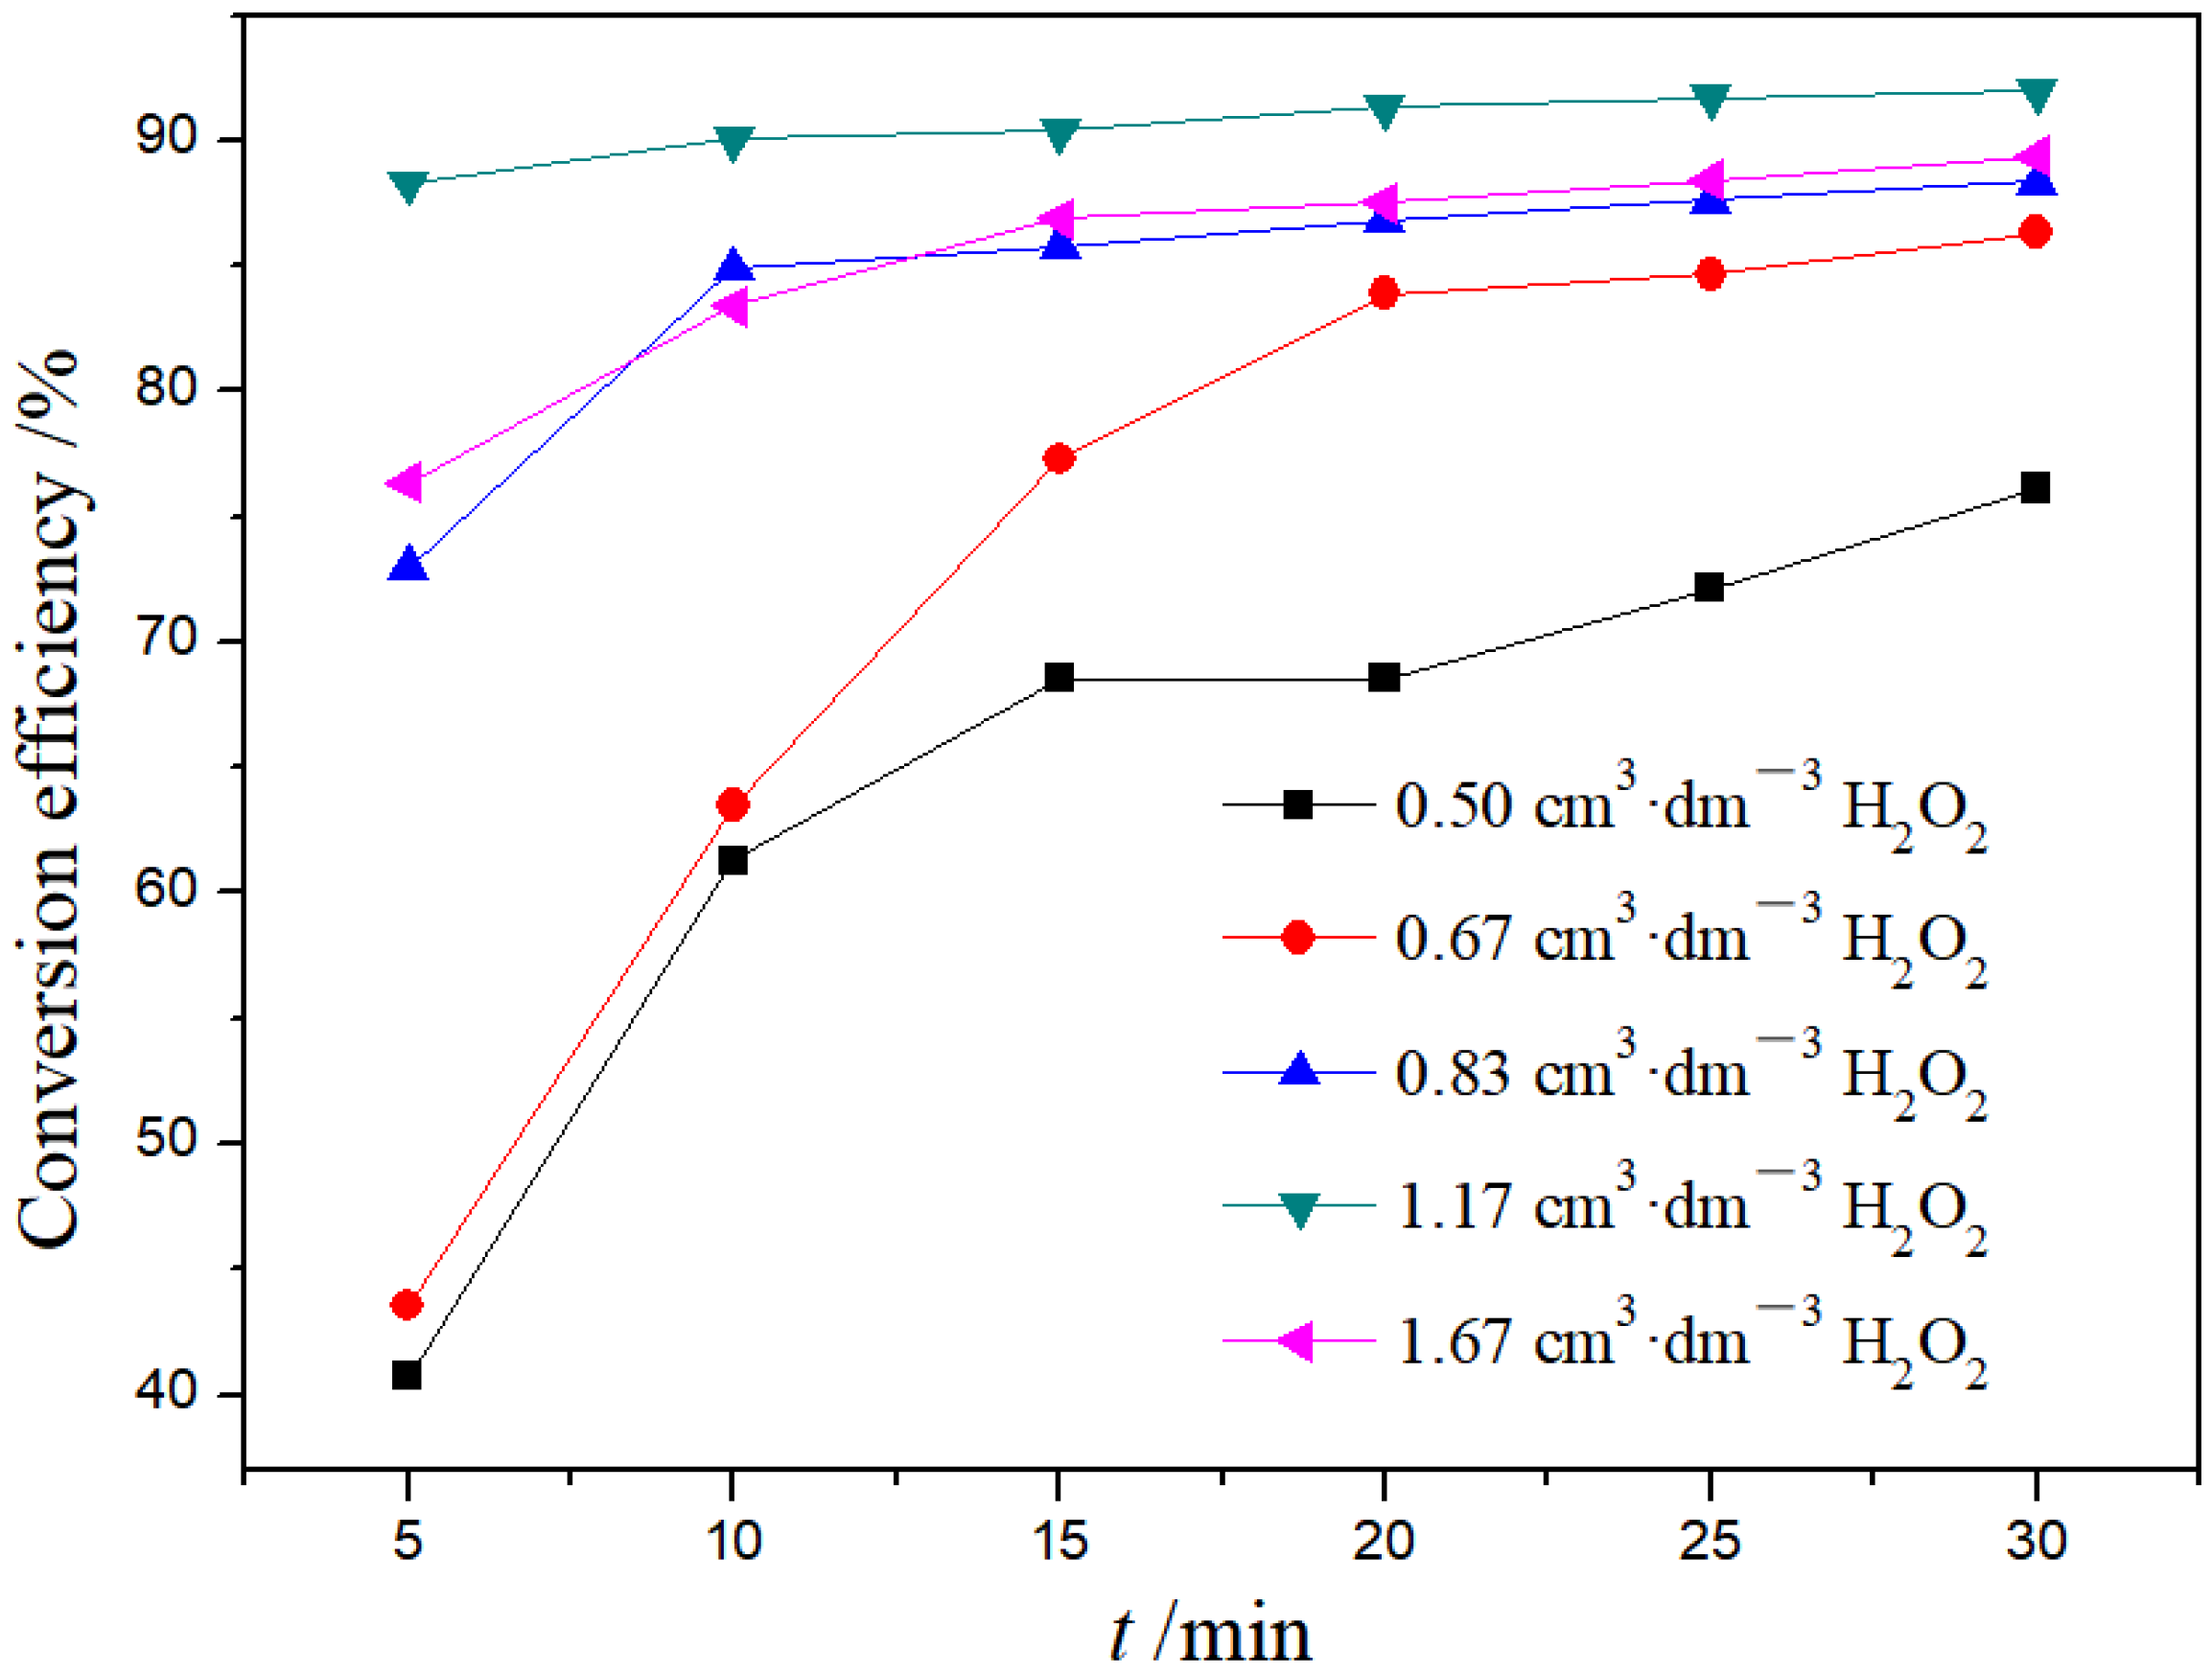
3.1.4. Effect of H2O2 Dosage
3.2. SAEF Process Analysis and Comparison
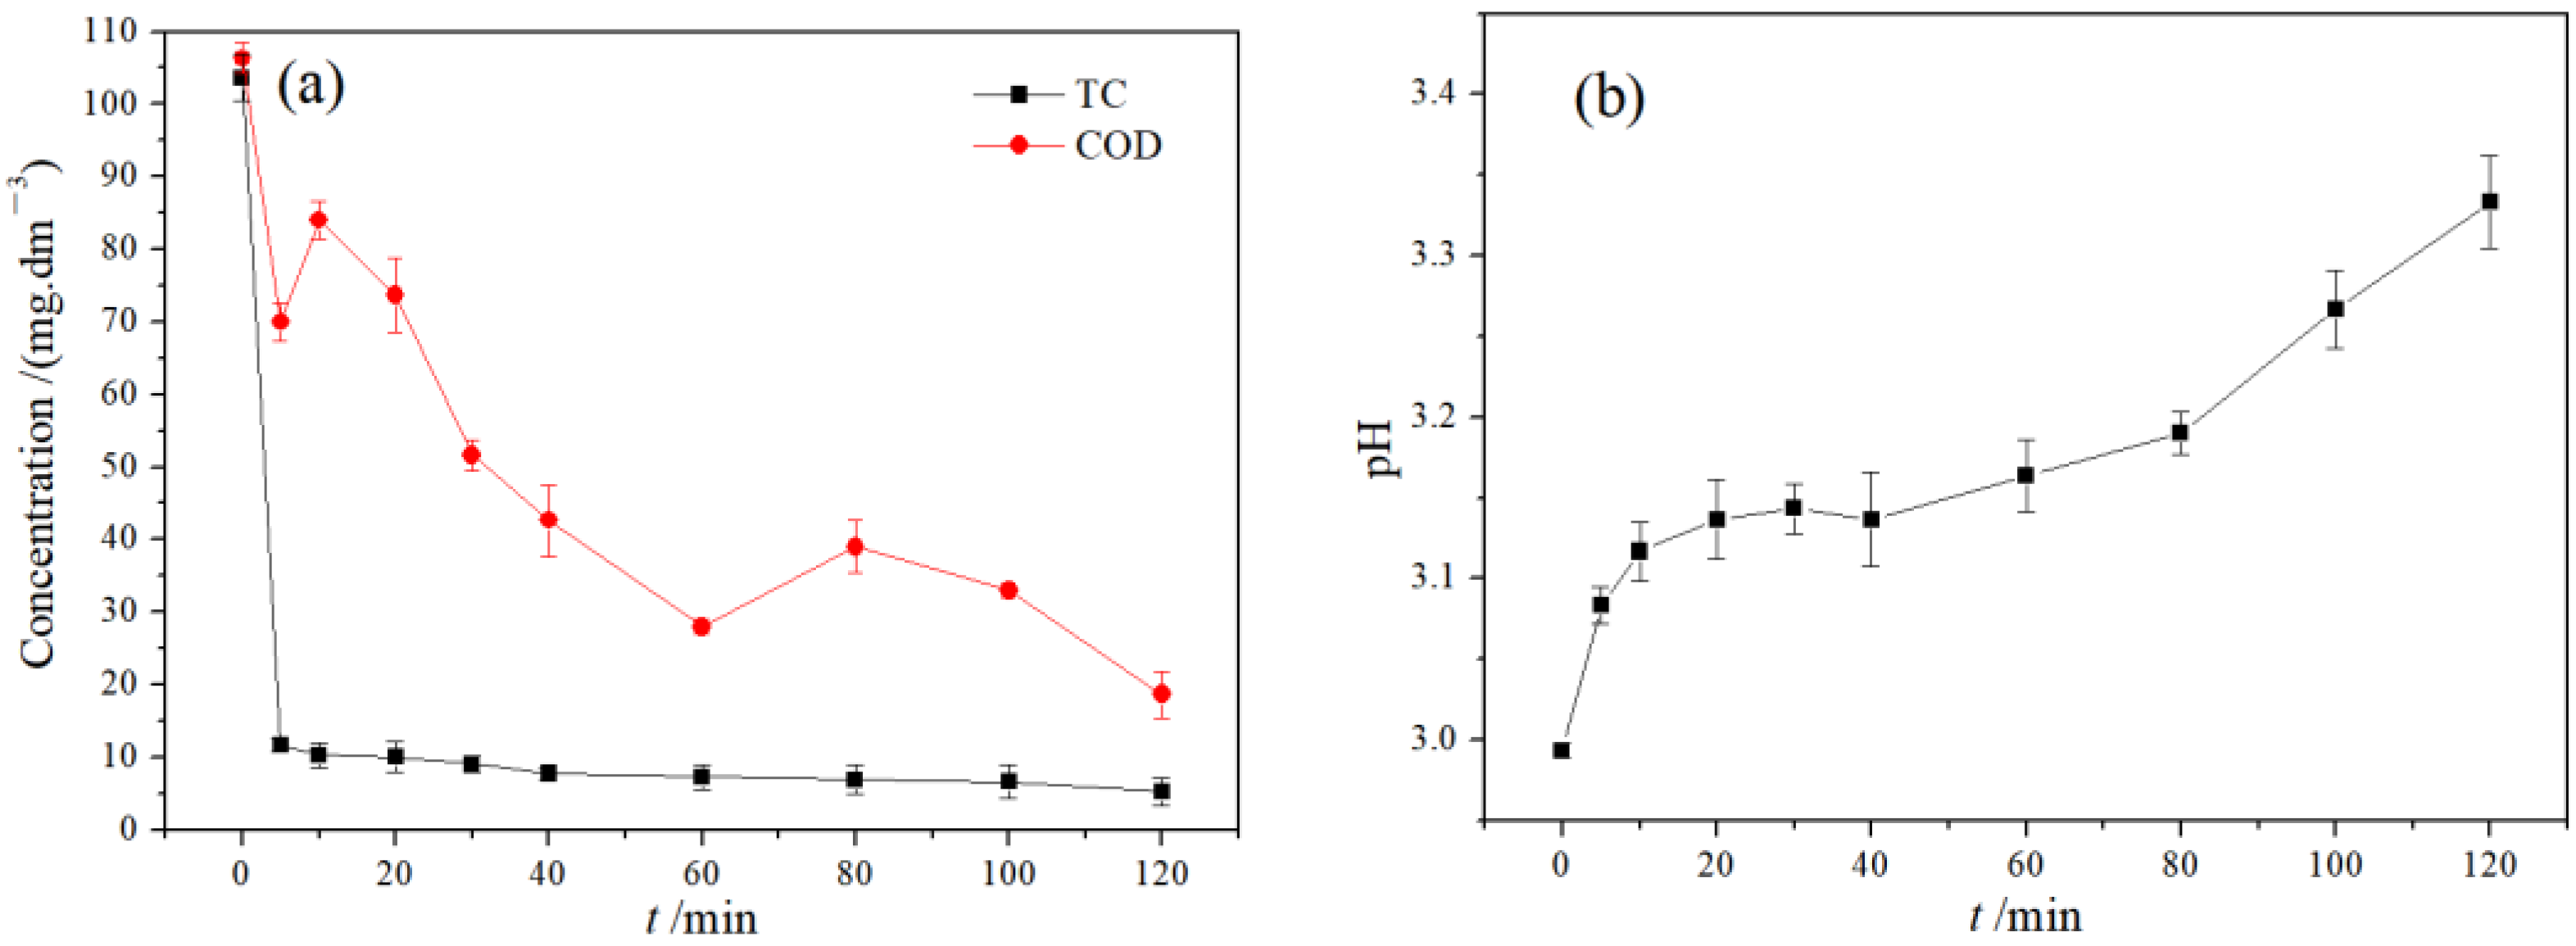
3.2.1. Analysis of Treatment Effect of SAEF Process
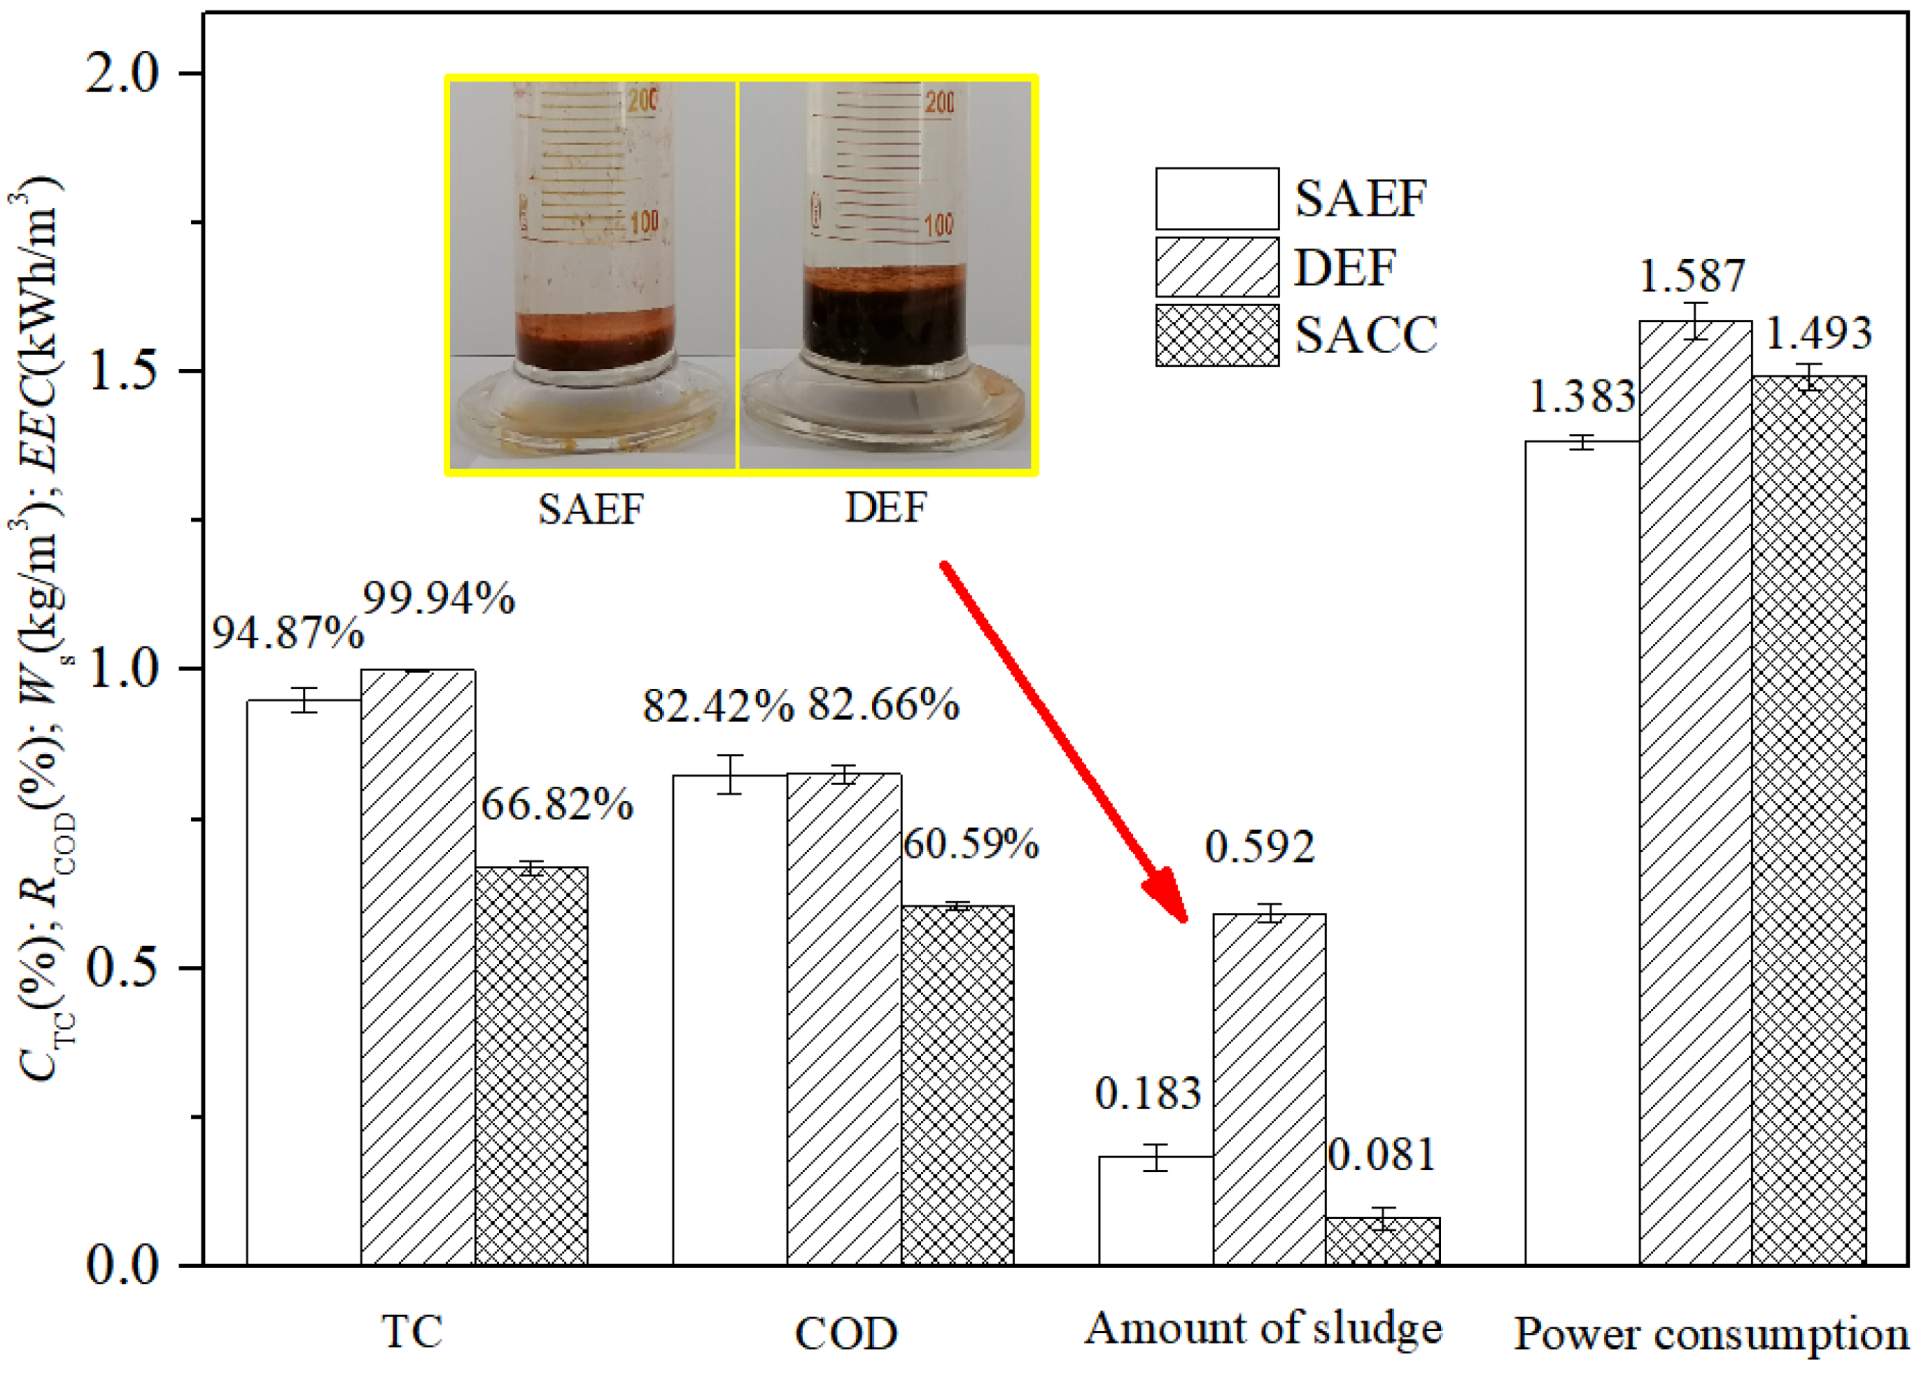
3.2.2. Comparison of Treatment Effects among SAEF, DEF and SACC
3.3. Characterization Analysis
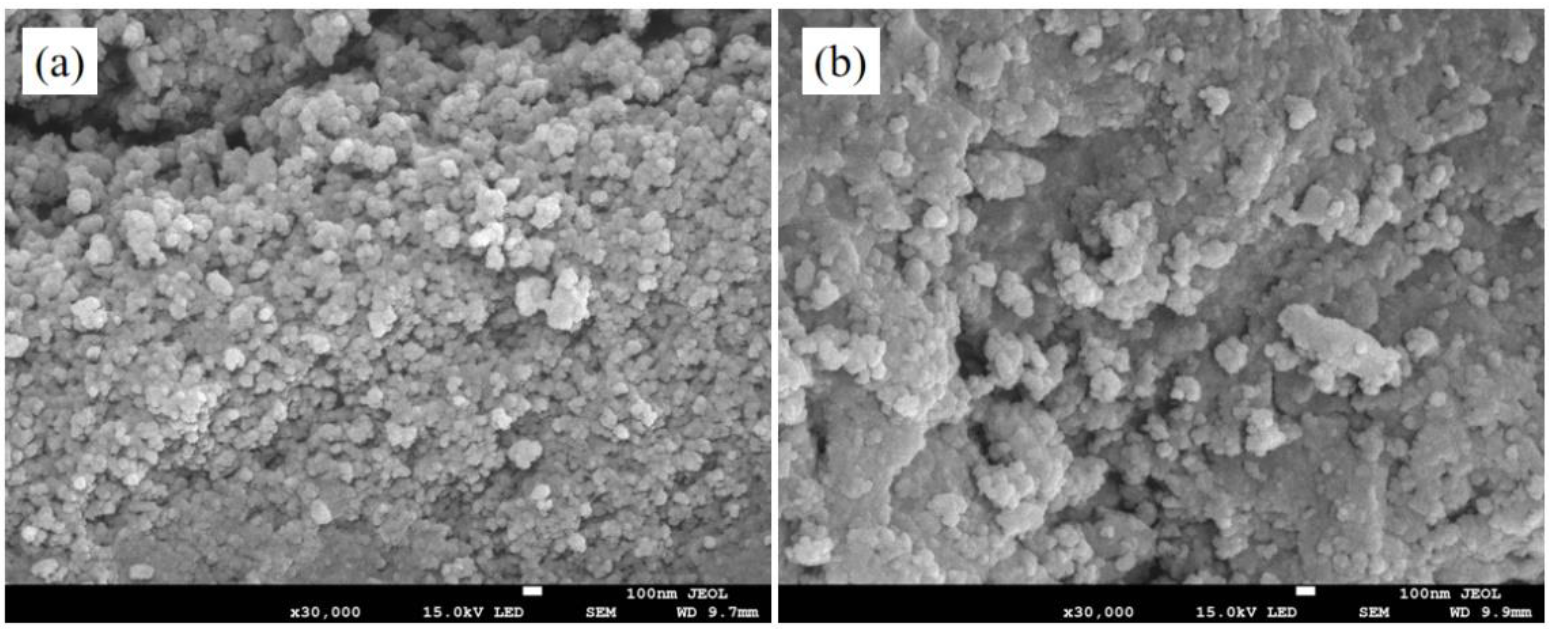
3.3.1. The SEM Analysis
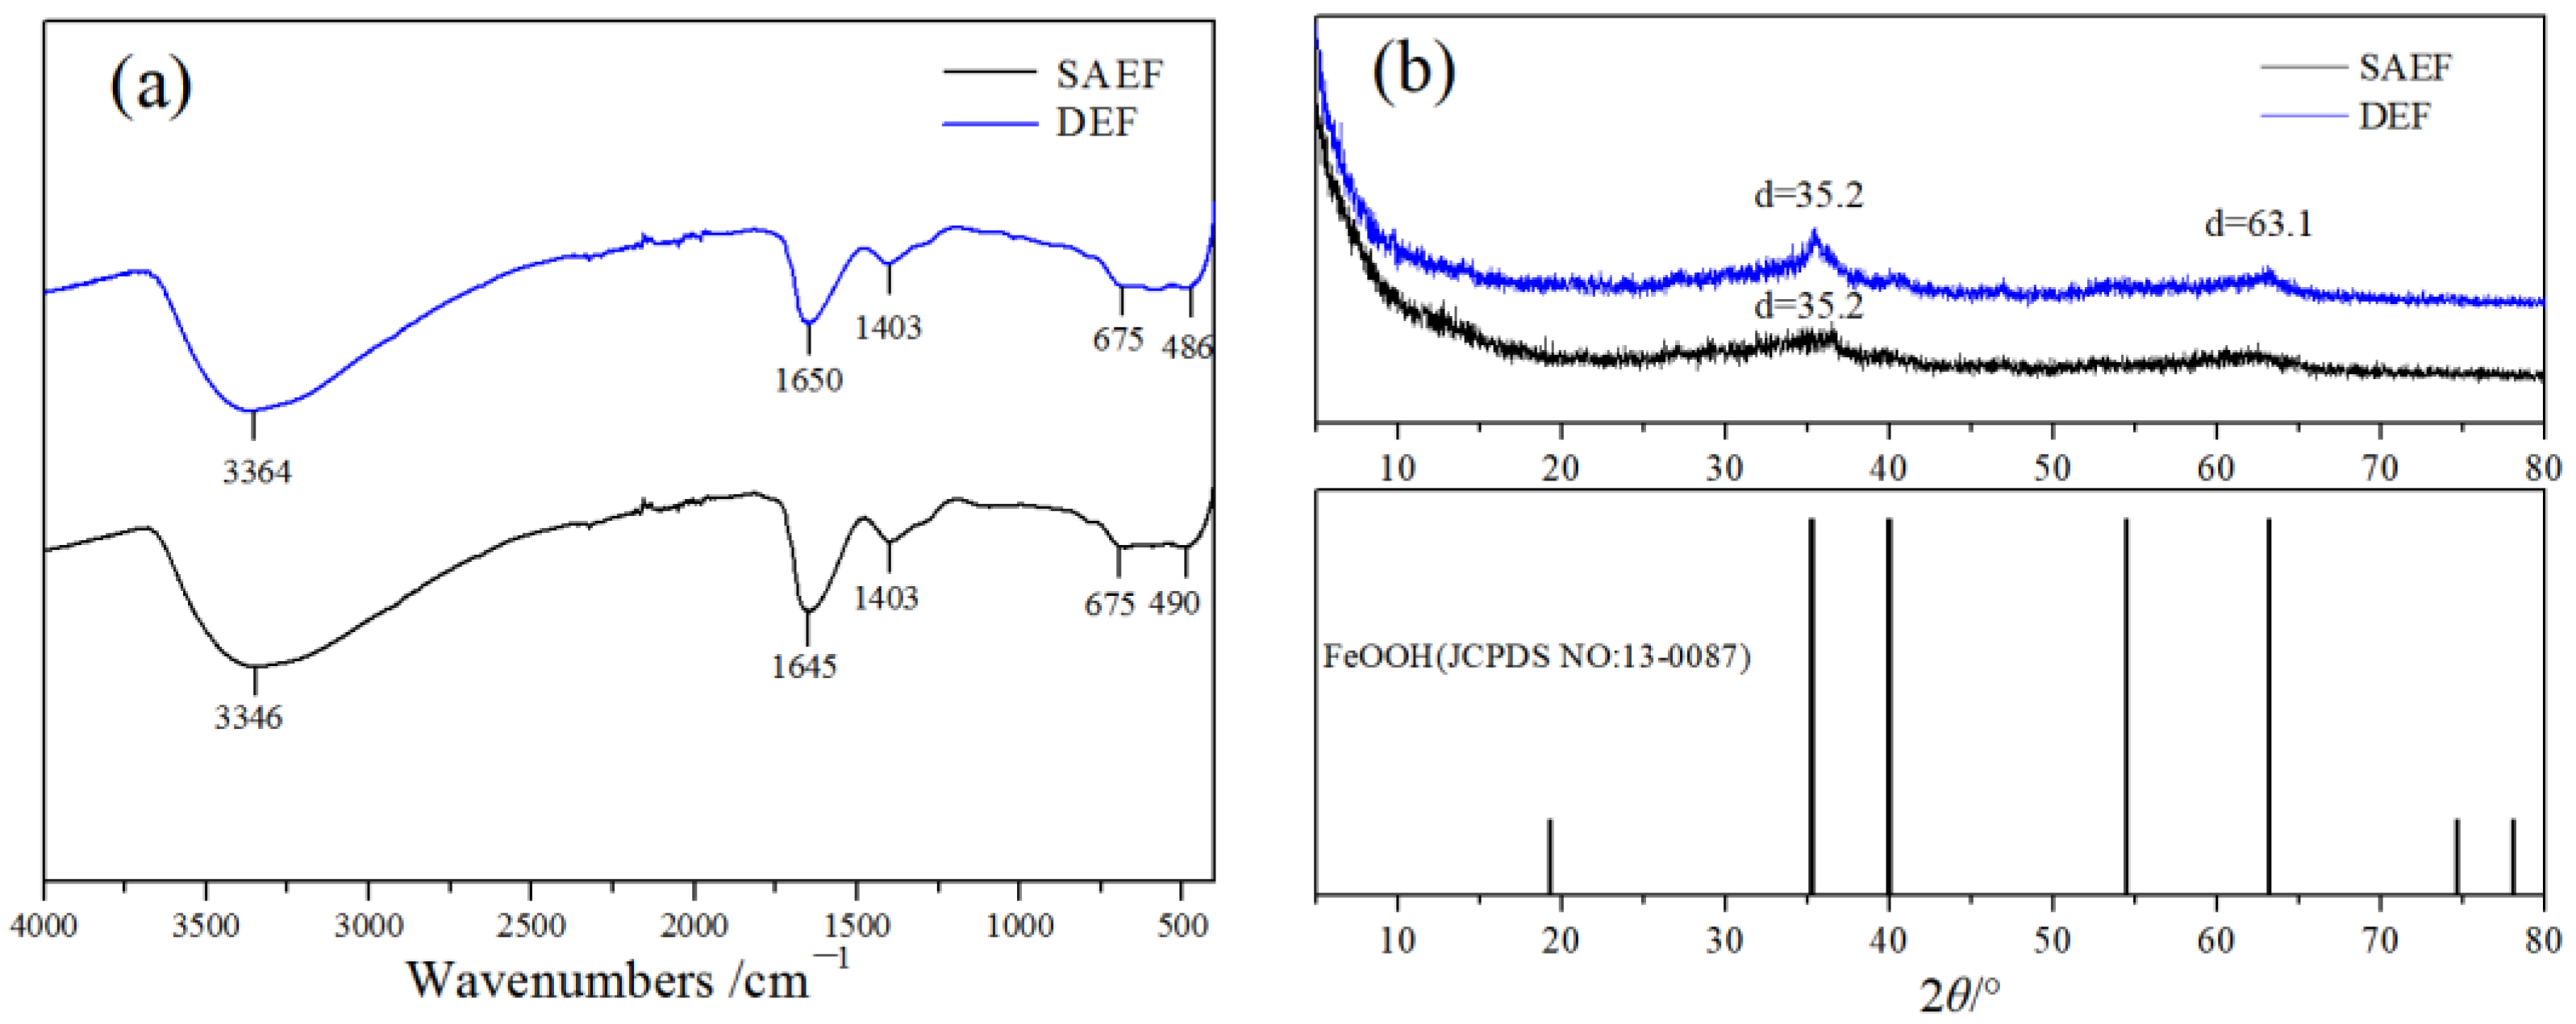
3.3.2. The FT-IR Analysis
3.3.3. The XRD Analysis
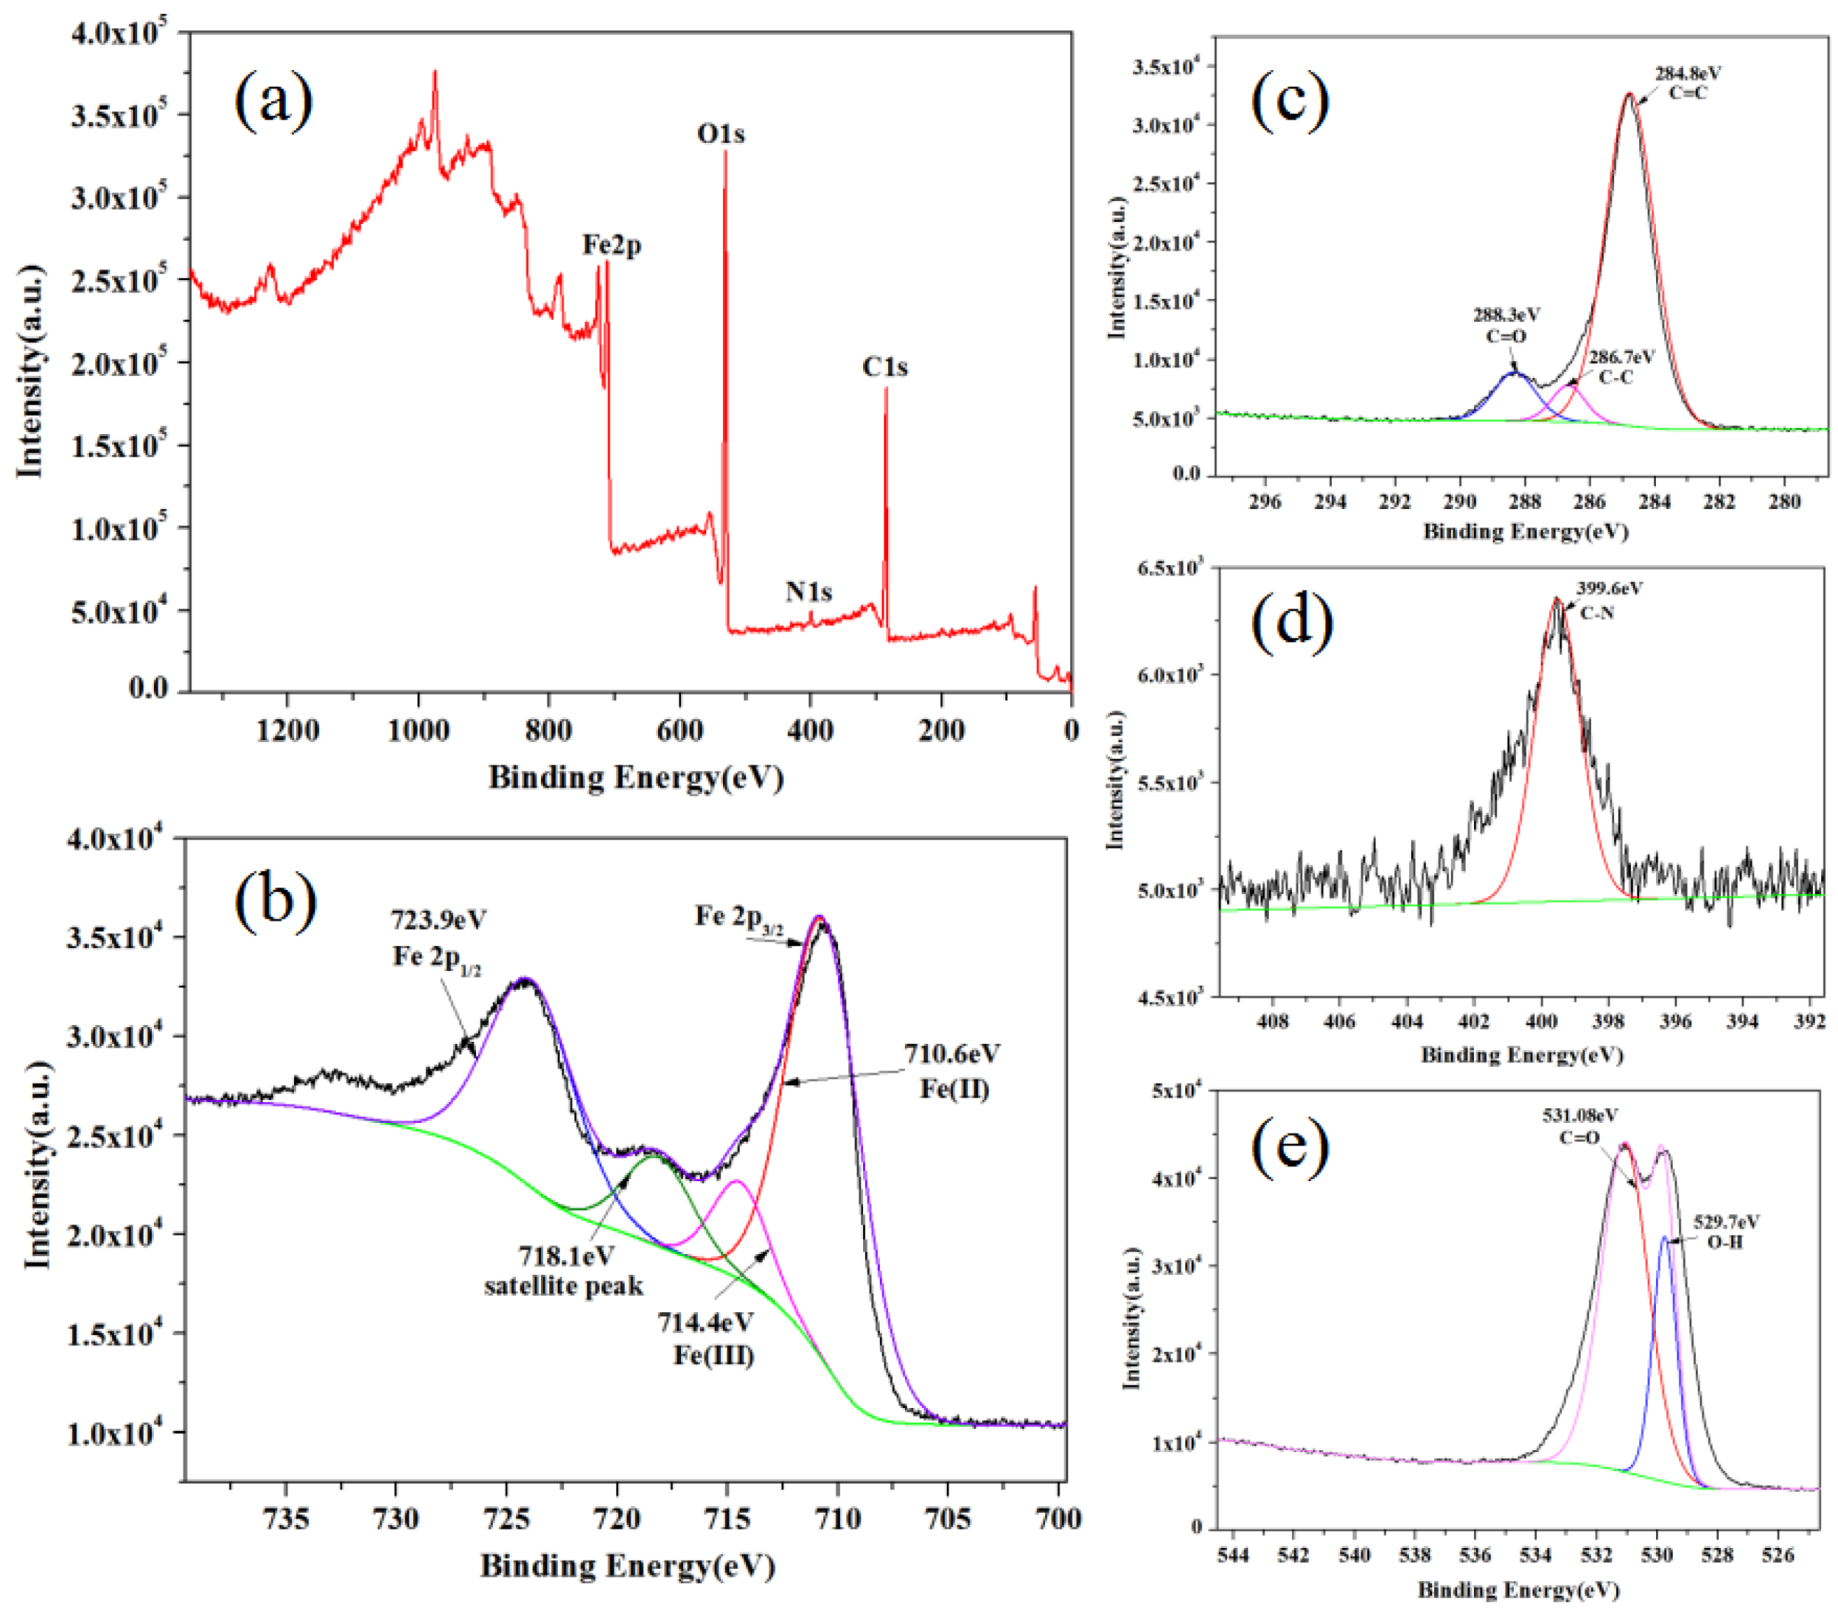
3.3.4. The XPS Analysis
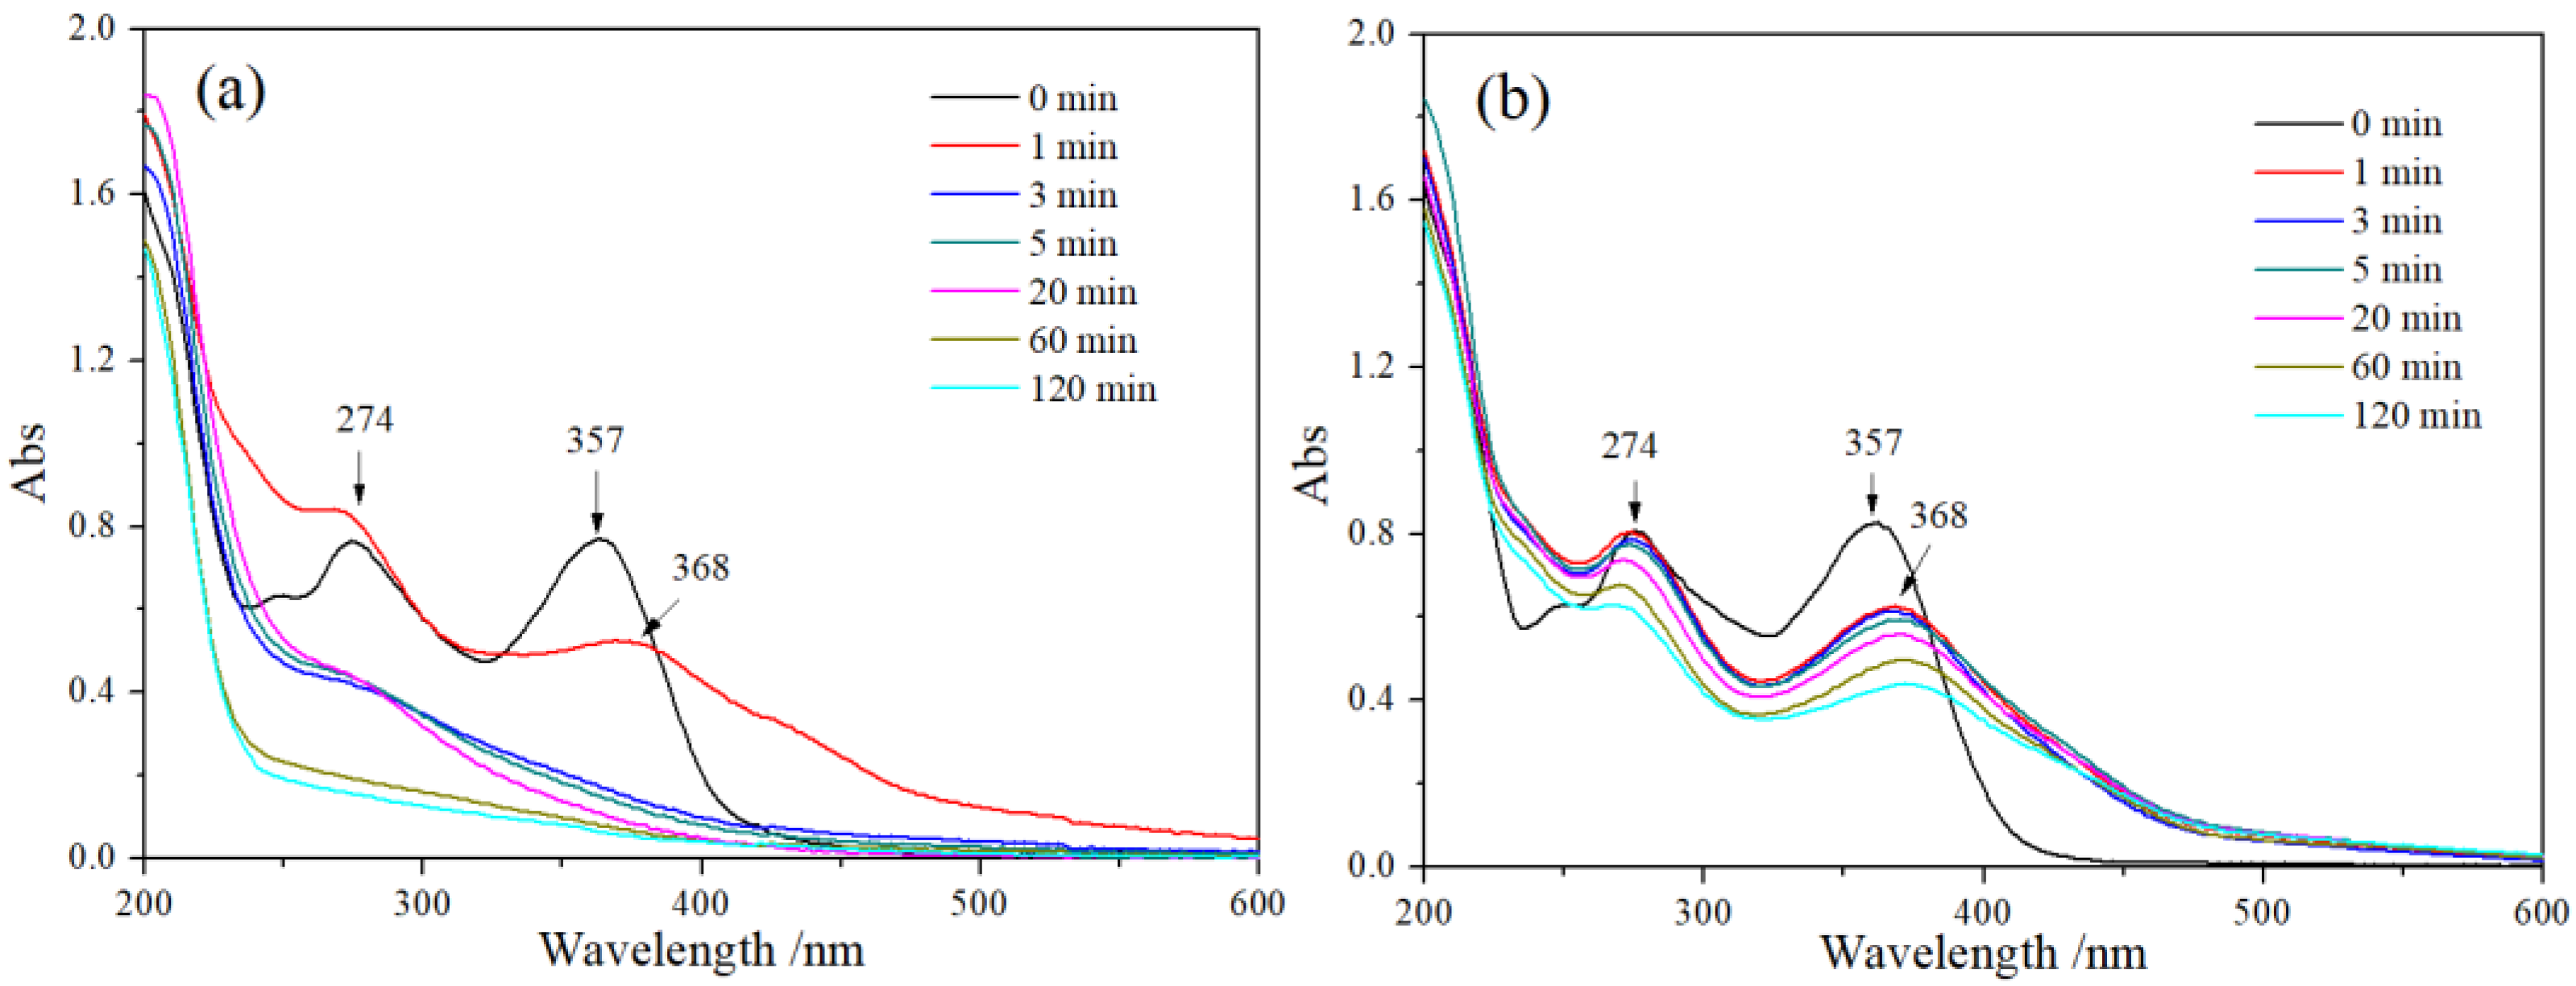
3.3.5. The UV-Vis Analysis
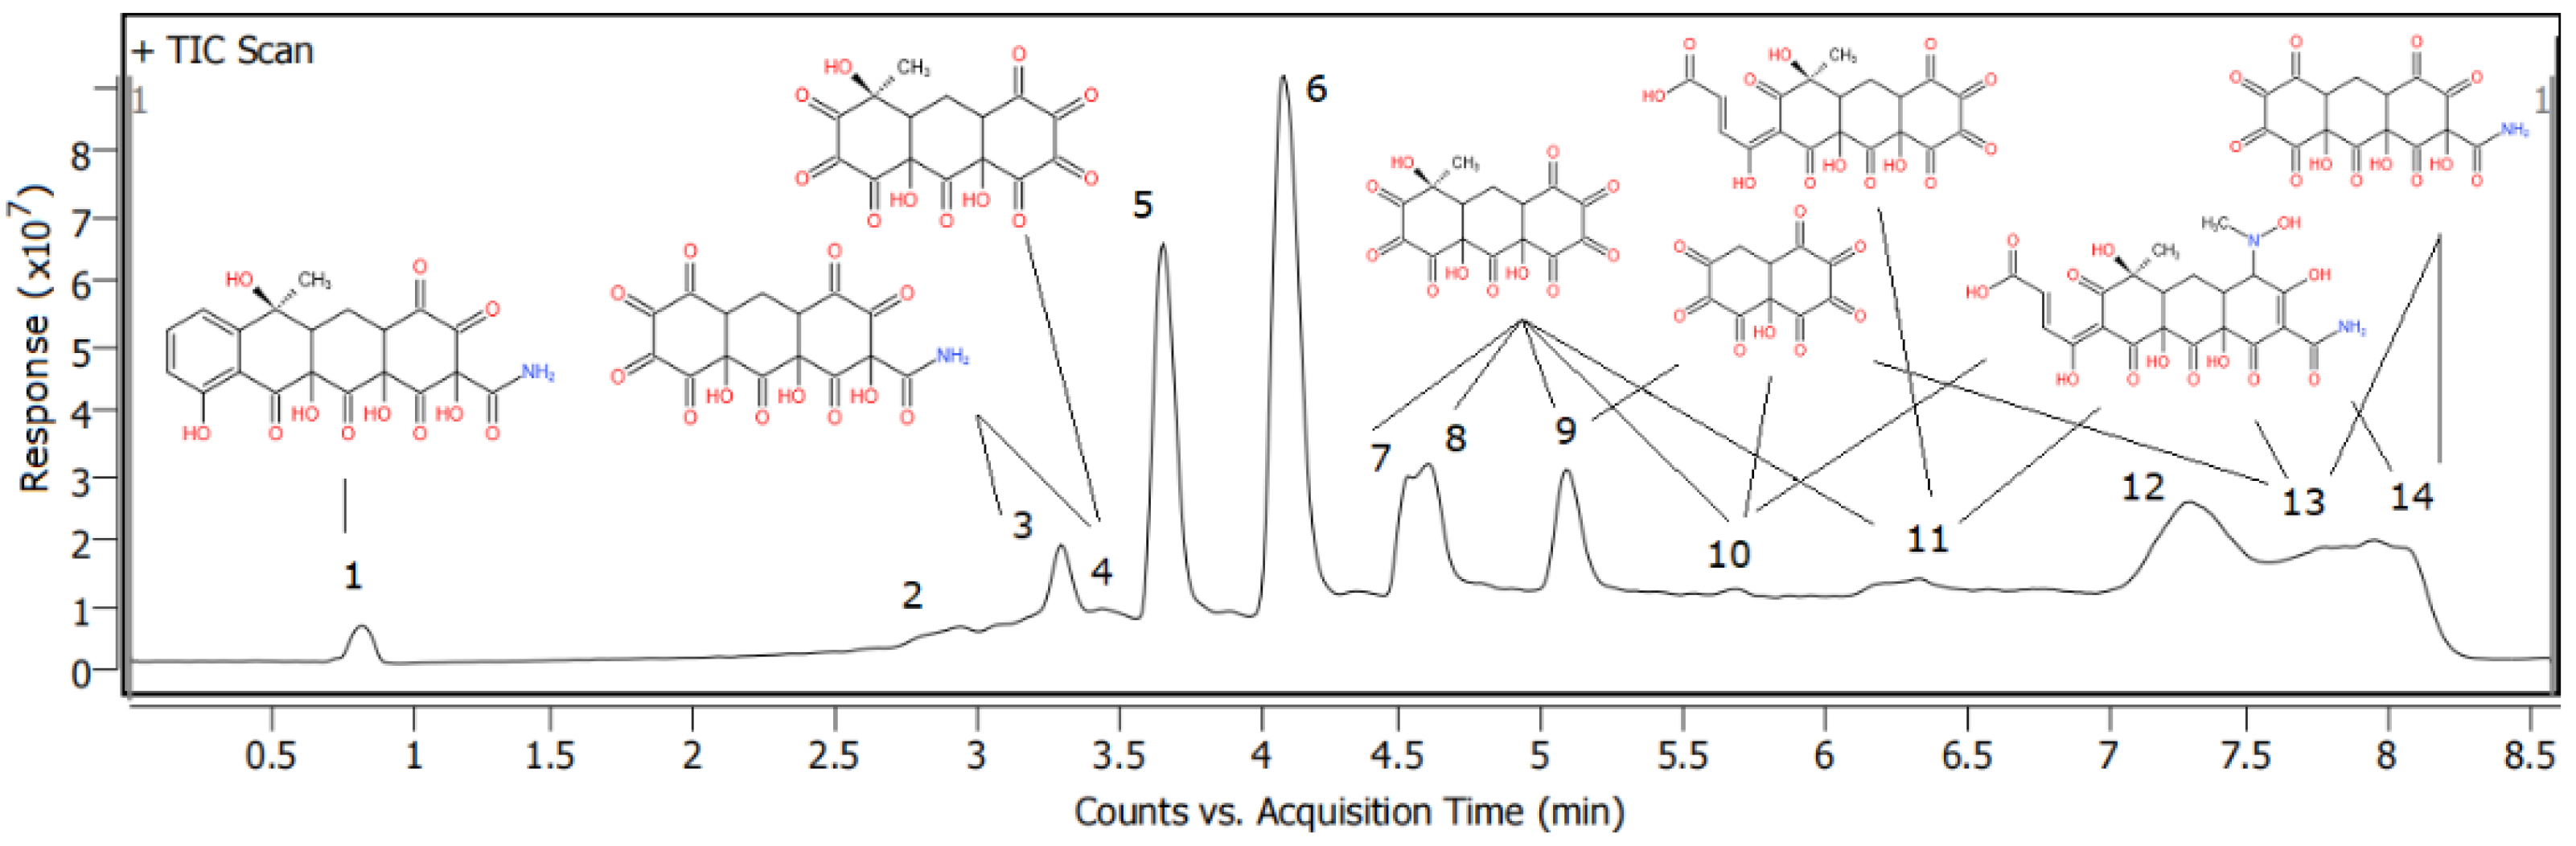
3.3.6. The LC-MS/MS Analysis
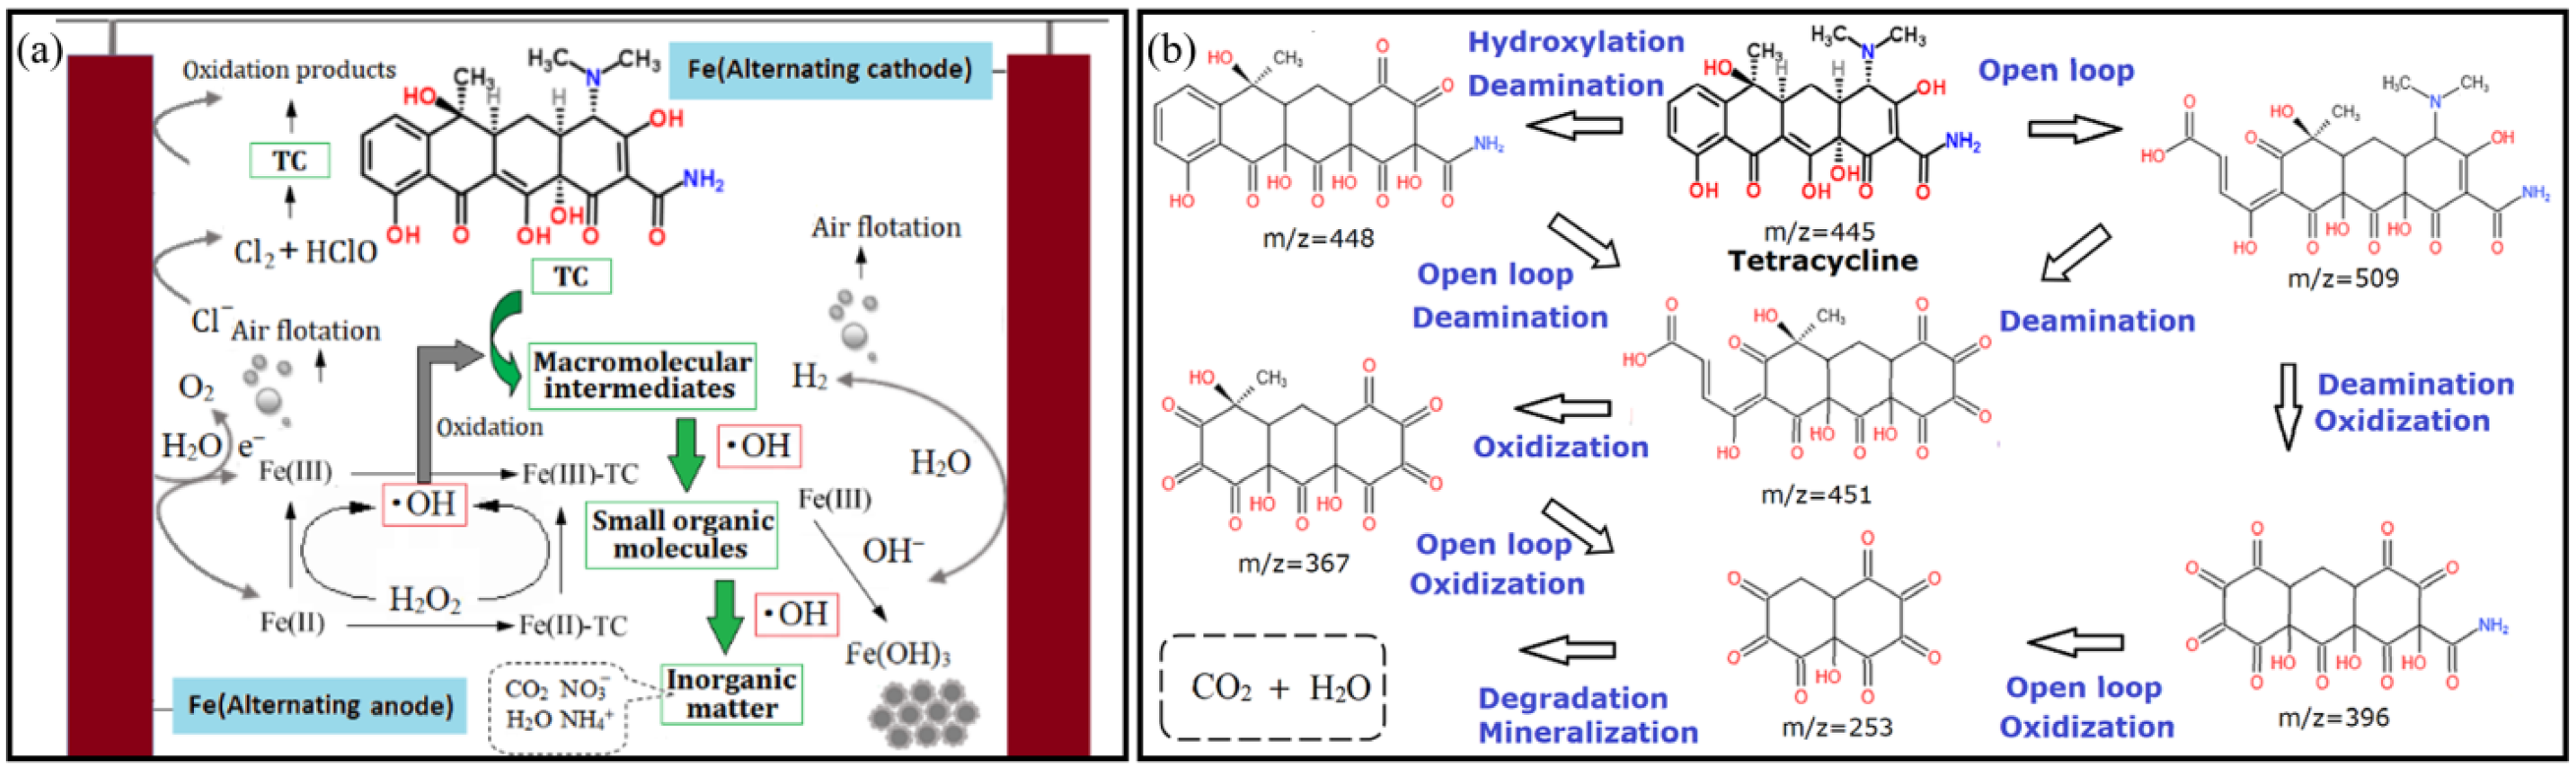
3.3.7. The Mechanism Analysis
4. Conclusions
Author Contributions
Funding
Institutional Review Board Statement
Informed Consent Statement
Data Availability Statement
Conflicts of Interest
References
- Naushad, M.; Sharma, G.; Alothman, Z. Photodegradation of toxic dye using Gum Arabic-crosslinked-poly(acrylamide)/Ni(OH)2/FeOOH nanocomposites hydrogel. J. Clean. Prod. 2019, 241, 118263. [Google Scholar] [CrossRef]
- Alqadami, A.; Khan, M.; Siddiqui, M.; Alothman, Z. Development of citric anhydride anchored mesoporous MOF through post synthesis modification to sequester potentially toxic lead (II) from water. Microporous Mesoporous Mater. 2018, 261, 198–206. [Google Scholar] [CrossRef]
- Ali, I.; Alharbi, O.; ALOthman, Z.; Al-Mohaimeed, A.; Alwarthan, A. Modeling of fenuron pesticide adsorption on CNTs for mechanistic insight and removal in water. Environ. Res. 2019, 170, 389–397. [Google Scholar] [CrossRef]
- ALOthman, Z. A Review: Fundamental Aspects of Silicate Mesoporous Materials. Materials 2012, 5, 2874–2902. [Google Scholar] [CrossRef] [Green Version]
- Mittal, A.; Naushad, M.; Sharma, G.; ALothman, Z.; Wabaidur, S.; Alam, M. Fabrication of MWCNTs/ThO2 nanocomposite and its adsorption behavior for the removal of Pb(II) metal from aqueous medium. Desalin. Water Treat. 2016, 57, 21863–21869. [Google Scholar] [CrossRef]
- Khana, M.; Alqadamia, A.; Wabaidura, S.; Siddiquia, M.; Jeonb, B.; Alshareefa, S.; Alothmana, Z.; Hamedelniela, A. Oil industry waste based non-magnetic and magnetic hydrochar to sequester potentially toxic post-transition metal ions from water. J. Hazard. Mater. 2020, 400, 123247. [Google Scholar] [CrossRef]
- Fu, Y.; Wang, Y.; Wang, X.; Wu, J.; Guo, Y.; Kang, H. Research on the UV/K2S2O8 coupled process for the degradation of tetracycline. Ind. Water Treat. 2017, 37, 47–50. [Google Scholar]
- Ihsanullah, I.; Khan, M.; Zubair, M.; Bilal, M.; Sajid, M. Removal of pharmaceuticals from water using sewage sludge-derived biochar: A review. Chemosphere 2022, 289, 133196. [Google Scholar] [CrossRef]
- Alothman, Z.; Bahkali, A.; Khiyami, M.; Alfadul, S.; Wabaidur, S.; Alam, M.; Alfarhan, B. Low cost biosorbents from fungi for heavy metals removal from wastewater. Sep. Sci. Technol. 2020, 55, 1766–1775. [Google Scholar] [CrossRef]
- Danner, M.-C.; Robertson, A.; Behrends, V.; Reiss, J. Antibiotic pollution in surface fresh waters: Occurrence and effects. Sci. Total Environ. 2019, 664, 793–804. [Google Scholar] [CrossRef]
- Skandalis, N.; Maeusli, M.; Papafotis, D.; Miller, S.; Lee, B.; Theologidis, L.; Luna, B. Environmental Spread of Antibiotic Resistance. Antibiotics 2021, 10, 640. [Google Scholar] [CrossRef] [PubMed]
- Wang, B.; Fang, Z. Pretreatment of tetracycline wastewater with anaerobic acidification process. J. Xi’an Univ. Arch. Technol. 1996, 28, 273–276. [Google Scholar]
- Ahmad, F.; Zhu, D.; Sun, J. Correction to: Environmental fate of tetracycline antibiotics: Degradation pathway mechanisms, challenges, and perspectives. Environ. Sci. Eur. 2021, 33, 71. [Google Scholar] [CrossRef]
- Si, L.; Hu, J. Photolytic and photocatalytic degradation of tetracycline: Effect of humic acid on degradation kinetics and mechanisms. J. Hazard. Mater. 2016, 318, 134–144. [Google Scholar]
- Yu, T.-H.; Lin, A.Y.-C.; Panchangam, S.C.; Hong, P.-K.A.; Yang, P.-Y.; Lin, C.-F. Biodegradation and bio-sorption of antibiotics and non-steroidal anti-inflammatory drugs using immobilized cell process. Chemosphere 2011, 84, 1216–1222. [Google Scholar] [CrossRef]
- Xu, Z.; Song, X.; Li, Y.; Li, G.; Luo, W. Removal of antibiotics by sequencing-batch membrane bioreactor for swine wastewater treatment. Sci. Total Environ. 2019, 684, 23–30. [Google Scholar] [CrossRef]
- Zheng, W.; Zhang, Z.; Liu, R.; Lei, Z. Removal of veterinary antibiotics from anaerobically digested swine wastewater using an intermittently aerated sequencing batch reactor. J. Environ. Sci. 2018, 65, 8–17. [Google Scholar] [CrossRef]
- Wang, Y.; Guan, Y.; Li, Y.; Li, Z.; Wan, J.; Zhang, Y.; Fu, J. High adsorption behavior and photoregeneration of modified graphite oxide-titanium dioxide nanocomposites for tetracycline removal in water. Process Saf. Environ. Prot. 2020, 149, 123–134. [Google Scholar] [CrossRef]
- He, Z.; Wang, X.; Luo, Y.; Zhu, Y.; Lai, X.; Shang, J.; Chen, J.; Liao, Q. Effects of suspended particulate matter from natural lakes in conjunction with coagulation to tetracycline removal from water. Chemosphere 2021, 277, 130327. [Google Scholar] [CrossRef]
- Lin, Y.; Tian, W.; Yang, Z.; Chen, Y.; Chen, Q.; Li, J. Advanced oxidation of olaquindox and tetracydline antibiotics in biogas slurry by microwave-fenton. Chin. J. Environ. Eng. 2013, 7, 164–168. [Google Scholar]
- Yang, P.; Ye, Y.; Yan, Z.; Li, Q.; Zhang, K.; Yang, Y.; Zhang, Q.; Yin, H.; Xia, D.; Pan, F. Efficient removal of tetracycline in water by a novel chemical and biological coupled system with non-woven cotton fabric as carrier. Chin. Chem. Lett. 2021, 9, 2823–2827. [Google Scholar] [CrossRef]
- Qian, M.; Yang, L.; Chen, X.; Li, K.; Shen, G. The treatment of veterinary antibiotics in swine wastewater by biodegradation and fenton-like oxidation. Sci. Total Environ. 2019, 710, 136299. [Google Scholar] [CrossRef] [PubMed]
- Pariyarath, R.V.; Inagaki, Y.; Sakakibara, Y. Phycoremediation of tetracycline via bio-Fenton process using diatoms. J. Water Process Eng. 2020, 40, 101851. [Google Scholar]
- Moussa, D.T.; El-Naas, M.H.; Nasser, M.; Al-Marri, M.J. A comprehensive review of electrocoagulation for water treatment: Potentials and challenges. J. Environ. Manag. 2017, 186, 24–41. [Google Scholar] [CrossRef]
- Kasmuri, N.; Adnan, N.; Ahmad, R.; Santiagoo, R.; Ramasamy, S. Heavy metals reduction using electrocoagulation in enhancing the water quality near unlined landfill: A case study. IOP Conf. Ser. Earth Environ. Sci. 2021, 646, 012003. [Google Scholar] [CrossRef]
- Andreatta, D.; Shonza, N.S.; Muniz, E.P.; Bacelos, M.S.; Dalmaschio, C.J.; Porto, P.S. Tangential effluent inlet in a cylindrical electrocoagulation reactor containing curved electrodes, and its use in crude oil in water treatment. Environ. Technol. 2021, 1–11. [Google Scholar] [CrossRef]
- Mousazadeh, M.; Alizadeh, S.M.; Frontistis, Z.; Kabdaslı, I.; Niaragh, E.K.; Qodah, Z.A.; Naghdali, Z.; Mahmoud, A.E.D.; Sandoval, M.A.; Butler, E.; et al. Electrocoagulation as a Promising Defluoridation Technology from Water: A Review of State of the Art of Removal Mechanisms and Performance Trends. Water 2021, 13, 656. [Google Scholar] [CrossRef]
- Baran, W.; Adamek, E.; Jajko, M.; Sobczak, A. Removal of veterinary antibiotics from wastewater by electrocoagulation. Chemosphere 2017, 194, 381–389. [Google Scholar] [CrossRef]
- Ouaissa, Y.A.; Chabani, M.; Amrane, A.; Bensmaili, A. Removal of tetracycline by electrocoagulation: Kinetic and isotherm modeling through adsorption. J. Environ. Chem. Eng. 2014, 2, 177–184. [Google Scholar] [CrossRef] [Green Version]
- Lu, J.; Zhang, W.; Zhang, X.; Si, G.; Zhang, P.; Li, B.; Su, R.; Gao, X. Efficient Removal of Tetracycline-Cu Complexes from Water by Electrocoagulation Technology. J. Clean. Prod. 2020, 289, 125729. [Google Scholar] [CrossRef]
- Gao, X.; Lyu, J.; Su, R.; Hao, Y.; Yang, J.; Sun, L. Performance and mechanism of electrocoagulation process for tetracycline removal from water. Chin. J. Environ. Eng. 2019, 13, 826–834. [Google Scholar]
- Zhou, Y.; Xu, T.; Ou, L.; Zou, G.; Lei, X.; Hu, B.; Yu, G. Treatment of Zn2+ in wastewater by sinusoidal alternating current coagulation: Response surface methodology and removal mechanism. Water Sci. Technol. 2020, 82, 1950–1960. [Google Scholar] [CrossRef] [PubMed]
- Zhou, Y.; Chen, S.; Qiu, J.; Zhu, C.; Xu, T.; Zeng, M.; He, X.; Hu, B.; Zhang, X.; Yu, G. Removal of phosphorus in wastewater by sinusoidal alternating current coagulation: Performance and mechanism. Environ. Technol. 2021, 1–14. [Google Scholar] [CrossRef] [PubMed]
- Xu, T.; Zhou, Y.; Hu, B.; Lei, X.; Yu, G. Comparison between sinusoidal AC coagulation and conventional DC coagulation in removing Cu2+ from printed circuit board wastewater. Ecotoxicol. Environ. Saf. 2020, 197, 110629. [Google Scholar] [CrossRef]
- Xu, T.; Zhou, Y.; Lei, X.; Hu, B.; Chen, H.; Yu, G. Study on highly efficient Cr(VI) removal from wastewater by sinusoidal alternating current coagulation. J. Environ. Manag. 2019, 249, 109322. [Google Scholar] [CrossRef]
- Kong, X.; Zhou, Y.; Xu, T.; Hu, B.; Lei, X.; Chen, H.; Yu, G. A novel technique of COD removal from electroplating wastewater by Fenton—alternating current electrocoagulation. Environ. Sci. Pollut. Res. 2020, 27, 15198–15210. [Google Scholar] [CrossRef]
- AlFaris, N.; Wabaidur, S.; Alothman, Z.; Altamimi, J.; Aldayel, T. Fast and efficient immunoaffinity column cleanup and liquid chromatography–tandem mass spectrometry method for the quantitative analysis of aflatoxins in baby food and feeds. J. Sep. Sci. 2020, 43, 2079–2087. [Google Scholar] [CrossRef]
- AlFaris, N.; ALTamimi, J.; ALOthman, Z.; Wabaidur, S.; Ghafar, A.; Aldayel, T. Development of a sensitive liquid-liquid extraction and ultra-performance liquid chromatography-tandem mass spectrometry method for the analysis of carbaryl residues in fresh vegetables sold in Riyadh. J. King Saud Univ. -Sci. 2020, 32, 2414–2418. [Google Scholar] [CrossRef]
- Kenawy, E.; Ghfar, A.; Wabaidur, S.; Khan, S.; Siddiqui, M.; Alothman, Z.; Alqadami, A.; Hamid, M. Cetyltrimethylammonium bromide intercalated and branched polyhydroxystyrene functionalized montmorillonite clay to sequester cationic dyes. J. Environ. Manag. 2018, 219, 285–293. [Google Scholar] [CrossRef]
- Xu, T.; Zheng, X.; Zhou, Y.; Zhu, C.; Hu, B.; Lei, X.; Zhang, X.; Yu, G. Study on the treatment of Cu2+-organic compound wastewater by electro-Fenton coupled pulsed AC coagulation. Chemosphere 2021, 280, 130679. [Google Scholar] [CrossRef]
- Orts, F. Study of the Reuse of Industrial Wastewater After Electrochemical Treatment of Textile Effluents without External Addition of Chloride. Int. J. Electrochem. Sci. 2019, 14, 1733–1750. [Google Scholar] [CrossRef]
- Lu, M.C.; Lin, C.J.; Liao, C.H.; Ting, W.P.; Huang, R.Y. Influence of pH on the dewatering of activated sludge by Fenton’s reagent. Water Sci. Technol. 2001, 44, 327–332. [Google Scholar] [CrossRef] [PubMed]
- Gatsios, E.; Hahladakis., J.N.; Gidarakos, E. Optimization of electrocoagulation (EC) process for the purification of a real industrial wastewater from toxic metals. J. Environ. Manag. 2015, 154, 117–127. [Google Scholar] [CrossRef] [PubMed]
- Wabaidur, S.; Khan, M.; Siddiqui, M.; Otero, M.; Jeon, B.; Alothman, Z.; Hakami, A. Oxygenated functionalities enriched MWCNTs decorated with silica coated spinel ferrite—A nanocomposite for potentially rapid and efficient de-colorization of aquatic environment. J. Mol. Liq. 2020, 317, 113916. [Google Scholar] [CrossRef]
- Suzuki, T.; Inoue, S.; Ando, Y. Catalytic effect of different forms of iron in purification of single-walled carbon nanotubes. J. Nanosci. Nanotechnol. 2010, 10, 3924–3928. [Google Scholar] [CrossRef]
- Zhou, D.; Jie, W.; Hou, L.; Xu, J.; Zhao, Y. Photochemistry of Fe(III)-Tetracycline Complexes in Aqueous Solution under UV Irradiation. In Proceedings of the IEEE 2012 Third International Conference on Digital Manufacturing and Automation (ICDMA 2012), Guilin, China, 31 July–2 August 2012; pp. 608–611. [Google Scholar]

| Serial Number | m/z | Ion Mass-to-Charge Ratio | Molecular Formula | Structural Formula | Peak Position |
|---|---|---|---|---|---|
| 1 | 509 | 491, 447 | C22H24O12N2 | 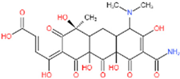 | 10, 11, 13, 14 |
| 2 | 448 | 430, 413 | C20H17O11N | 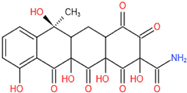 | 1 |
| 3 | 451 | 433, 417 | C19H14O13 |  | 11 |
| 4 | 396 | 379, 361 | C15H9O12N | 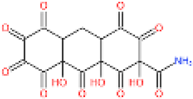 | 3, 4, 7, 8, 9, 10, 11, 13, 14 |
| 5 | 367 | 349 | C15H10O11 | 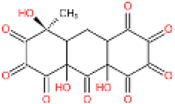 | 4 |
| 6 | 253 | 235 | C10H4O8 | 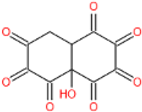 | 9,10,13 |
Publisher’s Note: MDPI stays neutral with regard to jurisdictional claims in published maps and institutional affiliations. |
© 2022 by the authors. Licensee MDPI, Basel, Switzerland. This article is an open access article distributed under the terms and conditions of the Creative Commons Attribution (CC BY) license (https://creativecommons.org/licenses/by/4.0/).
Share and Cite
Zhou, Y.; Hu, B.; Zhuang, X.; Qiu, J.; Xu, T.; Zeng, M.; He, X.; Yu, G. Investigation on Mechanism of Tetracycline Removal from Wastewater by Sinusoidal Alternating Electro-Fenton Technique. Sustainability 2022, 14, 2328. https://doi.org/10.3390/su14042328
Zhou Y, Hu B, Zhuang X, Qiu J, Xu T, Zeng M, He X, Yu G. Investigation on Mechanism of Tetracycline Removal from Wastewater by Sinusoidal Alternating Electro-Fenton Technique. Sustainability. 2022; 14(4):2328. https://doi.org/10.3390/su14042328
Chicago/Turabian StyleZhou, Yihui, Bonian Hu, Xiaojie Zhuang, Jinxian Qiu, Tao Xu, Muping Zeng, Xi He, and Gang Yu. 2022. "Investigation on Mechanism of Tetracycline Removal from Wastewater by Sinusoidal Alternating Electro-Fenton Technique" Sustainability 14, no. 4: 2328. https://doi.org/10.3390/su14042328
APA StyleZhou, Y., Hu, B., Zhuang, X., Qiu, J., Xu, T., Zeng, M., He, X., & Yu, G. (2022). Investigation on Mechanism of Tetracycline Removal from Wastewater by Sinusoidal Alternating Electro-Fenton Technique. Sustainability, 14(4), 2328. https://doi.org/10.3390/su14042328