Article

Use of Triangulation in Comparing the Blockchain Knowledge Structure between China and South Korea: Scientometric Network, Topic Modeling, and Prediction Technique

1
Blockchian Policy Research Center, Cyber Emotions Research Institute, Yeungnam University, Gyeongsan-si 38541, Korea
2
Department of Media and Communication, Yeungnam University, Gyeongsan-si 38541, Korea
3
Interdisciplinary Graduate Programs of Digital Convergence Business, Yeungnam University, Gyeongsan-si 38541, Korea
4
Interdisciplinary Graduate Programs of East Asian Cultural Studies, Yeungnam University, Gyeongsan-si 38541, Korea
*
Authors to whom correspondence should be addressed.
Sustainability 2022, 14(4), 2326; https://doi.org/10.3390/su14042326
Submission received: 25 January 2022 / Revised: 11 February 2022 / Accepted: 16 February 2022 / Published: 18 February 2022
(This article belongs to the Section Sustainable Management)

Abstract

:
Blockchain, as a new innovative technology, has become a popular topic in many fields in recent years. In this study, triangulation was used to investigate the development of knowledge structures. First, scientometric network analysis was employed to identify the cooperation of knowledge networks. It was found that the structure of blockchain knowledge networks in China is relatively more complex and diverse than in South Korea. Since increased teamwork in blockchain is conducive to the creation of high-quality knowledge products, the Chinese government appears to strongly promote diversified cooperation on blockchain technology through centralized policies. Second, machine-learning topic modeling was used to analyze the content exchanged via a collaborative network. As a result, it was found that both countries lacked the societal and commercial aspects of blockchain technology. Finally, we developed a prediction technique based on the Ernie model to automatically categorize the nature of blockchain research.

1. Introduction

In recent years, blockchain has been frequently utilized owing to its advantages in terms of data security and decentralized identification systems [1]. As blockchain technology matures, cryptocurrencies and many other industries are starting to use this technology [2]. Changes in industrial patterns will lead to changes in social patterns [3,4]. Since Nakamoto (2008) proposed the concept of blockchain in financial systems [5], a mixed evaluation of the future of blockchain has existed. Nonetheless, many countries have recognized the blockchain as an emerging technology and promoted its development to build a “smart society” [4,6]. Blockchains are particularly active in Asian countries. According to BlockData, in 2019, more than 60% of more than 8000 global blockchain projects occurred in Asia [7].
China and South Korea have often been known as the hubs of the cryptocurrency market and blockchain-related projects [4,8]. In 2020, the South Korean government reported that it would test digital currency with the official launch of the central bank in 2021. China has already launched a central digital currency in 2020 through the Agricultural Bank of China in cities such as Shenzhen and Suzhou [9]. The two countries have additionally started the application of blockchain projects at the national level. In addition, Korea and China are in the same cultural circle and have many common belief systems, such as Confucianism and Buddhism [10,11]. However, their political systems differ. While China and South Korea have performed well in blockchain research and practice, few studies have analyzed the scientific development of blockchain in detail. Therefore, it is necessary to study and compare the knowledge networks. A comparative analysis of the knowledge of the two networks provides a way to understand the characteristics of blockchain technology objectively and accurately.

2. Triangulation

For an innovative technology as disruptive as blockchain, there are several implications in multiple areas. These lead to complex knowledge structures. To study such complex structures, triangulation can use a combination of research methods to analyze them from multiple angles, and thus overcome the weakness of any single method [12,13]. The concept of triangulation originated from scientific research in measurement. Webb et al. (1966) introduced this technique in the social sciences [14]. Triangulation allows a problem to be studied from many angles (i.e., different types of data can be measured, different theories can be examined, different methods can be assessed, etc.). [15,16]. For example, Luthardt et al. (2021) applied triangulation to their data, carrying out both qualitative and quantitative analyses [17]. Kim, Lee, and Min (2021) suggested using regression analysis and network analysis for triangulation from multiple perspectives to improve accountability [18]. Park and Park (2020) used triangulation to overcome the limitations of traditional semi-automatic text analysis [19].
This study is a triangulation of three different research methods. Scientometric network analysis is used to study the structure of knowledge output, machine learning topic analysis is used to mine knowledge content, and predictive technology methods can automatically classify the nature of blockchain research in order to predict the type of related research. Therefore, triangulation using a variety of research methods addressing multiple aspects can more comprehensively analyze the knowledge structures related to blockchain.

3. Research Questions

To this end, this paper presents a new triangulation research method. This comprehensive approach makes use of three aspects, namely scientometric network analysis, thematic model analysis of machine learning (ML), and prediction methods, to deeply study the characteristics of blockchain-related knowledge structures in China and South Korea and research priorities and development models of the two countries. This is meaningful for the development of blockchain technology in the two countries, and will be of great reference value to other countries seeking to establish a high level of blockchain scholarship.
The research questions are as follows:
(1)
What are the hottest research subjects related to blockchain technology in China and South Korea?
(2)
What is the over-time structure of collaboration in terms of co-authorship between individuals, institutions, and nation states?
(3)
What are the salient research topics in China and South Korea?
(4)
To what extent does the proposed ML technique predict the nature of blockchain publications (i.e., engineering-oriented R&D projects or societal aspects of blockchain technology)?

4. Analytical Methods

4.1. Data Collection

The data in this study were obtained from all journals from 2010 to 2020 in the Web of Science (WOS) database. The collection was conducted on 10 March 2021. Many countries harvest scholarly data from the WOS for R&D monitoring and evaluation [20,21]. This study only considers “blockchain” as the topic of English journal publications as the research object. Although blockchain technology covers many fields (e.g., encryption monetary, financial, intelligent community, intelligent digital contract), the use of a particular topic keyword and “blockchain” as general search keywords can lead to data samples being retrieved subjectively into several different themes, affecting the objectivity of evaluation for the blockchain as a whole. Therefore, it would be more appropriate to select only “blockchain” as a search term. Only English articles were considered for data quality and consistency. We used Web of Science’s Advanced Search service to retrieve. Our retrieval command is (TS = “blockchain”) AND LANGUAGE: (English) AND DOCUMENT TYPES: (Article) Indexes = SCI-EXPANDED, SSCI, A&HCI, ESCI Timespan = 2010–2020. Therefore, we collected 4305 papers from scholars from the world, covering a total of 1017 journals. While some 1373 papers were from scholars whose affiliations are based in China, 311 papers are from scholars in Korea.

4.2. Scientometric Network Analysis

The fundamental feature of scientometrics involves applying several quantitative techniques to the intellectual structure of a research field [22,23]. In this study, scientometric network analysis was used to uncover collaborative structures in blockchain fields through relational indicators and centrality. To effectively assess the blockchain field, the current study examined the properties of the entire network and parts of China’s and South Korea’s networks. By investigating a part of the network, we can observe the properties of different clusters [24]. Furthermore, by studying the entire network system, the density of the network, the distance between nodes, and the graphic structure characteristics can be analyzed [24,25].
In this study, the VOSviewer association strength algorithm was used to analyze authors and keyword networks, and the association strength method developed was used to standardize the association strength between items [26]. The strength of an association is a metric used to quantify the relationship between two nodes. To present the concept diagram, Vosview employed Van Eck and Waltman’s (2009) calculation method. The correlation strength index was used to calculate the distance between two nodes [26]. This study used NodeXL [27] to visualize collaborative networks among authors, organizations, and countries. Authors, organizations, and countries are represented by nodes in the network, and their relationships are represented by links. The relative number of published articles determines the size of the nodes in the network, and the color of the node indicates the collaborative team to which the author belongs. The closer the connection, the stronger the partnership.
For network analysis, degree centrality, betweenness centrality, and eigenvector centrality are important indexes. The importance of node network relationships can be evaluated by degree centrality [28], which is the frequency of direct connections with other nodes [29]. Betweenness centrality is a measure of whether nodes play a mediating role in a network [29]. The centrality of the eigenvector points to the most influential node, considering the indirect relationship [30]. In addition, network density is another research index of this study. For a network of n nodes and m links, n (n − 1)/2 represents the total number of all possible relationships, m/(n (n − 1)/2) is the density value, and if all of the nodes in the network are connected, the maximum density is 1 [31]. In addition, we standardized the betweenness centrality, and the normalized value was the original value divided by the value of the largest betweenness centrality in the network.

4.3. Machine-Learning Topic Modeling: Latent Dirichlet Allocation

ML is considered a category in the field of artificial intelligence (AI), research methods that use data and experience to improve computer algorithms, and optimized computer programs [32]. In this study, the unsupervised learning method LDA was used to analyze the topics [33]. No training mark was prepared in advance, and the data were directly modeled by probability using the unsupervised learning method LDA. It can provide the topic of each document in a document set as a probability [34,35]. When LDA is used, the thematic features of documents can be extracted from documents in the corpus, and the distribution of words reflects the characteristics of each topic. We integrated all of the document keywords from China and Korea into the corpus and divided the word W into K topics using LDA. The K value was determined by the researcher. To determine the value of K, we used two indicators (coherence and perplexity) and the distance map for detection. We ensured that the number of topics was reasonable. We used the LDA Python package, which was obtained from Genism [36].

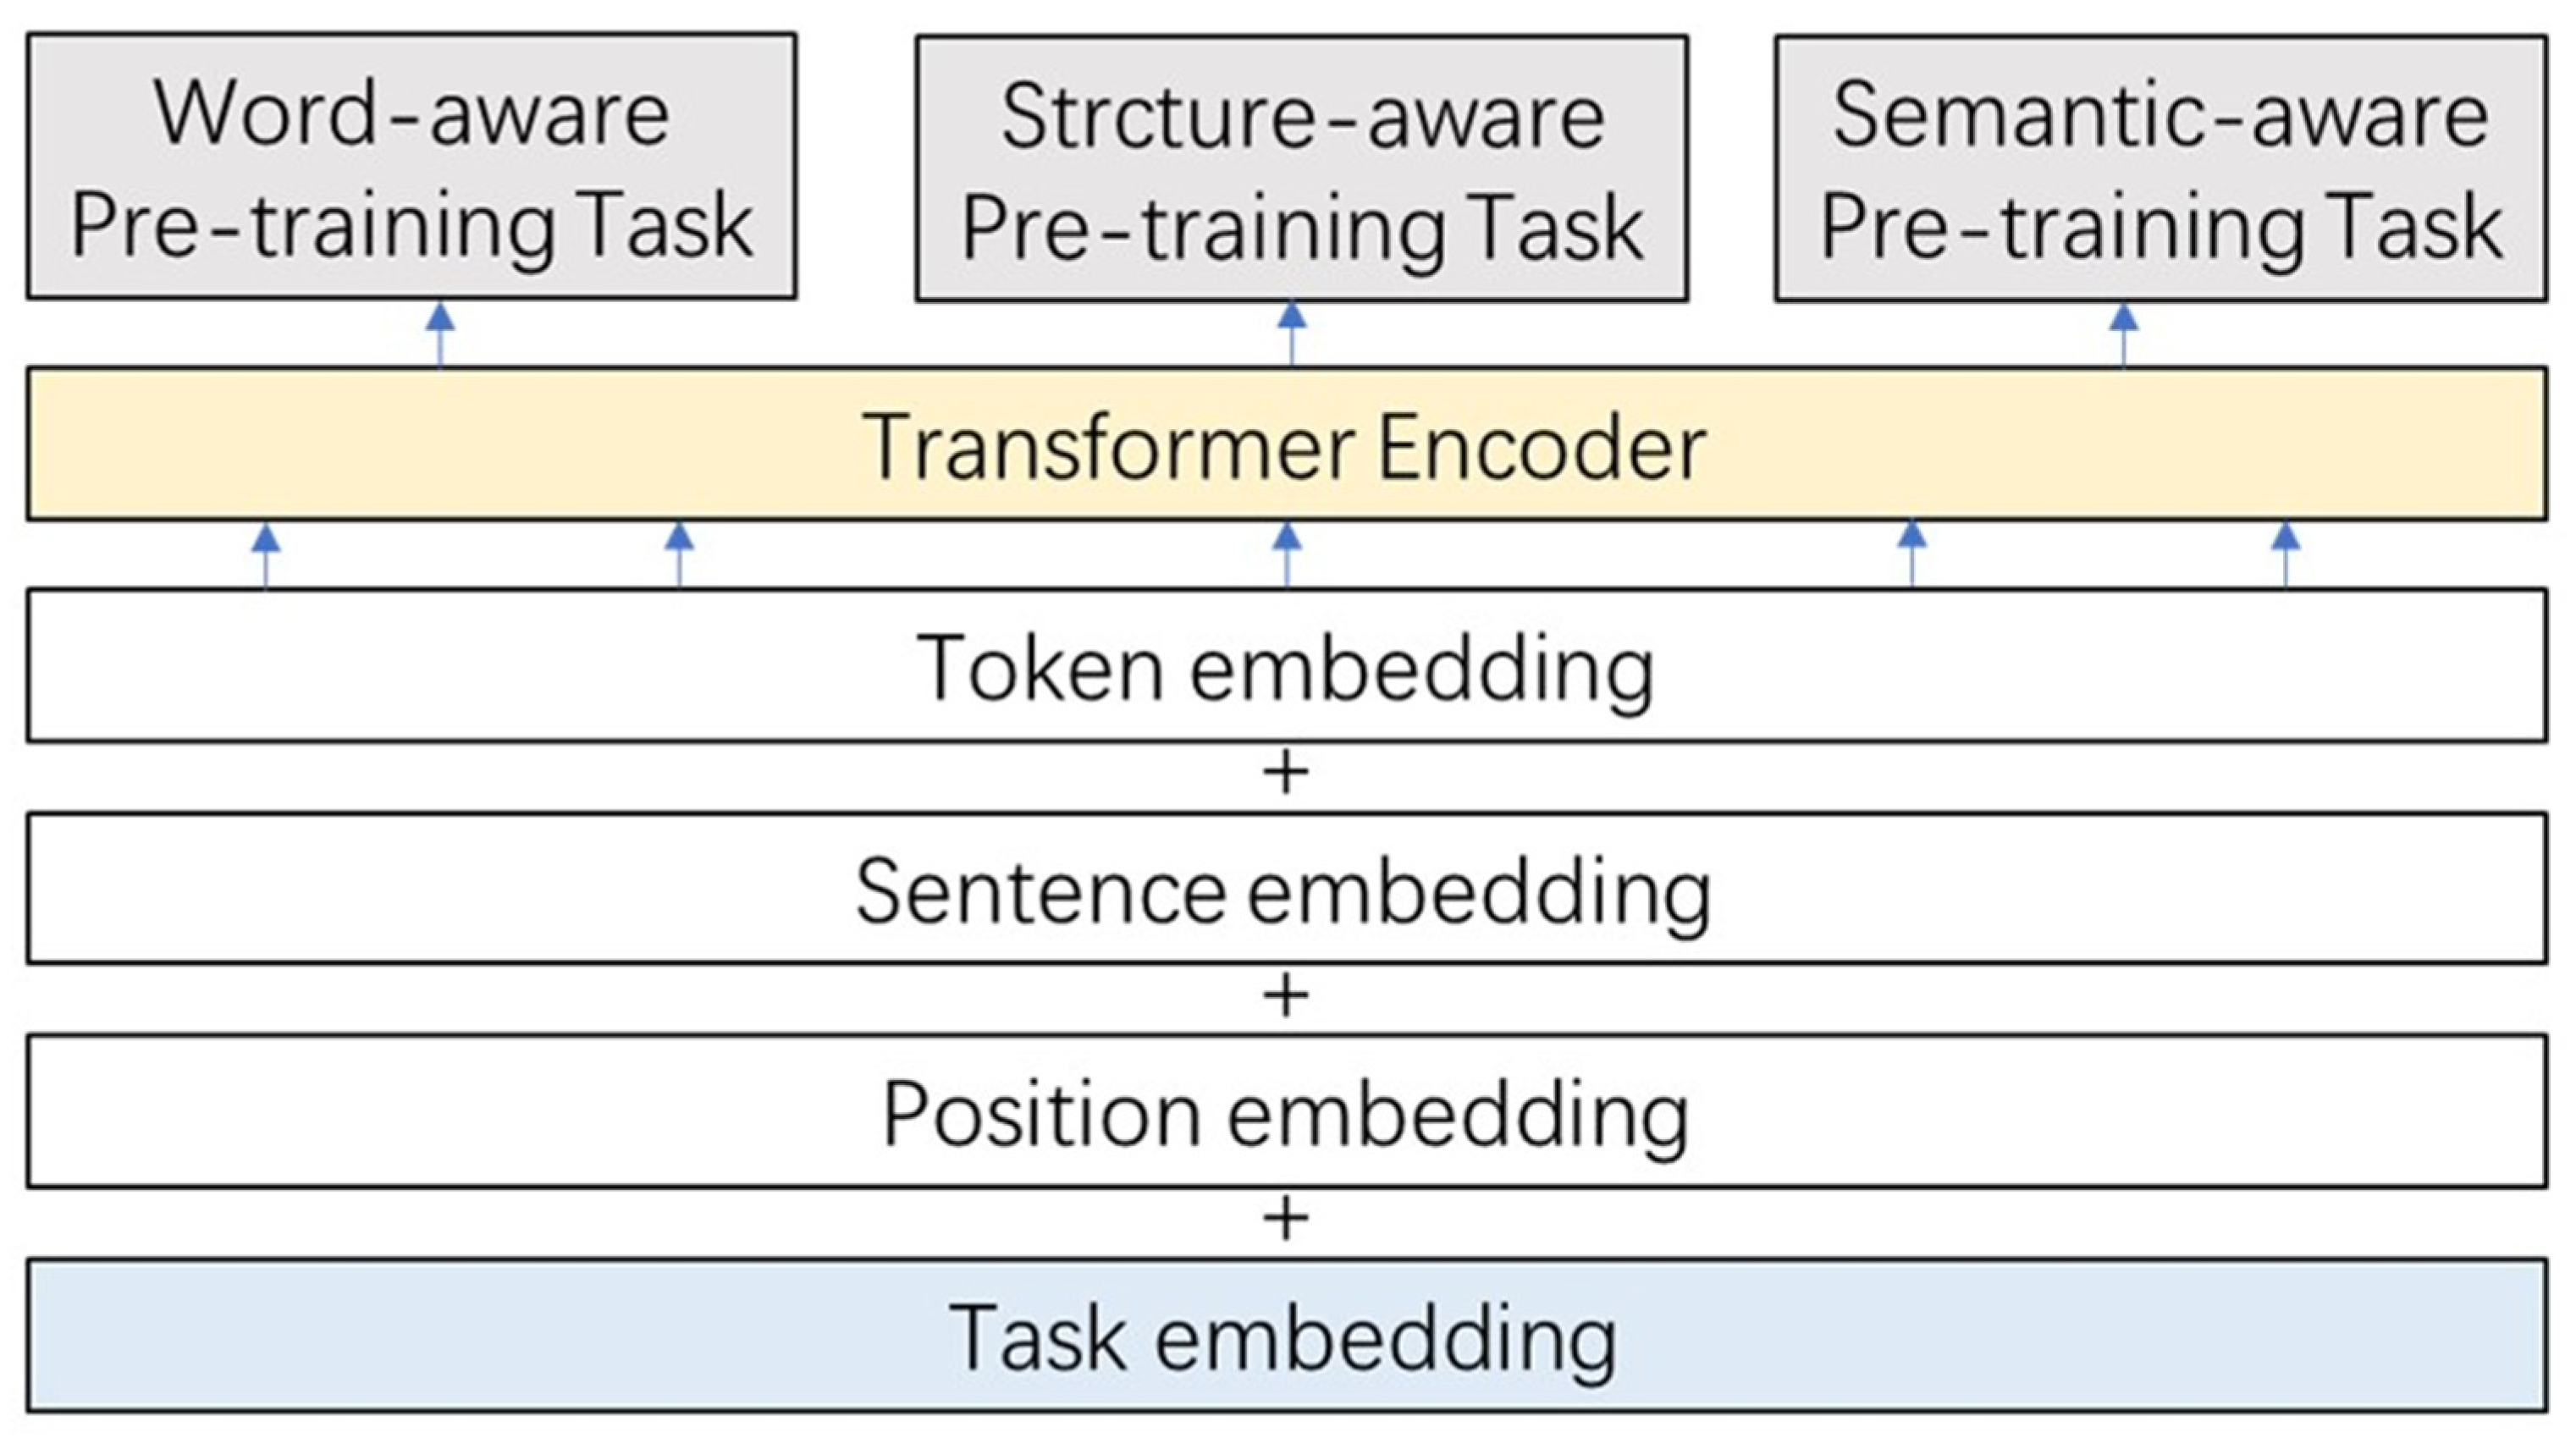
4.4. Prediction Technique

ML predictive applications involve data mining, computer vision, statistical learning, natural language processing, and other fields. In this study, we built a natural language classification model that can be used to quickly judge whether a scientific article is related to the development of blockchain technology. To implement our model, we used Ernie 2.0, a continuous pretraining framework in natural languages. Here, we used a supervised approach. Ernie 2.0 is an AI model developed by Baidu, which is a natural language pre-training framework that has shown good results in a variety of world-class tests since its launch in 2019. As shown in Figure 1, Ernie 2.0, is mainly composed of two parts: a transformer encoder and task embedding, and the model has multiple layers of transformer as an encoder [37]. The transformer can capture contextual information through self-attention and generate embedding, and task embedding can be applied to tasks with different characteristics, each with a specific token, sentence, position, and task embedding [37].
We used the Ernie 2.0 model to construct four analysis and prediction models. We expect that the prediction model can be used to automatically predict whether the research content is blockchain technology research and development from the articles on future blockchain research. The training data for the four models were different. Model 1 was trained using all combined data from China and Korea. Model 2 was trained using data from China. Model 3 was trained using data from Korea. Model 4 avoided the error due to the difference in the number of dichotomous samples; 300 technical and 300 non-technical data were randomly extracted from the total data. Finally, the test results of the four models (accuracy, F1-score, precision, and recall) were used to judge the usability of the models.

5. Results

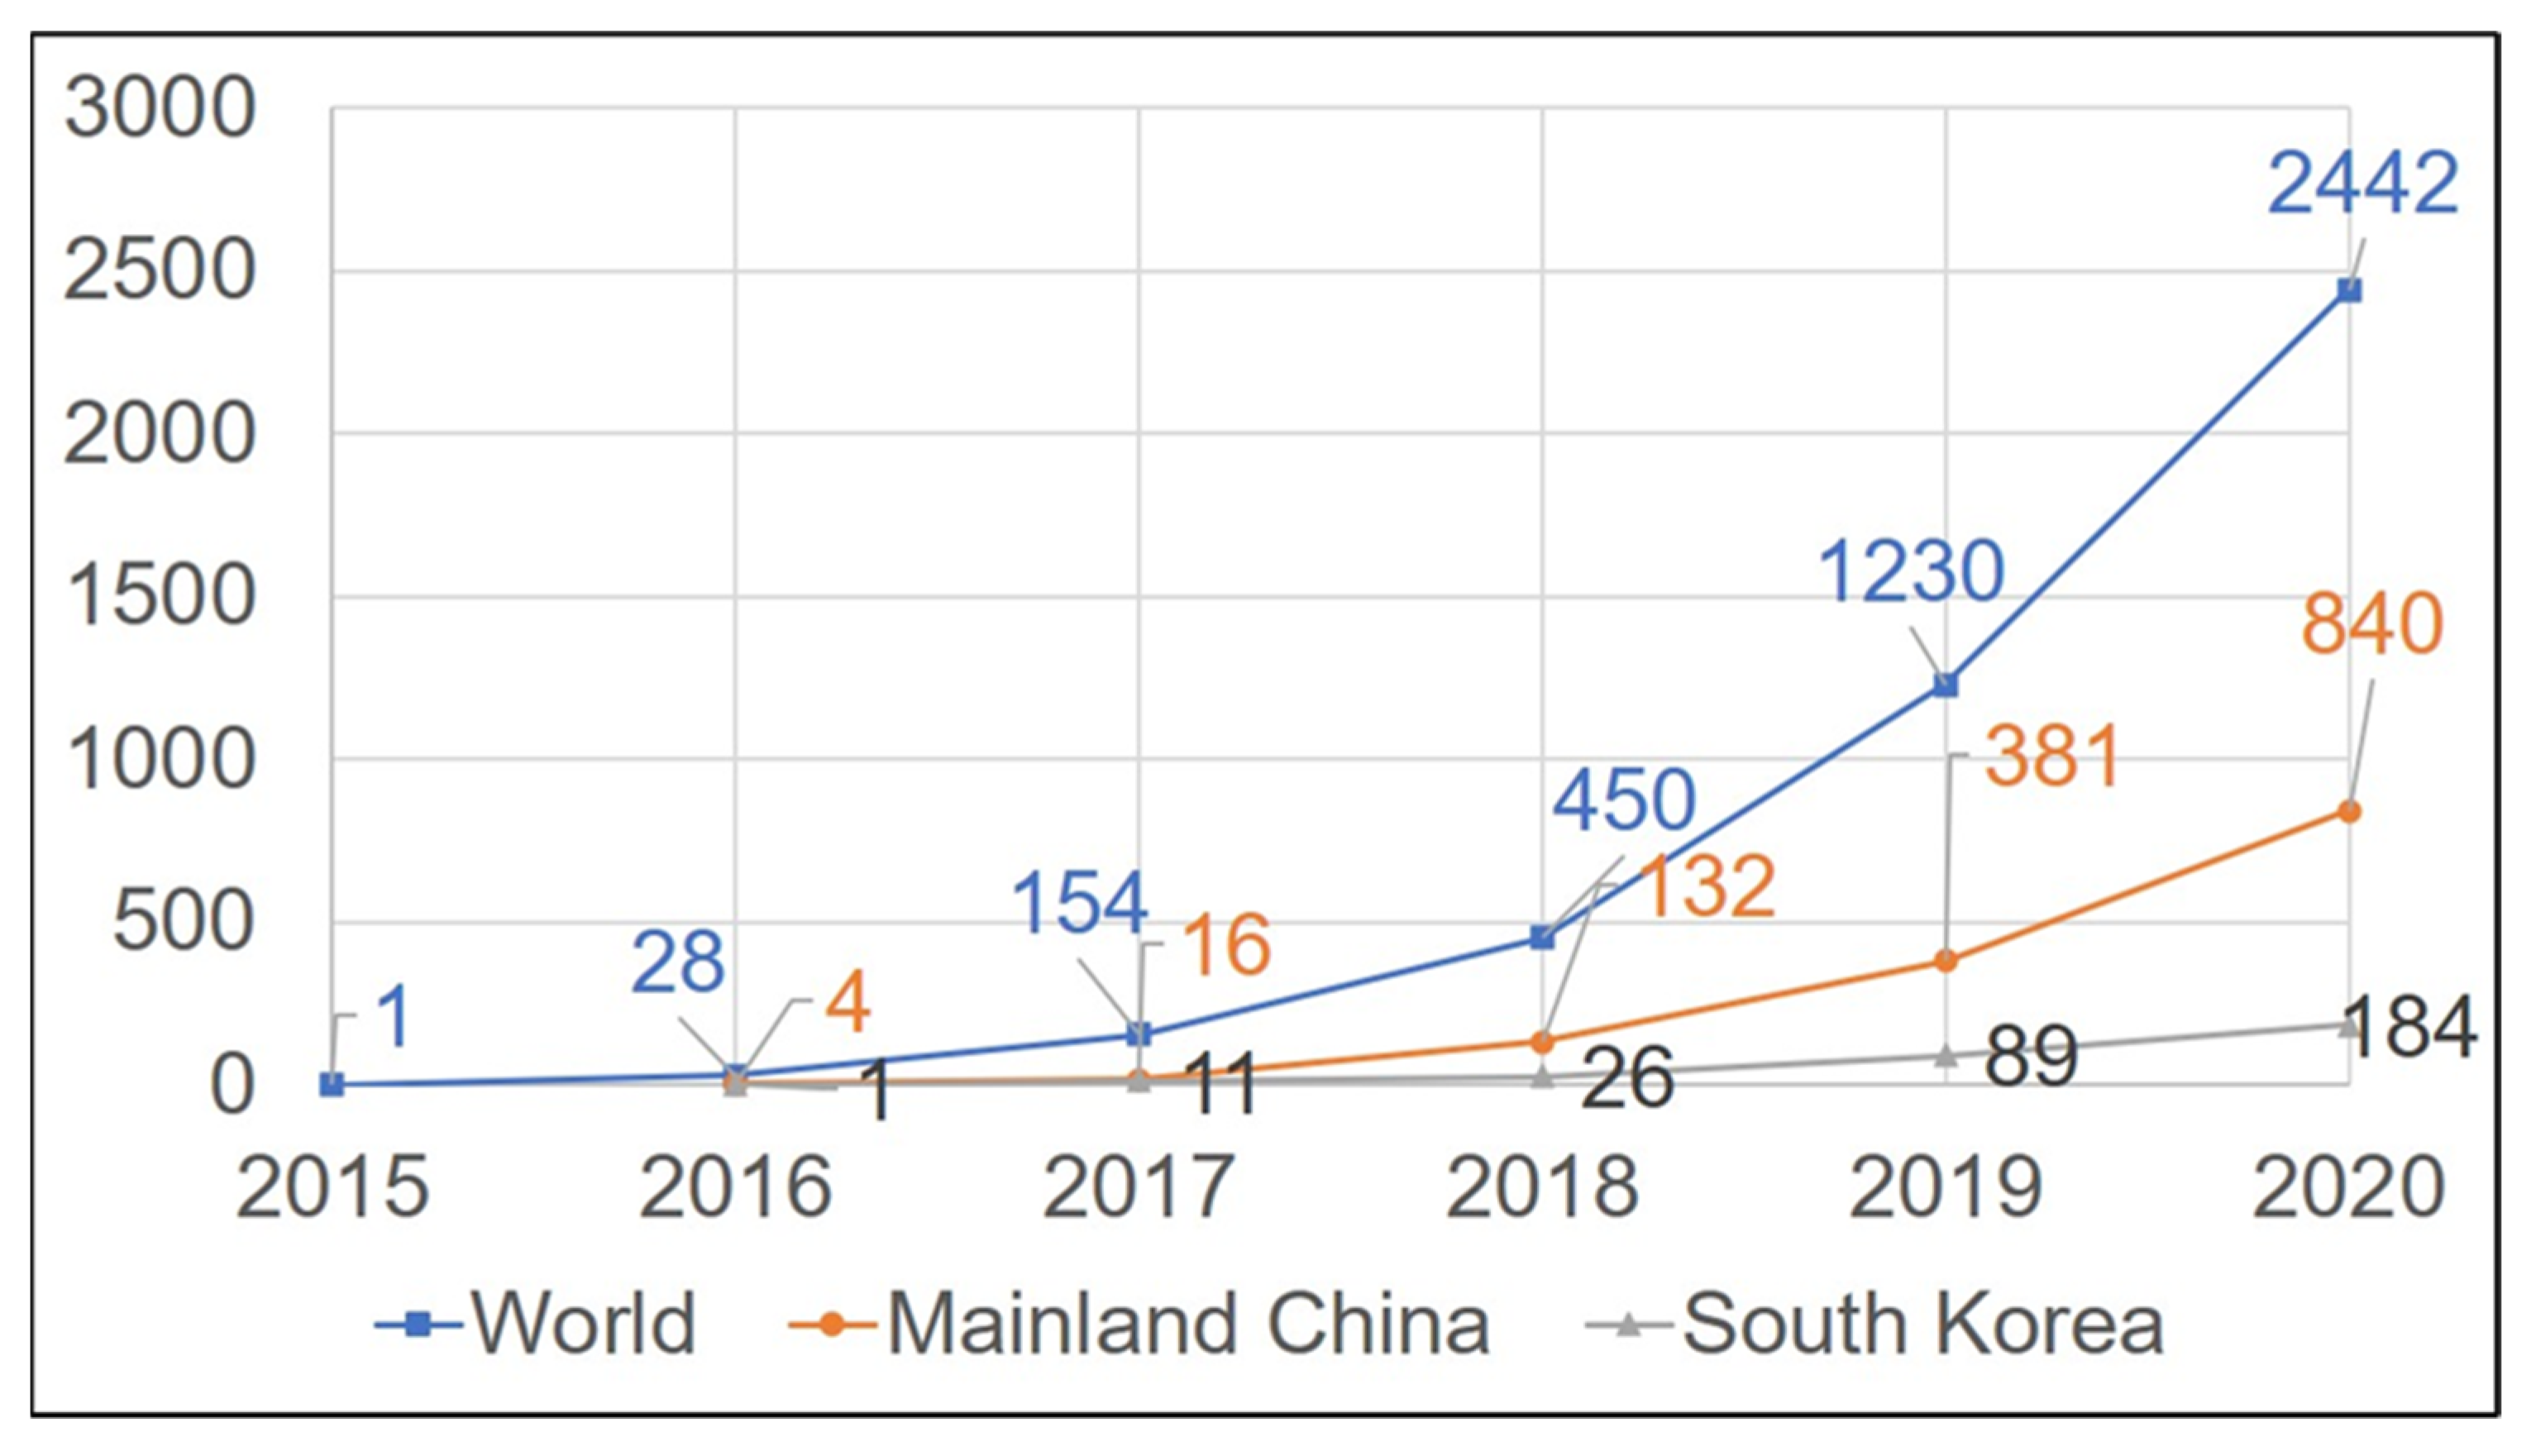
5.1. (RQ-1) What Are the Hottest Research Subjects Related to Blockchain Technology in China and South Korea?

First, the trend in the number of blockchain publications is presented in Figure 2. Furthermore, the fields of hottest research subjects in the two countries are collated in Table 1. As shown in Figure 2, the first paper with “blockchain” as the explicit topic was published in 2015, while the research on blockchain between the two countries started in 2016. From 2017 to 2020, the number of papers published in both China and South Korea has been growing rapidly. Interest in blockchain research continues to grow in both countries [4,8]. In particular, the number of Chinese papers increased by 7.25 times in 2018 and that of South Korea by 2.42 times in 2019. Thus, the number of papers in South Korea did not increase as much as in China.
In December 2016, blockchain technology developed into a national strategy in China [38], which stimulated the interest of Chinese researchers, and the number of studies increased sharply. In 2018, the government issued a white paper on blockchain [39]. The development of blockchain in China is related to government promotion, and South Korea also proposed a blockchain-related tax policy in 2018 and continued to promote the education of blockchain technology [8]. Both governments have influenced blockchain development.
As shown in Table 1, we used the WoS classification method. Each article covers multiple fields, and thus the total number of fields is greater than the total number of articles. In China and South Korea, the most popular fields are computer science, information systems, electrical and electronic engineering, and telecommunications. The top ten subjects were mostly science and engineering. China is higher than South Korea in terms of the number and ranking of publications on business economics and management.

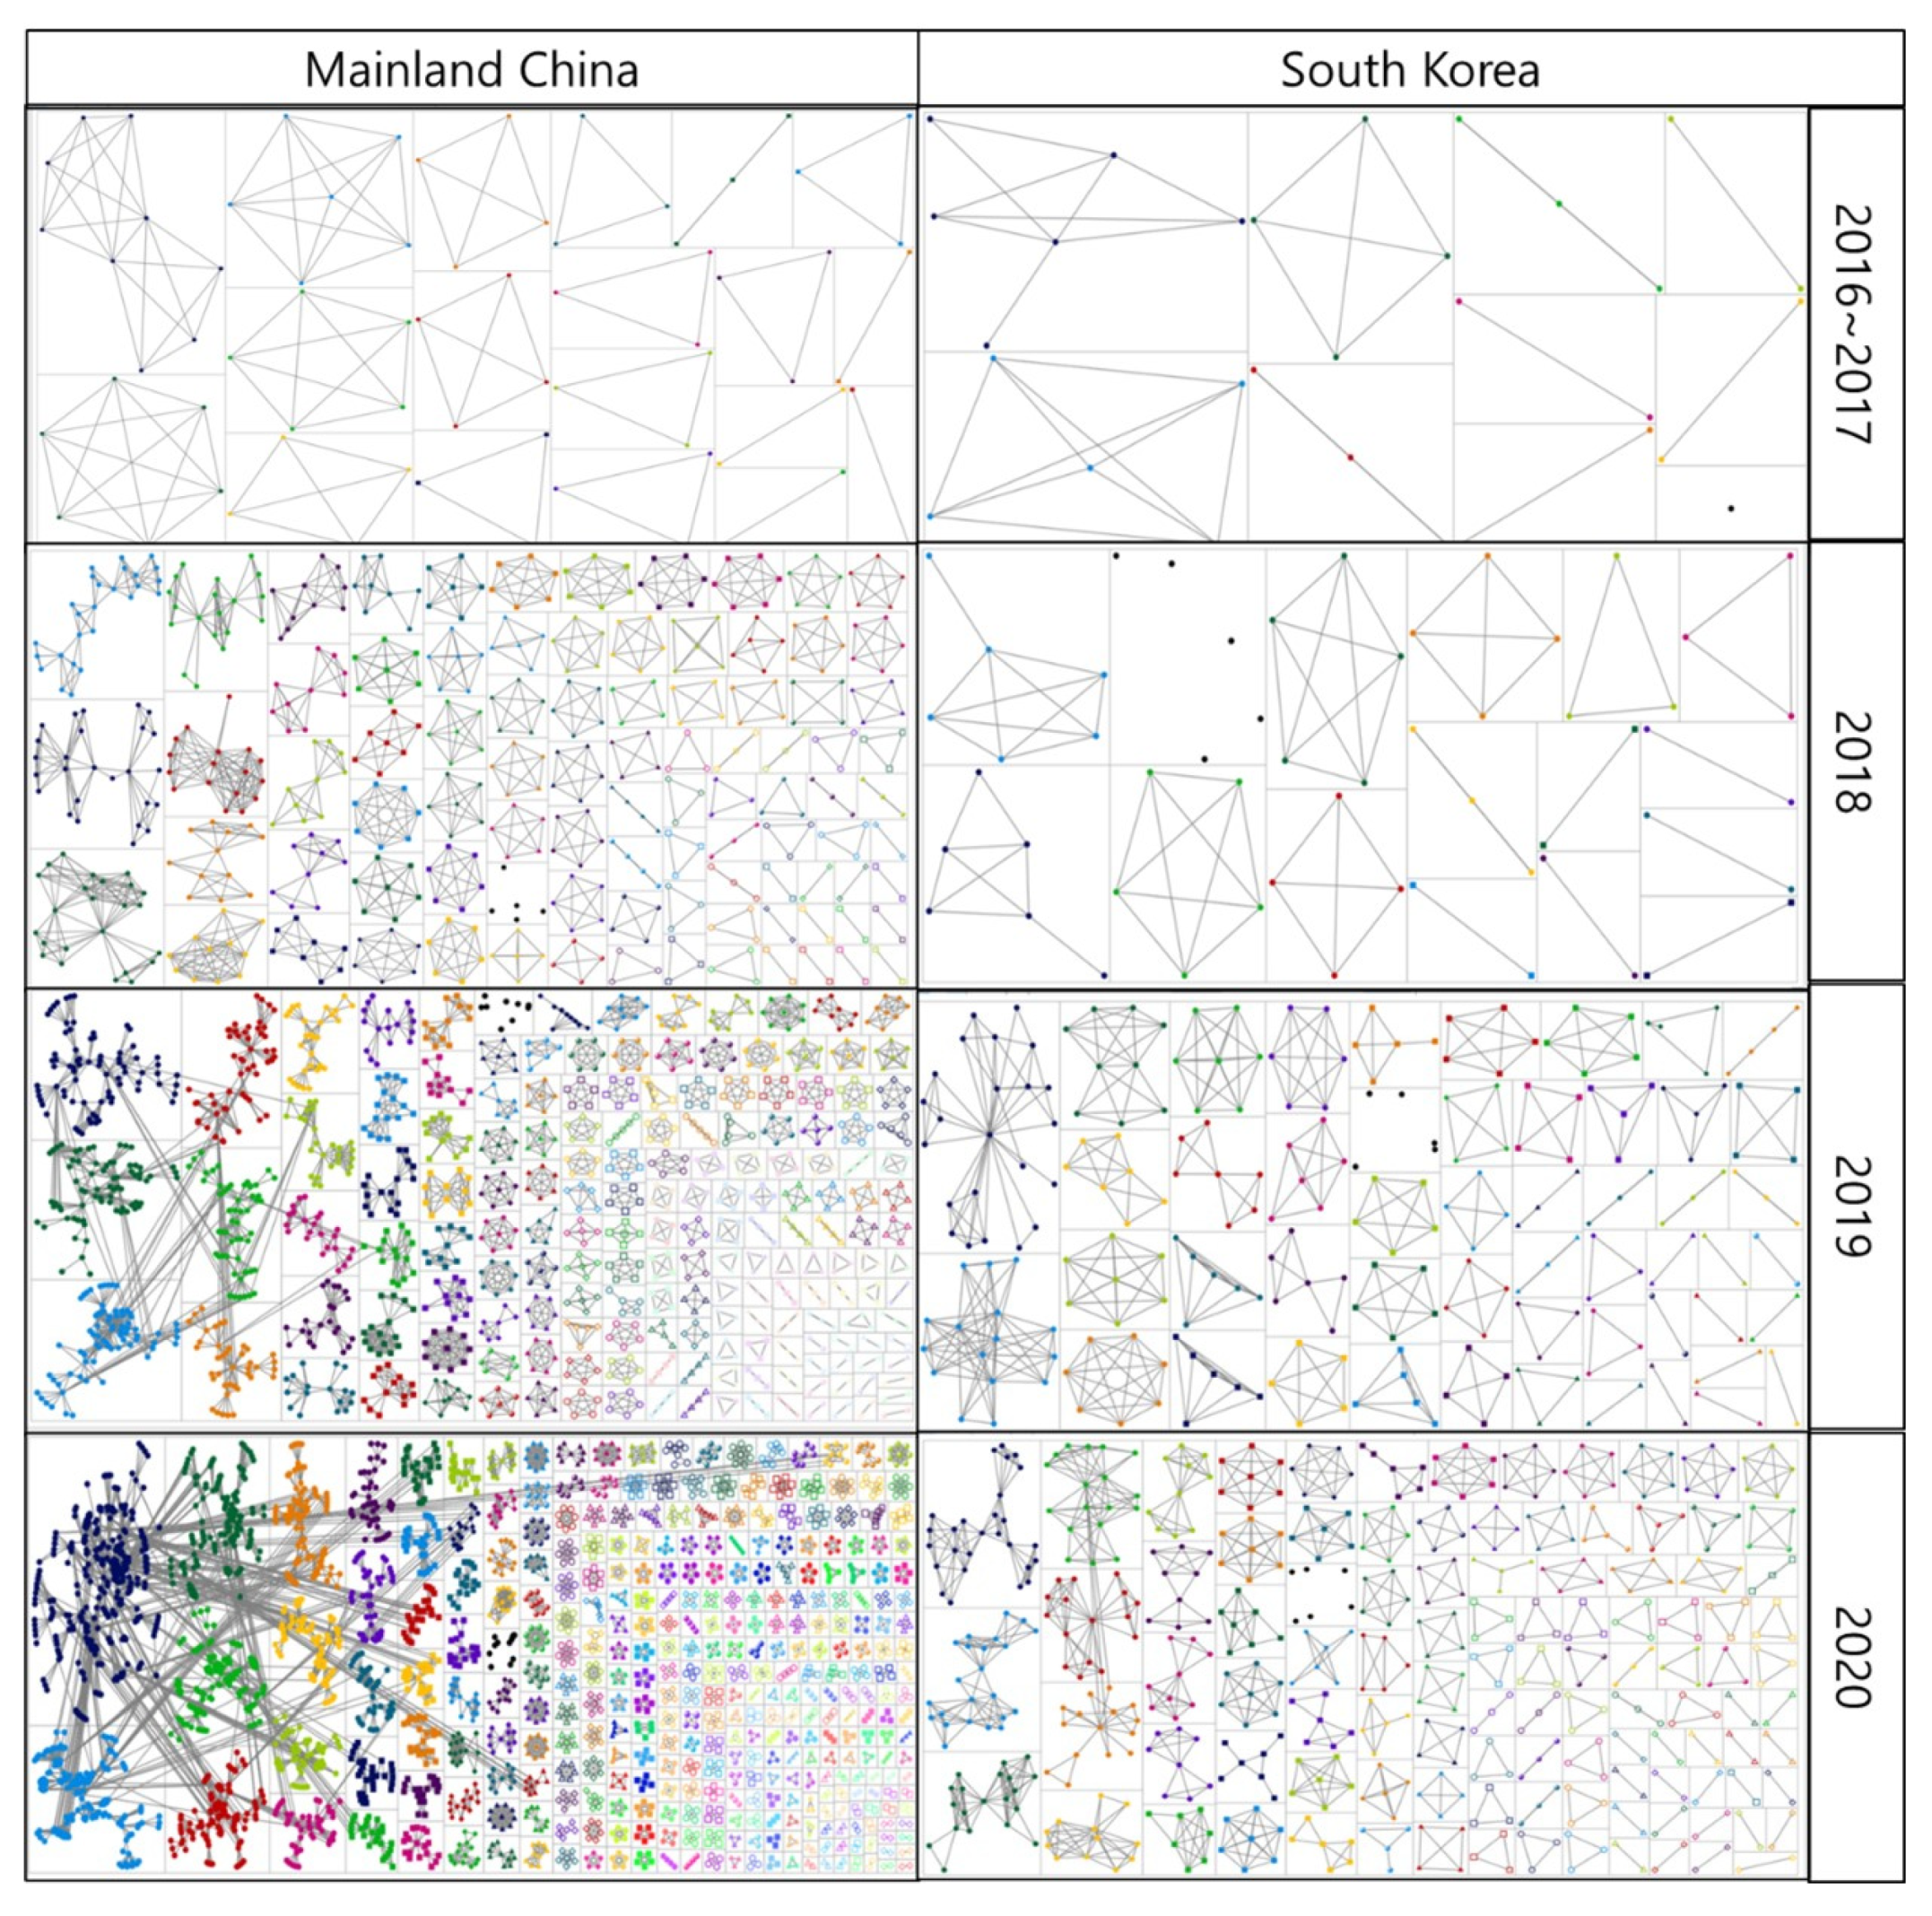
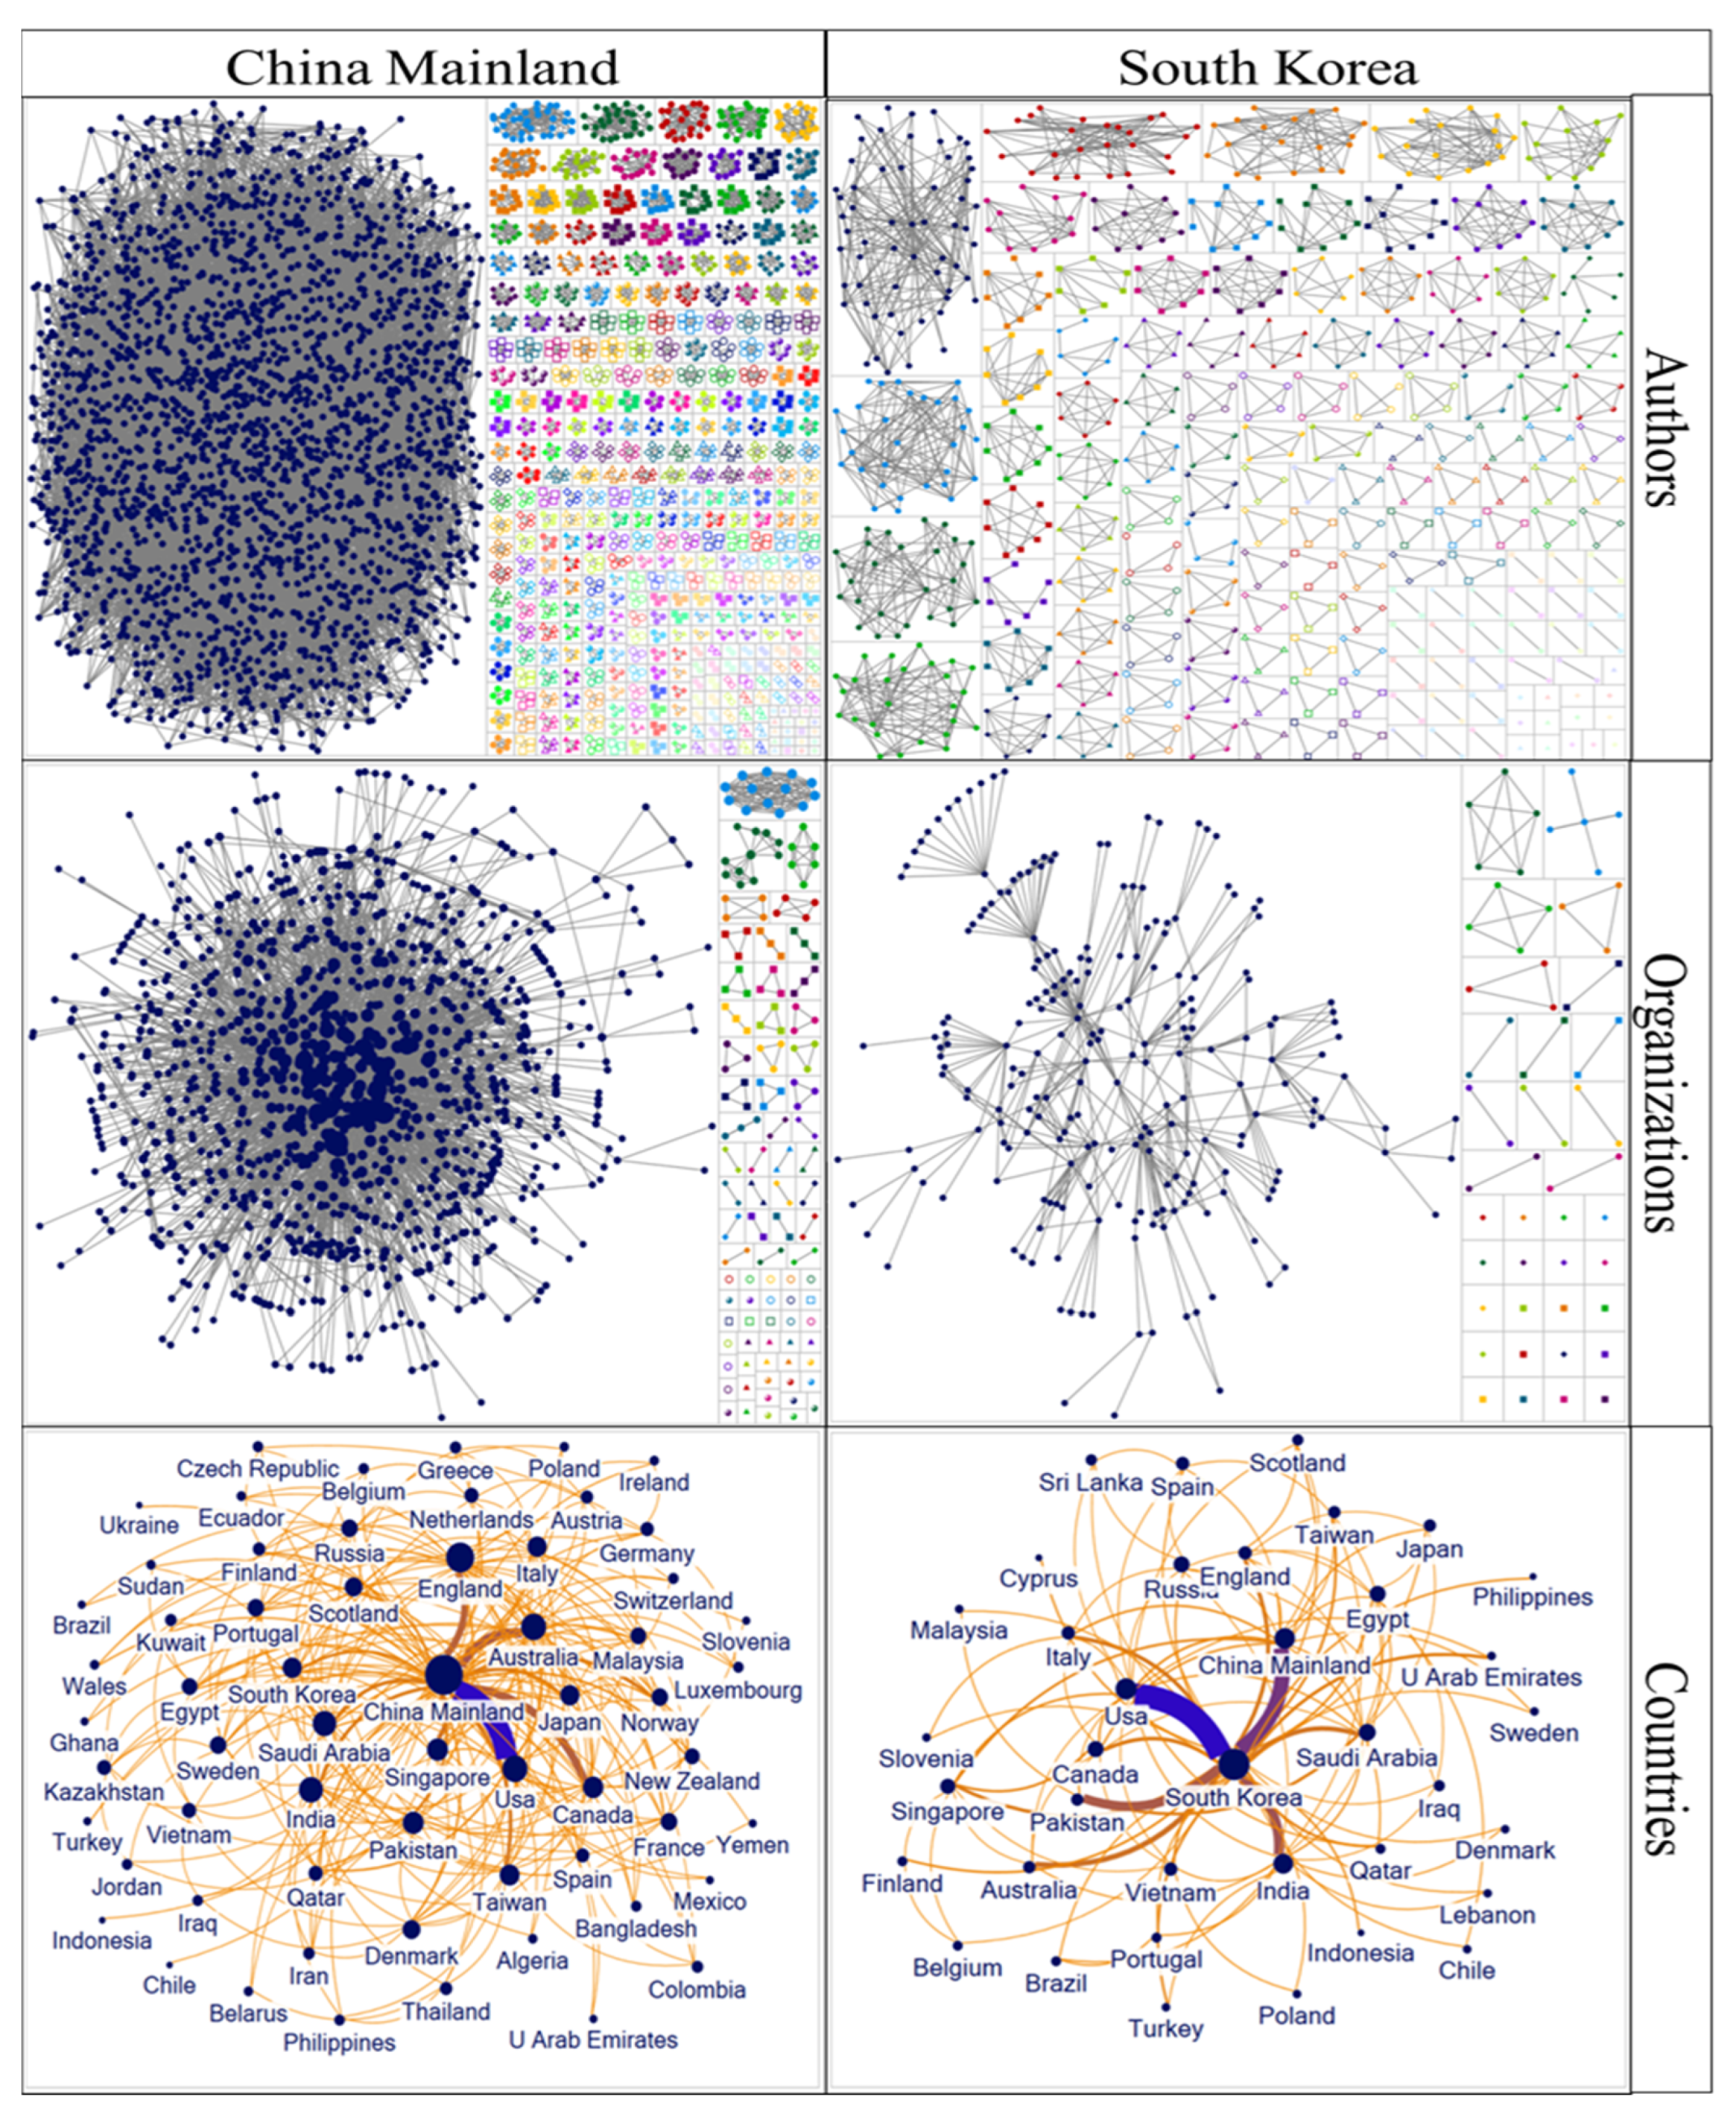
5.2. (RQ-2) What Is the Over-Time Structure of Collaboration in Terms of Co-Authorship between Individuals, Institutions, and Nation States?

We used NodeXL to plot the authors, agencies, and national collaboration networks in China and South Korea, respectively, as shown in Figure 3. In addition, Table 2 shows the centrality indicators for authors, institutions, and countries with the most articles and citations. In Table 3, we analyze the structural index of each whole network in detail.
As can be seen from Figure 3, China’s network is more complex than that of South Korea. Among the authors of the two countries, the number of published articles is 30, and the Chinese author with the most published articles is Du Xiaojiang. The number of cited articles, the number of co-authors, and the centrality of the feature vector are the highest. Interestingly, the author is a Chinese national who teaches at an American university. Zhang Yan has the highest number of citations (120) with 23 papers. The betweenness centrality is relatively high, but the centrality of the eigenvector is not very high, indicating that the influence status of her co-authors is not very large in the network. Among the author cooperation networks in South Korea, Park and Jong Hyuk have the highest number of published articles and cited articles. In total, there are 30 co-authors, and the betweenness centrality is the most significant, while the eigenvector centrality is not high. Beijing University Posts and Telecommunications has the highest number of posts and citations in China, with 93 articles and 1512 citations. There are 95 linked organizations. The betweenness centrality and eigenvector centrality are relatively high. In South Korea, Seoultech presents the highest numbers, with 35 articles and 762 citations linked to 17 organizations. We found that this school had a high number of articles, since one of the authors had 30 articles. A single person influences the network of knowledge structures throughout the organization. The most common link in both countries was the United States. The United States and China collaborated 229 times and contributed 2957 citations. The United States and South Korea collaborated 32 times and contributed 398 citations. The mediating role of the United States is higher in South Korea than in China.
In China’s knowledge network, there are 4042 authors and 11,299 links. The longest distance is 18, and the average distance is more than 6. The second largest group consists of 33 authors, with a maximum distance of 3 and an average distance of 2.099. In total, 1221 organizations and 4015 links constitute China’s organizational network, with a maximum distance of 8 and an average distance of 3.525. The largest group has 1064 organizations and the second largest has 13 organizations. China’s national network map is composed of 61 nodes, and 285 links. In South Korea’s knowledge network, there are 750 authors and 1501 links. Fifty-nine of them form an interlinked knowledge network group, the longest distance is 5, and the average distance is 2.494. The second largest group consists of 30 authors, with a maximum distance of 5 and an average distance of 2.336. In total, 280 organizations and 528 links constitute the organizational network in South Korea. The maximum distance is 9, and the average distance is 4.239. The largest group has 223 organizations, and the second largest group has 5 organizations. Thirty-seven countries and regions and 285 links constitute the national network map of South Korea. From the perspective of network density, the network density of South Korea is higher than that of China, and the network nodes in South Korea are more closely connected.
In addition, we analyzed the network structure of each stage and the development of the knowledge network structure. Since there were very few articles in 2016, we combined the data for 2016 and 2017. Figure 4 shows the network structure diagram of the four stages. In the structure chart from 2016 to 2017, the structures of both countries are relatively single, and there are no STAR and Y structures. In 2018, the CHAIN, Y, and STAR structures emerged in China, while the development effect of knowledge structure in South Korea was not obvious. In 2019, China’s knowledge structure was greatly developed, producing multiple complex Y-shaped structures and star structures. In addition, there are several connections between different intellectual communities. The Korean knowledge structure additionally produced a STAR-type structure at this stage. In 2020, China’s knowledge structure will become very complex, including multiple forms and complex connections among each structure. The knowledge structure in Korea has additionally been further developed, with some links formed between different research groups, but most of them are still small.

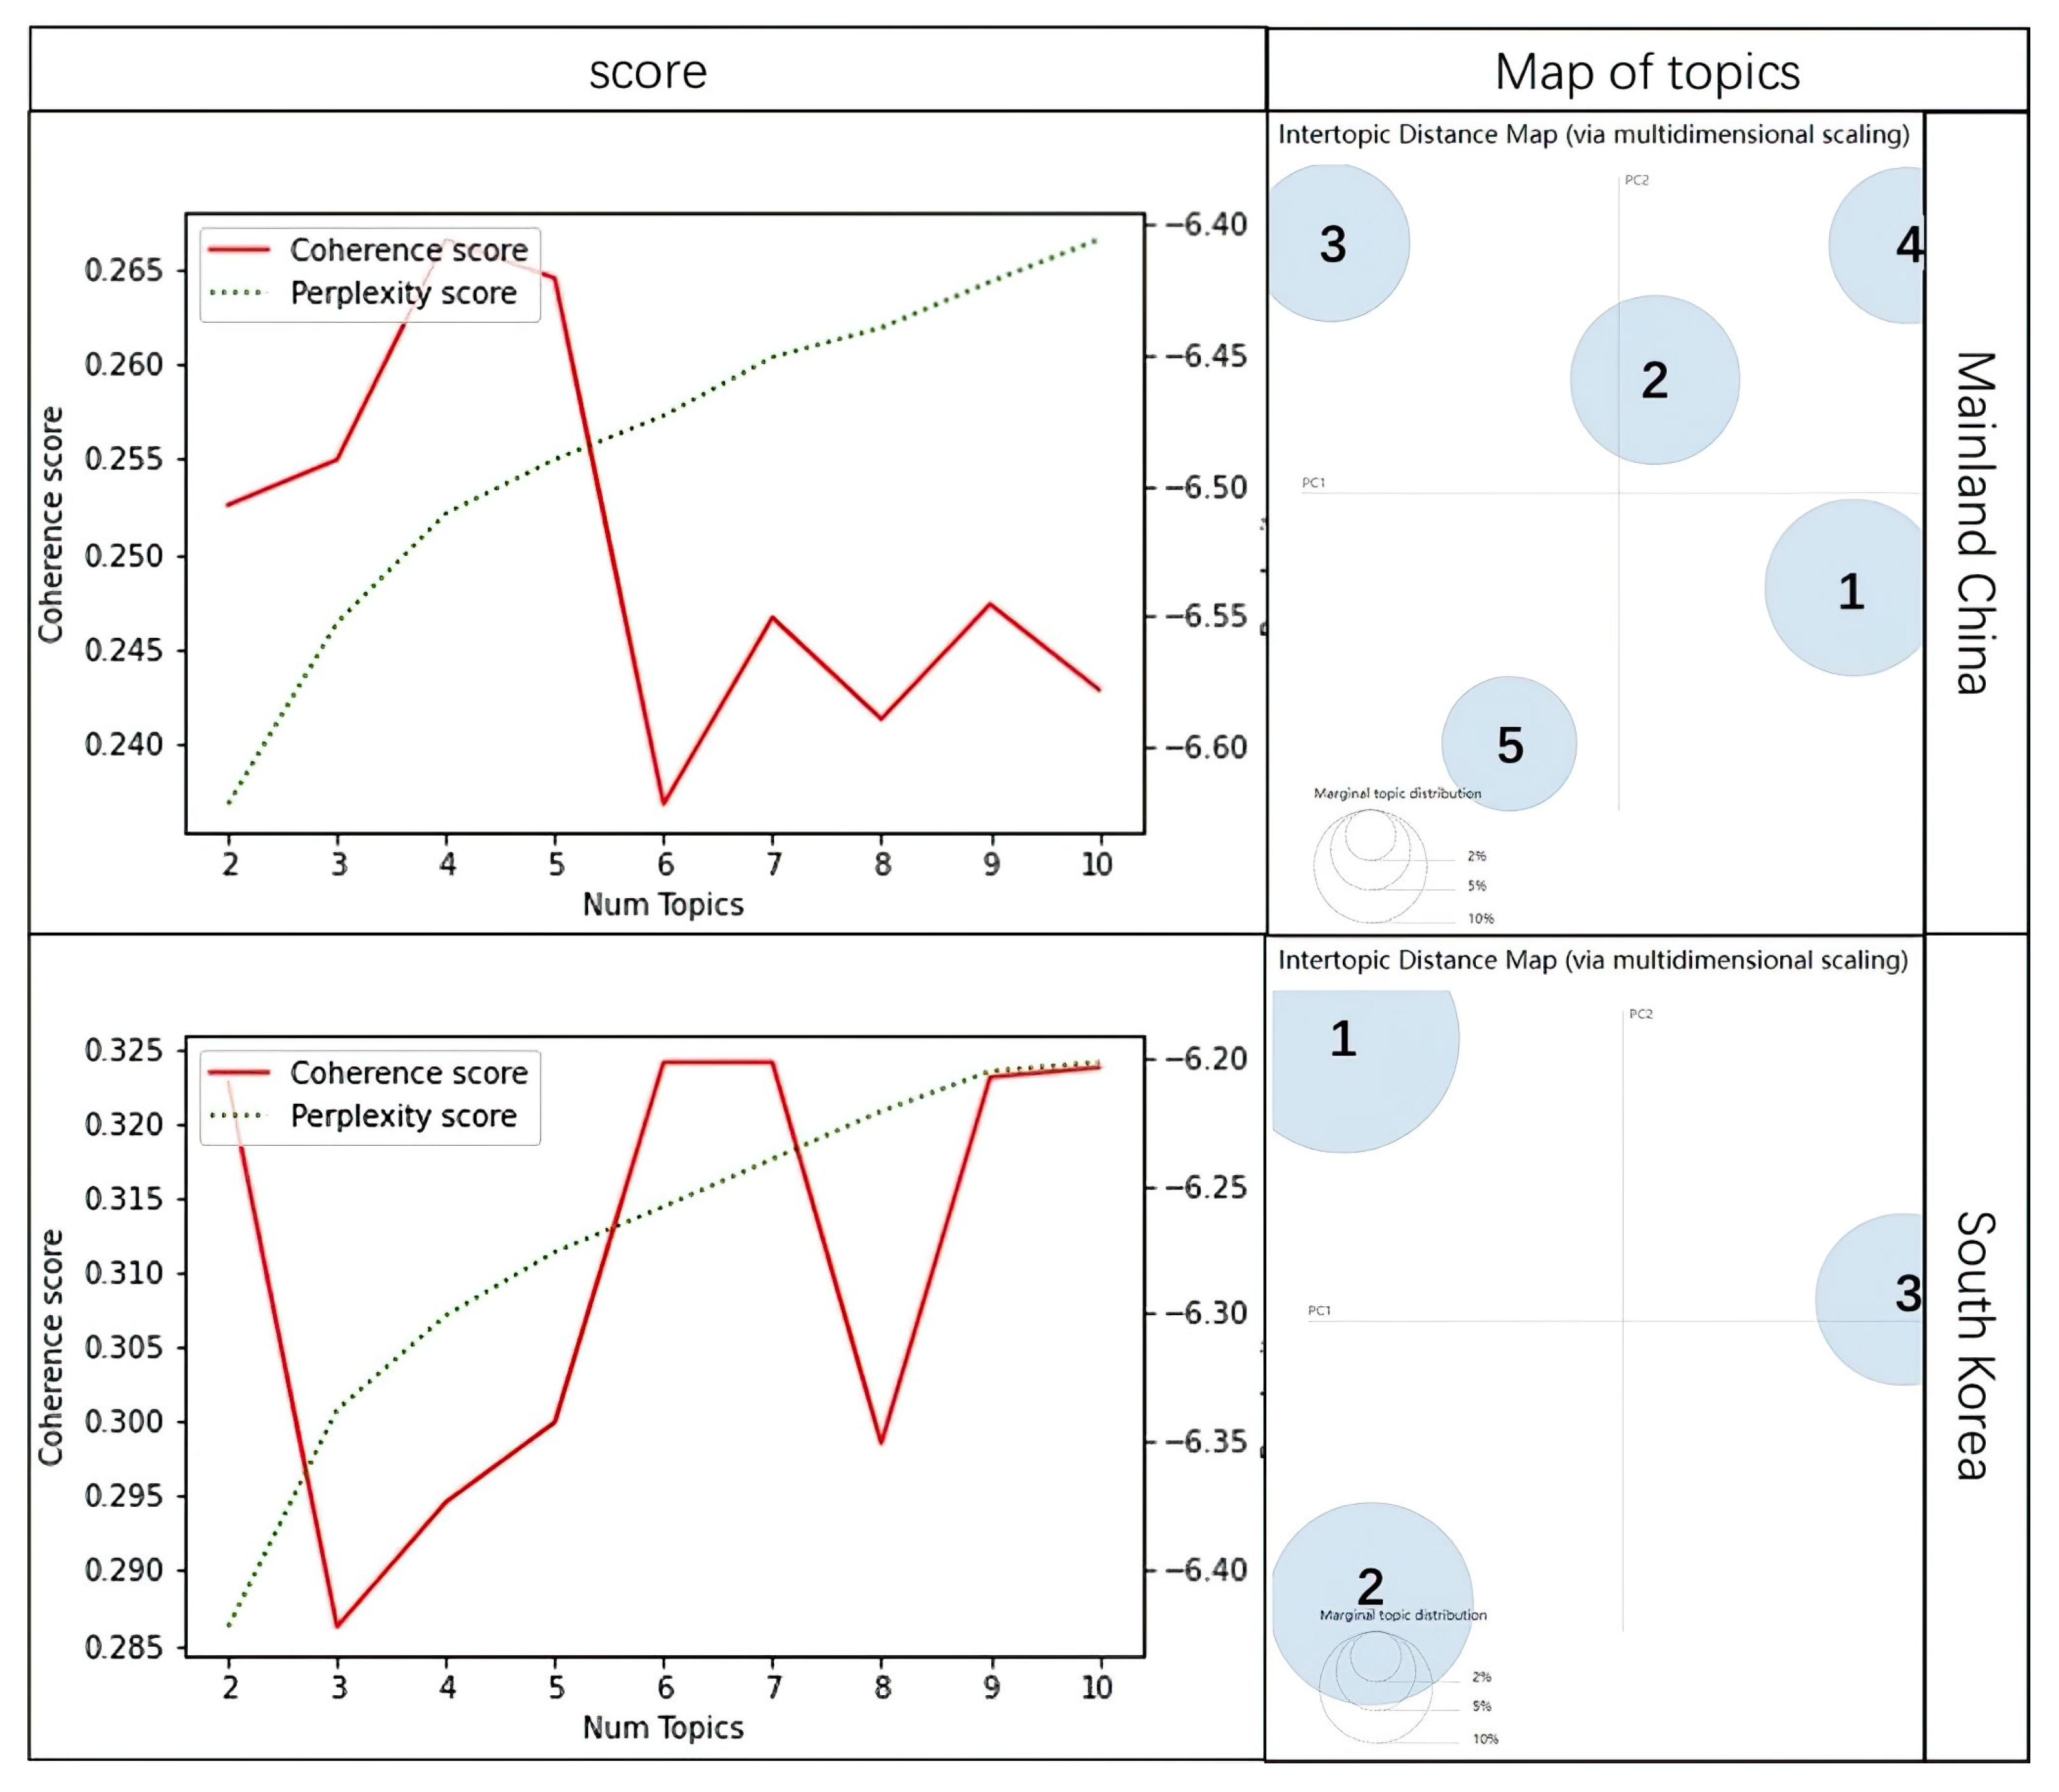
5.3. (RQ-3) What Are the Salient Research Topics in China and South Korea?

Considering the coherence score, perplexity score, and distance map of topics in Figure 5, we can conclude that the most suitable number of topics for China is five, whereas the best for South Korea is three. Table 4 shows the five topics in China. Topic 1 is “computing and technology,” which involves many technical problems describing blockchain computing, mining, attack, etc. Topic 2 is “IoT and smart contract,” which includes IoT, sharing, and smart contracts. Topic 3 is “traceability and authentication,” which includes key words such as traceability and signature. Topic 4 is “privacy and reliability,” including privacy, reliability, and integrity. Topic 5 is “state and consortium,” which includes state, public, consortium, cloud, and management.
Table 5 shows the 3 topics in Korea, Topic 1 is “privacy and security,” which involves the descriptions of several privacy and security problems. Topic 2 is the “data sharing and storage,” which includes data, sharing, peer-to-peer, and storage. Topic 3 is “IoT and cloud,” which includes IoT, cloud, storage, and management.
In summary, there are several studies on blockchain privacy, reliability, and security in both China and South Korea, and IoT is also a research hotspot in both countries. In addition, the topic of “traceability and authentication” has been divided into a topic among Chinese scholars. Research on the public chain, alliance chain, and industry in China is more abundant than that in South Korea. Business and social science issues do not clearly form thematic groupings in either country.

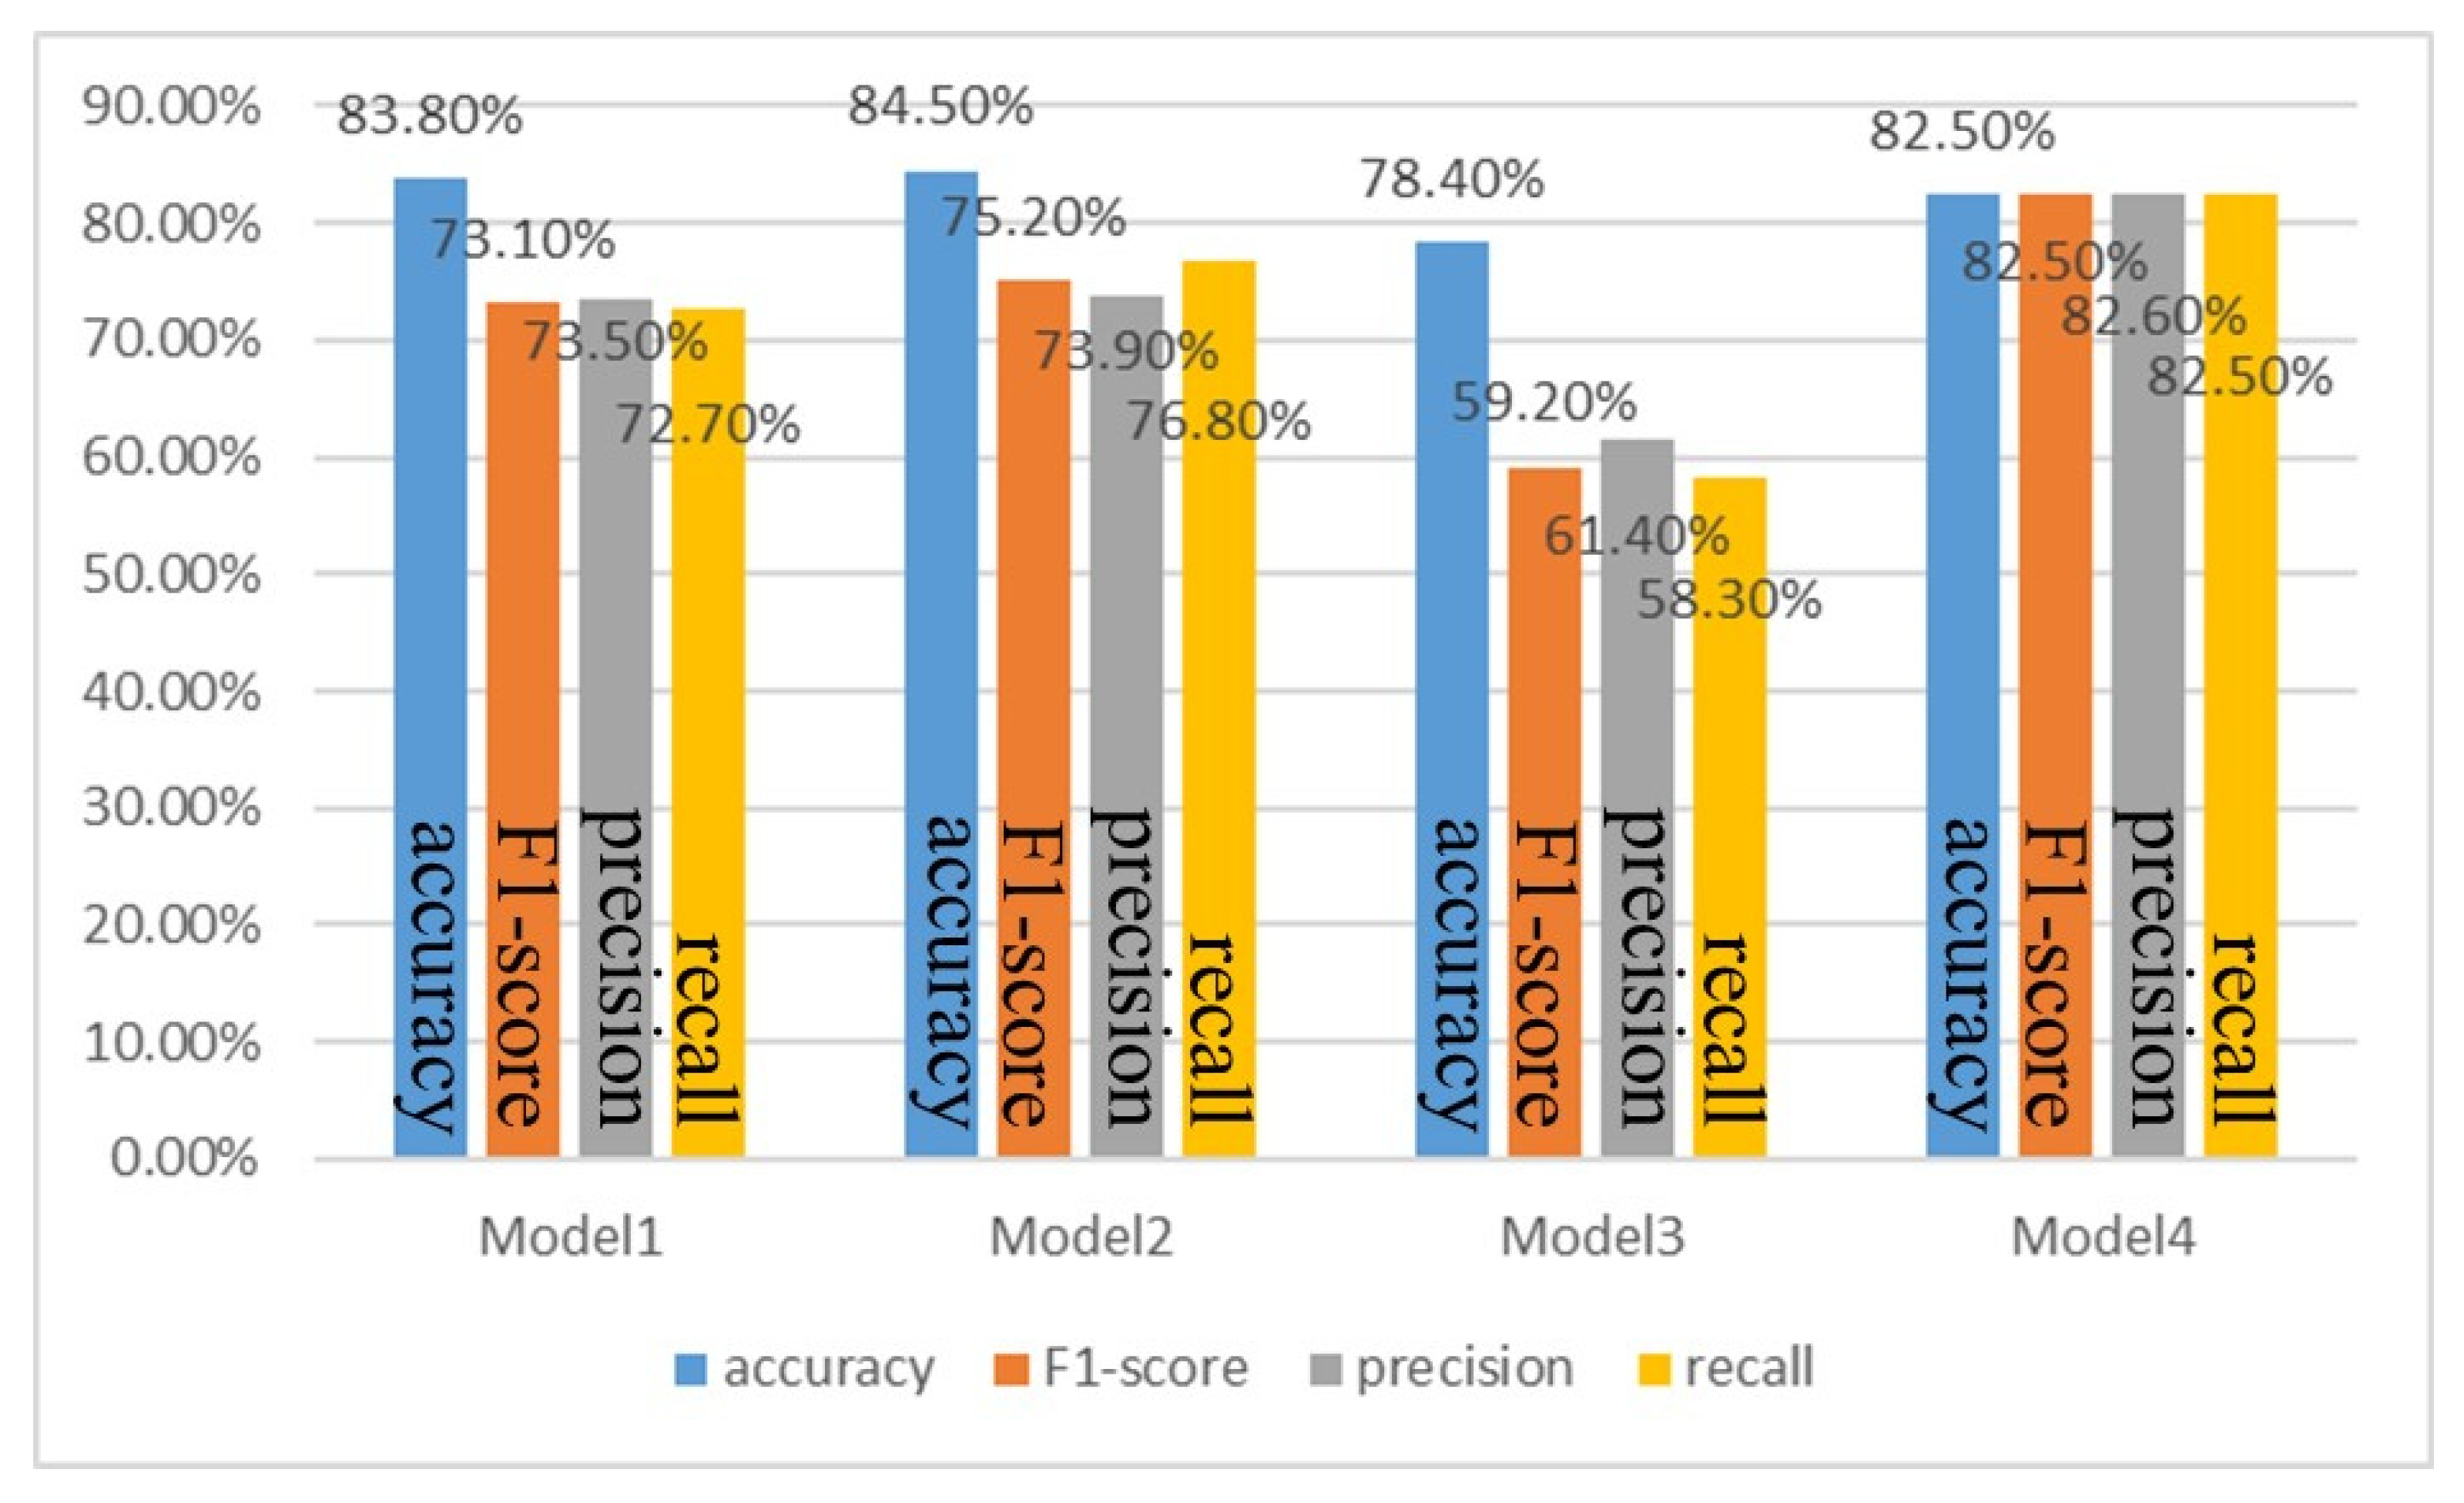
5.4. (RQ-4) to What Extent Does the Proposed Machine Learning Technique Predict the Nature of Blockchain Publications, i.e., Engineering-Oriented R&D Projects or Societal Aspects of Blockchain Technology?

We observe that blockchain research can be categorized into two types: blockchain R&D (algorithm improvement, application development, etc.) and non-R&D (social study, policy studies, etc.). Table 6 shows the proportion of R&D and non-R&D.
Herein, we propose four models based on the ERNIE 2.0 AI algorithm. Model 1 was trained with all combined data from China and Korea. Model 2 was trained using data from China. Model 3 was trained using data from Korea. Model 4 avoided the error due to the difference in the number of dichotomous samples; 300 technical and 300 non-technical data were randomly extracted from the total data. The results in Figure 6 show that all models except Model 3 have an accuracy of over 80% and an F1-score of over 70%. Among them, Model 4 performs the best, with all indicators exceeding 80%. This indicates that Model 4 was relatively reliable. Using Model 4, we can quickly determine from the abstract, whether the article presents blockchain R&D type of research.

6. Discussion

From our results, we observed that, both in China and South Korea, highly cited authors generally have many co-authors. The results suggest that researchers with more complex research networks tend to have more influence [40,41]. At present, cross-team cooperation has been produced in China’s cooperation network, while in Korea, cross-team cooperation is insufficient. Teamwork reduces the cost of each researcher, and knowledge and skills can be shared and integrated among partners [42]. Increasing team cooperation in the blockchain field helps create high-quality knowledge products and solves complex problems. Collaborative research in different fields can blur boundaries between cultures, regions, and disciplines [43,44]. Scientific knowledge can be promoted at the micro- (i.e., the research problem of a single blockchain) and macro- (the various fields related to the entire blockchain) levels. Since collaboration is crucial in the process of national innovation [45,46], it is suggested that the government should adopt policies for macro-regulation to promote the diversity of cooperation in blockchain technology. From the analysis results, we find that the density of knowledge networks in South Korea is higher than that in China. In most cases, the greater the overall density of the network, the more pronounced is the impact of the entire system on individual nodes [47]. Dense network ecology may interfere with individual behavior [24] and may result in limiting the individual’s unique development. Therefore, due to the relatively small restrictions on the growth of China’s knowledge network, it is expected that the structure of China’s blockchain knowledge network will become more complex and diversified in the future. China’s blockchain knowledge development will be stronger than that of South Korea.
In addition, we observed that the development modes of blockchain in the two countries are different, and the system may influence the emergence of this phenomenon to a certain extent. South Korea and China have many common cultures, such as Confucianism and Buddhism [10,11]. However, their political systems differ. Due to the different cultural backgrounds of Europe and America, the comparison between China and South Korea avoids the problem of culture when studying the development of innovative knowledge under different political systems. Socialist countries tend to guide national development through politics and overall planning [48,49]. In socialist countries, national policies often affect the development of every aspect of the country, and the social production structure and the country’s economy are dominated by the state [50]. Currently, China is the most representative socialist country. Although China has developed a market economy since the reform and is opening up in a sense, every aspect of development is planned by the government, whether it is the previous “Scientific Outlook on Development” or the more recent “Made in China 2025” and “One Belt, One Road” policy. This is different from the United States, South Korea, and other countries. For capitalist-dominated countries, actual economic and technological development may be more capital-driven, but there is some policy promotion and supervision by administrative systems. In addition, there may be some differences in the development of knowledge between the two systems for innovative and disruptive technologies. These differences may affect the development of innovative technologies in a country. As for the development of blockchain, several entities ranging from the President to various administrative organs of the government have been advocating the development of blockchain in China. Although the Chinese government does not advocate the transaction of Bitcoin and other digital currencies, according to our analysis results, research on blockchain is still developing rapidly and is diversifying. In contrast, in South Korea, as the government curbs the development of some exchanges, many companies are moving to more permissive environments such as Singapore. In capitalist countries, cost and efficiency usually affect social productivity and economics [51]. Although South Korea’s blockchain R&D has increased, it is not as good as China’s development trend. Thus, the development of controversial innovative technologies supported by the state is stronger in socialist countries. For socialist countries, positive recognition by the government is effective in promoting the development of blockchain. Alternatively, if capitalist countries want to develop blockchain, it will be beneficial to reduce costs and risks for enterprises, and the increased openness of market policies will increase the interest in blockchain development.
Examining the analysis results of RQ3 and RQ4, we observed that most of the research topics in China and South Korea are related to R&D, while other non-R&D topics are relatively few. This may be due to the fact that blockchain technology is not mature at present and there are few successful cases of commercialization. However, non-R&D research, such as that in sociology and commercialization, is also very important. To increase the production of high-impact research results, an interaction between science and technology and social sciences is needed to promote interdisciplinary research [52]. To promote the commercialization of blockchain, scholars in China and South Korea should strengthen research on management. It is suggested that non-R&D research should be strengthened to promote the healthy development of blockchain technology and industry from the social and commercial aspects. Innovation and new technologies often drive markets to flourish and ensure the competitiveness of the organization [53,54]. Blockchain cannot be ignored as an important innovative technology in the Fourth Industrial Revolution. It is necessary to encourage the development of blockchain-related research and commercialization from a macro perspective in advance to ensure competitiveness at the national level.
Since its launch in 2019, the Ernie model has achieved significant results on various globally recognized NLP-ranking platforms. At the time of writing this paper (21 April 2021), Ernie’s model is still No. 1 on Glue’s leaderboard [55]. However, although there are many papers on Ernie’s algorithm, there are few social science analyses on the actual application of Ernie’s model. In this study, we used Ernie 2.0, to build a model to predict whether an article is R&D and achieved good results. This verifies the application of the Ernie model in social studies.

7. Conclusions

This paper proposes a new triangulation research method to investigate the characteristics of the knowledge structure of blockchain between China and South Korea. First, we use the method of scientometric network analysis to analyze the annual trends in knowledge production, field research, and the development of knowledge structure in the two countries. Next, we use ML topic modeling to mine and analyze the research topics of the two countries. Finally, we propose a prediction technique in which the experimental results can be used to automatically predict whether the research is R&D content. We found that China’s blockchain knowledge network structure is relatively complex and diverse. Knowledge development is stronger than that in South Korea. Increased teamwork in blockchain is conducive to the creation of high-quality knowledge products. We suggest that the government promotes diversified cooperation on blockchain technology through macro-control policies. In addition, non-R&D research in the two countries is relatively insufficient, and it is suggested that research on commercial and social issues be increased. Finally, we verify the application of Ernie’s model in the social sciences, which provides a new idea for the sociological analysis of natural language processing. Although this study achieved a relatively reliable analysis by building models based on Ernie 2.0′s algorithm, it does not address whether other algorithms perform better than Ernie 2.0. We did not make changes to the Ernie 2.0 algorithm. This represents one of our limitations. Nonetheless, this study validates a feasible and relatively reliable semantic classification method for social scientists and other researchers. This article only considers English articles in the WOS database and does not consider the cooperative network of Chinese and Korean articles, which is a constraint. In addition, the comparative study between China and South Korea may not fully represent all of the countries studying blockchain, which is also a limitation of our study.

Author Contributions

Conceptualization, Y.-P.Z. and H.-W.P.; methodology, Y.-P.Z. and H.-W.P.; software, Y.-P.Z.; validation, Y.-P.Z. and H.-W.P.; formal analysis, Y.-P.Z.; investigation, Y.-P.Z.; data curation, Y.-P.Z. and H.-W.P.; writing—original draft preparation, Y.-P.Z.; writing—review and editing, Y.-P.Z. and H.-W.P.; visualization, Y.-P.Z.; supervision, H.-W.P.; project administration, Y.-P.Z. and H.-W.P. All authors have read and agreed to the published version of the manuscript.

Funding

This research received no external funding.

Institutional Review Board Statement

Not applicable.

Informed Consent Statement

Not applicable.

Data Availability Statement

Not applicable.

Conflicts of Interest

The authors declare no conflict of interest.

Other Statements

In this study, new data and new methods were added based on the first author′s doctoral dissertation.

References

  1. Chen, Y.; Bellavitis, C. Blockchain disruption and decentralized finance: The rise of decentralized business models. J. Bus. Ventur. Insights 2020, 13, e00151. [Google Scholar] [CrossRef]
  2. Aslam, J.; Saleem, A.; Khan, N.T.; Kim, Y.B. Factors influencing blockchain adoption in supply chain management practices: A study based on the oil industry. J. Innov. Knowl. 2021, 6, 124–134. [Google Scholar] [CrossRef]
  3. Yao, Q. Blockchain and Central Bank Digital Currency. Yicai. 2020. Available online: https://www.yicai.com/news/100576775.html (accessed on 10 May 2020). (In Chinese).
  4. Zhu, Y.; Park, H.W. Uncovering blockchain research publications in Asia compared to the rest of the world. J. Korean Data Anal. Soc. 2020, 22, 513–526. [Google Scholar] [CrossRef]
  5. Nakamoto, S. Bitcoin: A Peer-to-Peer Electronic Cash System 2008. Available online: https://bitcoin.org/bitcoin.pdf (accessed on 11 February 2022).
  6. Park, H.W.; Ozel, B. The rise of blockchain technology: Overcoming theoretical poverty and its implications for developing countries. J. Contemp. East. Asia 2019, 18, 1–8. [Google Scholar] [CrossRef]
  7. BlockData. 2019 Asian Blockchain Development Report. 2019. Available online: https://www.blockdata.club (accessed on 23 June 2020).
  8. Lim, C.; Wang, Y.; Ren, J.; Lo, S.W. A review of fast-growing blockchain hubs in Asia. J. Br. Blockchain Assoc. 2019, 2, 1–16. [Google Scholar] [CrossRef]
  9. Dimitrov, B. These Chinese Blockchain Platforms Are Launching Soon, Here Is Why. 2020. Available online: https://www.forbes.com/sites/biserdimitrov/2020/04/16/these-chinese-blockchain-platforms-are-launching-soon-here-is-why (accessed on 12 June 2020).
  10. Danowski, J.A.; Park, H.W. East Asian Communication Technology Use and Cultural Values. J. Contemp. East. Asia 2020, 19, 43–58. [Google Scholar] [CrossRef]
  11. Yoon, J.; Yang, J.S.W.; Park, H.W. Quintuple helix structure of Sino-Korean research collaboration in science. Scientometrics 2017, 113, 61–81. [Google Scholar] [CrossRef]
  12. Olajide, O.T.; Lawal, O.R. Triangulation Method in Management Sciences Research. Ann. Univ. Craiova Econ. Sci. Ser. 2020, 1, 141–154. [Google Scholar]
  13. Oppermann, M. Triangulation—A methodological discussion. Int. J. Tour. Res. 2000, 2, 141–145. [Google Scholar] [CrossRef]
  14. Webb, E.J.; Campbell, D.T.; Schwartz, R.D.; Sechcrest, L. Unobtrusive Measures: Nonreactive Research in the Social Sciences; Rand McNally: Chicago, IL, USA, 1966. [Google Scholar]
  15. Wambugu, L.; Njoroge, N. The search for understanding of mixed method research among graduate students: A case of learners in the school of continuing and distance education, university of Nairobi, Kenya. Qual. Quant. 2021. [CrossRef]
  16. Franco, M.; Pinho, C. A case study about cooperation between University Research Centres: Knowledge transfer perspective. J. Innov. Knowl. 2019, 4, 62–69. [Google Scholar] [CrossRef]
  17. Luthardt, J.; Morgan, J.H.; Bormann, I.; Schröder, T. Quantifying emotionally grounded discursive knowledge with cognitive-affective maps. Qual. Quant. 2021. [Google Scholar] [CrossRef]
  18. Kim, M.Y.; Lee, H.J.; Min, K.R. Mechanisms of perceived accountability in Korean NPOs: Activating the dynamics of NPM-driven and confucian-driven cultures. Qual. Quant. 2021, 55, 1917–1944. [Google Scholar] [CrossRef]
  19. Park, S.; Park, H.W. A webometric network analysis of electronic word of mouth (eWOM) characteristics and machine learning approach to consumer comments during a crisis. Prof. De La Inf. 2020, 29, e290516. [Google Scholar] [CrossRef]
  20. Zhang, J. Promotion criteria, faculty experiences and perceptions: A qualitative study at a key university in China. Int. J. Educ. Dev. 2013, 33, 185–195. [Google Scholar] [CrossRef]
  21. Sivertsen, G. Patterns of internationalization and criteria for research assessment in the social sciences and humanities. Scientometrics 2016, 107, 357–368. [Google Scholar] [CrossRef] [PubMed] [Green Version]
  22. Davarpanah, M.R.; Aslekia, S. A scientometric analysis of international LIS journals: Productivity and characteristics. Scientometrics 2008, 77, 21–39. [Google Scholar] [CrossRef] [Green Version]
  23. Mingers, J.; Leydesdorff, L. A review of theory and practice in scientometrics. Eur. J. Oper. Res. 2015, 246, 1–19. [Google Scholar] [CrossRef] [Green Version]
  24. Shelton, R.C.; Lee, M.; Brotzman, L.E.; Crookes, D.M.; Jandorf, L.; Erwin, D.; Gage-Bouchard, E.A. Use of social network analysis in the development, dissemination, implementation, and sustainability of health behavior interventions for adults: A systematic review. Soc. Sci. Med. 2019, 220, 81–101. [Google Scholar] [CrossRef]
  25. Park, S.; Chung, S.; Park, H.W. Analytical framework for evaluating digital diplomacy using network analysis and topic modeling: Comparing South Korea and Japan. Inf. Processing Manag. 2019, 56, 1468–1483. [Google Scholar] [CrossRef] [Green Version]
  26. Van Eck, N.J.; Waltman, L. How to normalize cooccurrence data? An analysis of some well-known similarity measures. J. Am. Soc. Inf. Sci. Technol. 2009, 60, 1635–1651. [Google Scholar] [CrossRef] [Green Version]
  27. Smith, M.A.; Shneiderman, B.; Milic-Frayling, N.; Mendes Rodrigues, E.; Barash, V.; Dunne, C.; Capone, T.; Perer, A.; Gleave, E. Analyzing (Social Media) Networks with NodeXL. In Proceedings of the Fourth International Conference on Communities and Technologies, University Park, PA, USA, 25–27 June 2009; pp. 255–264. [Google Scholar] [CrossRef] [Green Version]
  28. Park, H.; Park, H.W. Global-level relationships of international student mobility and research mentions on social media. Prof. De La Inf. 2021, 30, e300214. [Google Scholar] [CrossRef]
  29. Freeman, L.C. Centrality in social networks conceptual clarification. Soc. Netw. 1978, 1, 215–239. [Google Scholar] [CrossRef] [Green Version]
  30. Bonacich, P. Some unique properties of eigenvector centrality. Soc. Netw. 2007, 29, 555–564. [Google Scholar] [CrossRef]
  31. Khan, G.F.; Lee, S.; Park, J.Y.; Park, H.W. Theories in communication science: A structural analysis using webometrics and social network approach. Scientometrics 2016, 108, 531–557. [Google Scholar] [CrossRef]
  32. Kibria, M.G.; Nguyen, K.; Villardi, G.P.; Zhao, O.; Ishizu, K.; Kojima, F. Big data analytics, machine learning, and artificial intelligence in next-generation wireless networks. IEEE Access 2018, 6, 32328–32338. [Google Scholar] [CrossRef]
  33. Jung, N.; Lee, G. Automated classification of building information modeling (BIM) case studies by BIM use based on natural language processing (NLP) and unsupervised learning. Adv. Eng. Inform. 2019, 41, e100917. [Google Scholar] [CrossRef]
  34. Blei, D.M.; Ng, A.Y.; Jordan, M.I. Latent dirichlet allocation. J. Mach. Learn. Res. 2003, 3, 993–1022. [Google Scholar]
  35. Hagen, L. Content analysis of e-petitions with topic modeling: How to train and evaluate LDA models? Inf. Processing Manag. 2018, 54, 1292–1307. [Google Scholar] [CrossRef]
  36. Genism. Models.ldamodel. 2020. Available online: https://radimrehurek.com/gensim/models/ldamodel.html (accessed on 20 February 2020).
  37. Sun, Y.; Wang, S.; Li, Y.; Feng, S.; Tian, H.; Wu, H.; Wang, H. ERNIE 2.0: A continual pre-training framework for language understanding. Proc. AAAI Conf. Artif. Intell. 2020, 34, 8968–8975. [Google Scholar] [CrossRef]
  38. State Council of China. The 13th Five-Year Plan for National Informatization. 2016. Available online: http://www.gov.cn/zhengce/content/2016-12/27/content_5153411.htm (accessed on 16 May 2020). (In Chinese)
  39. Ministry of Industry and Information Technology of China. White Paper on China’s Blockchain Industry in 2018. 2018. Available online: http://www.miit.gov.cn/n1146290/n1146402/n1146445/c6180238/part/6180297.pdf (accessed on 20 February 2020). (In Chinese)
  40. Abramo, G.; D’Angelo, C.A.; Di-Costa, F. The collaboration behavior of top scientists. Scientometrics 2019, 118, 215–232. [Google Scholar] [CrossRef] [Green Version]
  41. Martín-Sempere, M.J.; Garzón-García, B.; Rey-Rocha, J. Team consolidation, social integration and scientists’ research performance: An empirical study in the Biology and Biomedicine field. Scientometrics 2008, 76, 457–482. [Google Scholar] [CrossRef]
  42. Scarazzati, S.; Wang, L. The effect of collaborations on scientific research output: The case of nanoscience in Chinese regions. Scientometrics 2019, 121, 839–868. [Google Scholar] [CrossRef] [Green Version]
  43. Perz, S.G.; Brilhante, S.; Brown, I.F.; Michaelsen, A.C.; Mendoza, E.; Passos, V.; Pinedo, R.; Reyes, J.F.; Rojas, D.; Selaya, G. Crossing boundaries for environmental science and management: Combining interdisciplinary, interorganizational and international collaboration. Environ. Conserv. 2010, 37, 419–431. [Google Scholar] [CrossRef]
  44. Park, H.W. A new era of Quality & Quantity: International Journal of Methodology—Collaborate or Fall Behind. Qual. Quant. 2020, 54, 1–2. [Google Scholar] [CrossRef] [Green Version]
  45. Ferligoj, A.; Kronegger, L.; Mali, F.; Snijders, T.A.B.; Doreian, P. Scientific collaboration dynamics in a national scientific system. Scientometrics 2015, 104, 985–1012. [Google Scholar] [CrossRef] [Green Version]
  46. Sena, V.; Arranz, N.; Lucas, P.; Park, H.W.; de Arroyabe, J.C.F. Editorial: Big Data and Network Analysis in National Innovation Systems (NIS). Technol. Forecast. Soc. Change 2021, 168, e120790. [Google Scholar] [CrossRef]
  47. Baik, J.S. When People Speak Out Opinions: Ego-Density, Network Centrality and Opinion Expression. Political Networks Workshops & Conference. 2018. Available online: https://ssrn.com/abstract=3212665 (accessed on 11 February 2022).
  48. Yoon, J.; Park, H.W. Pattern and trend of scientific knowledge production in North Korea by a semantic network analysis of papers in journal titled technological innovation. Scientometrics 2020, 124, 1421–1438. [Google Scholar] [CrossRef]
  49. Park, H.W.; Yoon, J. Structural characteristics of institutional collaboration in North Korea analyzed through domestic publications. Scientometrics 2019, 119, 771–787. [Google Scholar] [CrossRef]
  50. Naughton, B. Is China socialist? J. Econ. Perspect. 2017, 31, 3–24. [Google Scholar] [CrossRef] [Green Version]
  51. Akulich, M.; Kaźmierczyk, J. The socio-economic approach to the study of main economic systems. Socialism and capitalism. Part 1. Management 2018, 22, 238–250. [Google Scholar] [CrossRef] [Green Version]
  52. Chen, S.; Arsenault, C.; Larivière, V. Are top-cited papers more interdisciplinary? J. Informetr. 2015, 9, 1034–1046. [Google Scholar] [CrossRef]
  53. Malmström, M.M.; Johansson, J. Social exchange in collaborative innovation: Maker or breaker. J. Innov. Entrep. 2015, 5, e4. [Google Scholar] [CrossRef] [Green Version]
  54. Rakhmatullin, R.; Brennan, L. Facilitating innovation in European research area through pre-competitive EU-funded COST Actions. J. Innov. Entrep. 2014, 3, e6. [Google Scholar] [CrossRef] [Green Version]
  55. SuperGlue. Leaderboard. Available online: https://gluebenchmark.com/leaderboard (accessed on 21 April 2021).
Figure 1. Structure diagram of Ernie 2.0 (diagram drawn based on the figure of Sun et al. (2020) [37].
Sustainability 14 02326 g001
Figure 2. Trends in the number of blockchain publications.
Sustainability 14 02326 g002
Figure 3. Collaboration networks in China and South Korea.
Sustainability 14 02326 g003
Figure 4. Each stage of the knowledge network structure.
Sustainability 14 02326 g004
Figure 5. Coherence score, perplexity score, and distance map of topics.
Sustainability 14 02326 g005
Figure 6. Model effect.
Sustainability 14 02326 g006
Table 1. Hottest research subject fields in publications (top 20).
Fields (China)Record (China)% of 1373 (China)RankFields (South Korea)Record (South Korea)% of 311 (South Korea)
Computer science information systems68049.5271Computer science information systems14747.267
Engineering electrical electronic60944.3552Engineering electrical electronic13643.730
Telecommunications59343.1903Telecommunications10333.119
Computer science theory methods1249.0314Physics applied4113.183
Computer science interdisciplinary applications1007.2835Green sustainable science technology278.682
Computer science hardware architecture987.1386Chemistry analytical258.039
Computer science software engineering936.7737Environmental sciences258.039
Engineering industrial815.8998Instruments instrumentation258.039
Automation control systems614.4439Environmental studies237.395
Transportation science technology503.64210Materials science multidisciplinary237.395
Instruments instrumentation392.84011Computer science hardware architecture216.752
Operations research management science392.84012Engineering multidisciplinary206.431
Chemistry analytical372.69513Chemistry multidisciplinary196.109
Computer science artificial intelligence372.69514Computer science theory methods185.788
Energy fuels322.33115Computer science software engineering154.823
Business312.25816Computer science interdisciplinary applications134.180
Materials science multidisciplinary312.25817Energy fuels103.215
Computer science cybernetics282.03918Business82.572
Management282.03919Multidisciplinary sciences72.251
Physics applied261.89420Computer science artificial intelligence61.929
Table 2. Network centrality for authors, organization, and countries with the most articles and citations.
IDAuthor (China)DocumentsCitationsDegreeBetweenness CentralityEigenvect Centrality
1Du, xiaojiang30557780.4291.000
2Zhang, yan231020670.6690.086
IDAuthor (South Korea)DocumentsCitationsDegreeBetweenness centralityEigenvector centrality
1Park, jong hyuk30760301.0000.000
IDOrganization (China Mainland)DocumentsCitationsDegreeBetweenness centralityEigenvector centrality
1Beijing university posts & telecommunications931512950.6660.946
IDOrganization (South Korea)DocumentsCitationsDegreeBetweenness centralityEigenvector centrality
1Seoul national university science & technology35762170.4720.327
IDCountry (China Mainland)DocumentsCitationsDegreeBetweenness centralityEigenvector centrality
1China Mainland137313,871601.0001.000
2USA2292957260.0570.693
IDCountry (South Korea)DocumentsCitationsDegreeBetweenness centralityEigenvector centrality
1South Korea3112627361.0001.000
2USA32398160.0710.655
Table 3. Structural index of each whole network.
Network TypesNodesLinksMaximum Geodesic DistanceAverage Geodesic DistanceGraph Density
Whole author network (China Mainland)404211,299186.2600.001
Group 1 (author network)23457882186.2710.002
Group 2 (author network)3310632.0990.201
Whole author network (South Korea)750150151.9380.005
Group 1 (author network)5917452.4940.102
Group 2 (author network)3010552.3360.241
Whole organization network (China Mainland)1221401583.5250.005
Group 1 (organization network)1064382083.5270.007
Group 2 (organization network)137810.9231.000
Whole organization network (South Korea)28052894.2390.014
Group 1 (organization network)22349294.2470.020
Group 2 (organization network)5521.2000.500
Whole country network
(China Mainland)
6128521.8140.156
Whole country network
(South Korea)
3710921.7870.164
Table 4. Topics of China.
TopicsKey Words of Topics
Topic 1:
Computing and technology
computing, blockchain, edge, analysis, mining, Bitcoin, communication, Peer-to-peer, network, task, mobile, game, attack, systems, technology, modeling,
distributed, consensus, mechanism, allocation
Topic 2:
IoT and smart contract
blockchain, encryption, IoT, sharing, smart, contract, chain, data, theory, supply, control, security, learning,
attribute-based, searchable, access, management, cloud, industry, consensus
Topic 3:
Traceability and authentication
blockchain, energy, traceability, signature, IoT, network, systems, supply, food, data, networks, smart, chain,
security, health, algorithm, authentication, model,
transaction, protection
Topic 4:
Privacy and reliability
blockchain, smart, auditing, servers, privacy, reliability, integrity, cloud, management, energy, storage, fair,
medical, digital, charging, protection, vehicular,
technology, knowledge, crowdsourcing
Topic 5:
State and consortium
blockchain, state, public, privacy, consortium,
mechanism, Smart, records, security, computing, access, manufacturing, consensus, Cloud, management,
Industrial, key, control, network, equipment
Table 5. Topics of South Korea.
TopicsKey Words of Topics
Topic 1:
privacy and security
blockchain, privacy, IoT, security, computing, smart, management, data, edge, network, access, bitcoin,
contract, trust, communication, wireless, Ethereum,
control, privacy-preserving, protection
Topic 2:
Data sharing and storage
blockchain, data, chain, computing, smart, medical,
supply, cloud, security, electronic, contract, sharing,
privacy, system, peer-to-peer, storage, learning, records, network, energy
Topic 3:
IoT and cloud
blockchain, consensus, smart, mechanism, IoT, data,
detection, distributed, cloud, storage, control,
management, service, contract, fault, cryptography,
algorithm, systems, intelligence, intrusion
Table 6. Proportion of R&D and non-R&D.
China (1373)South Korea (311)
R&D82%77%
Non-R&D18%23%
Publisher’s Note: MDPI stays neutral with regard to jurisdictional claims in published maps and institutional affiliations.

