Article

Can Senior Travelers Save Japanese Hot Springs? A Psychographic Segmentation of Visitors and Their Intention to Visit Onsen Establishments during COVID-19

Doshisha Business School, Doshisha University, Kyoto 602-8580, Japan
Sustainability 2022, 14(4), 2306; https://doi.org/10.3390/su14042306
Submission received: 21 January 2022 / Revised: 14 February 2022 / Accepted: 15 February 2022 / Published: 17 February 2022
(This article belongs to the Topic Sustainability in Hospitality and Tourism Management)

Abstract

:
To develop tourism products and campaigns that will not just help Japanese hot springs survive but revive and sustain them in the future, it is imperative to understand the behavioral intentions of its visitors during the coronavirus disease (COVID-19) pandemic. This study aims to investigate how the important market of senior Japanese visitors is characterized by their attitudes and feelings toward visiting hot springs during the COVID-19 pandemic. In addition, it explores whether external travel incentives can increase seniors’ intention to visit. A market research study was conducted on Japanese nationals, using 507 questionnaires. A factor analysis generated five attitude dimensions: (1) response efficacy, (2) perceived COVID-19 infectability, (3) self-efficacy, (4) crowding perception and feeling, and (5) perceived threat severity. Through k-means cluster analysis, the segmentation produced three distinct tourist segments: trusting seniors, concerned seniors, and indifferent seniors. Each segment is clearly described in terms of attitudes, considering distinct sociodemographic characteristics. Practical suggestions on managing and targeting these segments are also discussed.

1. Introduction

In recent years, the senior population has increased in many developed countries, and Japan is no exception. Of their 125 million citizens, 51 million (41%) are aged over 55 years [1] and are worth considering as an attractive tourist segment because their average income of 5.5 million to 11 million yen is considerably higher than that of their younger cohorts [2]. It is, therefore, important for tourism managers and policymakers to thoroughly understand this customer segment, as it can contribute significantly to the revenue of tourist attractions and business recovery post-COVID-19. This study focuses on the Japanese hot spring establishment called onsen, which is, according to Japanese law, defined as “hot water of at least 25 degrees springing from either natural or manmade holes” [3]. It plays a vital role in Japan’s wellness tourism, accumulating more than USD 12 billion in revenue in 2017, equivalent to 57% of Japan’s overall wellness tourism revenue that year [4].
Understanding the needs and concerns of attractive customer target groups has become even more vital as the tourism industry, and consequently, the wellness industry has suffered significantly due to the COVID-19 pandemic in Japan. After the first declaration of the “state of emergency” in April of 2020, the country has experienced a significant decrease in the number of leisure trips internationally and domestically [5], and more than 40 onsen resorts have filed for bankruptcy since the beginning of the pandemic [6]. While both international and domestic tourism activities are relevant to Japan’s tourism industry, it is particularly important to look at the domestic side, as it accounts for 96% of visitors to wellness locations within the country [4], and domestic tourism generated more than 80% of the country’s overall tourism revenue in 2018 [7].
Hence, the focus of this research is on understanding the feelings of Japanese seniors’ toward visiting onsen resorts during COVID-19, in terms of fear, motivation, intention to visit, and attitude toward discounts. For this purpose, the popular marketing tool of segmentation, which is used to categorize customers into groups based on the commonality of their actions and needs, and in this case, psychographics, was applied. This approach allows businesses to determine effective strategies that best capture their targeted segments [8]. In this context, one must also point out that since the beginning of the pandemic, Japan never imposed “hard lockdowns”, such as those enforced in France, Germany, and the UK, but only banned the arrival of international tourists [9]. Therefore, Japanese citizens could freely travel within the country for leisure purposes during the entire period.
An additional objective is to further fill the gap in the literature on senior tourists and travel fear in the following ways: There have been several publications on travel fear or worry, such as on the impact of COVID-19 on travel behavior and mode [10], changes in travel behavior during the Middle East Respiratory Syndrome outbreak in Seoul [11], or developing a model of travel fear [12], and even studies that used travel constraints as a segmentation variable [13,14]. However, none of the studies specifically researched the senior tourist travel segment. In addition, no study has addressed the impact of travel constraints in the wellness industry or used perception and attitude toward risk as a segmentation variable in understanding hot spring visitors. To address this gap, this study has two aims: (1) to segment senior Japanese visitors to hot springs by employing perceptions and attitudes toward COVID-19 as a segmentation variable and (2) to further the understanding of these visitors by identifying group differences in terms of worry, motivation, demographics, and attitude toward discounts.
The results will be useful for onsen businesses in strategically managing the senior visitors and considering appropriate on-site safety measures. In addition, the effects of government-initiated campaigns and business-initiated promotions, compared with no external stimulation on intention to visit, will be assessed, which will provide suggestions on the usefulness of spending on such campaigns for policymakers.

2. Literature Review

2.1. Tourism Risk Perception

There is evidence in the literature on the role of risk perception in consumer behavioral studies [15,16]. Tourist risk perception and its relevance to tourist behaviors and tourist travel intention have received wide interest from tourism scholars, especially after the terrorist attack on 11 September 2001 [17,18,19]. Tourist risk perception refers to the perception of consumers about the possibility of negative outcomes and the extent of uncertainty associated with purchasing a product or service at destinations [20,21].
A review of the literature revealed that the main risk factors in tourism arise from political instability, crime and terrorism, natural disasters, equipment failure, disease, and cultural barriers [22,23,24]. Tourism scholars have investigated this aspect in different contexts associated with tourism risks. For instance, Bianchi [25] discussed the politics of risk and analyzed how the geopolitics of security reshape the mobility of tourism. A study conducted by Wang [26] on disaster-hit destinations in Taiwan pointed out that tourists’ perceptions of equipment risk, natural risk, and social risk negatively influence their destination image, which is a strong determinant of their travel intention. More recently, in the context of the COVID-19 pandemic, work related to the impact of the pandemic on travel willingness, behavior, and intention has become more important with the increasing attention of tourism scholars [27,28,29,30].

2.2. Travel Worry and Travel Fear

Kummeneje and Rundmo [31] argued that even though risk perception research has been intensive in tourism literature, the role of emotional aspects, such as fear and worry, in perceived risks and their relevance to travel-making decisions need more studies. According to Wilson and Little [32], fear is “a term that is socially and academically used to indicate emotion caused by imminent danger; apprehension, dread; and tied to our desire to avoid risk”. A pioneering study on tourist worry and the development of the tourist worry scale belongs to Larsen et al. [33]. In their research, worry is understood as “negative affect and relatively uncontrollable chains of thought as a function of uncertainty concerning possible future events”. According to this definition, worry is not identical to risk perception.
Although the literature on travel worry, travel fear, and risk perception is scarce, several studies have contributed to the understanding of the association between these emotional aspects and risk perception in predicting risk-protective behavior and travel intention [28,31,34]. Chien et al. [34] found that worry is an antecedent to risk perception and risk-protecting behavior. Kummeneje and Rundmo [31], by applying structural equation modeling, confirmed that risk perception plays a significant role in predicting worry, which, in turn, influences the behavior of travelers. Meanwhile, Wang et al. [35] examined the role of travel worry on tourists’ safety behaviors and showed that worry varied with conditions. By developing an extended risk perception attitude framework, they found that, with a group of visitors who were relatively older and more cautious than other participants, worry did not affect their risk perception and self-protective behaviors. In a recent study about fear of COVID-19, Luo and Lam [28] pointed out that risk attitude moderated the impact between fear of COVID-19 and travel intention, showing that risk attitude negatively impacts people’s intention to travel.
In their studies on aging and development, Basevitz et al. [36] and Wilson et al. [37] suggested that with increasing age, older individuals exhibit a lower propensity to worry. Finally, different travel behaviors and levels of satisfaction have been reported between genders [38,39,40] and during times of distress [41,42,43], which is also a point of interest in this study.

2.3. Defining Senior Travelers

Various alternative terms have been used in the literature to describe senior travelers, including elderly tourists [44,45], older travelers [46,47], mature travelers, and grey tourists [48]. However, there is a lack of agreement among previous scholars regarding the official definition of seniors in general and senior travelers in particular. The cutoff age has been popularly used as a tool to distinguish seniors from younger travelers. However, the cutoff age in the existing literature varies across countries. For example, Faranda and Schmidt [49] mentioned that 65 years was a suitable cutoff age for marking entry into US seniors since it was the most common age at which US workers retire. You and O’leary [50] used 55 to 64 years as the age range for senior groups in the examination of older Japanese travelers. Huber et al. [51] defined German senior travelers as those aged 60 years or older.
Regarding characteristics and behavior of senior travelers, numerous tourism researchers agree that the senior traveler market is heterogeneous and, therefore, needs to be considered differently in predicting their traveling behaviors [52,53,54,55]. Boksberger and Laesser [56] strongly criticized the assumption that the senior market is homogeneous, and when people grow older, they become less similar. Previous research has shown that the travel behavior of senior tourists differs in terms of their age, marital status, and education [57]. In a longitudinal study of older Japanese travelers, You and O’Leary [51] mentioned that the travel characteristics and behavior of this market have changed over time. In particular, they pointed out that older Japanese travelers showed more active participation in traveling than their counterparts ten years ago.
Several comparative studies have been conducted on the difference in travel behavior between senior and non-senior travelers [58,59,60]. Senior travelers were more likely to use travel agents to make travel arrangements than younger travelers [58]. Reece [59] pointed out that on average, senior US travelers chose trips with greater distances than younger travelers. In a study of Chinese senior travelers to integrated resorts, Mary et al. [60] found that senior visitors were more price-sensitive than younger visitors and suggested that since younger generations often provide finance for elderly family members, tourism promoters could attract more senior travelers through their younger family members by promoting travel packages for the whole family or groups of senior travelers separately.

2.4. Senior Market Segmentation

Otoo, Kim, and Choi [61] claimed that owing to the heterogeneity of senior travelers, it is important to segment this market into smaller homogeneous groups to better understand their characteristics and predict their behavior. Based on a literature review, several approaches have been revealed for segmenting travelers. Geographic and demographic characteristics have been widely used in tourism literature to identify different market segments [62,63]. Lee [64] argued that, besides these geographic and demographic variables, psychological factors should be considered in the study of the senior traveler market. Many scholars have used psychographic approaches to investigate different factors, such as subjective age, travel motivation, and personal values, to segment senior travelers [64,65,66]. Travel motivation has received great interest from many tourism scholars studying the senior market. In an investigation of past publications on senior travelers from 1980 to 2017, Otoo and Kim [67] affirmed that travel motivations vary across different generations of senior travelers. For instance, Cleaver et al. [68] segmented senior Australian tourists into four groups: nostalgics, friends, learners, and escapists. Carneiro et al. [69] identified three distinct groups of Portuguese senior travelers: passive, sociocultural, and active seniors. In a more recent study involving motivation-based segmentation of Chinese senior travelers, five motivation clusters were extracted, among which the cluster of seniors who tended to be younger had the highest motivation across all motivation subsets [66].

2.5. Travel Constraints, Travel Worry, Travel Fear, and Perceived Risks of Senior Travelers

Travel constraints are defined as “barriers that inhibit people’s ability to travel, decrease traveling time, and frequency or cause less satisfactory travel experiences” [70]. Among studies on travel constraints, researchers have paid special attention to the senior population [51,71,72]. It has been documented from the literature that senior travelers face a number of constraints, which can be categorized into intrapersonal constraints (such as health or mobility concerns); interpersonal constraints (for example, lack of companionship or lack of support from family members to travel); structural travel constraints (for instance, time, cost constraints and the fear of perceived travel risks) [70].
Recently, tourism scholars have stressed the importance of travel worry, fear, perceived risks, and their relationship to travelers’ intentions and behavior [12,31,34]. However, these psychological facets have not been studied extensively as travel motivation in the segment of senior travelers. Some scholars have approached this matter and contributed to the exploration of the senior market in terms of travel worry, fear, and perceived risks. In a study on the impact of influenza disease on older tourists in Asia, Lee and Chen [73] found that the fear of bird flu did not significantly affect older tourists’ visit intention or their plan itineraries to China and Singapore. Le Serre et al. [74] conducted a comparative study between senior travelers in France and China and showed that Chinese seniors had a high perception of financial risk, while French seniors maintained an intense perception of physical risk. However, the least important perceived risk, that is, the risk of wasting time, was the same for both countries.

3. Methodology

3.1. Survey Design

The primary data used in this quantitative study were collected through a survey conducted by a market research company headquartered in Tokyo. The questionnaire contained three sections: motivation for travel to an onsen, perceptions and attitudes toward visiting an onsen during COVID-19, and intentions to visit an onsen. All items were measured using a 7-point Likert scale.
For measuring motivation, the 16-item scale by Chen, Prebensen, and Huan [75], which specifically measures motivations to visit wellness destinations, was adopted. After an extensive literature review, the author argued that an individual’s health motivation lies in their values, lifestyle, and cognitive elements. This may form a driving force and relate to the person’s updated knowledge of health problems, environmental degradation, or renewed interest in novelty seeking. They tested these assumptions using qualitative and quantitative methods involving visitors to wellness sites, tourism professionals, travel agents, and managers of wellness hotels, to develop a scale for a quantitative study. This scale was deemed the best option for the current study as it was developed in Taiwan, which has many hot springs with several similarities to onsen establishments; specifically, they share a strong focus on thermal water, healthy meals, and the natural environment. Furthermore, Taiwan has resorts built by Japanese operators such as the Hoshinoya Resort in Taichung.
To measure attitudes and perceptions, the following scales were used and adapted for this project. First, response efficacy, threat severity, and self-efficacy were measured using the scales developed by Zheng, Luo, and Ritchie [76], who used theories such as protection motivation theory, health psychology, and resilience theories to explore what triggers “travel fear” among Chinese people. Thus, 11 items from this study were included in the questionnaire. Second, crowding perception (two items), feeling toward crowdedness (one item), and perceived infectability (five items) were added from Kock et al. [77], who used evolutionary psychology to understand the impact of COVID-19 on the tourism psyche. They found that, next to ethnocentrism and xenophobia, crowdedness perception plays a vital role in perceived infectability and thus impacts travel behavior. Third, one item from Wang, Liu-Lastres, Ritchie, and Mills [78] measuring the level of worry was included and slightly adjusted by adding the word “onsen”.
Lastly, intention to visit was adapted from Hsu, Kang, and Lam [79] to cover the three most realistic conditions measured by three scales each (I intend to…/I want to…/It is likely that…): (1) visit intentions without external travel incentives; (2) visit intentions with attractive prices, that is, travel packages, which are one of the most favorable ways to travel for locals; (3) visit intentions with discounts offered by a national travel campaign, such as Go-To Travel. In this context, it would be of particular interest to explore if the Japanese would be increasingly willing to visit onsen establishments through such external stimuli, as suggested by Lam and Gao [80], Wong and Law [81], and Qui et al. [82]. According to Japanese experts in this project, attractive package prices are a major driving factor for travel motivation among the Japanese people, and the government travel campaign has been reported to increase national travel, as mentioned above.
Finally, before conducting the survey, the English draft was translated into Japanese using a professional translation service and pretested among a group of 17 undergraduate Japanese students. During this pretest, three photographs with hot spring scenes in Japan were given to participants with instructions to rank them in terms of which is best suited for the question on crowdedness in the questionnaire and “representing a typical onsen scene”. The most popular was selected for the questionnaire, and after minor adjustments, a market survey was conducted.

3.2. Sampling and Data Collection Method

Questionnaires were obtained through stratified random sampling, a useful method when certain criteria of interest, such as sex, place of residence, or age, of the target population are known. As there are no data available on the demographics of onsen visitors in Japan, the Japanese population census [1] was used as a reference. Therefore, the market research company was given the following instructions. A minimum of 1000 questionnaires were requested based on the following criteria: (1) gender: a minimum of 520 women and 480 men; (2) age groups: a minimum of 120 for the range 20–29 years, 130 for 30–39 years, 180 for 40–49 years, 160 for 50–59 years, and 410 for >60 years.
The second criterion was that questionnaires should be collected from residents of Tokyo to have a vast diversity of respondents born and raised in places all over Japan. Although there are no data on the place of birth of Tokyo residents available, it is known that out of its almost 10 million residents, two out of five are not native to Tokyo [83], and with an average of 400,000 Japanese people moving there annually from 2010 to 2020 [84], Tokyo represents a melting pot of locals and Japanese residents from all over the country who migrated to the capital for study and work. Another important argument is that 91% of Japan’s population resides in urban areas [85], with Tokyo being the most representative of all cities in Japan. Using the above strata, a total sample of 1042 questionnaires was collected in February 2021 using an online survey, of which 507 (respondents aged 55+ years were selected to have an adequate sample size for analysis) were used for this study on senior travelers.

3.3. Analysis

Analysis was performed using psychographics. It is a popular tool of market segmentation, which is used to categorize customers into groups based on the commonality of their actions and needs. This approach allows businesses to determine effective strategies that best capture their targeted segments [8]. Middleton and Clarke [86] further list the segmentation by buyer behavior or characteristic as one of the largely used segmentation techniques in tourism research. This analysis has been applied by several tourism researchers in the past, such as Yan et al. [87] for segmenting international heritage tourists to Taiwan based on activity participation; Boksberger and Laesser’s [56] study on segmenting Swiss senior travelers on their travel motivation; or Ko et al. [88] for exploring the perceptions of international tourists on Korean food tours. Similarly, segmentation studies have the potential to create a basis for targeted campaigns pertaining to tourist concerns and safety [13,14,89].
Before conducting the analysis, basic preprocessing steps were performed to ensure that the collected data were fit for analysis. First, questionnaires with missing data and straight-line answers were deleted by a market research company, resulting in 507 usable questionnaires. After no outliers were found in the only continuous category of age, the same number of questionnaires was used for analysis, which was carried out in five stages using SPSS 27.0. First, the demographic profiles of survey respondents’ descriptive statistics were identified. Second, exploratory factor analysis was conducted on the feelings of respondents toward visiting onsen resorts during COVID-19 to determine the underlying dimensions. Third, these factors were then used to interpret and label the clusters by data-driven k-means cluster analysis. Fourth, a discriminant analysis identified differences among clusters, and in the last step, the demographics and motivations of each cluster were examined using descriptive statistics and future intention to visit an onsen.

4. Results

4.1. Demographic Profile of the Respondents

Table 1 lists the various sociodemographic characteristics of the analyzed sample. Commonly collected data on income could not be presented as it is considered inappropriate in the Japanese cultural context.

4.2. Factor Analysis: Perception and Attitude toward COVID-19

First, Cronbach’s alpha values were computed to test the internal consistency of the scales; the values ranged from 0.928 to 0.711, which is above the most often cited minimum value of 0.70 [90,91]. Next, exploratory factor analysis with oblique (Promax) rotation was performed. This method assumes that underlying factors can be related to or correlated with each other, which is quite likely in the case of psychological constructs, and Promax rotation is very suitable for large datasets and human subjects [92]. Table 2 shows the mean values and standard deviations for each factor, factor loadings, explained variance, and Cronbach’s alphas. No item was excluded due to factor loadings or low commonalities, as all values except one were above the 0.6 threshold, which is considered reliable regardless of sample size and the thresholds of 0.5 (sample size > 300) or 0.4 (sample size > 500) as stated by Field [91], and the commonalities of the items ranged from 0.413 to 0.838, all above the recommended minimum of 0.3 [93].
As shown in Table 2, the factor analysis resulted in five factors explaining 74.40% of the variance, with a Kaiser–Meyer–Olkin of 0.817. All items were clearly allocated to one factor, and the factors were labeled as follows: (1) response efficacy, (2) perceived COVID-19 infectivity, (3) self-efficacy, (4) crowding perception and feeling, and (5) perceived threat severity. Upon further examination, item means illustrated that there was strong agreement with those measuring crowding perception and feeling, and some items measuring response efficacy and self-efficacy. Standard deviations indicate a larger range of dispersion for some items measuring perceived COVID-19 infectability, crowding perception and feeling, and perceived threat severity.

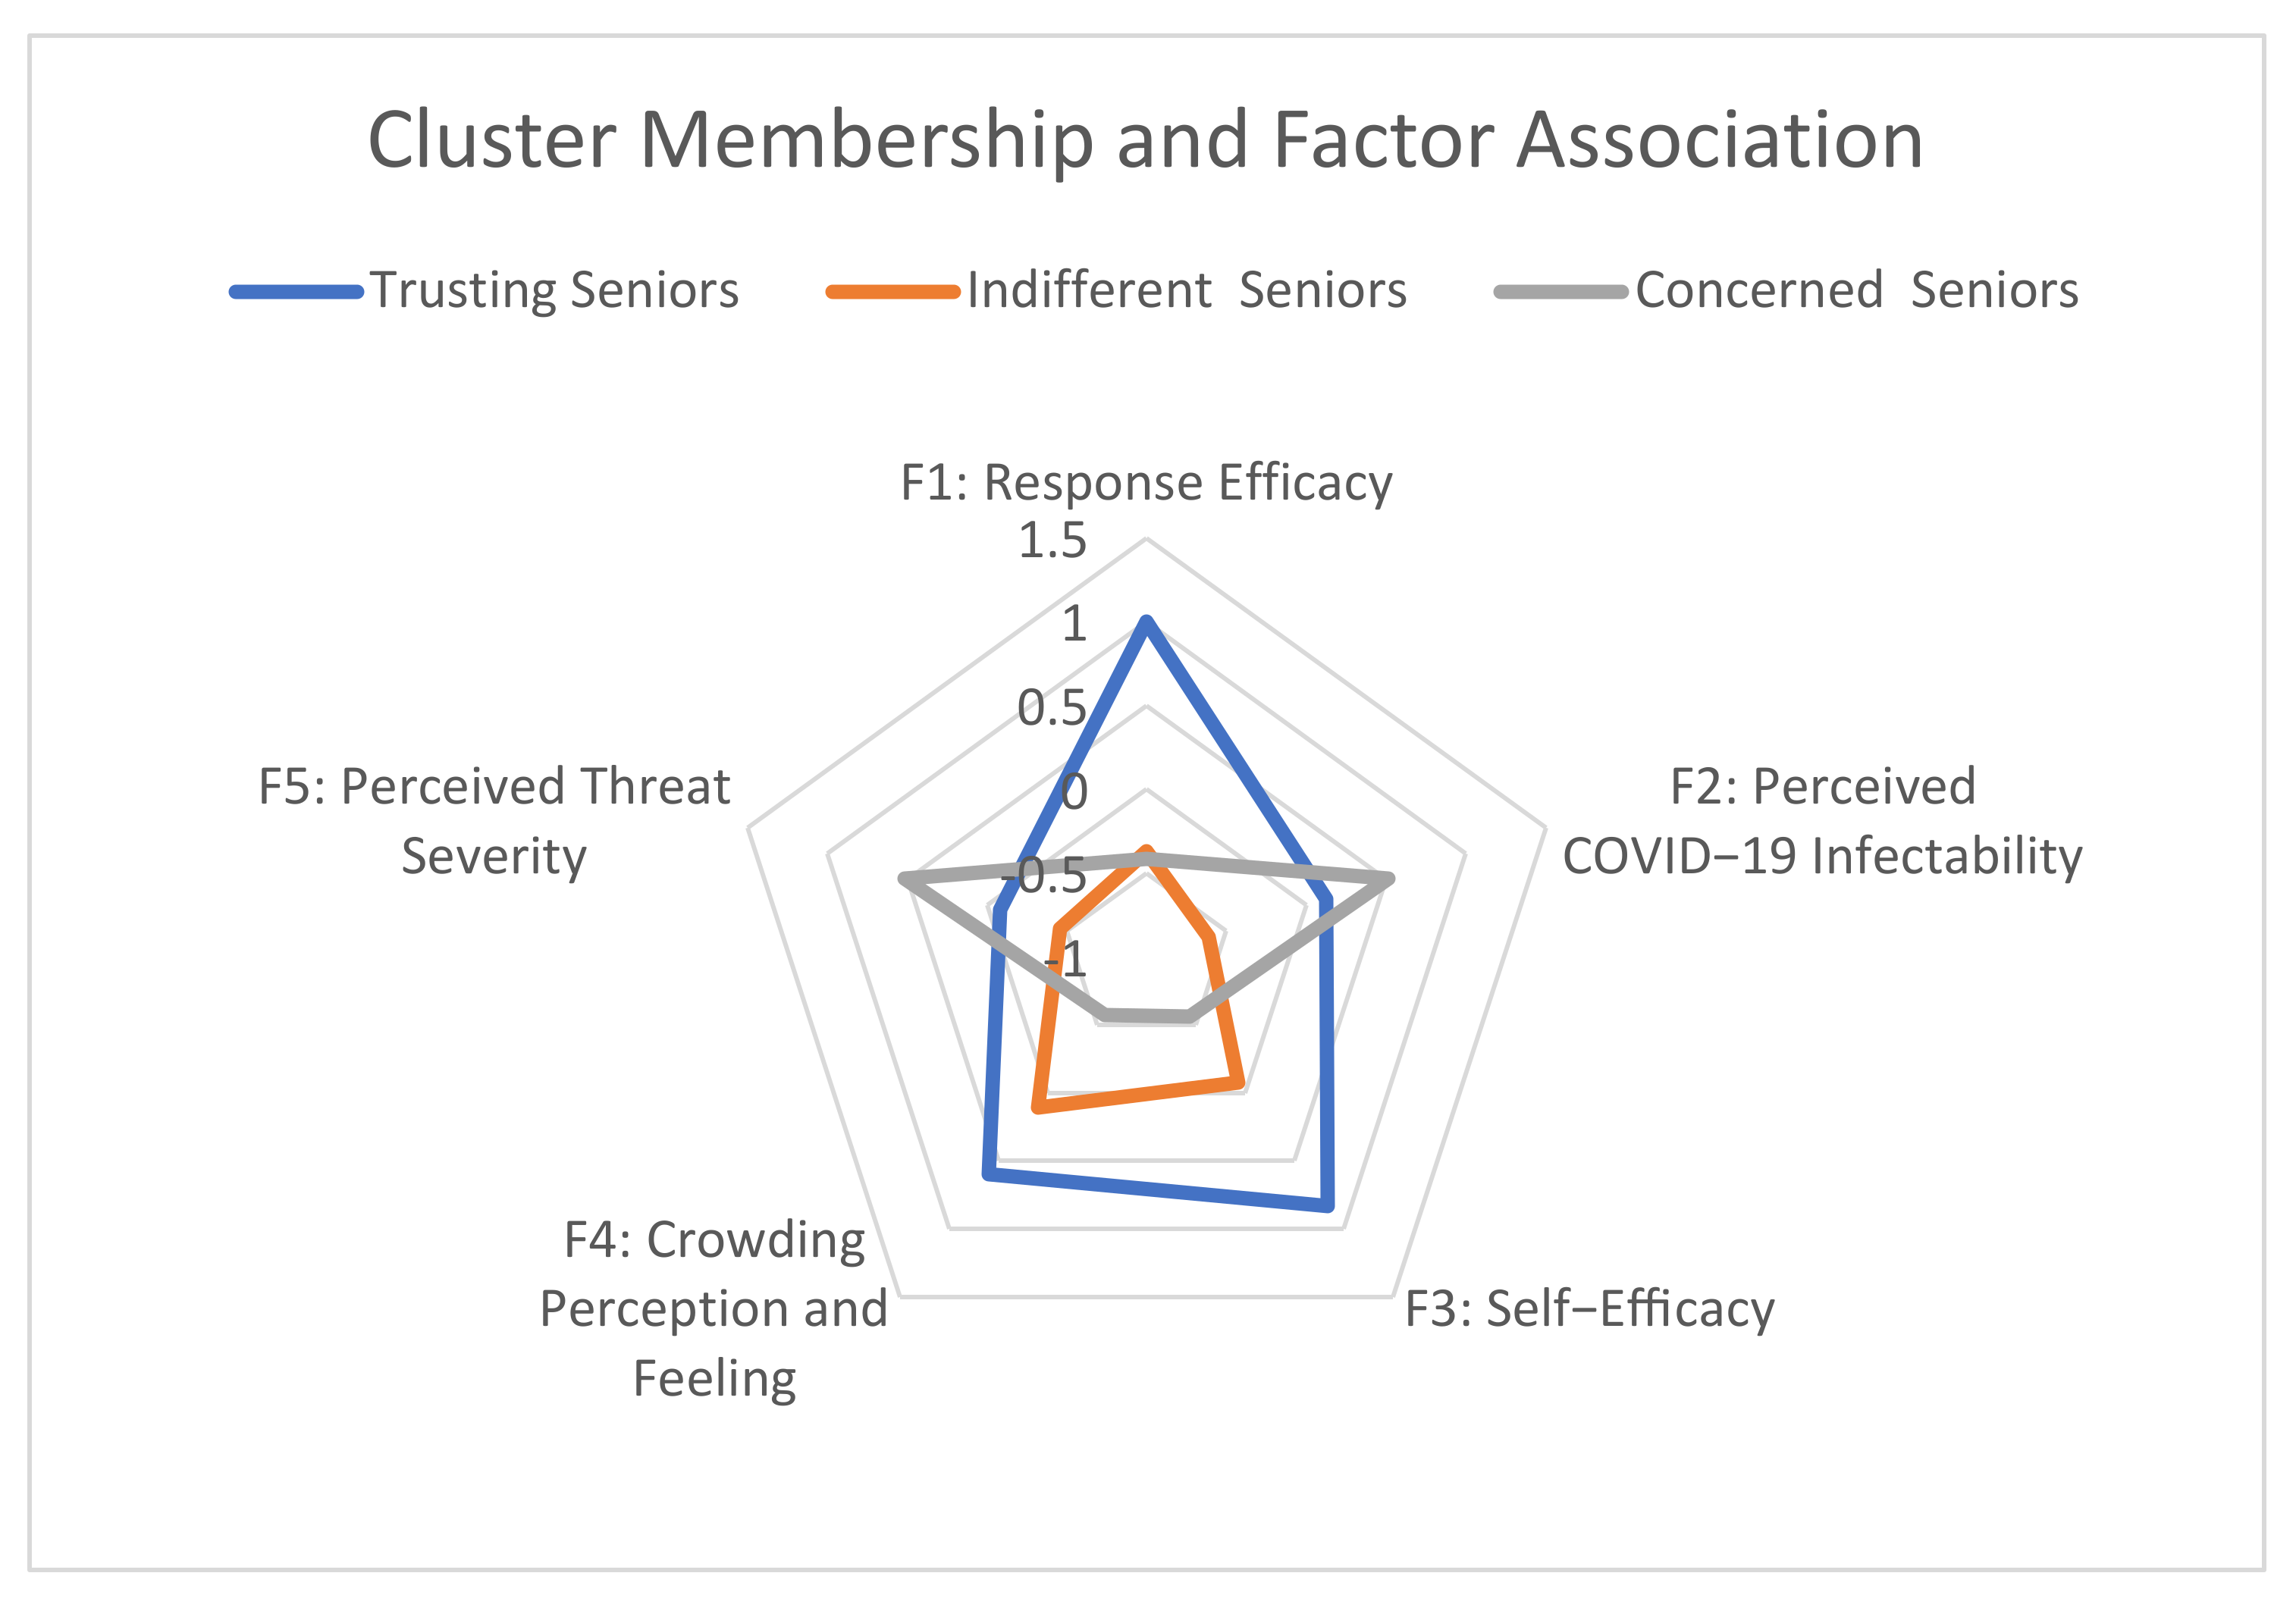
4.3. Segmentation Analysis

To obtain homogenous segments of the interviewees, non-hierarchical cluster analysis using the k-means algorithm was performed on the data. The five dimensions obtained from the factor analysis were used as segmentation variables, and the minimum sample size for 100 data points for one segmentation variable was N = 507 [94]. Two to six cluster solutions were analyzed, and both three- and four-cluster solutions provided interpretable cluster profiles, a short iteration history, and significant differences. However, the three-cluster solution was deemed more appropriate, as the four-cluster solution had one segment with a rather small number of members (n = 34). Figure 1 shows the visualization of the final cluster centers and shows the high affinity of “Trusting Seniors” (CL 1 members) to F1, F3, and F4, the negative affinity of “Indifferent Seniors” (CL 2) toward F1, F2, and F5, and negative affinity of “Concerned Seniors” (CL 3) to F1, F3, and F4 and positive to F2 and F5.
To assess whether segments are significantly different among the clustering variables, an ANOVA using the post hoc difference of means test with Bonferroni method was carried out, as suggested by Hair et al. [95], which resulted in one item not being significantly different (p > 0.05)—“Response Efficacy” (CL 2–3: p = 1.000); all other items were significantly different between clusters, with p < 0.001 (Table 3).
Discriminant analysis results (following Hair et al. [95]) are reported in Table 4, and both functions were statistically different with p < 0.001. Function 1 explains 70.2% of the variance and has an eigenvalue of 1.300, and Function 2 explains 29.8% of the variance, with an eigenvalue of 0.553. The classification results were explored to ascertain whether the functions are valid predictors of a group membership. Table 5 shows that there is a high degree of classification accuracy. The three-group discriminant model achieved a 94.1% overall prediction accuracy and predicted 90.8% for Cluster 1, 94.0% for Cluster 2, and 96.7% for Cluster 3 correctly.
Each cluster was then labeled after interpreting the cluster’s feelings toward travel, checking both the mean and standard deviation of the factors and individual questionnaire items, along with checking the final cluster centers. Significant sociodemographic characteristics, motivation, and intention to visit were further assessed by cross-tabulation and Chi-square tests, and the results are displayed in Table 6. The category age >75 years had a count of less than five and was, therefore, merged with the category age 70–74 years into the new category age >70 years. The findings indicated a significant difference between the clusters in terms of age and marital status but not in terms of sex or whether respondents had children in the household or not. Although Chi-square tests were significant when all seven Likert-scale options were evaluated for the characteristic “intention to visit”, the answers 5 = somewhat agree, 6 = agree, and 7 = strongly agree were merged into “agree” to simplify matters for reporting.

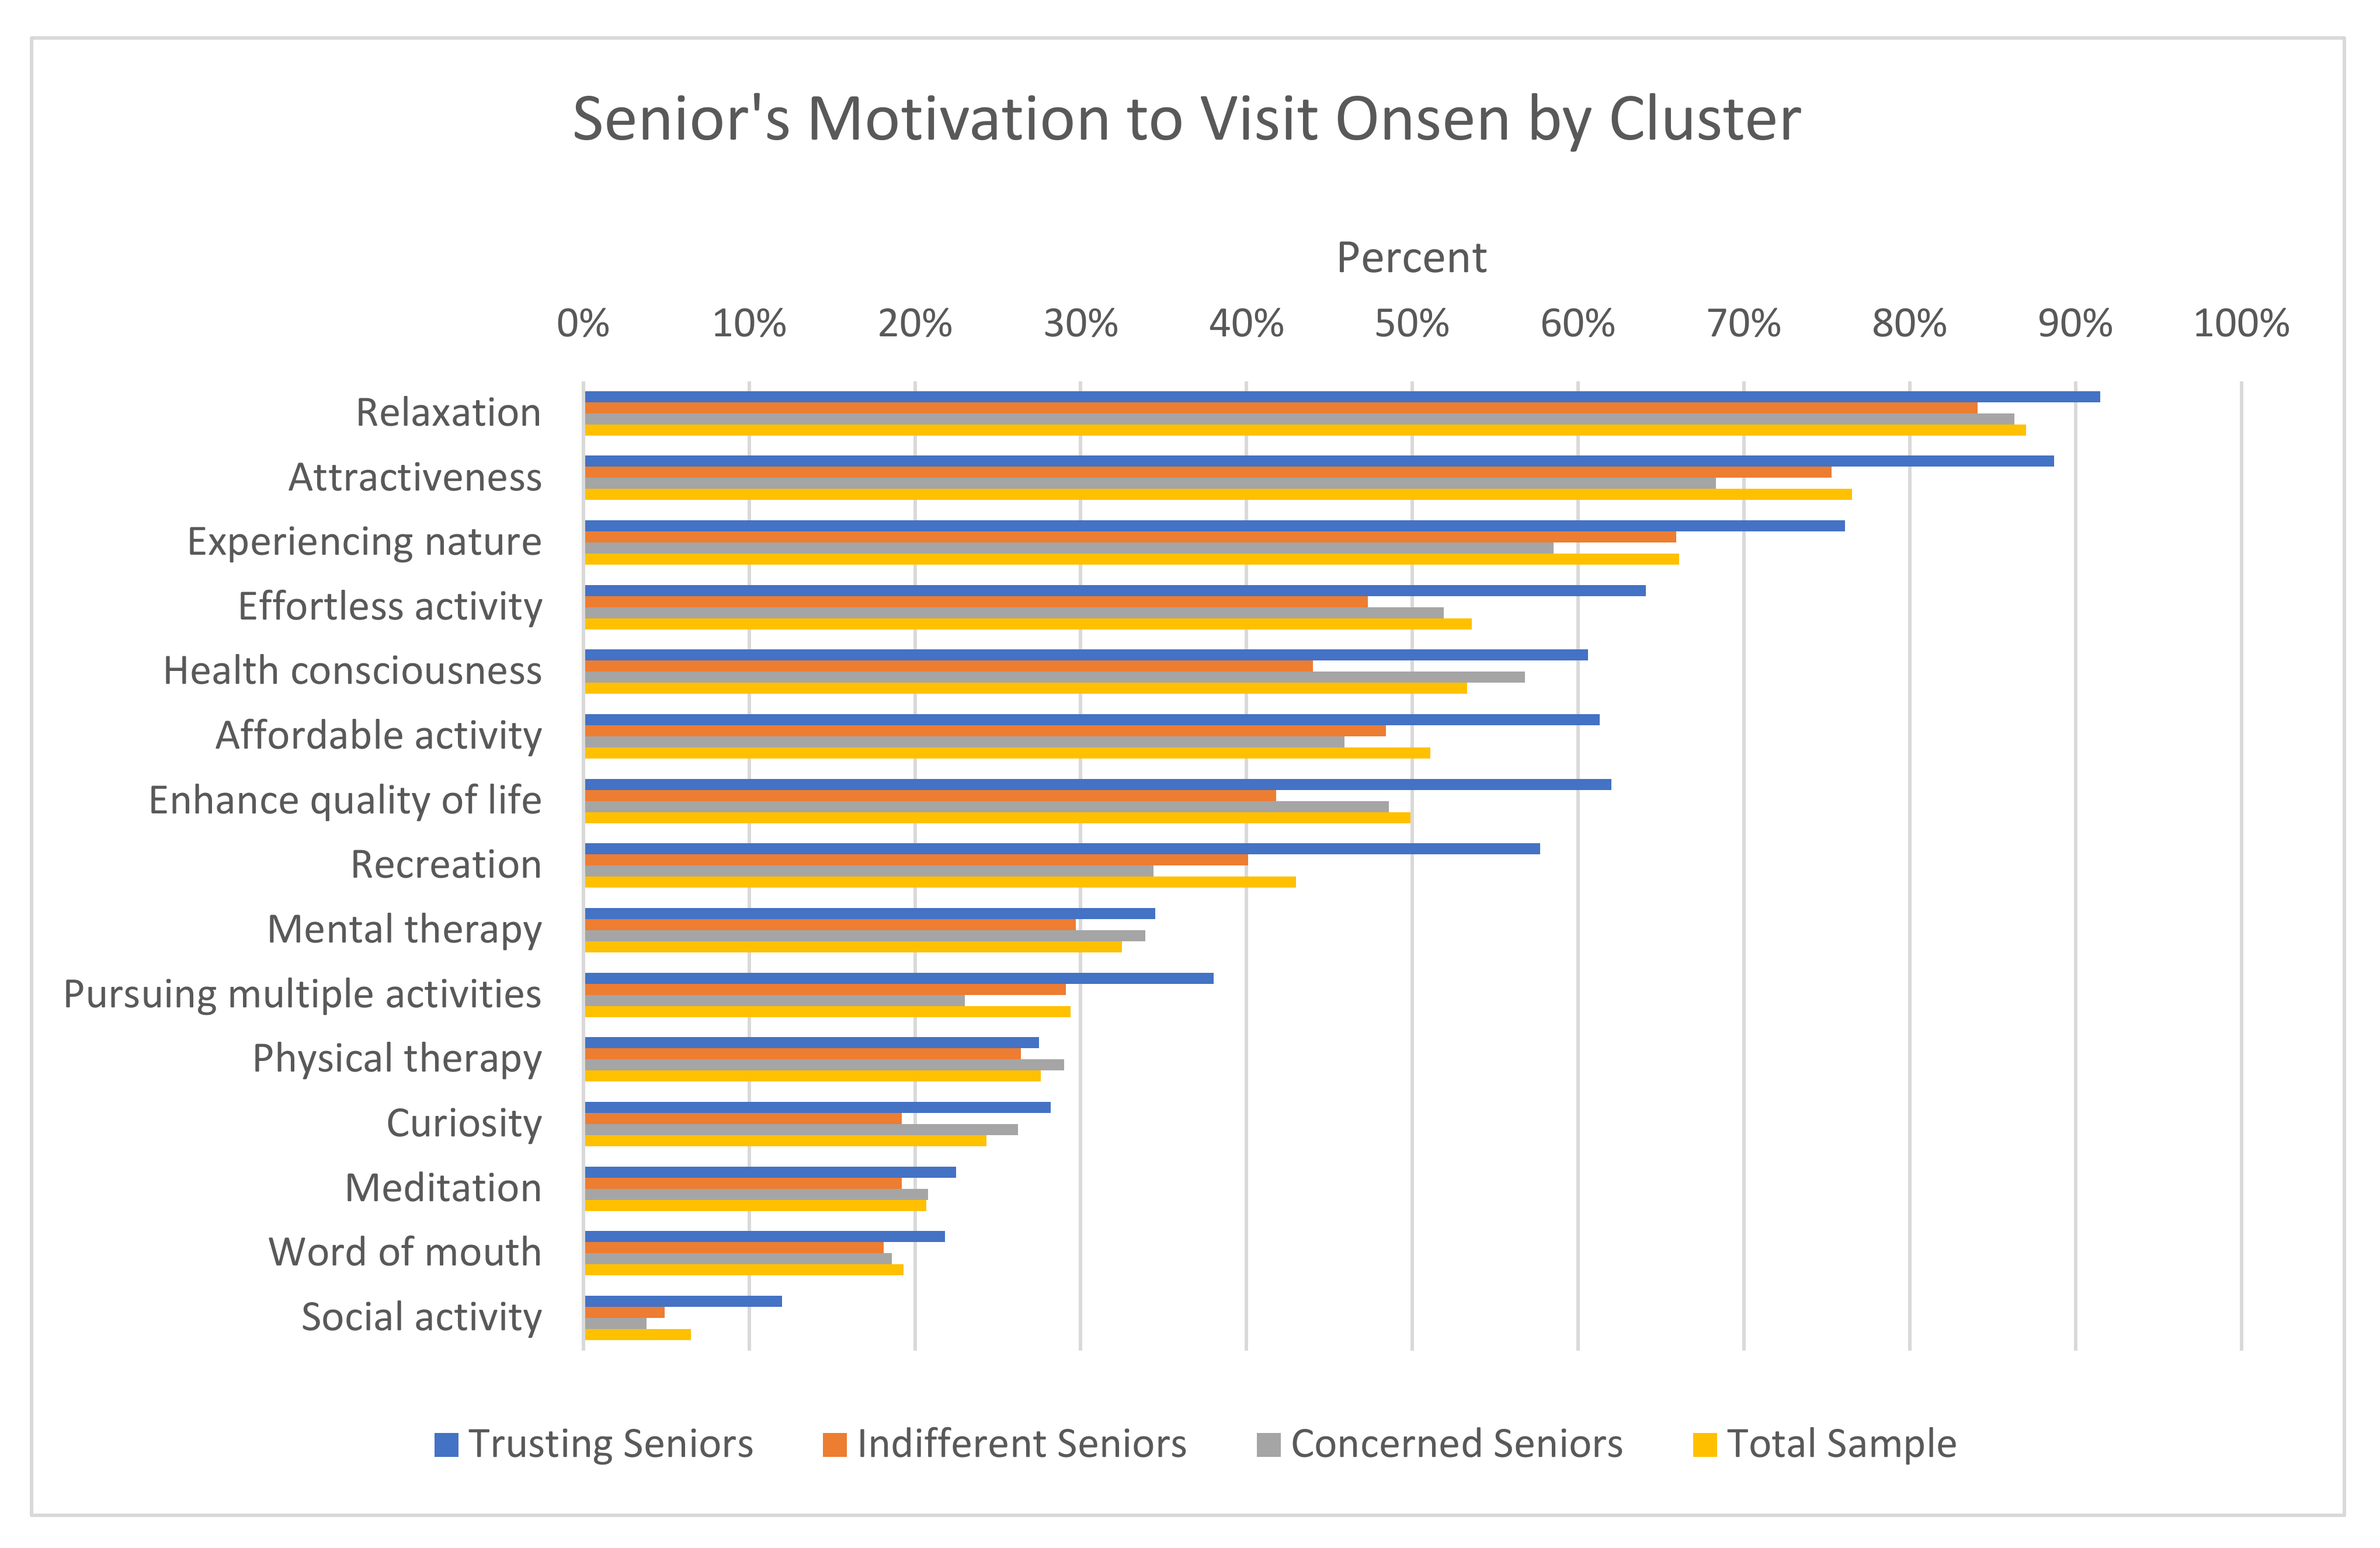
4.4. Motivation to Visit Onsen

As displayed in Figure 2, the primary motivation for visiting was “Relaxation”, followed by “Attractiveness” and “Experiencing nature.” All motivator items were significantly different between clusters with p < 0.05, except the item “business engagement”, which was excluded from the figure.
In general, the “Trusting Seniors” agreed with all motivator items more than respondents in the other two clusters, as well as the sample average. They indicated a stronger intrinsic motivation and passion for onsen, and many perceived benefits such as attractiveness, experiencing nature, effortlessness and affordability, enhanced quality of life, and recreational aspects than respondents in other segments.

4.5. Cluster Profiles

Using the results presented in Figure 1 and Table 4, the cluster profiles can be described as follows: Cluster 1 is titled “Trusting Seniors” and contains the smallest number of respondents in this sample, 142. It is characterized by a strong positive association with factors 1, 3, and 4. Respondents seem to have very high confidence that onsen facilities can enforce sufficient and effective (factor 1) measures against infection. Second, there was a high affinity for factor 3, which represents the ability to protect oneself from becoming infected. Finally, it is characterized by another strong association, factor 4, which represents not believing the scene to be crowded, that people will bump into each other and, in general, feel comfortable when looking at the picture. This cluster has an almost equal number of men and women, with only 8.5% of the respondents being unmarried. The majority of respondents had children but no longer lived in the same household. The mean of worry in this cluster is 4.2, which represents only a slight worry about visiting, which contains the highest number of people (45.1%) with visit intention if there were discounts through a governmental travel campaign or an attractive package price (42.3%), and a significantly reduced intention if there were no incentives (35.9%).
Cluster 2 is titled “Indifferent Seniors” and contains almost the same number of respondents as Cluster 3 (182). It is characterized by a negative association with all factors except factor 4, with the strongest negative association with factors 1, 2, and 5. The respondents in this cluster did not worry about the risk of COVID-19 infection and did not seem to see the virus as a threat when visiting an onsen. However, they see difficulties in onsen establishments having the skills and equipment to prevent the infection and have slight doubts about their ability to protect themselves. The only positive association is factor 4, which implies that there is no concern for the crowdedness depicted in the onsen photograph in the questionnaire. Respondents of both sexes were almost equally represented, and most of them were married (85.7%). Similar to Cluster 1, the majority had children, but more of them still lived in the same household, compared with those in Cluster 1. Surprisingly, the mean of worry is similar to Cluster 1 (4.13), but both an attractive package price and government campaign would not significantly increase their visit intention.
Finally, Cluster 3 comprises “Concerned Seniors”, and respondents in this group showed an equally positive association with factors 2 and 5, which contained items related to perceived COVID-19 infectability and their belief that it will pose a health threat to onsen visitors. However, after consulting the factor means in this cluster, it can be said that this concern is not a strong fear and does not deter individuals from visiting onsen establishments. In contrast to the other two clusters, they voiced their worry about facing crowds. From a sociodemographic point of view, this cluster is as large as Cluster 2, with 183 respondents. It consisted of a higher number of women and the highest number of singles among all clusters. Unsurprisingly, this cluster contained the highest mean of worry (5.48) and a visit intention far below that of the other two clusters, regardless of whether an external incentive was offered.

5. Discussion and Conclusions

This study contributes to the tourism literature on senior travelers by clustering respondents into smaller subgroups with similarities in psychographics, worry, motivation to visit, visit intention to an onsen, and demographics. It further gives suggestions to onsen managers, travel agents, and policymakers on how to approach each segment that emerged in this study’s analysis. Seniors represent one of the largest demographics in Japan, and they have higher incomes than lower-aged groups. There is, according to their response in the survey in this study, a sizable number who are willing to visit onsen facilities despite the pandemic. They have, therefore, the potential to turn the tables of the future of onsen establishments from bleak to hopeful.
However, it is strongly recommended to not treat Japanese seniors as a homogenous group but to segment them into smaller groups as outlined by Otoo et al. [61], who cite the heterogeneity of this demographic. A segmentation analysis, therefore, represents an option to better understand their characteristics and predict their behavior. This study follows Lee’s [64] training in using psychological factors over geographic and demographic characteristics [62,63] as a segmentation variable. However, it is unique, as it did not use the popular variable “travel motivation” but the perception and attitude toward disease as a segmentation variable, with several elements representing travel constraints such as perceived threat, perceived severity, or crowding perception. The analysis resulted in three clusters that were labeled “Trusting Seniors”, “Indifferent Seniors”, and “Concerned Seniors”, with the first segment having a slightly lower number and the latter two with almost the same number of respondents.
Similar to previous studies on tourist worry and risk perception [18,19], this study confirms that worry has a significant impact on visit intention, as respondents in cluster 3, “Concerned Seniors”, are characterized by increased worry and significant low visit intention to onsen resorts; only around 15% of respondents indicated planning to visit within the next 12 months, regardless of whether they are being offered an attractive package price or receive discounts by the governmental travel campaign. These findings are further in line with those revealed from research on the impact of a disease such COVID-19 on decreased travel intention, as reported by Luo and Lam [28] on “travel bubbles”, Lamb et al. [27] on willingness to travel by air, and Jahari et al. [29] on safety perceptions of a destination and its impact on its destination image.
Wang et al. [35] drew attention to the fact that worry varies with conditions. In contrast to regular travel, the environment and habits in onsen establishments do not permit wearing masks and adequate social distancing. This most likely increased the perception of higher health risks and increased worry, compared with normal travel destinations. Despite these possible health concerns, about half of all respondents displayed the intention to visit or had a neutral attitude toward visiting, which indicates a similar attitude as those of respondents in Lee and Chen’s [73] study on the low impact of a perceived health risk, the bird flu, and the Severe Acute Respiratory Syndrome on visit intention. The low intention to visit among “Indifferent Seniors” is not related to health risks but to other intrapersonal and interpersonal constraints or structural travel constraints, as listed by Chen et al. [70], or an overall higher perceived financial risk due to the pandemic and worries about the future, similar to Le Serre et al. [74].
In line with earlier studies on discounts [80,81,82], the findings of the present study show that an attractive travel package price and discounts of the Go-To Travel campaign can entice a certain segment of Japanese seniors (“Trusting Seniors”) to increase their visit intention. The high visit intention of this segment, in general, might also be attributed to the high affinity to factor 3 (Self-Efficacy), which is in accordance with Lu’s [96] findings that a higher perceived self-efficacy reduces risk perception among seniors and consequently increases visit intention. As for sex differences, there was a slightly higher number of women in Cluster 3, the segment of “Concerned Seniors.” The sex differences such as increased worry among women and different behavior patterns were, however, not significantly reported in the past [39,40,41,42,43,44].
Analyzing the motivator items, all three clusters showed a similar distribution, but “Trusting Seniors” had a higher average mean in all motivational categories and consisted of respondents being more passionate toward onsen resorts. Notably, “Concerned Seniors” show higher agreement over respondents in the “Indifferent Seniors” with respect to health-related motivator items, such as health consciousness, enhanced quality of life, and mental and physical therapy, suggesting that this segment is very health-conscious in general. Upon comparing the motivational finding of this study with two previous surveys conducted in magazines and newspapers before the pandemic [97,98], two aspects can be considered. First, social activity ranked at the very bottom among the motivations observed in this study, in contrast to Kamata and Misui’s [97] findings that mention group activities, going on a date, and spending time with friends as important motivation items for visiting onsen establishments. This suggests that there has been a significant change in individuals’ behavior and that they no longer plan to visit hot springs with others. Second, “recreation” has lost significance, which might suggest that the pandemic has shifted recreational activities into other modes, such as outdoors, as proposed by Craig [99].
Regarding designing products and services, campaigns, and strategies for recovery, several suggestions are being made, including particular distinctions to pre-pandemic marketing customs. The most promising segment of “Trusting Seniors” can be enticed to travel using attractive package deals, as they indicated that they are more likely to do so if external incentives are offered. The respondents in this cluster are expected to visit repeatedly because of the higher ratings in all motivation categories, compared with the members of other clusters. Before the pandemic, it was quite common for travel agencies to advertise discounts, but after the analysis in this study, quantity discounts for enticing repeat visits should be introduced. Repeat visits to onsen facilities have so far not been encouraged; however, given that a large number of potential visitors have disappeared for these businesses, a focus on a segment of willing travelers is vital. Even small discounts can make a difference if senior travelers are more price-sensitive, as reported by Mary et al. [60], and experiments with different coupons can be applied. It should also be considered that any package or campaign-wise discounts should be offered through travel agents, which is the most popular mode of booking for seniors according to Javalgi [58].
The two other clusters—“Concerned Seniors” and “Indifferent Seniors”—will pose challenges to the involved parties. To increase visitation, onsen establishments can implement all precautionary measures to ensure the safety of their visitors or provide and suggest health services at their destinations in case the visitors are infected, to appease both segments. Both aspects have never been included in any promotional materials before the pandemic; however, given the size of both segments combined, any possibilities to lower concerns should be considered. One very popular feature in advertisements of onsen resorts is the use of photographs depicting the food provided by these establishments, and in many cases, pictures of their dinner buffet. As lavish dinner buffet pictures might have motivated visits before the pandemic, careful consideration is now necessary on what to include in advertisements. Not only that, onsen establishments should consider changing the custom of providing food via buffet or open kitchen to an individual dinner set menu if possible, or at least, offer both simultaneously when trying to attract “Concerned Seniors.” Onsen facilities that already provided dinner as a set menu (which are usually delivered to the individual hotel rooms) find themselves at a considerable advantage and can emphasize this in their promotional material.
In addition, pre-pandemic advertisements have not specifically highlighted whether hotel rooms offer private onsen pools or tubs, which should now be changed to being promoted as the main feature of a specific establishment. Additionally, onsen establishments and onsen towns, which attract fewer visitors due to their remote location, can now use this point and advertise it to reach “Concerned Seniors” as their target audience, as fewer numbers of people have the potential to lower concerns within this segment. Onsen managers can also consider limiting the number of visitors per hour or per day, another strategy that has been not considered before the pandemic. To control the flow of people offering discounts for off-peak hours in a day or week can be introduced. The final suggestion for all three segments is that promotional material should reflect the changing trend in motivations for visiting onsen resorts and no longer depict scenes of group activities, or at least reduce its prominence in the material, and change to centering on the onsen facilities or natural environment.
The main limitation of this study is that it was conducted when vaccinations were not yet available. The responses might have differed if this study was conducted again in the present or after a certain interval of time. The market segmentation approach does not address directionality or causality among variables, which can be addressed using different statistical methods in the future. Furthermore, this study focuses only on domestic visitors, and future studies can examine the intention of international tourists to visit onsen establishments once the restrictions are lifted. The results might differ significantly for tourists whose chances of visiting Japan’s hot springs are limited to the short duration of their trip. Finally, this study did not differentiate between onsen destinations in rural or urban Japan or offer choices between visiting onsen resorts in peak hours or peak seasons versus off-hours and off-seasons, which might be interesting to explore in future research.

Funding

This research was funded by Doshisha University All Doshisha Research Model “Urgent Research Related to COVID-19” and the Kaken Research Fund #20K12441.

Institutional Review Board Statement

Ethical review and approval were waived for this study due to the fact that data were gained from another agency (Cross Marketing Inc., https://www.cross-m.co.jp/en/, accessed on 26 February 2021).

Informed Consent Statement

Informed consent was obtained by a market research company from all subjects involved in the study.

Data Availability Statement

Restrictions apply to the availability of these data. Data were obtained from a market research company through Doshisha University funding and are available from the author with the permission of the Department of Research Planning, Organization for Research Initiatives and Development at Doshisha University.

Acknowledgments

The author would like to thank Junichi Kawaminami for his language support and advice on Japanese culture.

Conflicts of Interest

The author declares no conflict of interest.

References

  1. Statistics Bureau of Japan. Result of Population Estimates—Monthly Report. Available online: https://www.stat.go.jp/english/data/jinsui/tsuki/index.html (accessed on 24 June 2021).
  2. National Statistics Center. Statistics of Japan: National Survey of Family Income, Consumption and Wealth. Available online: https://www.e-stat.go.jp/en/stat-search?page=1&query=familyincome&layout=dataset&metadata=1&data=1 (accessed on 24 June 2021).
  3. Ministry of Land Infrastructure Transport and Tourism—Hokkaido District Transport Bureau. Welcome to ONSEN!!—A Guide for Enjoying Japanese Hot Spring. Available online: http://www.yunphoto.net (accessed on 5 July 2021).
  4. Global Wellness Institute. Global Wellness Tourism Economy. Available online: https://globalwellnessinstitute.org/wp-content/uploads/2018/11/GWI_GlobalWellnessTourismEconomyReport.pdf (accessed on 5 July 2021).
  5. Kyodo News. Visitors to Japan Fall 98.3% in January, Down for 16th Month in Row. Available online: https://english.kyodonews.net/news/2021/02/e39a7e3dc558-visitors-to-japan-fall-983-in-jan-down-for-16th-month-in-row.html (accessed on 29 June 2021).
  6. Su, X. Japanese Hot Spring Tourism at a Crossroads—Asia Times. Available online: https://asiatimes.com/2020/07/japanese-hot-spring-tourism-at-a-crossroads/ (accessed on 5 July 2021).
  7. Organization for Economic Co-Operation and Development. OECD Tourism Trends and Policies 2020—Japan. Available online: https://www.oecd-ilibrary.org/urban-rural-and-regional-development/oecd-tourism-trends-and-policies-2020_6b47b985-en (accessed on 5 July 2021).
  8. Tarver, E. Market Segmentation Definition. Available online: https://www.investopedia.com/terms/m/marketsegmentation.asp (accessed on 5 July 2021).
  9. The Mainichi. Japan’s State of Emergency Is No Lockdown. What’s in It? Available online: https://mainichi.jp/english/articles/20200408/p2g/00m/0na/069000c (accessed on 11 March 2021).
  10. Abdullah, M.; Dias, C.; Muley, D.; Shahin, M. Exploring the Impacts of COVID-19 on Travel Behavior and Mode Preferences. Transp. Res. Interdiscip. Perspect. 2020, 8, 100255. [Google Scholar] [CrossRef]
  11. Kim, C.; Cheon, S.H.; Choi, K.; Joh, C.H.; Lee, H.J. Exposure to Fear: Changes in Travel Behavior during MERS Outbreak in Seoul. KSCE J. Civ. Eng. 2017, 21, 2888–2895. [Google Scholar] [CrossRef]
  12. Fennell, D.A. Towards a Model of Travel Fear. Ann. Tour. Res. 2017, 66, 140–150. [Google Scholar] [CrossRef]
  13. Ritchie, B.W.; Chien, P.M.; Sharifpour, M. Segmentation by Travel Related Risks: An Integrated Approach. J. Travel Tour. Mark. 2017, 34, 274–289. [Google Scholar] [CrossRef]
  14. Lo, A.S.; Law, R.; Cheung, C. Segmenting Leisure Travelers by Risk Reduction Strategies. J. Travel Tour. Mark. 2011, 28, 828–839. [Google Scholar] [CrossRef]
  15. Taylor, J.W. The Role of Risk in Consumer Behavior. J. Mark. 1974, 38, 54–60. [Google Scholar] [CrossRef]
  16. Sönmez, S.F.; Graefe, A.R. Influence of Terrorism Risk on Foreign Tourism Decisions. Ann. Tour. Res. 1998, 25, 112–144. [Google Scholar] [CrossRef] [Green Version]
  17. Goodrich, J.N. September 11, 2001 Attack on America: A Record of the Immediate Impacts and Reactions in the USA Travel and Tourism Industry. Tour. Manag. 2002, 23, 573–580. [Google Scholar] [CrossRef]
  18. Floyd, M.F.; Gibson, H.; Pennington-Gray, L.; Thapa, B. The Effect of Risk Perceptions on Intentions to Travel in the Aftermath of September 11, 2001. J. Travel Tour. Mark. 2004, 15, 19–38. [Google Scholar] [CrossRef]
  19. Reisinger, Y.; Mavondo, F. Travel Anxiety and Intentions to Travel Internationally: Implications of Travel Risk Perception. J. Travel Res. 2005, 43, 212–225. [Google Scholar] [CrossRef]
  20. Wong, J.Y.; Yeh, C. Tourist Hesitation in Destination Decision Making. Ann. Tour. Res. 2009, 36, 6–23. [Google Scholar] [CrossRef]
  21. Reichel, A.; Fuchs, G.; Uriely, N. Perceived Risk and the Non-Institutionalized Tourist Role: The Case of Israeli Student Ex-Backpackers. J. Travel Res. 2007, 46, 217–226. [Google Scholar] [CrossRef]
  22. Lo, A.S.; Cheung, C.; Law, R. Hong Kong Residents’ Adoption of Risk Reduction Strategies in Leisure Travel. J. Travel Tour. Mark. 2011, 28, 240–260. [Google Scholar] [CrossRef]
  23. Lepp, A.; Gibson, H. Tourist Roles, Perceived Risk and International Tourism. Ann. Tour. Res. 2003, 30, 606–624. [Google Scholar] [CrossRef]
  24. Williams, A.M.; Baláž, V. Tourism, Risk Tolerance and Competences: Travel Organization and Tourism Hazards. Tour. Manag. 2013, 35, 209–221. [Google Scholar] [CrossRef] [Green Version]
  25. Bianchi, R. Tourism and the Globalisation of Fear: Analysing the Politics of Risk and (in)Security in Global Travel. Tour. Hosp. Res. 2006, 7, 64–74. [Google Scholar] [CrossRef]
  26. Wang, H.Y. Determinants Hindering the Intention of Tourists to Visit Disaster-Hit Destinations. Curr. Issues Tour. 2017, 20, 459–479. [Google Scholar] [CrossRef]
  27. Lamb, T.L.; Winter, S.R.; Rice, S.; Ruskin, K.J.; Vaughn, A. Factors That Predict Passengers Willingness to Fly during and after the COVID-19 Pandemic. J. Air Transp. Manag. 2020, 89, 101897. [Google Scholar] [CrossRef]
  28. Luo, J.M.; Lam, C.F. Travel Anxiety, Risk Attitude and Travel Intentions towards “Travel Bubble” Destinations in Hong Kong: Effect of the Fear of COVID-19. Int. J. Environ. Res. Public Health 2020, 17, 7859. [Google Scholar] [CrossRef]
  29. Neuburger, L.; Egger, R. Travel Risk Perception and Travel Behaviour during the COVID-19 Pandemic 2020: A Case Study of the DACH Region. Curr. Issues Tour. 2021, 24, 1003–1016. [Google Scholar] [CrossRef]
  30. Jahari, S.A.; Yang, I.C.M.; French, J.A.; Ahmed, P.K. COVID-19 and Beyond: Understanding Travel Risk Perception as a Process. Tour. Recreat. Res. 2021. [Google Scholar] [CrossRef]
  31. Kummeneje, A.M.; Rundmo, T. Risk Perception, Worry, and Pedestrian Behaviour in the Norwegian Population. Accid. Anal. Prev. 2019, 133, 105294. [Google Scholar] [CrossRef] [PubMed]
  32. Wilson, E.; Little, D.E. The Solo Female Travel Experience: Exploring the “Geography of Women’s Fear”. Curr. Issues Tour. 2008, 11, 167–186. [Google Scholar] [CrossRef]
  33. Larsen, S.; Brun, W.; Øgaard, T. What Tourists Worry about—Construction of a Scale Measuring Tourist Worries. Tour. Manag. 2009, 30, 260–265. [Google Scholar] [CrossRef]
  34. Chien, P.M.; Sharifpour, M.; Ritchie, B.W.; Watson, B. Travelers’ Health Risk Perceptions and Protective Behavior: A Psychological Approach. J. Travel Res. 2017, 56, 744–759. [Google Scholar] [CrossRef]
  35. Wang, J.; Liu-Lastres, B.; Ritchie, B.W.; Pan, D.Z. Risk Reduction and Adventure Tourism Safety: An Extension of the Risk Perception Attitude Framework (RPAF). Tour. Manag. 2019, 74, 247–257. [Google Scholar] [CrossRef]
  36. Basevitz, P.; Pushkar, D.; Chaikelson, J.; Conway, M.; Dalton, C. Age-Related Differences in Worry and Related Processes. Int. J. Aging Hum. Dev. 2008, 66, 283–305. [Google Scholar] [CrossRef]
  37. Wilson, J.M.; Lee, J.; Shook, N.J. COVID-19 Worries and Mental Health: The Moderating Effect of Age. Aging Ment. Health 2021, 25, 1289–1296. [Google Scholar] [CrossRef]
  38. Meng, B.; Han, H. Investigating Individuals’ Decision Formation in Working-Holiday Tourism: The Role of Sensation-Seeking and Gender. J. Travel Tour. Mark. 2018, 35, 973–987. [Google Scholar] [CrossRef]
  39. Jönsson, C.; Devonish, D. Does Nationality, Gender, and Age Affect Travel Motivation? A Case of Visitors to the Caribbean Island of Barbados. J. Travel Tour. Mark. 2008, 25, 398–408. [Google Scholar] [CrossRef]
  40. Dedeoğlu, B.B.; Balıkçıoğlu, S.; Küçükergin, K.G. The Role of Tourists’ Value Perceptions in Behavioral Intentions: The Moderating Effect of Gender. J. Travel Tour. Mark. 2016, 33, 513–534. [Google Scholar] [CrossRef]
  41. Sweeny, K.; Kwan, V.; Falkenstein, A. The Role of Gender in Worry and Efforts to Cope during Stressful Waiting Periods. Sex Roles 2019, 81, 765–778. [Google Scholar] [CrossRef] [Green Version]
  42. Bottesi, G.; Martignon, A.; Cerea, S.; Ghisi, M. Worry and Associated Cognitive Features in Italian University Students: Does Gender Make a Difference? Pers. Individ. Dif. 2018, 126, 38–43. [Google Scholar] [CrossRef]
  43. Robichaud, M.; Dugas, M.J.; Conway, M. Gender Differences in Worry and Associated Cognitive-Behavioral Variables. J. Anxiety Disord. 2003, 17, 501–516. [Google Scholar] [CrossRef]
  44. Kim, H.; Woo, E.; Uysal, M. Tourism Experience and Quality of Life among Elderly Tourists. Tour. Manag. 2015, 46, 465–476. [Google Scholar] [CrossRef]
  45. Fangxuan, L.; Ryan, C. Souvenir Shopping Experiences: A Case Study of Chinese Tourists in North Korea. Tour. Manag. 2018, 64, 142–153. [Google Scholar] [CrossRef]
  46. Mok, C.; Lam, T. Travel-Related Behavior of Japanese Leisure Tourists: A Review and Discussion. J. Travel Tour. Mark. 2008, 9, 171–184. [Google Scholar] [CrossRef]
  47. Moal-Ulvoas, G. Positive Emotions and Spirituality in Older Travelers. Ann. Tour. Res. 2017, 66, 151–158. [Google Scholar] [CrossRef]
  48. Borges Tiago, M.T.P.M.; Couto, J.P.d.A.; Tiago, F.G.B.; Dias Faria, S.M.C. Baby Boomers Turning Grey: European Profiles. Tour. Manag. 2016, 54, 13–22. [Google Scholar] [CrossRef]
  49. Faranda, W.T.; Schmidt, S.L. Segmentation and the Senior Traveler: Implications for Today’s and Tomorrow’s Aging Consumer. J. Travel Tour. Mark. 2000, 8, 3–27. [Google Scholar] [CrossRef]
  50. You, X.; O’Leary, J.T. Age and Cohort Effects: An Examination of Older Japanese Travelers. J. Travel Tour. Mark. 2000, 9, 21–42. [Google Scholar] [CrossRef]
  51. Huber, D.; Milne, S.; Hyde, K.F. Constraints and Facilitators for Senior Tourism. Tour. Manag. Perspect. 2018, 27, 55–67. [Google Scholar] [CrossRef]
  52. Huang, L.; Tsai, H.T. The Study of Senior Traveler Behavior in Taiwan. Tour. Manag. 2003, 24, 561–574. [Google Scholar] [CrossRef]
  53. Nimrod, G. Retirement and Tourism Themes in Retirees’ Narratives. Ann. Tour. Res. 2008, 35, 859–878. [Google Scholar] [CrossRef]
  54. Esiyok, B.; Kurtulmuşoğlu, F.B.; Özdemir, A. Heterogeneity in the Determinants of Length of Stay across Middle Age and Senior Age Groups in Thermal Tourism. J. Travel Tour. Mark. 2018, 35, 531–540. [Google Scholar] [CrossRef]
  55. Huber, D. A Life Course Perspective to Understanding Senior Tourism Patterns and Preferences. Int. J. Tour. Res. 2019, 21, 372–387. [Google Scholar] [CrossRef]
  56. Boksberger, P.E.; Laesser, C. Segmentation of the Senior Travel Market by the Means of Travel Motivations. J. Vacat. Mark. 2009, 15, 311–322. [Google Scholar] [CrossRef]
  57. Batra, A. Senior Pleasure Tourists: Examination of Their Demography, Travel Experience, and Travel Behavior upon Visiting the Bangkok Metropolis. Int. J. Hosp. Tour. Adm. 2009, 10, 197–212. [Google Scholar] [CrossRef]
  58. Javalgi, R.G.; Thomos, E.G.; Rao, S.R. Consumer Behavior in the U.S. Pleasure travel marketplace: An analysis of senior and nonsenior travelers. In Consumer Behavior in Travel and Tourism; Pizam, A., Mansfeld, Y., Eds.; Taylor & Francis: New York, NY, USA, 1999; pp. 433–450. [Google Scholar] [CrossRef]
  59. Reece, W.S. Are Senior Leisure Travelers Different? J. Travel Res. 2004, 43, 11–18. [Google Scholar] [CrossRef]
  60. Mary, E.U.; Kong, T.I.W.; Wan, Y.K.P. Senior Travelers to Integrated Resorts: Preferences, Consuming Behaviors and Barriers. J. Qual. Assur. Hosp. Tour. 2019, 21, 297–319. [Google Scholar] [CrossRef]
  61. Otoo, F.E.; Kim, S.; Choi, Y. Understanding Senior Tourists’ Preferences and Characteristics Based on Their Oversea Travel Motivation Clusters. J. Travel Tour. Mark. 2020, 37, 246–257. [Google Scholar] [CrossRef]
  62. Anderson, B.B.; Langmeyer, L. The Under-50 and Over-50 Travelers: A Profile of Similarities and Differences. J. Travel Res. 1982, 20, 20–24. [Google Scholar] [CrossRef]
  63. Hsu, C.H.C.; Lee, E.J. Segmentation of Senior Motorcoach Travelers. J. Travel Res. 2002, 40, 364–373. [Google Scholar] [CrossRef]
  64. Lee, C.F. An Investigation of Factors Determining Destination Satisfaction and Travel Frequency of Senior Travelers. J. Qual. Assur. Hosp. Tour. 2016, 17, 471–495. [Google Scholar] [CrossRef]
  65. Sellick, M.C. Discovery, Connection, Nostalgia: Key Travel Motives within the Senior Market. J. Travel Tour. Mark. 2004, 17, 55–71. [Google Scholar] [CrossRef]
  66. Otoo, F.E.; Kim, S.; Park, J. Motivation-Based Segmentation of Chinese Senior Travelers: The Role of Preferences, Sociodemographic, and Travel-Related Features. J. Vacat. Mark. 2020, 26, 457–472. [Google Scholar] [CrossRef]
  67. Otoo, F.E.; Kim, S. Analysis of Studies on the Travel Motivations of Senior Tourists from 1980 to 2017: Progress and Future Directions. Curr. Issues Tour. 2020, 23, 393–417. [Google Scholar] [CrossRef]
  68. Cleaver, M.; Muller, T.E.; Ruys, H.F.M.; Wei, S. Tourism Product Development for the Senior Market, Based on Travel-Motive Research. Tour. Recreat. Res. 1999, 24, 5–11. [Google Scholar] [CrossRef]
  69. Carneiro, M.J.; Eusébio, C.; Kastenholz, E.; Alvelos, H. Motivations to Participate in Social Tourism Programmes: A Segmentation Analysis of the Senior Market. Anatolia 2013, 24, 352–366. [Google Scholar] [CrossRef]
  70. Chen, F.; Dai, S.; Xu, H.; Abliz, A. Senior’s Travel Constraint, Negotiation Strategy and Travel Intention: Examining the Role of Social Support. Int. J. Tour. Res. 2021, 23, 363–377. [Google Scholar] [CrossRef]
  71. Fleischer, A.; Pizam, A. Tourism Constraints among Israeli Seniors. Ann. Tour. Res. 2002, 29, 106–123. [Google Scholar] [CrossRef]
  72. Lee, S.H.; Tideswell, C. Understanding Attitudes towards Leisure Travel and the Constraints Faced by Senior Koreans. J. Vacat. Mark. 2005, 11, 249–263. [Google Scholar] [CrossRef] [Green Version]
  73. Lee, C.C.; Chen, C.J. The Reaction of Elderly Asian Tourists to Avian Influenza and SARS. Tour. Manag. 2011, 32, 1421–1422. [Google Scholar] [CrossRef]
  74. Le Serre, D.; Legohérel, P.; Weber, K. Seniors’ Motivations and Perceived Risks: A Cross-Cultural Study. J. Int. Consum. Mark. 2013, 25, 61–79. [Google Scholar] [CrossRef]
  75. Chen, J.S.; Prebensen, N.; Huan, T.C. Determining the Motivation of Wellness Travelers. Anatolia 2008, 19, 103–115. [Google Scholar] [CrossRef]
  76. Zheng, D.; Luo, Q.; Ritchie, B.W. Afraid to Travel after COVID-19? Self-Protection, Coping and Resilience against Pandemic “Travel Fear”. Tour. Manag. 2021, 83, 104261. [Google Scholar] [CrossRef]
  77. Kock, F.; Nørfelt, A.; Josiassen, A.; Assaf, A.G.; Tsionas, M.G. Understanding the COVID-19 Tourist Psyche: The Evolutionary Tourism Paradigm. Ann. Tour. Res. 2020, 85, 103053. [Google Scholar] [CrossRef]
  78. Wang, J.; Liu-Lastres, B.; Ritchie, B.W.; Mills, D.J. Travellers’ Self-Protections against Health Risks: An Application of the Full Protection Motivation Theory. Ann. Tour. Res. 2019, 78, 102743. [Google Scholar] [CrossRef]
  79. Hsu, C.H.C.; Kang, S.K.; Lam, T. Reference Group Influences among Chinese Travelers. J. Travel Res. 2006, 44, 474–484. [Google Scholar] [CrossRef]
  80. Lam, L.Y.J.; Gao, Y. Hong Kong Millennials’ Intention to Visit Local Hotel Spas. J. China Tour. Res. 2020, 16, 510–526. [Google Scholar] [CrossRef]
  81. Wong, J.; Law, R. Analysing the Intention to Purchase on Hotel Websites: A Study of Travellers to Hong Kong. Int. J. Hosp. Manag. 2005, 24, 311–329. [Google Scholar] [CrossRef]
  82. Qiu, R.T.R.; Fan, D.X.; Liu, A. Exploring the booking determinants of the airbnb properties: An example of the listings of London. In Proceedings of the Information and Communication Technologies in Tourism, Jönköping, Sweden, 24–26 January 2018; Stangl, B., Pesonen, J., Eds.; Springer International Publishing: Cham, Switzerland, 2018; pp. 44–51. [Google Scholar]
  83. Live Japan. 6 Crazy Facts About Tokyo’s Population (2021)—Inside the World’s Top Megacity | LIVE JAPAN Travel Guide. 2021. Available online: https://livejapan.com/en/in-tokyo/in-pref-tokyo/in-tokyo_suburbs/article-a0002533/ (accessed on 20 July 2021).
  84. National Statistics Center. Portal Site of Official Statistics of Japan: Number of In-Migrants by Sex and Origin. Available online: https://www.e-stat.go.jp/en/stat-search/files?page=1&query=migrationtokyo&layout=dataset&bunya_l=02&metadata=1&data=1 (accessed on 20 July 2021).
  85. O’Neill, A. Japan: Degree of Urbanization from 2009 to 2019. Available online: https://www.statista.com/statistics/270086/urbanization-in-japan/ (accessed on 28 June 2021).
  86. Middleton, V.; Clarke, J. Marketing in Travel and Tourism, 3rd ed.; Butterworth Heinemann: Oxford, UK, 2001; ISBN 978-07-5064-471-6. [Google Scholar]
  87. Yan, G.; So, S.I.; Morrison, A.M.; Sun, Y.H. Activity Segmentation of the International Heritage Tourism Market to Taiwan. Asia Pac. J. Tour. Res. 2007, 12, 333–347. [Google Scholar] [CrossRef]
  88. Ko, S.; Kang, S.; Kang, H.; Lee, M.J. An Exploration of Foreign Tourists’ Perceptions of Korean Food Tour: A Factor-Cluster Segmentation Approach. Asia Pac. J. Tour. Res. 2018, 23, 833–846. [Google Scholar] [CrossRef]
  89. Dolnicar, S. Understanding Barriers to Leisure Travel: Tourist Fears as a Marketing Basis. J. Vacat. Mark. 2005, 11, 197–208. [Google Scholar] [CrossRef] [Green Version]
  90. Peterson, R. A Meta-Analysis of Cronbach’s Coefficient Alpha. J. Consum. Res. 1994, 21, 381–391. [Google Scholar] [CrossRef]
  91. Bernstein, J.; Nunnally, I. Psychometric Theory, 3rd ed.; Mc-Graw Hill: New York, NY, USA, 1994. [Google Scholar]
  92. Field, A. Discovering Statistics Using IBM SPSS Statistics, 4th ed.; SAGE Publications: London, UK, 2013; ISBN 978-1-4462-4917-8. [Google Scholar]
  93. Zeller, R.A. Measurement Error, Issues and Solutions; Elsevier Inc.: Amsterdam, The Netherlands, 2004; ISBN 978-01-2369-398-3. [Google Scholar]
  94. Correia, A.; Dolnicar, S. Women’s Voices in Tourism Research Contributions to Knowledge and Letters to Future Generations; The University of Queensland: Brisbane, Australia, 2021; ISBN 978-1-74272-357-0. [Google Scholar]
  95. Hair, J.; Black, W.; Anderson, R.; Babin, B. Multivariate Data Analysis, 7th ed.; Prentice Hall: Upper Saddle River, NJ, USA, 2010. [Google Scholar]
  96. Lu, H.Y. An Investigation of Factors Influencing the Risk Perception and Revisit Willingness of Seniors. Asia Pac. Manag. Rev. 2021, 26, 160–170. [Google Scholar] [CrossRef]
  97. Kamata, H.; Misui, Y. The Difference of Japanese Spa Tourists Motivation in Weekends and Weekdays. Procedia Soc. Behav. Sci. 2015, 175, 210–218. [Google Scholar] [CrossRef] [Green Version]
  98. Nifty News. 温泉についてのアンケート・ランキング : 何でも調査団. Available online: https://chosa.nifty.com/travel/chosa_report_A20161223/index.html (accessed on 20 July 2021).
  99. Craig, C.A. Camping, Glamping, and Coronavirus in the United States. Ann. Tour. Res. 2020, 89, 103071. [Google Scholar] [CrossRef]
Figure 1. Cluster membership and factor association.
Sustainability 14 02306 g001
Figure 2. Senior’s motivation to visit onsen per cluster and total sample.
Sustainability 14 02306 g002
Table 1. Sociodemographic characteristics of the sample.
CharacteristicsFrequencyPercent
Sex
Men
Women

226
281

44.6
55.4
Age (in years)
55–59
60–64
65–69
70–74
>75

76
188
118
88
34

15.6
37.1
23.3
17.4
6.7
Marital status
Single
Married/divorced/widowed

75
432

14.8
85.2
Children
Children in household
Children but not in household
No children

133
193
181

26.2
38.1
35.7
Occupation
Company work (general employee)
Company work (managerial position)
Company management (manager/executive)
Civil servants, faculty and staff, nonprofit organization staff
Temporary staff/contract employees
Self-employed (commercial and industrial service)
Small office/Home office
Professionals (lawyers, tax accountants, medical related, etc.)
Part-time job
Full-time housewife/homemaker
Unemployed
Other occupations

34
25
22
15
30
38
10
10
47
133
127
16

6.7
4.9
4.3
3.0
5.9
7.5
2.0
2.0
9.3
26.2
25.0
3.2
Table 2. Results of factor analysis.
Mean Std. Dev.Factor LoadingsVariance ExplainedCronbach’s Alpha
F1: Response Efficacy 28.290.928
Measures that can be taken to stop onsen visitors being infected by COVID-19 are adequate.4.251.160.944
Protective measures to stop onsen visitors from being infected by COVID-19 are adequate.4.131.120.904
Available measures to protect myself from being infected by COVID-19 in onsen are effective.4.401.220.884
Efforts of onsen to keep safe from COVID-19 threats are effective.4.511.170.867
It is less likely to be exposed to the COVID-19 threat in onsen if performing the preventive measures.4.271.210.614
F2: Perceived COVID-19 Infectability 19.990.892
If I catch COVID-19, it may hit me harder than others.4.241.310.922
I think I am one of those who will have more severe symptoms if I get COVID-19.4.321.280.906
In general, I am more likely than the people around me to catch COVID-19.3.671.090.755
My past experiences make me believe I am likely to get sick if anyone around me is sick already.4.231.250.696
If an illness like COVID-19 is “going around”, I will get it.4.211.140.664
F3: Self-Efficacy 10.160.867
I have the necessary skills and equipment to protect myself from being infected by COVID-19.4.151.050.926
My skills and equipment to stop being infected by COVID-19 are adequate.3.911.010.867
I could learn to perform preventive measures to protect myself from being infected by COVID-19.4.511.020.711
Taking measures to prevent COVID-19 infection is easy for me.4.421.150.658
F4: Crowding Perception and Feeling 8.720.711
It is not crowded in this scene.5.650.910.787
I feel comfortable looking at this scene.4.741.250.710
People in this picture are not likely to bump into or brush each other.5.461.250.544
F5: Perceived Threat Severity 7.250.811
COVID-19 is a health threat to onsen visitors.4.241.340.910
COVID-19 poses infection consequences to onsen visitors.3.871.120.762
Extraction method: principal axis factoring; rotation method: Promax with Kaiser normalization.
Table 3. Clusters compared in terms of perception and attitude toward COVID-19: one-way ANOVA.
Trusting
Seniors
Indifferent SeniorsConcerned Seniors
MeanMeanMeanF-ValueSig. (a)Post Hoc (b)
F1: Response Efficacy5.3722.9573.062177.8280.0000.000
F2: Perceived COVID-19 Infectability4.2903.5004.65086.8510.0000.000
F3: Self-Efficacy4.9954.1553.755131.0100.0000.000
F4: Crowding Perception and Feeling5.8385.4304.709104.6020.0000.000
F5: Perceived Threat Severity3.9703.5554.61564.0590.0000.000
Note: (a) shows the corresponding statistic is significant at α = 0.001; (b) Bonferroni’s post hoc test indicates a significant mean difference between clusters; mean values are measured on a 7-point Likert-type scale (1 = strongly disagree, 7 = strongly agree).
Table 4. Summary of three-group discriminant analysis results.
Discriminant FunctionEigenvalue% of VarianceCumulative %Canonical CorrelationWilks LambdaChi-SquaredfSig.
11.30070.270.20.7520.280639.245100.000
20.55329.8100.00.5970.644221.04940.000
Table 5. Classification results.
SegmentPredicted Group MembershipTotal Number of Cases
123
Trusting seniors129 (90.8%)9 (6.3%)4 (2.8%)142
Indifferent seniors4 (2.2%)171 (94.0%)7 (3.8%)182
Concerned seniors2 (1.1%)4 (2.2%)177 (96.7%)183
Table 6. Chi-square test results with demographics and attitude.
Characteristics Trusting
Seniors
N = 142
Indifferent
Seniors
N = 182
Concerned
Seniors
N = 183
SexMale66 (46.5%)87 (47.8%)73 (39.9%)χ2 = 2.601, df = 2, p = 0.272
Female76 (53.5%)95 (52.2%)110 (60.1%)
Age 55–5914 (9.9%)34 (18.7%)31 (16.9%)χ2 = 13.018, df = 6, p < 0.05
60–6453 (37.3%)73 (40.1%)62 (33.9%)
65–6929 (20.4%)42 (23.1%)47 (25.7%)
>7046 (32.4%)33 (18.1%) 43 (23.5%)
Marital statusSingle12 (8.5%)26 (14.3%)37 (20.2%)χ2 = 8.843, df = 2, p < 0.05
married/divorced/
widowed
130 (91.5%)156 (85.7%)146 (79.8%)
ChildrenChildren in household30 (21.1%)50 (27.5%)53 (29.0%)χ2 = 7.700, df = 4, p = 0.103
Children but not in household64 (45.1%)72 (39.6%)57 (31.1%)
No children48 (33.8%)60 (33.0%)73 (39.9%)
Worry *Mean4.20 4.135.48χ2 = 58.81, df = 2, p < 0.01
Intention to visitYES: Without external incentive35.9%24.7%15.8%χ2 = 25.502, df = 4, p < 0.01
YES: With attractive package price 42.3%27.5%15.3%χ2 = 32.823, df = 4, p < 0.01
YES: With government campaign incentive45.1%28.6%16.4%χ2 = 36.389, df = 4, p < 0.01
* Note: mean values are measured on a seven-point Likert-type scale (1 = not at all, 7 = extremely worried).
Publisher’s Note: MDPI stays neutral with regard to jurisdictional claims in published maps and institutional affiliations.

