1. Introduction
The challenging objective of net-zero greenhouse gases [
1] and the difficulties in maintaining a balance between the electrical energy supply and demand with the expansion of renewable energy sources [
2] have resulted in the constrain of only using electricity in a “smart grid” [
3,
4,
5]. Furthermore, owing to the increase in natural gas consumption caused by the recent low natural gas prices [
6,
7], there is growing interest in not only the efficient use of energy sources other than electricity but also in the integrated operation of various energy sources [
8]. Integrated operation of various energy sources is a method of operating an entire energy grid in an integrated manner by establishing contact points between the grids (e.g., electrical, gas, heat, and hydrogen) and converting the energy sources [
9]. These contact points between the energy sources form an energy hub, and the use of an energy hub occurs in a smart energy system [
10], an integrated energy system [
11], or sector coupling [
12]. An energy hub is defined as a combination of devices that receive various energy sources (e.g., electrical, heat, gas, renewable energy) as input, convert them into different energy sources or store them, and subsequently provide them as output. The issues related to operating an energy hub are complex because of the numerous factors to consider, such as the operating restrictions for each energy conversion device, variability in the input limit and output load, and variability in the energy market prices.
Some studies summarized in
Table 1 proposed operation strategies that start with the energy hub itself, as in this paper, and they are distinct from those on high-capacity energy hubs that start with the optimization of the energy network [
13].
We focused on deriving the most economic operation for energy hub owners without improving the energy market system. Unlike other papers, we have determined the conversion efficiency matrix that can be operated considering the capabilities of each facility in the energy hub. Next, for the most economic operation, even the same energy must be divided into different energy flows according to price. For example, selling electric energy to the power grid, consuming it in a building, and consuming it by an electric vehicle have different economic values. Therefore, we classified the energy flow of the energy hub according to its economic value and established an economic operation strategy by optimizing the operating cost.
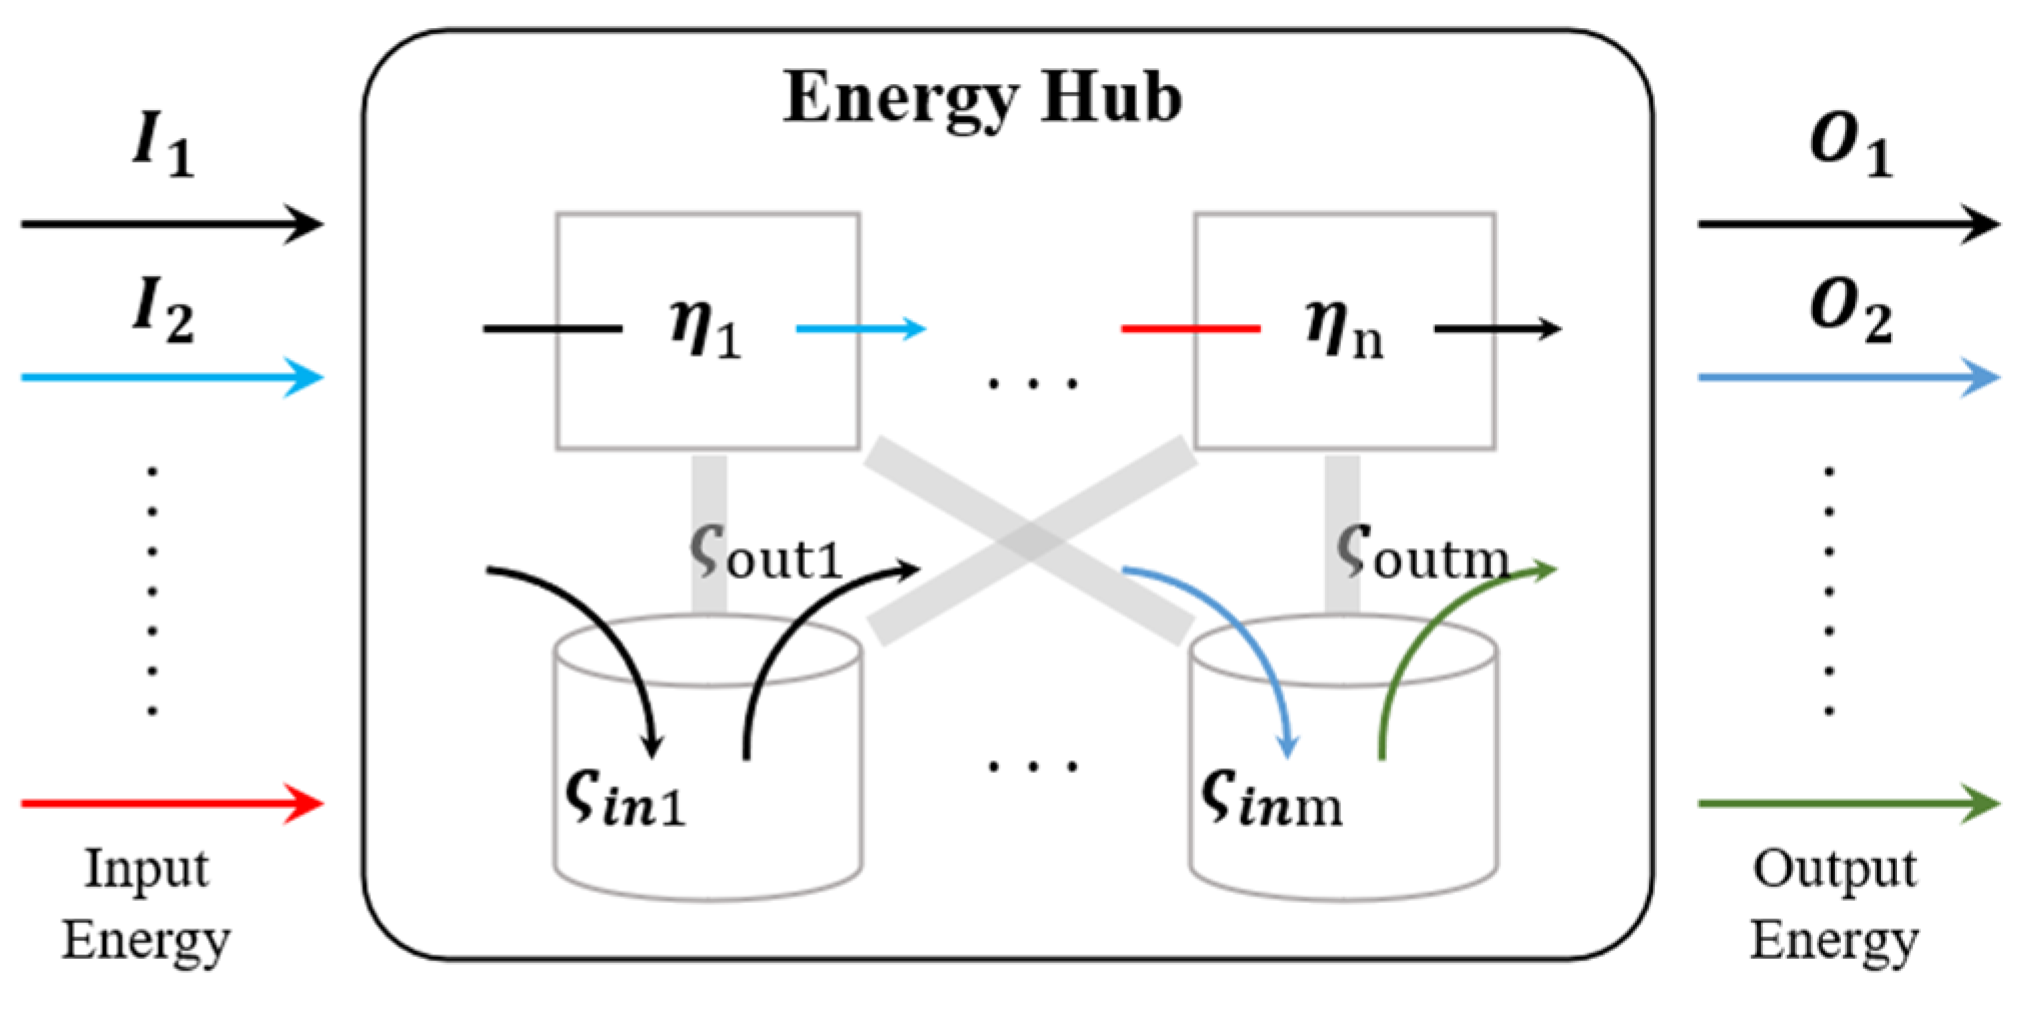
The simplest input/output (
matrix for such an energy hub can be expressed as follows:
is the energy discharged by the energy hub.
is the energy conversion efficiency.
I is a matrix representing the energy flowing into the energy hub. If energy is not stored in the energy hub, (1) always holds true in real time. However, if energy is stored in the energy hub, the model becomes more complex. When some of the inflowing energy is stored, it is expressed as follows [
20]:
is the storage efficiency for the inflowing energy. Similar to (1), (2) always holds true in real-time. In addition, when some of the energy that is stored in the energy hub is discharged, it is expressed as follows:
is the conversion efficiency when the stored energy is discharged.
is the energy that flowed into the energy hub in the past. Unlike (1) and (2), (3) requires past information. Specifically, an energy hub can be depicted using only the current information from a certain time if it has no storage function or if it has a storage function and only stores energy. However, if the energy that is stored in an energy hub is discharged, it can only be depicted if its past state information is known.
Figure 1 shows a diagram of a general energy hub model.
In an energy hub, the energy conversion matrix changes over time based on the external environment and the objective of the energy hub. Accordingly, an energy hub can vary its operations based on various external factors, such as the weather, amount of energy used from each energy source, and fuel prices. Furthermore, only when the energy hub responds flexibly to the external environment does it become possible to efficiently use all energy, which is the ultimate objective of an energy hub. Specifically, energy conversion matrices such as , , and are not fixed but change selectively based on the scenario. , , and have various types but are limited in terms of number. This is because it is typical for the operations of internal devices to change in multiple stages, instead of changing continuously, and maximum efficiency operating conditions are recommended by the manufacturer.
Section 2 introduces our energy hub, which will be installed, and presents the internal and external energy hub information needed to determine the hub operation method, including energy market information.
Section 3 presents the energy conversion models of the energy hub with three assumptions for realistic operation, an algorithm for model conversion based on the external environment, and an operation strategy.
Section 4 discusses a case study that calculates the profit when the hub is operated by the proposed operation strategy in the 2020 South Korean energy market environment, making certain assumptions about the internal energy consumption patterns of the energy hub.
Section 5 summarizes the conclusions of this study. As already mentioned, unlike other research results, we classify energy flows according to economic flows and suggest optimal operation plans.
2. Energy Hub
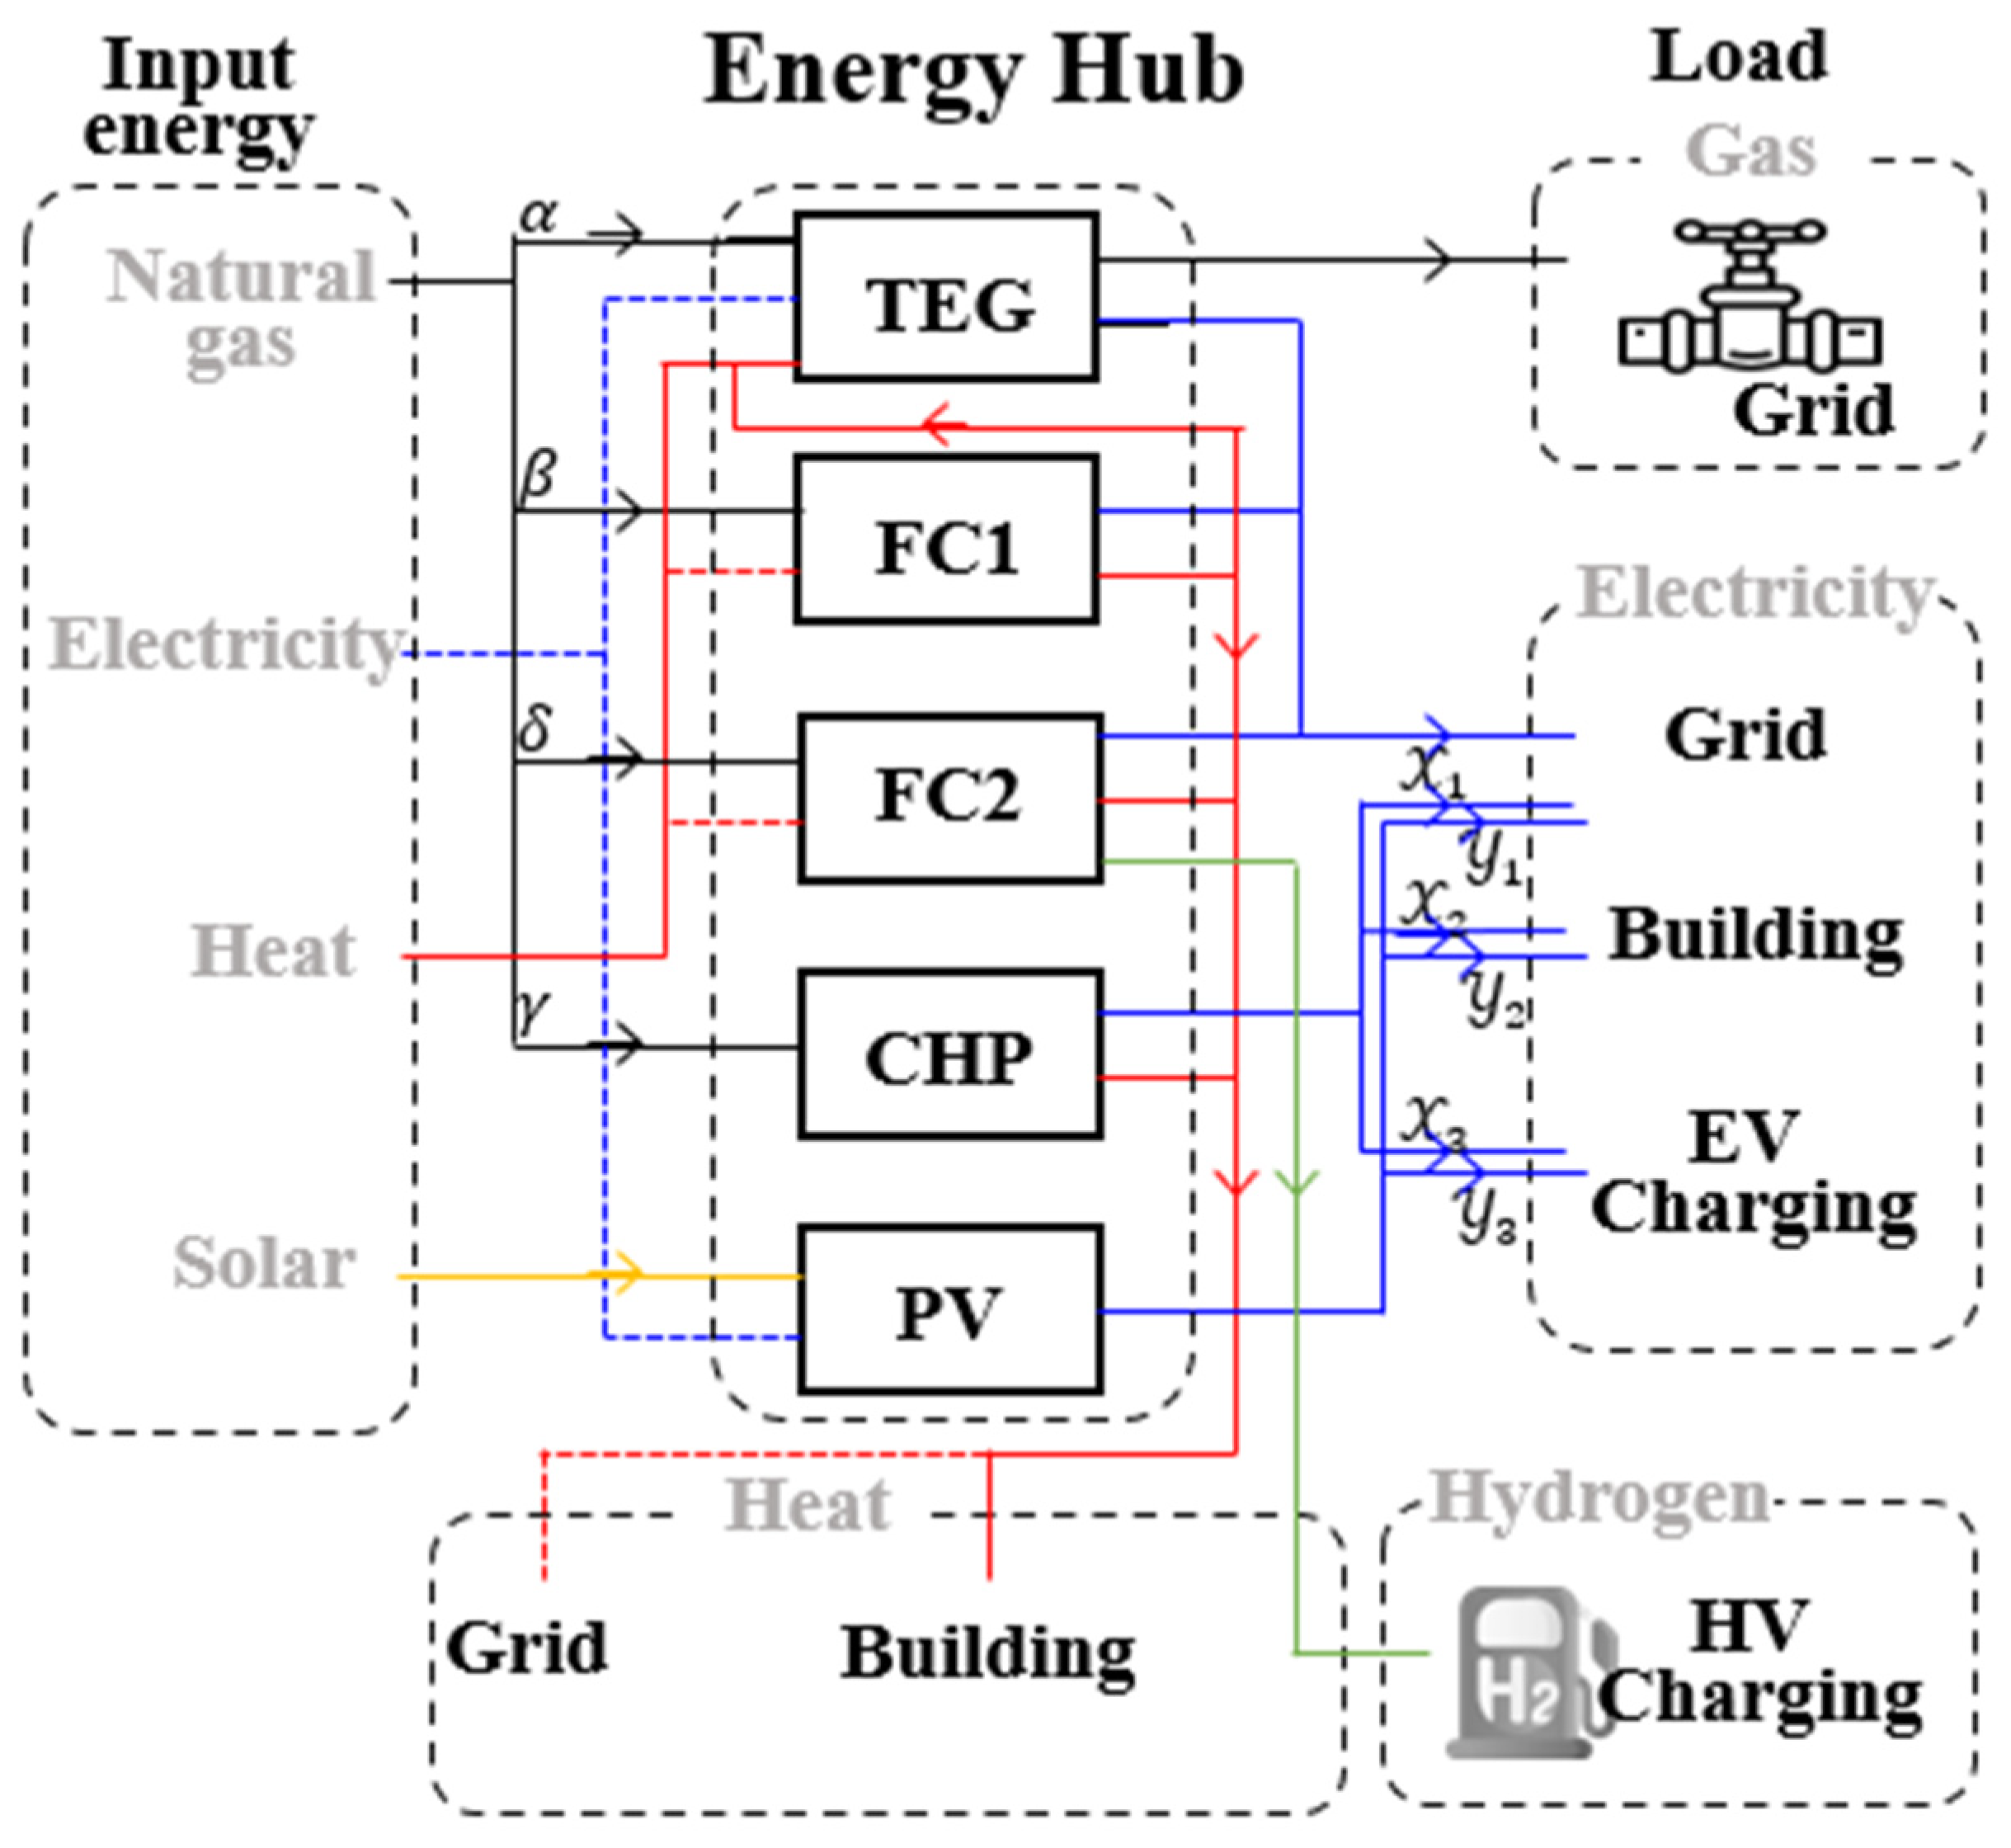
Figure 2 introduces the energy hub, which is under research and development in Gyeonggi-do, South Korea and is expected to be completed in 2022. The proposed energy hub inputs natural gas, which is the primary form of energy, as well as electricity and heat, which are the secondary forms of energy. The hub outputs hydrogen and natural gas, which are the primary energy sources, and electricity and heat, which are the secondary energy sources. The input includes the electrical energy from the national electrical network, natural gas from the national natural gas network, and heat energy related to the regional networks. Regarding the output, electrical energy can be sold to the electrical network or used in internally located office buildings and electrical automobile chargers. Even though both these outputs are electrical energy, they are distinguished from each other. This is because the monetary amount that is sold to the electrical network is different from that saved by purchasing less electrical energy from the electrical network owing to internal usage. In addition, natural gas is released as output to the natural gas network. Hydrogen is also released as output to charge hydrogen vehicles.
The internal devices of the energy hub are a turbo expander generator (TEG), two types of fuel cells (FCs), a small combined heat and power (CHP) generator, and a photovoltaic (PV) generator.
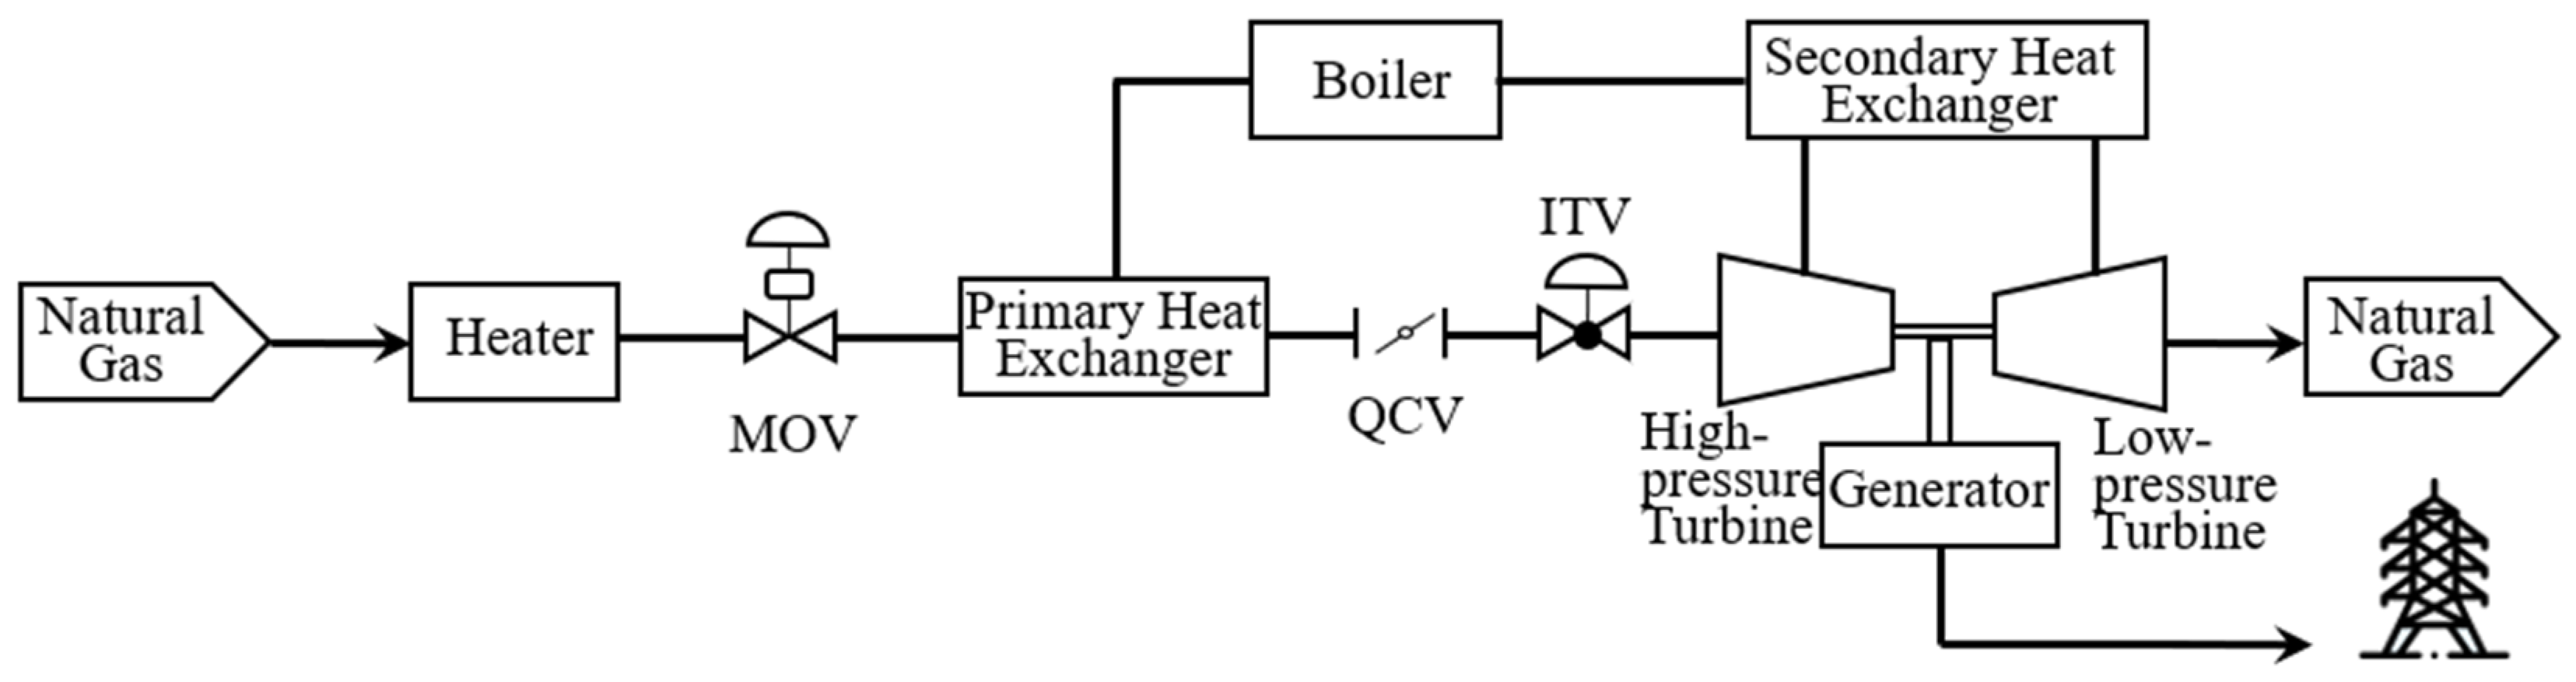
2.1. Turbo Expander Generator (TEG)
A
TEG is a generating device that converts the energy lost during the process of reducing the fluid pressure into electrical energy [
21]. Natural gas flows through main lines in a high-pressure gaseous state, is decompressed near the use location, and subsequently distributed to the locations of use. In South Korea, there are 142 supply management centers in a single national natural gas supply network, and decompression is performed at these centers.
TEGs are installed in the supply management centers, where natural gas decompression is conducted, and they are used as generators that do not consume any fuel and do not emit any GHGs.
Figure 3 shows the major components of a
TEG.
The decompression devices of the constructed supply management center consist of four units arranged in parallel, and the
TEG is installed in one of these [
22]. Because the gas network is connected nationwide, its large scale allows for a constantly stable supply to the energy hub. The amount of gas flowing through the piping may vary based on the changes in natural gas demand; however, the
TEG of our energy hub is only one of the four decompression devices arranged in parallel and can independently adjust the amount of gas. Therefore, the amount of gas that enters the
TEG is stable and can be freely adjusted. Although the
TEG can generate electricity without any fuel loss or greenhouse gas emissions, it requires heat energy. The heat energy is needed to compensate the temperature decline that is caused by the Joule–Thompson effect as the gas expands from a high-pressure state to a low-pressure state [
23]. In addition, a small fixed amount of electrical energy is required to operate the
TEG. The natural gas that is inputted into the
TEG is outputted as-is without any consumption; there is only a change in the pressure. In addition, electrical energy, which is the main energy output source of the
TEG, is outputted. The energy
I/
O and energy conversion of the
TEG is expressed in (4).
g denotes natural gas and e denotes electrical energy. h represents heat energy. is the TEG energy conversion efficiency matrix. Because continuous operation of the TEG can strain the device, there is a device operation constraint that the TEG operation must be suspended for at least 10% of one year.
2.2. Fuel Cell (FC)
FCs convert chemical energy into electrical energy. The electrical energy is produced from the conversion of the difference in the internal energies of the elements during the reaction of high-purity hydrogen and oxygen to form
. The methods of hydrogen production include by-product hydrogen generation, reforming, and water electrolysis. The proposed energy hub uses reforming, which extracts hydrogen from the natural gas (CH
4) obtained from the natural gas pipe network. This extraction produces high-purity hydrogen on addition of a catalyst at high temperatures. In addition, a relatively high temperature is required during reconversion process of hydrogen into
. The energy hub uses a phosphoric acid
FC, which requires temperatures of 150–200 °C. Specifically, heat energy is discharged from the process of extracting hydrogen and generating electricity. Two types of
FCs are used in the energy hub:
FC1 denoting FCs that output electricity and heat energy, as expressed in (5), and
FC2 denoting hydrogen-producing
FCs that directly output part of the reformed hydrogen as expressed in (6).
denotes hydrogen. and are the energy conversion efficiency matrices of the normal FC and the hydrogen-producing FC, respectively. Because the continuous operation of the FCs can strain the devices, there is a device operation constraint that the FC operation must be suspended for at least 10% of one year.
2.3. Combined Heat and Power (CHP)
A combined heat and power (
CHP) device takes a single fuel as the input and outputs two forms of energy: electricity and heat. In our energy hub, natural gas is used as the fuel. The
CHP is as expressed in (7).
is the CHP energy conversion efficiency matrix.
2.4. Photovoltaic Generation (PV)
PV generation converts sunlight energy into electrical energy. It is common to add a maximum point power tracking (MPPT) feature, which adjusts the impedance to transmit maximum electrical energy. The maximum generated electricity is expressed as
. is the amount of electricity generated during the standard state. T is the temperature of the
PV panel.
is the temperature during the standard state.
is a constant that varies according to the type of
PV panel. For the generated electricity, a DC–DC converter, which has an MPPT function while changing to a fixed voltage level, and a DC–AC inverter, which makes the voltage and the frequency the same as those of the electricity network, are added, and electrical energy is inputted to operate them.
s is the photovoltaic energy. is the energy conversion efficiency matrix of the PV device.
2.5. Installation Environment
The energy hub receives gas, electricity, and heat from gas, electricity, and regional heat networks, and it also performs
PV generation using
PV energy. Because this study determines the operation method for normal scenarios, instead of emergencies such as natural disasters, the amounts of energy that can be received from the gas, electrical, and heat networks are assumed to be sufficient. The output energy can be sold to energy networks and consumed by the office buildings, electric vehicle charging devices, and hydrogen vehicle charging devices that the hub itself operates.
Figure 4 shows an overview of the energy hub and its energy network connections. Flows that exist but are not used for institutional reasons or because they are not important are indicated by dotted lines. These are described subsequently.
2.6. South Korean Market
2.6.1. Natural Gas Market
In Korea, there is no free market for natural gas where the price is determined by numerous buyers and sellers based on the market principles. Instead, the unit price of natural gas is declared by the government. KOGAS is a large public company that distributes gas monopolistically, and there are private pipeline companies that have monopolistic control regionally. In the energy hub, the amount of input natural gas is always smaller than the amount of output. This is because the TEG is the only energy hub device that emits natural gas, and its input and output are always the same. Therefore, the energy hub always purchases natural gas at the government rate.
2.6.2. Electricity Market
Numerous energy-generating companies generate electrical energy, and the Korean Electric Power Corporation, which has monopoly status, transmits and sells it. Specifically, electrical energy sales are determined by the market prices, which fluctuate in the wholesale market, and electricity purchases follow the electricity rates declared by the government without a market. In the wholesale market, the price is determined by the day-ahead market, and this is called the system marginal price (SMP). In addition to the SMP, electricity can be sold by receiving a renewable energy certificate (REC) when selling the electrical energy generated by renewable energy sources. An REC is an additional benefit provided by the Renewable Portfolio Standard of the Korean government for promoting renewable energy. The electrical energy generated by PV generation and FCs in our energy hub receives an REC. Here, the weight value varies based on the generation source. According to the standards for 2020, PV generation has a weight of 1 and FCs of 2. Specifically, even when the same amount of electrical energy is sold, there is a larger profit when selling PV and FC energy, and the FC energy provides a larger profit than PV energy. In the electricity market of South Korea, to maintain a stable amount of energy generation, entities cannot choose between self-use and sales according to their own discretion, except in the case of PV generation. In the case of “generation devices for sales”, all generated electrical energy must be sold, except the electrical energy required to operate them. In contrast, in the case of “generation devices for self-use” that are registered to consume their own electricity, it is recommended that they use the electrical energy that they generate. Moreover, there is a sales constraint that 50% or less of the annual amount of generated energy must be sold to the electrical network.
As mentioned before, electrical energy purchasing is achieved by paying the prices declared by the government, without a retail market. The declared prices vary according to the usage purpose, season, and time slot. The energy hub may provide an economic profit that equals the cost saved by the self-consumption of electrical energy. However, because electrical energy usage objectives vary, the profit provided by using electrical energy in buildings and electrical vehicles must be calculated differently for each purpose. In addition, the profit must be calculated differently based on the season.
2.6.3. Heat Market
As in the case of natural gas, there is no free market for heat in which the prices are determined by numerous buyers and sellers based on the market principles. Instead, the heat energy unit prices are declared by the government. The Korea District Heating Corporation, which is a public company that has monopoly status, installs heat networks for each region and supplies heat energy. Therefore, the heat energy that is outputted by the FCs and the CHP devices can only be self-consumed. In addition, the heat energy that is received from the suppliers is bought at the prices declared by the Korea District Heating Corporation.
3. Energy Hub Model and Optimal Operation
The objective of this study is to find the economically optimal operation method of from the perspective of energy hub operators. This section presents a conversion model (η) that can be operated considering the capabilities of each facility in the energy hub. The conversion model has several modes that vary based on the internal equipment state (active or inactive). After various conversion models are established, the benefits of selecting a certain conversion model are determined based on the market prices of each energy source and the internal energy usage amounts. For the most economic operation, even the same energy must be divided into different energy flows according to price. Subsequently, the amount of input from each energy source and the output routes are determined using the conversion model to obtain the maximum economic value.
3.1. Energy Hub Conversion Model
We made three assumptions to obtain the conversion model of the energy hub. The first assumption was that (i) when the same forms of energy are inputted and outputted from the individual conversion devices, the larger amount is assumed to be the input or the output, and the amount of input or output is the difference between the two. For example, in the case of the
TEG, electrical energy is outputted, and electrical energy input is also needed to maintain stable electrical power quality. Specifically, electrical energy is both inputted and outputted. To simplify the conversion model, it is assumed that the
TEG only has electrical energy output without any input, and the amount of output is the difference between the two, as expressed in (9). Because the buying and selling unit costs can differ even for the same form of energy, simplification of the conversion model must be performed carefully. In this energy hub, such an assumption was made because it does not significantly affect the operation decisions. The output electricity from the
TEG is 1500 kW and the input electricity is 24 kW, i.e., there is a large difference between them.
The second assumption was that (ii) there are no changes in the conversion efficiency based on the amount of input energy for each device. For example, there may be a difference between the conversion efficiencies when 15,000 kW and 1000 kW are outputted from the TEG. However, in our energy hub, there are many cases where only the optimal amount is inputted into each device, and, therefore, this is assumed to be true to simplify the conversion model.
Because it is not easy to measure the amount of input energy for renewable energy sources, it is difficult to obtain their conversion efficiencies. Furthermore, PV conversion does not need output control and does not incur costs for the input fuel, unlike other energy conversion devices. The third assumption was that (iii) PV generation still produces the same measured amount of electrical energy as produced during similar weather in the past.
To define the conversion model, the input and output types of the energy hub must be determined. Because the objective of this study is to obtain an economic operation method from the perspective of the energy hub, it is reasonable to classify the energy types based their economic value. The cases in which the economic values were different, were distinguished, even for the same type of energy. As mentioned in
Section 2, electrical energy has different selling prices for all types in the energy market. In the case of the
TEG electricity, self-consumption by the generating company is not allowed, and external sales are possible. The electrical energy that is generated by the
PV devices and
FCs can receive the REC price, which may be different from the normal electrical energy sales unit price (
SMP) by a factor of 1 or 2. In contrast, since there is no market for gas, heat, and hydrogen, it is impossible to sell them to each network, and profit can only be obtained by savings via self-consumption.
Figure 4 shows the energy flow in the energy hub. In this flow, electrical energy is inputted and outputted from the
TEG and the
FCs, whereas it is assumed that the input does not occur because the amount of output is large. These energy flows that do not reflect the conversion efficiency accordingly are shown as dotted lines in
Figure 4. The inputs in the energy hub model are natural gas (
), heat (
), and
PV generation electricity (
), and the outputs are natural gas (
),
TEG electricity (
),
FC electricity (
),
CHP electricity (
),
PV generation electricity (
), heat (
), and hydrogen of the
FC (
). The energy conversions for each device that reflect these inputs and outputs are expressed in (10)–(19).
denotes natural gas, and e represents electricity. h is heat. is hydrogen. For example, symbol represents the efficiency of the natural gas conversion into electrical energy by the TEG.
α, β, γ, and
δ are the ratios at which the natural gas that enters the overall energy hub is distributed to and inputted in the
TEG,
FC1,
FC2, and
CHP devices, respectively, as shown in
Figure 4. Therefore, it is expressed as follows:
Equations (10)–(19) can be expressed as a single matrix as shown in (21). Specifically, the general
IO matrix in (1) is expressed as (21) in the proposed energy hub.
The energy conversion efficiency,
η, varies according to on/off state of each device. The operating devices are listed in
Table 2. The conversion efficiency of a device that is not operating is zero. Specifically, there are 16 conversion efficiencies based on the combinations of the four devices being on or off.
3.2. Algorithm for Determining ON/OFF State of Conversion Devices
It is necessary to determine which matrix will be selected among the 16 conversion efficiencies for each time slot. Specifically, it is necessary to determine whether each energy conversion device in the energy hub is on or off. As mentioned in
Section 3, in the South Korean energy market, it is first necessary to determine which type the generation devices will be registered as. Specifically, one must first decide whether a conversion device will be registered as a “generation device for sales” that sells its generated energy to energy networks or registered as a “generation device for self-use.” This registration cannot change dynamically based on the operations but must be maintained permanently after selection unless there is a particular reason. It is found that it is economical to register the
TEG and the
FCs as generation devices for sales and the
CHP as a generation device for self-use. All the electricity that is outputted from the
TEG and the
FCs is sold. The
TEG has a large amount of electricity at 1.5 MW, and its sales amount is larger than the required heat energy; therefore, it is registered as a “generation device for sales” that runs for the maximum operation time.
FC generation can receive the REC sales price in addition to the
SMP, and, thus, it is beneficial to sell. In contrast, the
CHP device is advantageous to act as a self-use device operator that determines whether to operate by comparing the
SMP that can be received for sales with the energy cost savings, i.e., the electricity rates. These decisions may change with the environment, including the fuel costs, energy market price fluctuations, and energy load of the hub.
The decisions on whether the
TEG,
FC, and
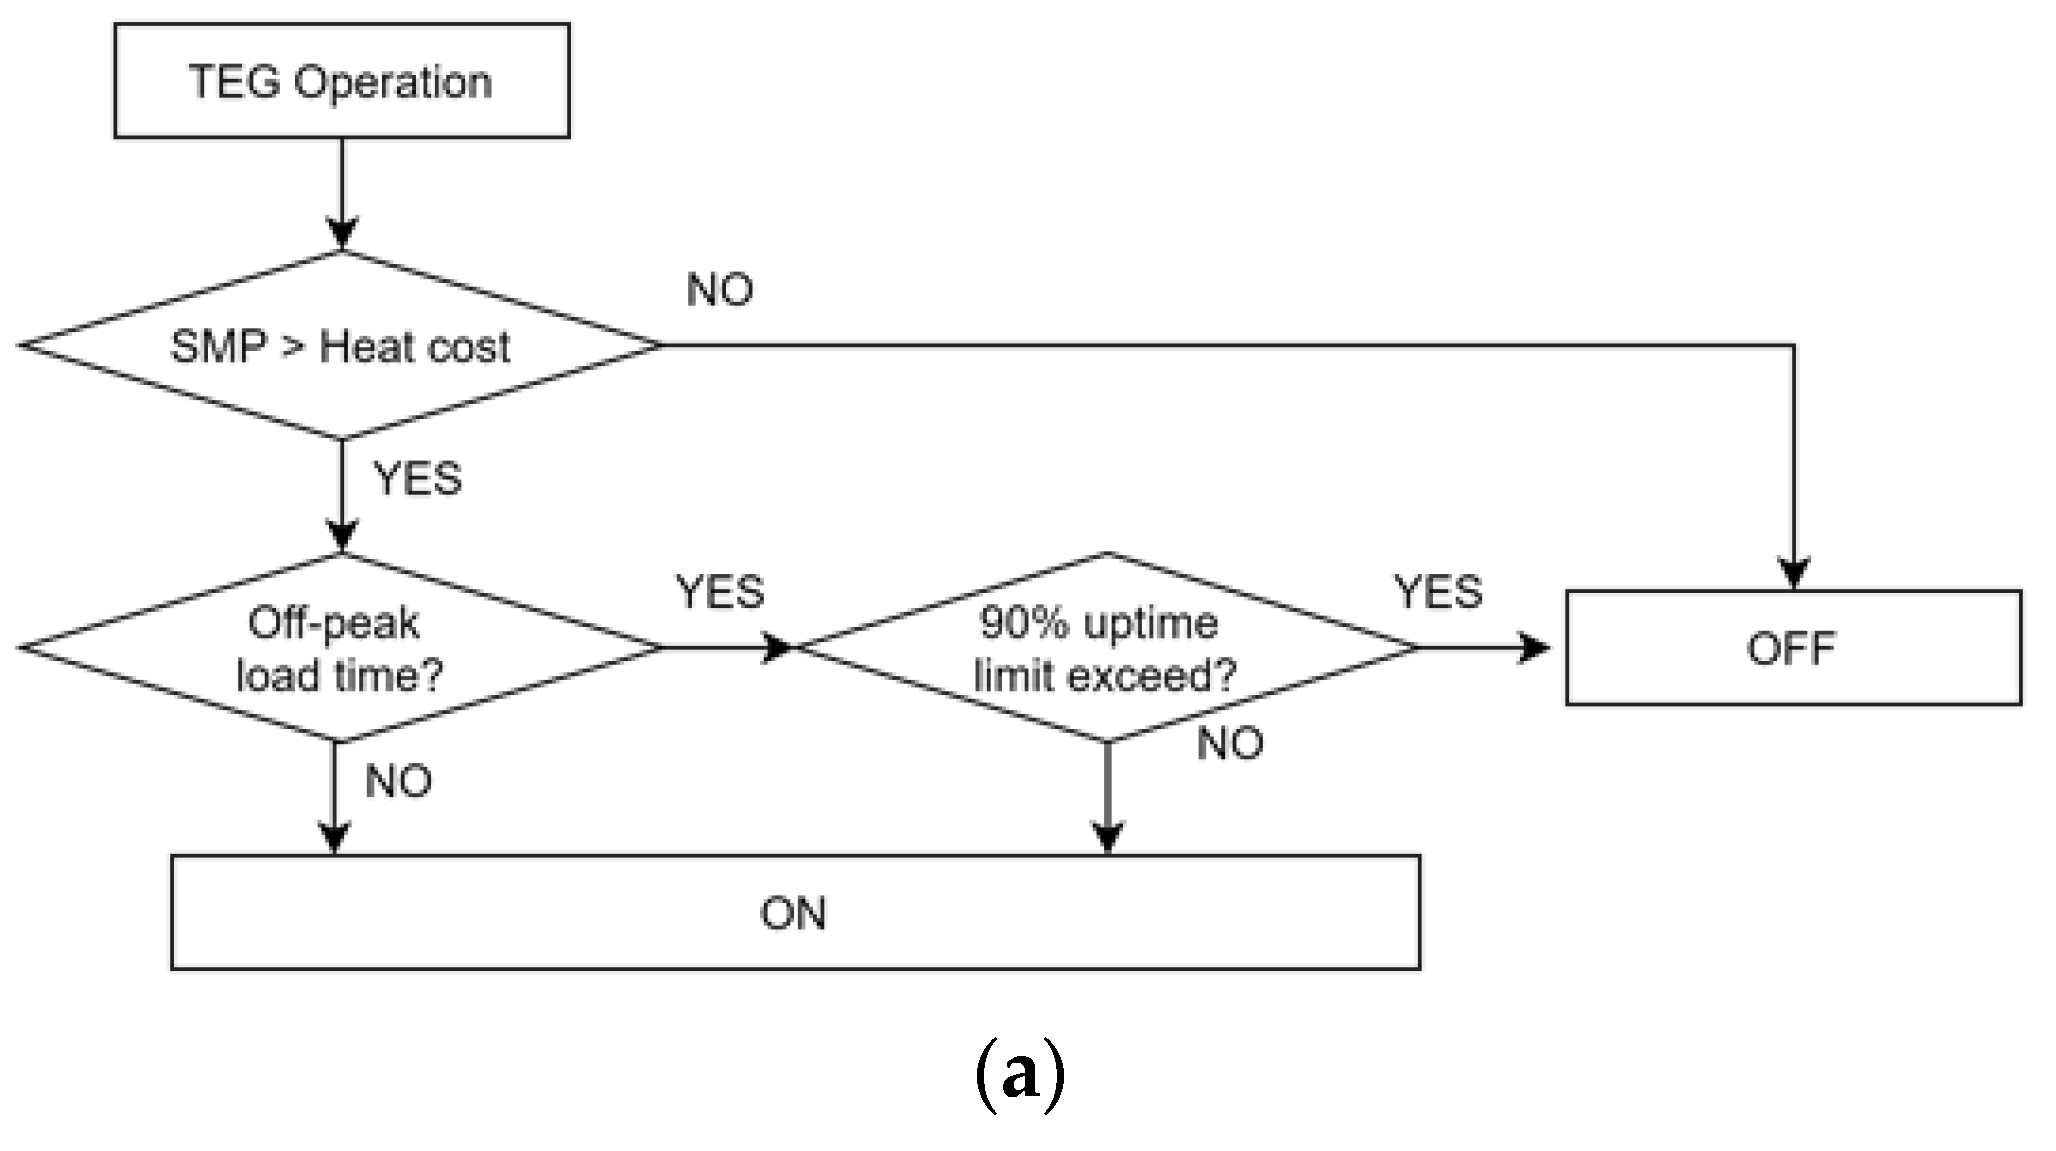
CHP energy conversion devices will be on or off are taken by comparing the cost of the fuel needed during operation, energy selling unit prices, and cost saved when using the energy internally. Specifically, the decisions on whether to operate the devices are based on the comparison of the capital needed for operation and the profit. In addition, this study considered the constraints regarding the downtime needed for maintenance. The algorithm for determining whether the
TEG,
FC, and
CHP will operate is shown in
Figure 5. Because the natural gas that is inputted in the
TEG varies in terms of the pressure but not the amount, only the invested heat costs are compared to the selling unit price (
SMP) to decide the
TEG on–off state. Because the
TEG is registered as a generation device for sales only, there is no need to consider the profit that is obtained from energy self-use. Briefly, the
TEG is turned on if the
SMP is larger than the heating cost. However, the
TEG has a constraint in that the operation must be suspended for 10% of every year to avoid excessive strain on the device. Over the course of a year, the
TEG is selectively turned off at off-peak load time slots when the
SMP is low. The
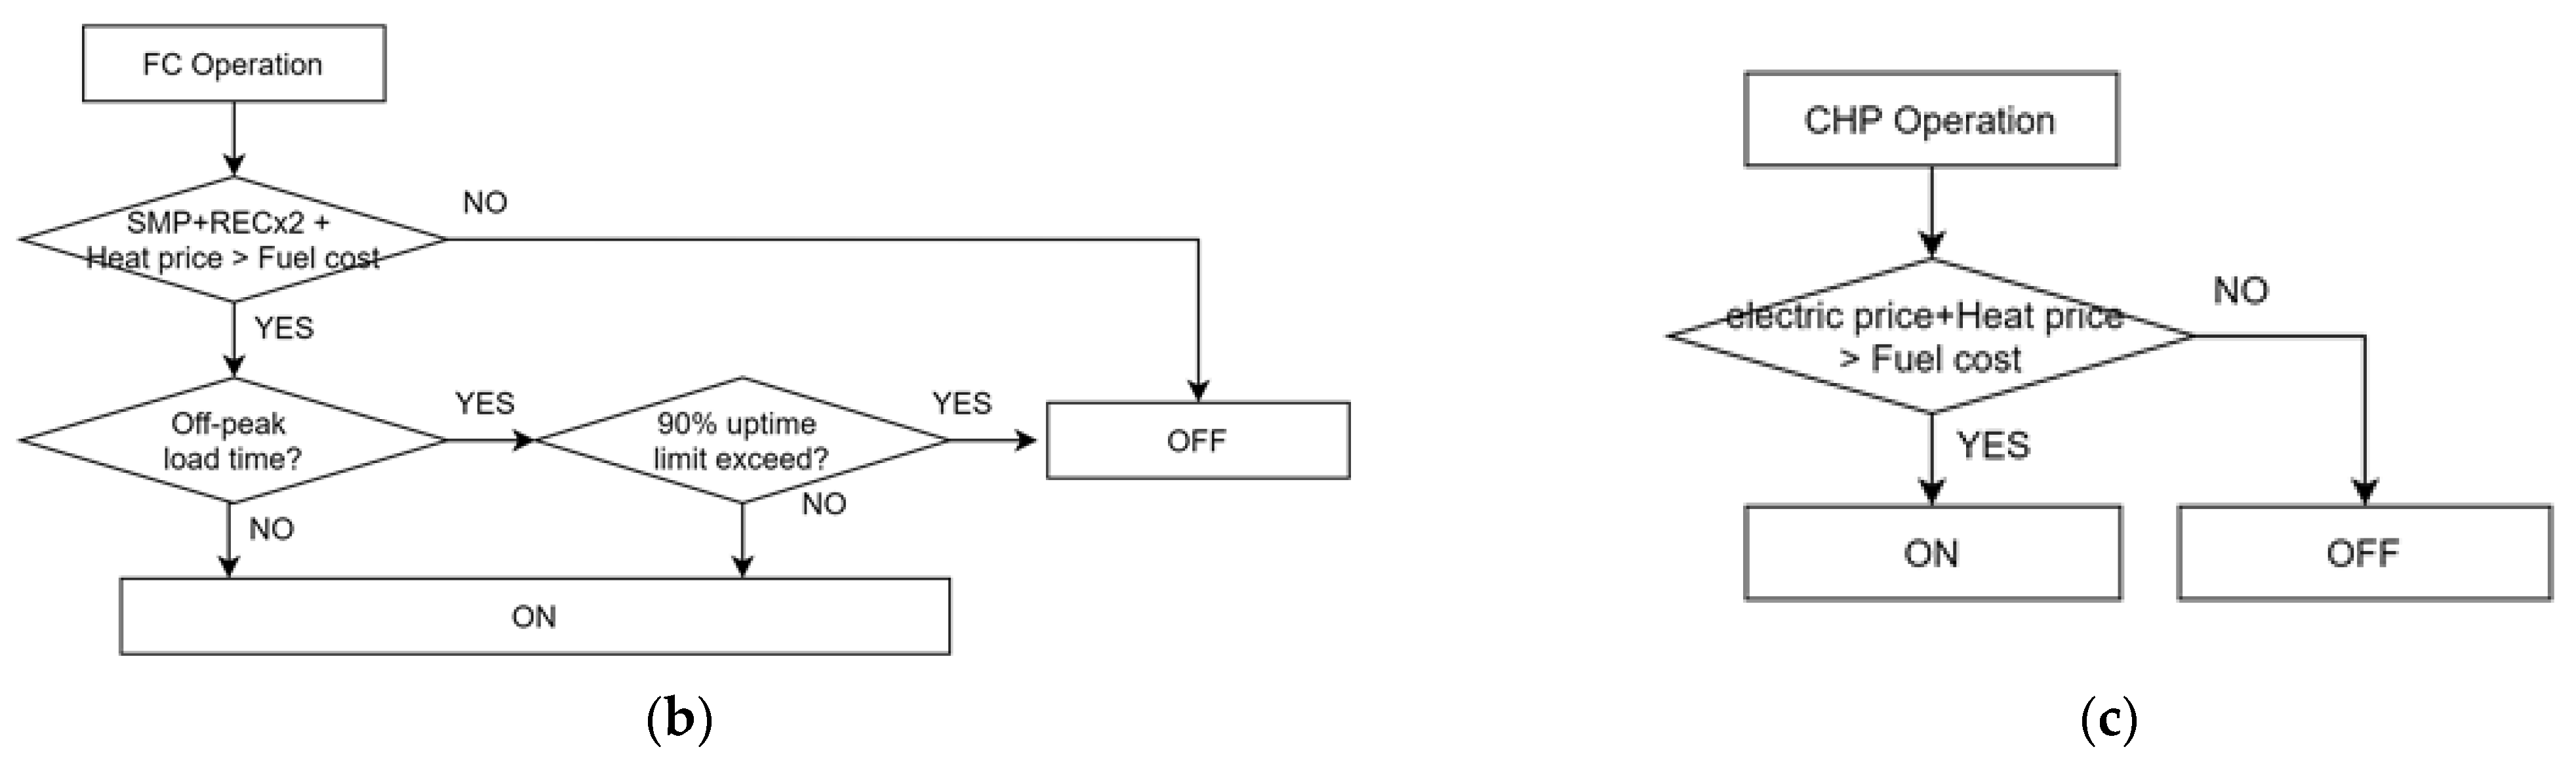
FCs receive the REC price in addition to the
SMP, which is the price that is received when selling electricity to the market. Furthermore, their REC weight value equals 2. In addition, the
FCs output heat energy; however, because there is no selling market for the heat energy, the cost savings achieved using it in the
TEG or buildings are considered. Similar to the
TEG, the FC have a constraint in that their operation must be suspended for 10% of every year to avoid excessive strain on the devices. Because heat fees are applied to the energy hub using a single rate system that does not fluctuate with the season or time, the
FCs are selectivity turned off at off-peak load times when the
SMP is low, similar to the
TEG. For the
FC that produces hydrogen (
FC2), the additional profit from charging hydrogen vehicles is considered. The small
CHP device is turned on if the sum of the cost that must be incurred for electricity and the heat fees is larger than the natural gas fuel fee that is needed to operate it; otherwise, it is turned off.
3.3. Objective Function and Constraints
As mentioned in
Section 1, we considered only the economic profit of the energy hub operator, and not the overall benefit to the society. Only the profits and costs that change with the changes in the energy conversion modes are considered. Under these conditions, the objective function is as expressed in (22).
is the profit when the output energy of the energy hub is sold externally. is the cost saving by self-use and buying less from the energy networks. C is the input cost that changes based on the operation, including the fuel cost. , , and are expressed in (23)–(25), respectively. is the energy selling unit price. is the output energy. L is the load size of the energy hub. The SMP is the system marginal price of the electricity market, and the REC is the renewable energy certificate of electricity market. EV denotes an electric vehicle.
In the energy market of Korea, only electrical energy can be sold; therefore,
contains only electrical energy. Electrical energy sales receive the
SMP, which is determined by the day-ahead market. In addition, sales can receive the REC sales price owing to the renewable energy incentive policy. For the
FCs, the amount is multiplied by 2 because the weight value is 2.
, the cost saving by self-use, comprises electrical energy, natural gas, hydrogen, and heat energy. Because electrical fees vary according to use, there is a difference between
(the electrical energy used in buildings) and
(the electrical energy used in electric vehicles). For hydrogen and heat, which cannot be sold to energy networks and must be consumed by the energy hub, the demand and production amounts are compared, and the profit is calculated based on which is the smaller one.
Figure 4 shows the distribution of the sales profit (
), profit from saving energy by self-use in buildings (
), and profit from saving energy by self-use in electric vehicle charging (
) for the electric energy generated by the
CHP and
PV, respectively. The input change cost, C, is the natural gas and heat cost. In the proposed energy hub, an operation is determined based on the objective function at every time interval because there is no storage function.
The constraints for the individual devices are expressed in (26)–(35), and the numbers are the same as in
Table 3.
Because the
TEG is the only device that outputs natural gas,
is less than the maximum gas that can be outputted by the
TEG (29). Because the
FCs and the
CHP devices output heat and operate independently, the output is limited to being less than or equal to the maximum possible output heat from each of the
FCs and the
CHP device (30). Because
FC2 is the only device that outputs hydrogen,
is less than or equal to the possible output value of
FC2 (31). The natural gas that is inputted in the energy hub is distributed to the
TEG,
FC1,
FC2, and the
CHP, and because they all operate independently, the input is less than or equal to the sum of the maximum natural gas that can be inputted in each device (32). The heat that is inputted in the energy hub is distributed to the
TEG,
FC1, and
FC2, and because they all operate independently, the input is less than or equal to the sum of the maximum heat that can be inputted in each device (31). The constraints due to the load are expressed in (36) and (37).
4. Case Study
In addition to the three assumptions mentioned in
Section 3.1, a case study that made three additional assumptions was analyzed. (i) It was assumed that the energy usage needed for the internal load, i.e., the building energy, electric vehicle charging, and hydrogen vehicle charging, followed the pattern described below. (ii) It was assumed that the electrical energy sales market price (
SMP) was the same as the market price in 2020 and the REC was the average market price in 2020. (iii) It was assumed that the energy purchase costs for the electricity, heat, and gas were at the levels declared by the South Korean government in 2020. The case study calculated the economic profit when the energy hub was operated in the South Korean energy market based on the proposed operation method. This case study aims to verify the economic operation process presented in this paper rather than the results of economic feasibility.
The installed energy hub includes a new three-story office building with a floor area of 376 m
2. Because there are no measurement data for the energy usage of this building, the case study used a figure by scaling down the real-time energy usage amounts of the other buildings. The other buildings consist of six office buildings with a floor area of 54,000 m
2 in which around 100 businesses reside, and data were measured in them for 365 days in 2020.
Figure 6 shows the scaled-down energy patterns.
Electric vehicle charging demand varies significantly depending on the charger location. Chargers that are installed at public buildings and business districts experience little charging demand during pre-dawn hours, whereas their demand grows during the daytime hours after the start of a work day. This research team of this study was unable to obtain actual data on electric vehicle charging loads; therefore, the charging load shown in
Figure 7 is based on publicly available data. The office buildings located in the energy hub show similar patterns as seen in the electrical usage in business districts. It was assumed that hydrogen vehicle charging patterns are similar to electric vehicle ones. However, because there are two charging ports installed at the energy hub, the maximum number of hydrogen vehicles that can be charged is two. In addition, hydrogen is produced by the energy hub at 9 kg/h, and this is considered when making assumptions about the charging demand. Based on these assumptions, the hydrogen vehicle charging demand is assumed to be as shown in
Figure 7.
The
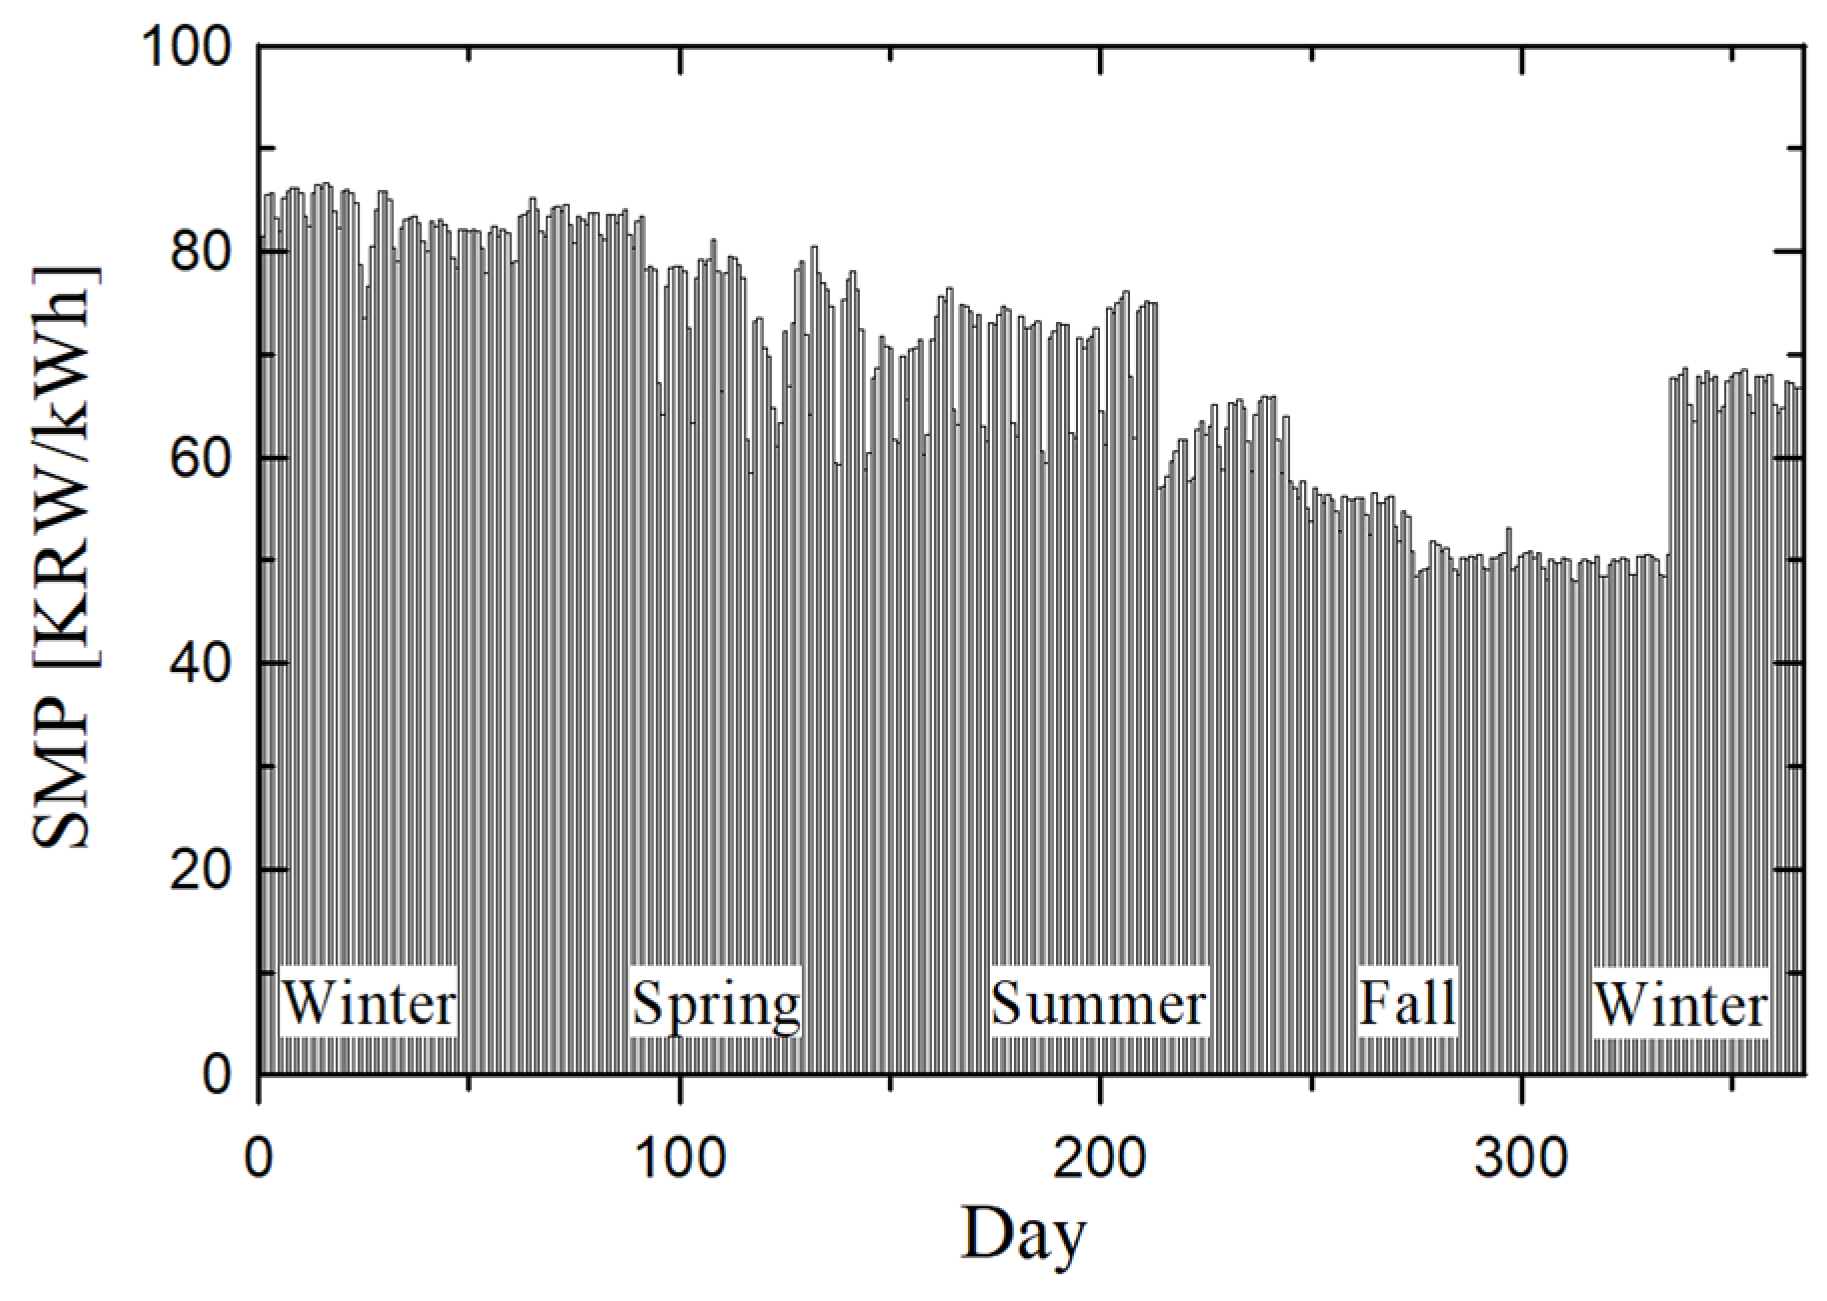
SMP is the market price of electrical energy, which is the only energy that can be sold to networks in the South Korean energy market. The
SMP fluctuates every hour in the day-ahead market. In this case study, the 2020
SMP fluctuations were used without modification. For the REC, it was assumed that the sales were made at the average price for 2020.
Figure 8 shows the
SMP fluctuation trends in 2020. In 2020, the
SMP decreased slightly in autumn and maintained a high rate in summer and winter. Fluctuations in energy prices are majorly affected by the fuel costs and the weather, and it is best to view the patterns shown in
Figure 8 as representative examples, instead of as general patterns. Electricity, heat, and gas purchase prices do not fluctuate, and follow the prices declared by the government. For them also, the 2020 prices were used without modification.
Because the internal energy demand of the energy hub and the market prices were assumed, whether the
TEG,
FCs, and
CHP devices are on or off was determined using the algorithm in
Section 3.2 The time interval for deciding whether to turn the devices on or off was set as 1 h, which is the
SMP fluctuation interval. Specifically, energy conversion efficiency matrices (
η) were determined in units of 1 h for the 8760 h in one year. The operation method for each hour was determined considering the constraints and objective functions described in
Section 3.3.
Table 4 summarizes the economic profit in one year of operation in accordance with the proposed algorithm and the objective function. The one-year economic analysis in
Table 4 is the result of adding the profits for 8760 h, i.e., 365 days. A one-year profit of 1,018,551,000 KRW (South Korean currency) is found. As of 31 December 2020, 1 USD was 1104.9 KRW. The table also lists the installation and fixed costs. The fixed costs are the investment costs of a fixed amount without regard to the operation method, and they include the inspection cost for each device, administrative labor costs, and other costs. Considering that the installation cost is KRW 10,038,000,000, the return on investment period is approximately 9.9 years which is three years shorter than that without the operating strategy. As mentioned previously, only the economic profit of the energy hub operator was calculated, without considering societal benefits such as an expansion of renewable energy, maintaining the balance between energy supply and demand, stable operation of gas and electricity networks, and stability in regards to natural disasters. Furthermore, the figures in
Table 4 must be analyzed carefully, considering these analysis results are for the current energy market system, which does not have an energy hub.
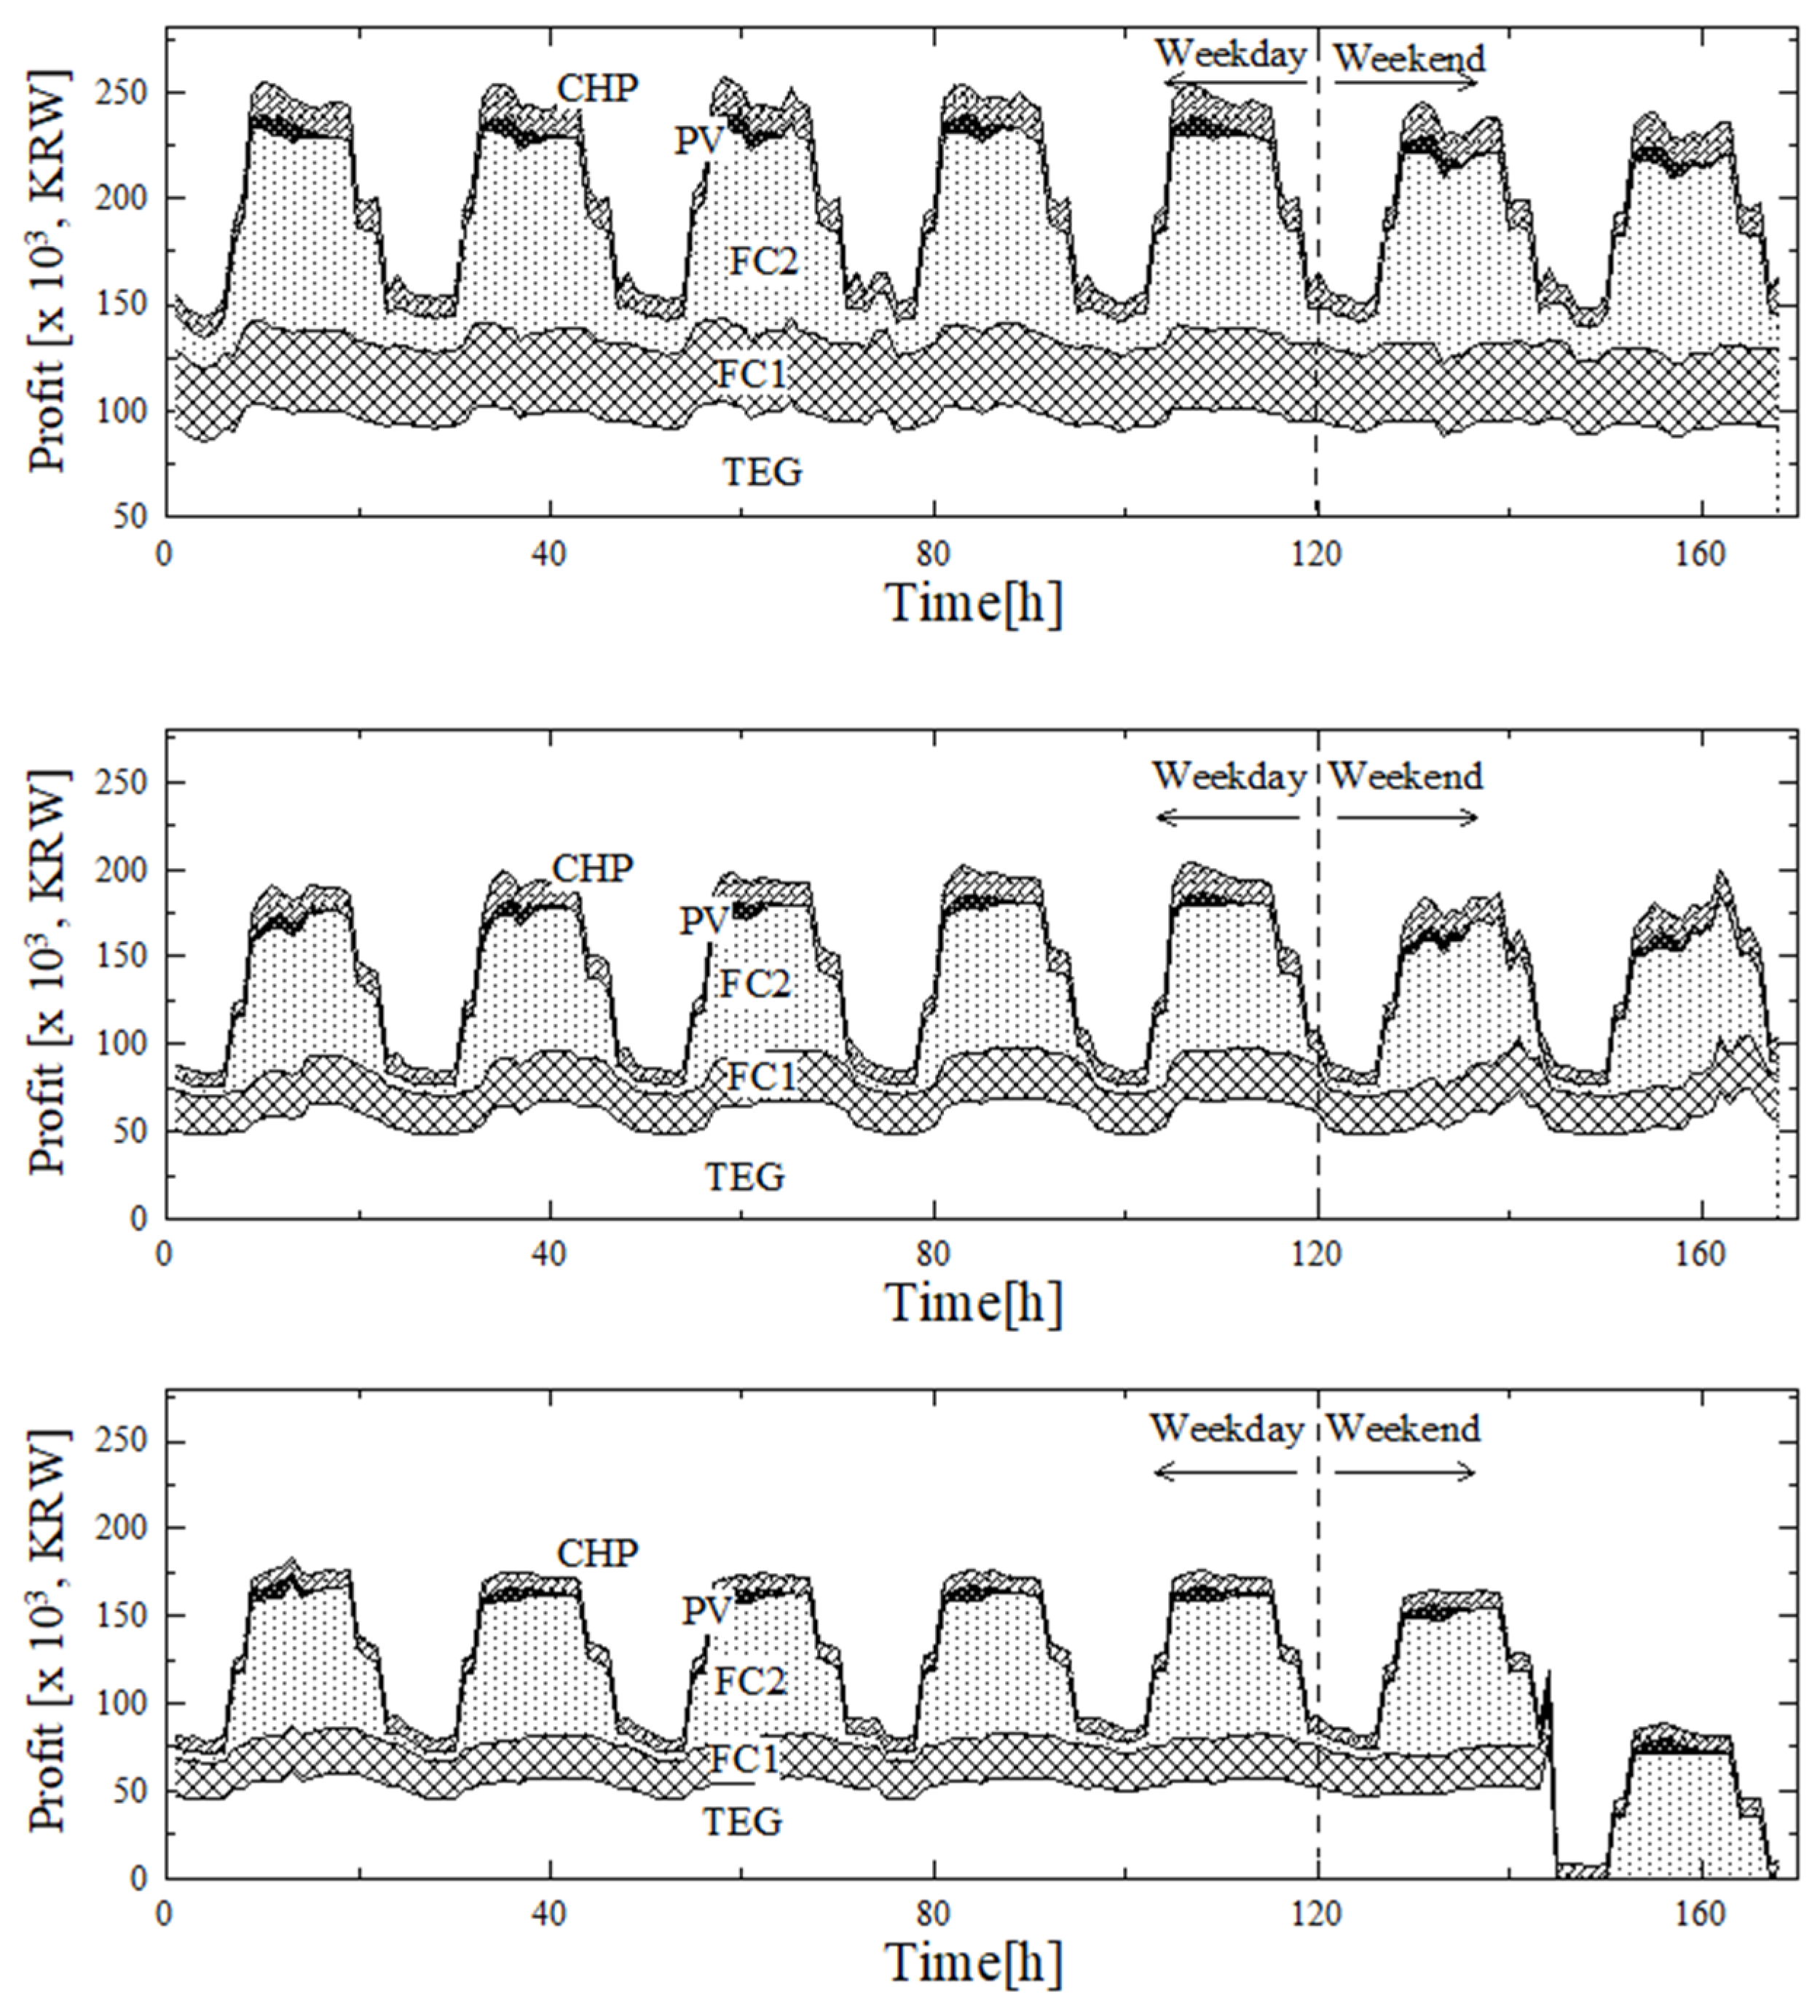
Figure 9 shows the cumulative profit from each device during a given week in winter, summer, and fall. The profit increased during the day and decreased at night periodically. This was because the
SMP and the electricity fees are low during the night and increase during the day. The deviation between day and night was more extreme in
FC2 than that in
FC1, and this was because the hydrogen charging that occurs in
FC2 is concentrated in the daytime hours. In addition,
PV generation was only profitable during the daytime hours when electricity production was possible because it was used immediately, as there are no energy storage facilities. The profit during the weekend was reduced by approximately 10% compared to that on the weekdays. This was because the weekend
SMP is smaller, and the electricity self-use is reduced in comparison to those on the weekdays. The overall amount of profit was the largest in winter, followed by summer, and then spring/autumn owing to changes in the
SMP, which is the electricity energy selling unit price. The
SMP used in the case study was higher in the winter/summer than that in the spring/autumn of 2020. The profits abruptly dropped by a large amount on Sundays in autumn. This was because operations were stopped owing to the
TEG and
FC inspections and the operation constraint that the devices cannot operate for 10% of the entire year to prevent excessive load. Operations were stopped in autumn because it was most economical to stop operations when the
SMP was the lowest during the year.
5. Conclusions
In this paper, the economic operation strategy of the energy hub was established from the efficiency of individual facilities inside the energy hub. First, an energy conversion efficiency model considering the efficiency of each facility was determined. After that, the energy flow was optimized in consideration of the energy market. Even if the energy types are the same, they are classified differently according to their economic value. The proposed method is expected to be more economical and realistic in that it considers the energy market and the efficiency of individual conversion facilities.
The energy hub that we designed is an energy conversion facility that receives natural gas, electricity, heat, and
PV energy and outputs natural gas, heat, and hydrogen. It consists of five energy conversion devices: a
TEG, hydrogen
FC (
FC1),
FC with a hydrogen outlet port (
FC2), small-scale
CHP device, and
PV generator (
PV). Using the three assumptions described in
Section 4, 16 conversion models were calculated based on whether each device was on or off. The conversion model matrix and the energy flow ratios were selected using the objective function expressed in (22), which yielded the largest economic profit from the energy hub while considering the internal load of the energy hub and the energy market fluctuations. Assuming the same energy market as the market in South Korea during 2020, the assumptions described in
Section 4 were made regarding the internal load of the energy hub, and an operational case study was conducted using the proposed operation method. The case study showed that the energy hub made a yearly profit of 1,018,551,000 KRW. The initial installation cost is 10,038,000,000, and the lifespan for most of the devices is 20 years or more. Using optimal operating strategy, the return on investment period is approximately 9.9 years which is three years shorter than that without the operating strategy.
Our proposed operation method has limitations in that (i) it does not consider energy storage devices and (ii) it assumes that the energy market prices and the generation capacities of the renewable energy sources are known. If energy storage devices are added to the energy hub, more efficient operation is possible. However, in this study, decisions were made using only current information. To include storage devices, it will be necessary to upgrade the operation plan because past energy flows must be considered. In addition, by incorporating predictions regarding the generation capacities of renewable energy sources, which fluctuate with the weather and future energy market prices, the energy hub could be operated more efficiently by adjusting the energy storage and the discharge capacity. We plan to re-establish the operating strategy by adding energy storage devices inside the energy hub, and add a deep learning algorithm to predict the amount of renewable energy generation and market price.


 and
and 


