Abstract
At urban signalized intersections, pedestrian twice-crossing is usually viewed as a complex human behavior, since there are many factors influencing it. Mostly, pedestrians engage in a complicated cognitive process of perception, attention and decision-making. Therefore, it is necessary to identify the major factors affecting this behavior, and develop an effective pedestrian dynamic model, in order to increase the safety and efficiency of crossing streets. This study proposes a force-based model of pedestrian dynamics by improving the classic social force model, in order to determine the influencing factors and quantify the forces acting on pedestrians crossing in two stages at signalized intersections. Through analyzing the characteristics of pedestrian twice-crossing behavior, the social force model was enhanced by providing a new component of the green signal countdown. The improved model includes four parts of the self-driving force in the ideal state, the repulsive and attractive forces generated by surrounding pedestrians, the resistance of the crosswalk boundary line, and the force produced by the green signal countdown. Each part was considered with qualitative analysis and quantitative calculation. The results show that the proposed model can achieve high accuracy in measuring the forces acting on pedestrian twice-crossing. The findings of this study have great implications for designing pedestrian facilities and optimizing pedestrian signal timings, helping thus to increase the mobility and safety of pedestrian twice-crossing.
1. Introduction
Pedestrian crossing is an important part of the urban transportation system, and it accounts for a significant number of all person trips in an urban area. Meanwhile, due to the environmental benefits of reducing air pollution and energy use, pedestrian crossing is being increasingly encouraged in sustainable urban development. With the increases in pedestrian traffic, signalized intersections with two-stage pedestrian crossings have become commonplace. Pedestrians need to cross to one refuge island and then wait for a signal to move on. Twice-crossing is commonly considered as a varied and complicated human behavior [1]. During the crossing, pedestrians need to simultaneously deal with a number of different information sources regarding vehicles, pedestrians nearby, signal timing and pedestrian facilities. This is considered as a complicated cognitive process of perception, attention and decision-making. All these issues point towards the research work required for exploring the pedestrian twice-crossing behavior, in order to develop an effective pedestrian dynamic model and increase the safety and efficiency of crossing streets.
A number of studies have been conducted on recognizing pedestrian behavior characteristics by analyzing the forces exerted on pedestrians and developing force-based pedestrian models. The social force model is widely accepted for use in determining the behavioral dynamics of pedestrians’ crossing behavior. It was first introduced in Helbing’s paper [2], in which intrinsic motivation is expressed with forces acting either on or within an individual to initiate behavior. The forces can be classified into three categories, the self-driving force, the interaction between people, and the force generated by obstacles on people. Shan et al. [3] systematically presented the application status and existing problems of the social force model in pedestrian motion modeling, and revealed that the calculation speed of the social force model reduces exponentially in a complex environment. Wang [4] used the social force model to explain the relationship between human adaptive force and pressure. Zhao et al. [5] analyzed human physiological responses to stress, and found that the repulsive force exerted on individuals increases with increased movement speed.
In addition, many scholars have also improved the social force model so as to extend its application into exploring pedestrian dynamics. Sticco et al. [6] improved the model by optimizing the two parameters of the friction coefficient and the physical force coefficient. Jiang et al. [7] enhanced the model from the environment-driven perspective, to explore people’s complex movement patterns. Li et al. [8] improved the model according to real-world evidence by modifying the relative speed, the expected speed, and the repulsive force produced by obstacles. Han et al. [9] introduced the information transfer mechanism into the social force model to simulate pedestrian behavior in emergency situations. Li et al. [10] combined the dynamic boundary model and the behavioral force model with the social force model to capture the dynamic characteristics of the decision-making process. Besides this, the social force model was also improved by measuring the interference of surrounding pedestrians [11], analyzing the interactions between cars and pedestrians [12], and verifying the expected speed [13].
The social force model is prevalent in understanding human motion behaviors during evacuation and rescue. Liu et al. [14] used the social force model to simulate crowd evacuation, and to construct the trajectory of pedestrian movement for inspection. Kang et al. [15] considered the psychological tendencies of pedestrians in order to simulate an evacuation from a shipwreck. Jiang et al. [16] used the social force model with a combination of static and dynamic navigation to explore evacuation from a large room with obstacles and two exits. Zhang et al. [17] modified the social force model based on the low-density group organization model, and applied it in real earthquake evacuation situations.
In summary, regarding the behavior characteristics of pedestrians crossing a street, the existing research gives qualitative descriptions of psychological aspects [18,19,20], and rarely conducts quantitative analyses of forces acting on pedestrians. This study will improve the social force model, enabling it to recognize the forces acting on pedestrians crossing in two stages and to analyze their behavior characteristics at signalized intersections.
2. Research Methods
The social force model has been extensively used in exploring pedestrian dynamics and crowd behavior in evacuation scenarios with restricted areas. The three essential force terms are considered in such scenes, including a term reflecting the acceleration towards the desired velocity of motion, a term expressing the distance from other pedestrians, and a term showing the distance from borders [2]. Compared to evacuation procedures, there are different factors influencing pedestrian movement behaviors at signalized crosswalks. Therefore, it is necessary to improve the original social force model to accommodate the science of road crossing at signalized intersections. Based on the findings of previous studies [21,22], it has been shown that the pedestrian countdown signal has a huge impact on the perceptive and cognitive process of pedestrians’ walking behavior at crossroads. Hence, the countdown signal, as a key component, will be introduced into the social force model to improve the measurement of the forces acting upon pedestrian crossing. The proposed model chiefly consists of four terms, which are the three terms of the original model and the new one of the countdown signal.
This section is divided into three parts. The classical social force model is briefly introduced in the first part, and the behavioral characteristics of pedestrian twice-crossing are presented in the second part. Following this, there is a detailed description of the improved social force model for pedestrian two-stage crossing.
2.1. The Classical Social Force Model
The classical social force model uses forces to describe the specific intrinsic motivation leading to pedestrian’s actions and behavior. Social force consists of three components: the self-driving force of pedestrian α in the ideal state , the interaction between pedestrians, and the resistance produced by obstacle B in pedestrians [23,24]. The model is defined by:
where and stand for the attraction and repulsion generated by surrounding pedestrians. is the actual speed of the pedestrian α, and refers to his/her desired direction of motion. denotes the distance between pedestrian α and pedestrian β. denotes the range of force acting on pedestrian α.
2.1.1. Pedestrian Self-Driving Force
If pedestrian α is not disturbed by the surrounding environment, he/she will walk at a certain desired velocity . In real life, he/she walks with the actual speed due to distractions from different directions and to different degrees. The direction and size of the actual speed are different from those of the expected speed. The self-drive force is given by:
where is the relaxation time from actual speed to desired speed.
2.1.2. Repulsive Force of Boundary
When pedestrians walk, they are affected by obstacles such as buildings, walls and streets, which restrict pedestrian movement. When pedestrians get close to obstacles, they change their trajectories to avoid the obstacles. The closer pedestrians get to obstacles, the greater the resistance within them. The resistance decreases gradually with movement away from obstacles, which can be described by:
where denotes the distance of pedestrian α from barrier B.
2.1.3. Attraction and Repulsion by Other Pedestrians
Pedestrian movements are also affected by nearby pedestrians. The attractive and repulsive effects on pedestrian’s actions are given by Equations (4) and (5), respectively. Pedestrians are often attracted by other pedestrians moving in the same direction, and repulsed by others moving in the opposite direction.
where denotes the speed of pedestrian α relative to pedestrian β. is the distance between pedestrians α and β. is the distance between pedestrians α and i. Next, the classic social force model will be improved based on the behavioral characteristics of pedestrian twice-crossing.
2.2. Behavioral Features of Pedestrian Twice-Crossing
Pedestrian two-stage crossings are generally designed at large and busy signalized intersections with multiple lanes, and allow people to navigate a mid-block crossing in two stages and across each lane of approaching traffic. This design permits the installation of pedestrian traffic signals in a non-aligned pair, that is, one side green and another red. Figure 1 and Figure 2 show examples of pedestrian twice-crossing layout design, and pedestrian signal timings in two directions, respectively. It can be seen that the signal timing in direction B starts first, in one cycle, so pedestrians in direction B perform a partial crossing and then wait in the middle. Then, the first steps are the same for side A navigating the first stage and for side B traversing the second stage. Given the bidirectional interactions with high pedestrian density (appearing in the left part of the crosswalk; see Figure 1), the green timing differences result in crossing behavioral differences between the two sides, such as trajectory, walking speed, grouping, and waiting location. This study concentrates on identifying the behavioral differences between pedestrians on the two sides.
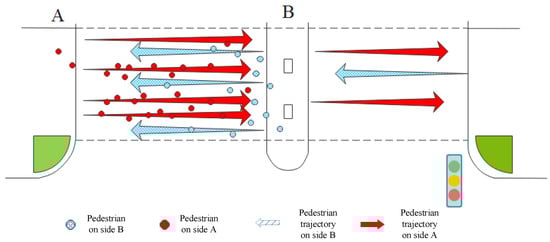
Figure 1.
Layout design of pedestrian twice-crossing.
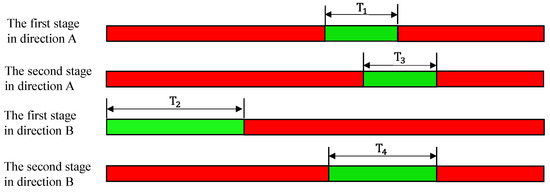
Figure 2.
Pedestrian signal timings in two directions.
In such a scenario, both sides pursue the same walking distance and walking time. However, different crossing strategies present differences in setting their priorities (shorter distance with more time, or less time with longer distance) on either side. It can be noticed that side A has the “goal of taking less time” priority, in order to cross the street faster, while side B gives priority to “the objective of crossing a shorter distance” in order to make crossing more comfortable (for further information, please see Guo et al., 2018).
Based on our previous research [25,26], it was found that pedestrians on the two sides get involved in a competition for walking space when crossing the street. Although the green signals for the two sides start simultaneously in the interaction stage, side A always chooses to move first. We assume that both sides know the walking strategies of each other. Therefore, bidirectional pedestrian walking in such a scenario can be viewed as a dynamic game with complete information. In this game, the two parties choose actions sequentially, and the details are as follows.
- Side A goes first, and chooses to walk along a straight path (referred to as “Unchanged”) or walk along a curved path (referred to as “Changed”). It should be noted that straight walking does not mean crossing in a perfectly straight line, but along an approximation;
- Subsequently, side B chooses straight walking or curved walking.
A game tree was constructed to demonstrate the walking strategies of sides A and B, as shown in Figure 3. It can be seen that side A has one information set with two actions. The strategic set of side A is SA = (changed, unchanged). Side B has two information sets with two actions, so it has four pure strategies. Its strategic set is SB = {(A_changed, B_changed), (A_changed, B_unchanged), (A_unchanged, B_changed), (A_unchanged, B_unchanged)}. Each side has an expected payoff, and the optimal strategy for each side can be found using Nash’s equilibrium.
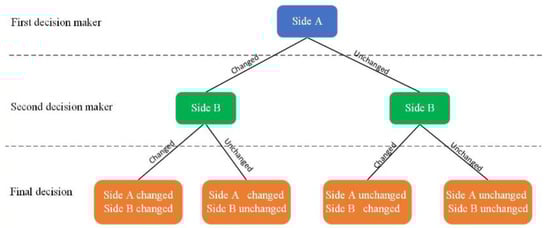
Figure 3.
Game tree for the walking strategies on sides A and B.
2.3. Improved Social Force Model for Pedestrical Twice-Crossing
By analyzing the behavioral characteristics of pedestrian twice-crossing, it was found that the green signal countdown has a significant effect on attracting pedestrians to walk. To model pedestrian twice-crossing more effectively, the original social force model can be improved by including the effect of the green signal countdown, and modifying the effect generated by the surrounding pedestrians.
The improved social force model aims at describing pedestrian twice-crossing behavior via the analysis of forces exerted on pedestrian, including four parts: (a) the self-driving force of pedestrian i; (b) the repulsive and attractive forces generated by the surrounding pedestrians j; (c) the repulsive force of the longitudinal boundary lines of the crosswalk; (d) the force generated by the green signal countdown. The improved model can be written as:
where is the total social force acting on pedestrian i. m denotes pedestrian mass, and denotes the total acceleration of pedestrian i.
2.3.1. The Self-Driving Force
The self-driving force is produced by attraction to a target pedestrian during walking. He/she normally walks along a curved path, which usually has the shape of a polygon with edges (see Figure 4). If is the next edge of this polygon being arrived at, one’s desired direction of motion will be:
where denotes the actual position of pedestrian i at time t. In Equation (8), is actual speed, and is desired speed. expresses the direction vector of the expected velocity at time t in the calculation. The direction coefficient a is added to convert the speed in different directions, as shown in the following equation.
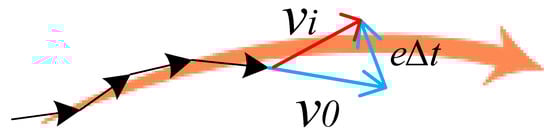
Figure 4.
Schematic diagram of expected speed and actual speed.
2.3.2. Attraction and Repulsion Generated by Other Pedestrians
The motion of a pedestrian is affected by other pedestrians around. He/she normally keeps a certain distance from others, which depends on their moving direction and speed. In the bidirectional interaction situation, pedestrians’ streamlines tend to closely follow one another. In such a scenario, a pedestrian attempts to closely follow those ahead who are moving in the same direction, which produces attractive forces on the target pedestrian. A pedestrian attempts to maintain a certain distance from others moving in the opposite direction, which introduces repulsive forces acting upon them. In Equation (9), for the effects of other pedestrians, a sign function is provided to distinguish the attraction and repulsion. In addition, considering the effect of walking speed, the attraction/repulsion is described with a speed coefficient C, as shown in Equation (9). The sign function is given by Equation (10), in which x means the location of a pedestrian relative to others. For example, if x is less than zero, there is a repulsive force exerted on the pedestrian by another moving in the opposite direction. The interactive/repulsive forces generated by other pedestrians are shown in Figure 5.
where denotes the strength coefficient of interactive force. denotes the range of attraction to the traffic signals. is the radius of the pedestrian’s field of view.
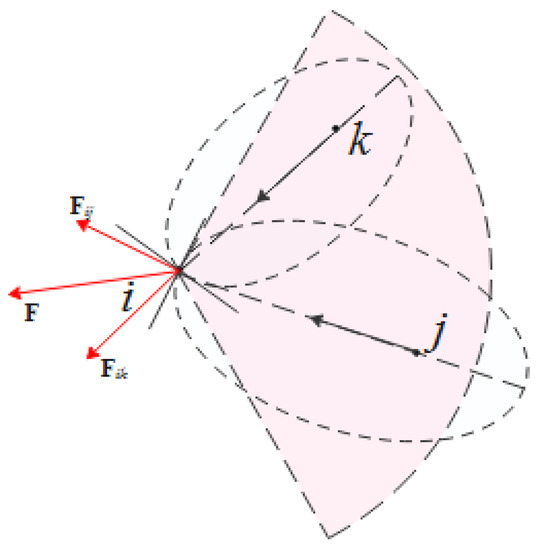
Figure 5.
Schematic diagram of the interactive force produced by other pedestrians.
The attractive/repulsive potential field takes the form of an ellipse, and the potential force decreases with increasing distance. denotes the semi-minor axis of the ellipse, and is given by:
where and are the actual walking direction of pedestrian i and pedestrian j. expresses the stride width of pedestrian j.
2.3.3. Repulsive Force Exerted by Longitudinal Boundary of Crosswalk
Pedestrians try to keep a certain distance from the longitudinal boundary lines of the crosswalk while walking. This repulsive effect is modeled by Equation (12) with a monotonically decreasing potential Uw.
where denotes the radius of the boundary force, and R is the radius of the force acting on the pedestrian.
2.3.4. Influence of Green Signal Countdown
After analyzing the behavioral characteristics of pedestrian twice-crossing, the factor of the green countdown is here developed. Due to the differences in signal timing between the two approaches, people on the two sides present obvious differences in processing the cognitive information of the signal countdown . The effect of signal countdown on pedestrian behavior mainly takes the form of acceleration. Equation (13), showing the effect of the green signal countdown, is designed using a linear function of speed difference and a time function , which is given by
where denotes the radius of the force field of pedestrian i, and denotes the radius of the green countdown force. The weight coefficients a and b refer to the preference ratio between the walking objectives (time or distance) for sides A and B. refers to the direction vector of the light countdown’s field.
where stands for the speed difference between pedestrians i and j, and denotes the time difference between pedestrians i and j. u and d stand for the velocity and time coefficients, respectively.
In Equation (13), the weight coefficients a and b can be determined according to game theory. As mentioned above, pedestrians on the two sides become involved in a space competition when crossing the street in a bidirectional interaction. The two parties move in sequence, and both sides know the walking strategies of each other. Therefore, bidirectional walking in this scenario can be modeled as a dynamic game with complete information. The two directions are each pursuing a combined objective of walking distance and walking time.
The payoff matrix for the walking distance was created according to the average walking distance of each scenario (four scenarios in total) as derived from the real-world data shown in Table 1. The walking distance of five points was set to zero. The payoff is negative for distances over five points, and positive for those less than five points. For example, when the two sides choose the “changed” action, the walking distance is six points for side A and five points for side B. So, side A loses one point, and side B gains zero points.

Table 1.
The payoff matrix for the walking distances of the two sides.
The two sides receive payoffs of walking time according to the matrix shown in Table 2. This matrix was developed based on the actual average walking time of each scenario. The walking time of six points was set to zero. The payoff is negative for time periods longer than six points, and positive for ones shorter than six points. For example, when side A chooses the “unchanged” action and side B chooses the “changed” action, the walking time is four and a half points for side A and six points for side B. So, side A gains one and a half points, and side B gains zero points.
Table 2.
The payoff matrix for the walking times of the two sides.
Pedestrian twice-crossing involves complicated strategic reasoning processes. Pedestrians on the two sides choose their walking strategies by comprehensively considering the gains of time and distance. The two sides show differences in synthesizing the two gains. In this competitive process, the actual overall gains of the two sides can be achieved by finding a Nash equilibrium point, that is, the point at which their gains are in equilibrium. The synthesized gains for sides A () and B () are shown in Equations (2)–(16). Table 3 presents the synthesized profits in different situations. For example, PA1 indicates the synthesized gains of side A when the two sides select the “changed” action.
Table 3.
The synthesized gains in different scenarios.
In short, the original model was improved essentially by distingushing the attraction and repulsion produced by other pedestrians, and by including the effect of the green signal countdown. The self-driving and boundary forces were kept unchanged. The improved social force model consists of four components, which are the self-driving force, the repulsion and attraction generated by the surrounding pedestrians, the force given by the boundary lines of the crosswalk, and the force produced by the green signal countdown. Figure 6 shows an example of the social force model for pedestrian twice-crossing, presenting the resultant force F and the four components.
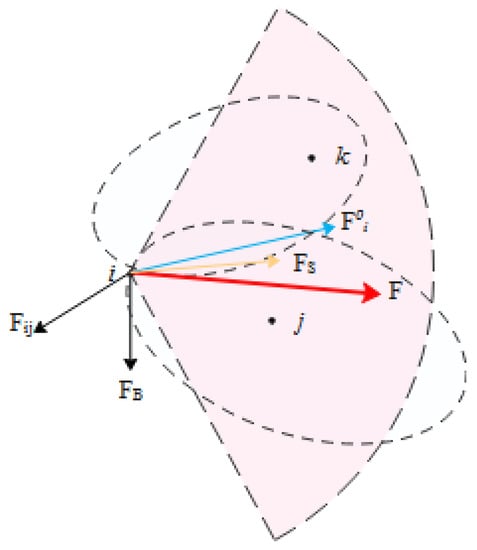
Figure 6.
An example of social force model for pedestrian twice-crossing.
3. Results and Discussion
3.1. Data Collection and Processing
Field data were collected on pedestrian twice-crossing in the east–west direction at the signalized intersection of Nanjing Road and Gong Qingtuan West Road in Zibo City. The overall length of this crossing is 32 m, including two blocks and a refuge island. The layout of the selected pedestrian crossing is shown in Figure 7. Figure 8 illustrates the signal timing and phase sequence for pedestrian twice-crossing at the selected intersection. In this study, the various forces acting upon pedestrians have been examined, focusing on the congested section in block AB.
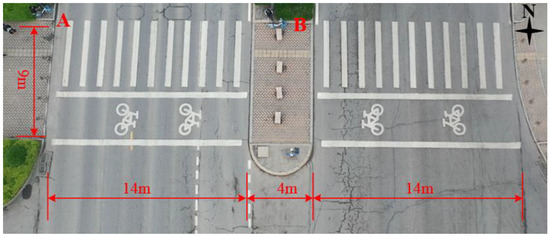
Figure 7.
Layout of the selected pedestrian twice-crossing.
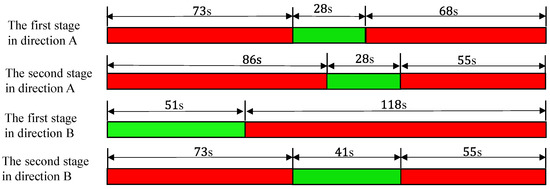
Figure 8.
Signal timing and phase sequence for the selected pedestrian twice-crossing.
An unmanned aircraft was used to collect and record pedestrian data during weekday peak periods, when there was a high volume of pedestrians crossing. Finally, a total of 279 signal cycles was obtained, including 4258 pedestrians on side A and 3561 pedestrians on side B. Pedestrian motion features were measured using kinovea software based on the video files, mainly by extracting pedestrians’ speed and trajectory. The selected signalized intersection is situated close to a gate of the university campus, so pedestrians crossing this intersection were mostly young and middle-aged adults.
According to the bidirectional pedestrian flow characteristics, block AB was divided into five sections using the four lines of S1, S2, S3 and S4, shown in Figure 9.
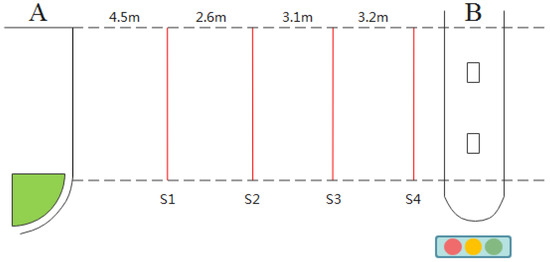
Figure 9.
Schematic diagram of the cross location.
It can be seen that the locations of the four lines are approximate averages (not exact values), determined based on the measurements of regular cases. Pedestrians’ behavioral characteristics in the five sections can be described as follows:
- S1 is located 4.5 m from the stopline in direction A (see in Figure 10a), which is the line at which the pedestrians in the first row of direction A arrive when pedestrians in the first row of direction B have just passed the boundary of the refuge island. At this moment, pedestrian behavior is affected by the self-driving force and the forces generated by other pedestrians moving in the same direction;
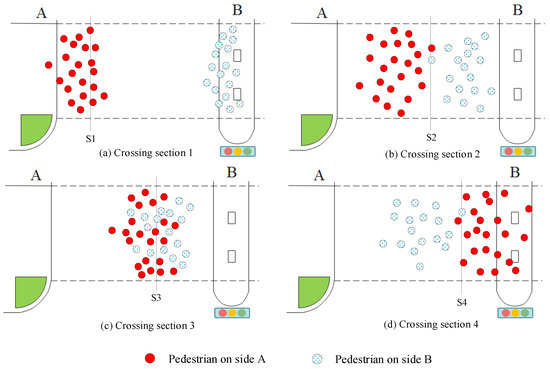 Figure 10. Pedestrian interactive behavior of both sides in the four crossing sections.
 - S2 is located 7.1 m from the stopline in direction A, which is the line at which pedestrians on both sides start their walking interaction, as shown in Figure 10b. From this moment, pedestrians begin to decrease their velocities and increase their changes in direction, mainly due to the effects of other pedestrians coming from the opposite direction;
- S3 is located 10.2 m from the stopline in direction A, which is the line at which pedestrians from both sides are involved in the longest interaction, as shown in Figure 10c. From this moment, both sides begin to move away from the mutual interaction, and they start increasing their crossing speeds with the increased effect of the green signal countdown;
- S4 is located 13.5 m from the stopline in direction A, which is the line at which both sides entirely separate, as shown in Figure 10d. Pedestrians on side A accelerate quickly, without the repulsion generated by others moving in the opposite direction.
The speed distributions of the four cross-sections are illustrated in Figure 11. It can be observed that the distribution of the cross-sectional speed sharply peaks, and displays thick tails, which indicates that the pedestrian group behaviors are largely consistent in cycles. Therefore, it is reasonable to use the average speed for force measurement.
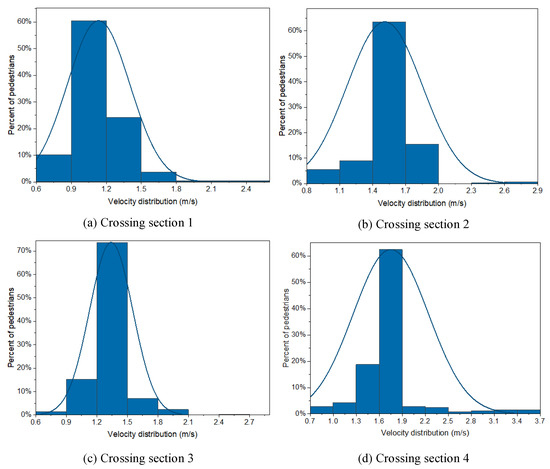
Figure 11.
The crossing speed distribution of the four cross-sections.
In crowded interactive situations, pedestrians continually change their walking directions. To simplify the analysis and calculation, the walking directions were grouped into six directions, shown in Figure 12. Starting from the horizontal line (x-axis) on the right side, one direction was assigned every 45°, moving in the anticlockwise direction. The directions in the north and south (y-axis) were removed due to their rare appearance. In brief, all the directions were distributed based on the rule of proximity. For example, all the directions in Segment b were allocated to Direction 2. The directions of 21.3° and 29.8° in Section a were assigned to Direction 1 and Direction 2, respectively. Table 4 shows a few examples of sectional velocity data for pedestrians on side A.
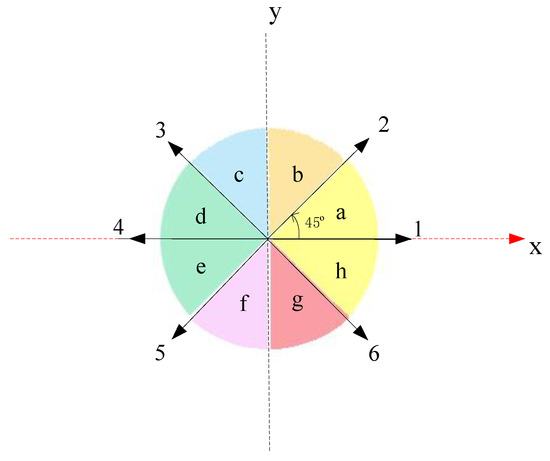
Figure 12.
Diagram of speed direction distribution.
Table 4.
Examples of sectional velocity for pedestrians on side A.
3.2. Improved Model Results
3.2.1. Self-Driving Force
According to the previous studies and our survey, the desired speed for pedestrians on side A was chosen as = 2 m/s. The self-driving force for each section was determined based on the difference between the desired speed and the average actual speed. The trend in self-driving force for pedestrians on side A along the walking direction is shown in Figure 13. The self-driving force is inversely proportional to pedestrians’ actual walking speed, and therefore the faster the actual speed, the smaller the self-driving force. The force acting on the walking direction is taken as positive. The self-driving force ranges from approximately 1.16N to 1.30N, and tends to decrease and then increase in the walking direction. It can be noticed that all the self-driving forces are positive, which means that the actual speeds are always less than the desired speed. Pedestrians are prone to reach their desired speed, but they have little chance to make it. It can also be seen that the minimum force tends to appear at the moment at the beginning of the interaction process between the two sides. This shows that the fastest speed occurs when the interactive activities of the two sides have just begun. Thereafter, the interactive activities begin to reduce the pedestrian walking speeds on side A.
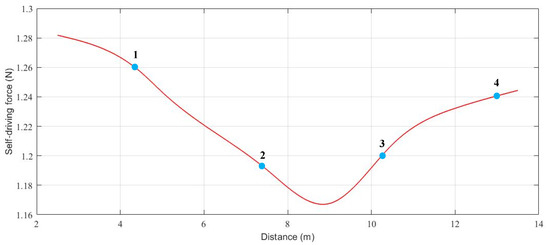
Figure 13.
Trend line of pedestrians’ self-driving force on side A.
3.2.2. Forces Generated by Surrounding Pedestrians
The repulsive effects (negative) are mainly created by pedestrians moving in the opposite direction, and the attractive effects (positive) are mostly created by pedestrians moving in the same direction. Figure 14 shows the trend chart of the resultant forces (combination of repulsion and attraction) generated by the surrounding pedestrians. This force ranges roughly from −1.6 N to 1.0 N, and is inclined to decrease and then increase along the walking direction. It can be observed that the resultant force is negative in the middle section and positive on the two sides. This indicates that during the interactive process, the repulsive forces are typically greater than the attractive forces. Moreover, repulsion begins even though there is still a certain distance between the two sides. The greatest resultant force arises in the most congested interactive condition between the two sides.
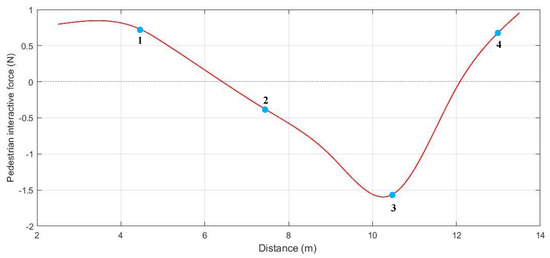
Figure 14.
Trend chart of the resultant force generated by other pedestrians on Side A.
3.2.3. Boundary Force
During the crossing, the boundary force is pretty small and fluctuates slightly, so it was regarded as constant for reasons of simplicity. The direction of the boundary force is perpendicular to the longitude boundary of the crosswalk. The boundary force was set as 0.15 N when acting on pedestrians close to the boundary lines, and as 0.05 N when acting on others. Figure 15 shows the trend chart of the boundary force on Side A.
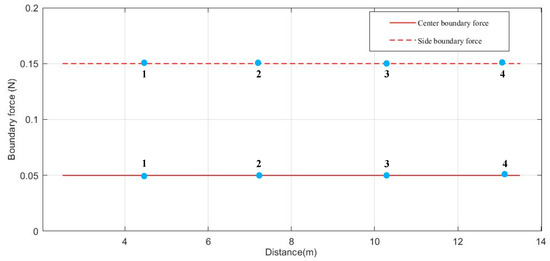
Figure 15.
Trend line of boundary force on side A.
3.2.4. Force Produced by Green Signal Countdown
The force generated by the pedestrian green countdown ranges roughly from 0 N to 1.5 N, and increases along the walking direction (shown in Figure 16). It can be observed that all the forces are positive. Generally, the force magnitude of the green light countdown is inversely proportional to the remaining time of the green signal countdown. This relationship does not seem to be linear. The growth rate of the force is lower in the segment between cross-sections 2 and 3 than in other segments. This might be due to the fact that pedestrians give more attention to their surroundings to avoid collisions, and pay less attention to the signal countdown in congested interactive conditions.
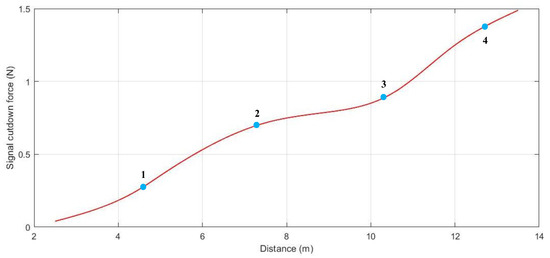
Figure 16.
Trend graph of the force produced by the green signal countdown on side A.
3.3. Model Validation
Based on the actual data, the resultant forces acting on pedestrians were measured using the Principle of Work and Energy. This method has been widely accepted for use to determine the approximate values of the actual resultant forces acting on pedestrians. Figure 17 demonstrates the predicated resultant forces using the principle of Work and Energy, the original social force model, and the developed social force model. The results show that compared to the original model, the developed model can produce closer results to the actual values.
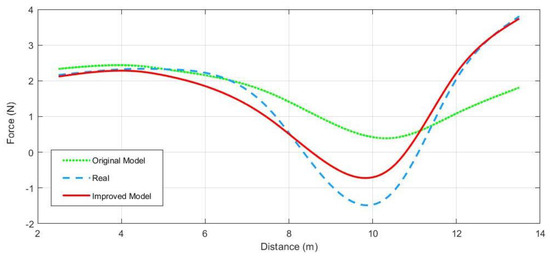
Figure 17.
Resultant social forces predicted by the original model, the improved model and the actual data.
It was found that the original model predicts forces as too large in the congested interactive stage, and forces as too small in the dissipation stage. As mentioned above, the original social force model was improved by providing the new term of green signal countdown and adjusting the interactive effects produced by the surroundings. As a result, the developed model can perform better in predicting the resultant forces in the congested interactive stage and in the dissipation stage. One huge advantage of the developed model is its ability to predict the negative forces acting on pedestrians during the crossing.
In spite of the improvements in the crowded interaction, the proposed model still needs to improve its prediction accuracy. This failing might be attributable to some factors that have not been extensively explored in complicated interactive situations. This leads to too much attraction or too little repulsion.
4. Conclusions
This study improved the classic social force model to determine the influencing factors and measure the various forces acting upon pedestrians crossing the street. On the basis of the behavioral characteristics of pedestrian two-stage crossing, a new term of green signal countdown was included in the original social force model. Primarily, the developed model can achieve high predictive accuracy for forces acting on pedestrians during the two-stage crossing. The main findings are summarized as follows:
- The magnitudes and directions of the resultant forces and their components acting on pedestrians were determined. For example, the forces generated by the pedestrian green light countdown are consistently positive. The strength of force ranges roughly from 0 N to 1.5 N, and increases along the walking direction;
- The tendencies of the resultant forces and their components acting upon pedestrians were explored. For example, the self-driving force tends to decrease and then increase in the walking direction. The lowest value normally appears in the moment at the start of the interaction process of the two sides;
- Compared to the classical model, the developed model can perform better in predicting the resultant forces in the congested interactive stage and in the dissipation stage. One obvious improvement is its ability to predict the negative forces acting on pedestrians during two-stage crossing.
This study can help traffic researchers and engineers to gain a deep understanding of the behavioral characteristics of pedestrian twice-crossing. The findings will contribute to optimizing pedestrian signal timing and upgrading pedestrian facilities at signalized intersections, helping to improve mobility and safety for pedestrians, especially in busy urban areas. This proposed model could provide more accurate predictions for areas with high pedestrian traffic than areas with low traffic. Further studies are required to explore more factors affecting pedestrian crossing behavior, and make more accurate predictions regarding the attraction and repulsion produced by the surroundings acting on pedestrians, especially for low pedestrian volumes. Future research should also include further validations of the improved model in multiple locations.
Author Contributions
Conceptualization, Y.G. and F.W.; data curation, S.M.; formal analysis, Y.G. and S.M.; funding acquisition, Y.G. and F.W.; investigation, S.M. and F.S.; methodology, Y.G., S.M. and F.W.; project administration, Y.G. and F.W.; resources, F.W. and S.M.; supervision, Y.G.; validation, L.L., F.S. and J.W.; visualization, L.L. and J.W.; writing—original draft, Y.G. and S.M.; writing—review and editing, Y.G., S.M. and F.W. All authors have read and agreed to the published version of the manuscript.
Funding
This research was funded by the National Natural Science Foundation of China (Grant No. 71901134), the National Science Foundation for Distinguished Young Scholars (Grant No. 51925801), and the Natural Science Foundation of Shandong (Grant No. ZR2018BF024).
Institutional Review Board Statement
Ethical review and approval were waived for this study, because the data collected was not linked to the individual participant, based on the field video of pedestrian crossing.
Informed Consent Statement
Informed consent was waived, because the data collected was not linked to the individual participant, based on the field video of pedestrian crossing.
Data Availability Statement
The data used to support the findings of this study are available from the corresponding author upon request.
Acknowledgments
We thank the Center for Accident Research in Zibo (CARZ) for assistance in collecting field data.
Conflicts of Interest
The authors declare that there is no conflict of interest regarding the publication of this paper.
References
- Marić, B.; Lipovac, K.; Nešić, M.; Đerić, M. The Influence of a Countdown Display on Pedestrian Behavior at a Signalized Pedestrian Crossing Equipped with a Pedestrian Refuge Island. Transp. Res. Procedia 2021, 55, 1720–1728. [Google Scholar] [CrossRef]
- Helbing, D.; Molnar, P. Social Force Model for Pedestrian Dynamics. Phys. Rev. E 1995, 51, 4282. [Google Scholar]
- Shan, Q.; Zhang, X.; Zhang, C. A Review of Application of Social Force Model for Pedestrian Dynamics. Urban Transp. China 2011, 6, 71–77. [Google Scholar]
- Wang, P. Understanding Social-Force Model in Psychological Principles of Collective Behavior. arXiv 2016, arXiv:1605.05146. [Google Scholar]
- Zhao, Y.; Lu, T.; Su, W.; Wu, P.; Fu, L.; Li, M. Quantitative measurement of social repulsive force in pedestrian movements based on physiological responses. Transp. Res. Part B Methodol. 2019, 130, 1–20. [Google Scholar] [CrossRef]
- Sticco, I.; Frank, G.; Dorso, C. Social Force Model parameter testing and optimization using a high stress real-life situation. Phys. A Stat. Mech. Appl. 2021, 561, 125299. [Google Scholar] [CrossRef]
- Jiang, J.; Lu, D.; Jiang, Y.; Lee, Z.; Zhang, Y.; Yu, J. Understanding environment-influenced swarm behavior from a social force perspective. Phys. A Stat. Mech. Appl. 2018, 492, 724–736. [Google Scholar] [CrossRef]
- Li, J.; Liu, A. Study of Pedestrian Crossing Road Behavior Based on Modified Social Force Model. J. Transp. Eng. Inf. 2017, 15, 6–13. [Google Scholar]
- Han, Y.; Liu, H. Modified social force model based on information transmission toward crowd evacuation simulation. Phys. A Stat. Mech. Appl. 2017, 469, 499–509. [Google Scholar] [CrossRef]
- Li, Y.; Ni, Y.; Sun, J. A modified social force model for high-density through bicycle flow at mixed-traffic intersections. Simul. Model. Pract. Theory 2021, 108, 102265. [Google Scholar] [CrossRef]
- Zeng, W.; Nakamura, H.; Chen, P. A Modified Social Force Model for Pedestrian Behavior Simulation at Signalized Crosswalks. Procedia Soc. Behav. Sci. 2014, 138, 521–530. [Google Scholar] [CrossRef] [Green Version]
- Dias, C.; Iryo-Asano, M.; Nishiuchi, H.; Todoroki, T. Calibrating a Social Force based Model for Simulating Personal Mobility Vehicles and Pedestrian Mixed Traffic. Simul. Model. Pract. Theory 2018, 87, 395–411. [Google Scholar] [CrossRef]
- Ma, L.; Chen, B.; Wang, X.; Zhu, Z. The analysis on the desired speed in social force model using a data driven approach. Phys. A Stat. Mech. Appl. 2019, 525, 894–911. [Google Scholar] [CrossRef]
- Liu, B.; Liu, H.; Zhang, H.; Qin, X. A social force evacuation model driven by video data. Simul. Model. Pract. Theory 2018, 84, 190–203. [Google Scholar] [CrossRef]
- Kang, Z.; Zhang, L.; Li, K. An improved social force model for pedestrian dynamics in shipwrecks. Appl. Math. Comput. 2019, 348, 355–362. [Google Scholar] [CrossRef]
- Jiang, Y.; Chen, B.; Li, X.; Ding, Z. Dynamic navigation field in the social force model for pedestrian evacuation. Appl. Math. Model. 2020, 80, 815–826. [Google Scholar] [CrossRef]
- Zhang, H.; Liu, H.; Qin, X.; Liu, B. Modified two-layer social force model for emergency earthquake evacuation. Phys. A Stat. Mech. Appl. 2018, 492, 1107–1119. [Google Scholar] [CrossRef]
- Zhang, W.; Wang, K.; Wang, L.; Feng, Z.; Du, Y. Exploring factors affecting pedestrians’red-light running behaviors at intersections in China. Accid. Anal. Prev. 2016, 96, 71–78. [Google Scholar] [CrossRef]
- Avinash, C.; Jiten, S.; Arkatkar, S.; Gaurang, J.; Manoranjan, P. Investigating effect of surrounding factors on human behaviour at un-controlled mid-block crosswalks in indian cities. Saf. Sci. 2018, 119, 174–187. [Google Scholar] [CrossRef]
- Zhu, D.; Sze, N.; Feng, Z.; Yang, Z. A two-stage safety evaluation model for the red light running behaviour of pedestrians using the game theory. Saf. Sci. 2022, 147, 105600. [Google Scholar] [CrossRef]
- Long, X.; Zhou, M.; Zhao, H.; Song, Y.N. Pedestrian crossing decision during flashing green-countdown signal for urban signalized intersection. J. Transp. Saf. Secur. 2021, 1–21. [Google Scholar] [CrossRef]
- Wu, C.; Ma, S.; Zhuang, X. Cognitive Psychological Process and Model of Pedestrian’s Road Crossing Behavior. Adv. Psychol. Sci. 2013, 21, 1141–1149. [Google Scholar] [CrossRef]
- Helbing, D. Traffic and related self-driven many-particle systems. Rev. Mod. Phys. 2001, 73, 1067. [Google Scholar] [CrossRef] [Green Version]
- Helbing, D.; Buzna, L.; Johansson, A.; Werner, T. Self-organized pedestrian crowd dynamics: Experiments, simulations, and design solutions. Transp. Sci. 2005, 39, 1–24. [Google Scholar] [CrossRef] [Green Version]
- Guo, Y.; Wang, X.; Meng, X.; Liu, Y.; Wang, J. Analysis of Route Choice for Pedestrian Two-Stage Crossing at a Signalized Intersection. Civ. Eng. J. 2018, 4, 2813–2820. [Google Scholar] [CrossRef]
- Guo, Y.; Wang, X.; Meng, X.; Wang, J.; Liu, Y. Pedestrians’ Speed Analysis for Two-Stage Crossing at a Signalized Intersection. Civ. Eng. J. 2019, 5, 505–514. [Google Scholar] [CrossRef] [Green Version]
Publisher’s Note: MDPI stays neutral with regard to jurisdictional claims in published maps and institutional affiliations. |
© 2022 by the authors. Licensee MDPI, Basel, Switzerland. This article is an open access article distributed under the terms and conditions of the Creative Commons Attribution (CC BY) license (https://creativecommons.org/licenses/by/4.0/).