Article

Do University Students’ Security Perceptions Influence Their Walking Preferences and Their Walking Activity? A Case Study of Granada (Spain)

by
Carmen Lizárraga
1,*,
Cathaysa Martín-Blanco
2,
Isabel Castillo-Pérez
1 and
Jorge Chica-Olmo
3
1
Department of Applied Economics, Campus Cartuja s/n, University of Granada, 18071 Granada, Spain
2
Department of Civil Engineering, Campus Fuentenueva s/n, University of Granada, 18071 Granada, Spain
3
Department of Quantitative Methods for Economics and Business, Campus Cartuja s/n, University of Granada, 18071 Granada, Spain
*
Author to whom correspondence should be addressed.
Sustainability 2022, 14(3), 1880; https://doi.org/10.3390/su14031880
Submission received: 11 January 2022 / Revised: 28 January 2022 / Accepted: 2 February 2022 / Published: 7 February 2022
(This article belongs to the Collection Transport Inequalities, Transport Poverty and Sustainability)

Abstract

:
A sustainable city must be a safe place for its inhabitants when walking, with the absence of fear of crime being one of its main attributes. Although perceived insecurity is one of the main deterrents of walking activity, this relationship requires some clarification in environments which are walkable and safe, with low crime rates. This article contributes to the evidence for the influence of perceived security on walking activity and, as a novel aspect, also analyzes the effects of perceived security on walking as the preferred travel mode. In order to study this relationship, we use a method that combines non-linear principal component analysis (NLPCA) and a logit model (LM). The data are taken from a survey of university students carried out in the city of Granada. Results show that gender and perceived security have a greater effect on the choice of walking as the preferred travel mode, while location factors have significantly more weight in the explanation of the choice of walking as the most usual travel mode. These findings may be extended to other urban areas and can be of use for the implementation of urban policies aimed at designing the built environment to develop more sustainable cities.

1. Introduction

Current urban planning and mobility policies aim to move towards more sustainable forms in the mobility model, promoting walking and other active transport modes in the modal distribution of mobility in urban and metropolitan environments [1]. In this context, in compact cities, walking is the most sustainable form of travel since it generates no polluting emissions and it is assumed that the substitution of motorized trips with active modes of transport reduces energy use and carbon dioxide (CO2) emissions [2]. Walkability describes a concept that encompasses the dimensions that make the built environment favorable for walking. Although there is no consensus on how to measure walkability, safety and security are elements that positively contribute to walkability and walking activity [1,3,4,5,6]. On the one hand, safety refers to pedestrians being protected from motorized traffic. In this sense, it has been found that perceptions of safety for walking and objective built environment variables (e.g., stores within walking distance) were positively related to high levels of walking activity [7,8,9,10]. On the other hand, security refers to pedestrians being protected from crime and urban violence [11,12]. In the case of personal security, it can be analyzed from an objective dimension (crime rates) and a subjective dimension. This paper focuses on the subjective dimension of security, which refers to the perceived risk to personal security and fear of crime, which can be experienced regardless of the real crime rate in the city, and can depend on personal characteristics, such as gender and age [5,9,12,13,14]. Specifically, there are certain elements of the built environment that influence the production of insecurity in the urban space.
It has been established that a sustainable city must be a safe place for its inhabitants when walking, with the absence of fear of crime being one of its main attributes [15]. Generally, greater perceived insecurity implies a lower probability of walking and, to a greater extent, for women [16]. Understanding how the physical environmental attributes of a neighborhood are associated with increased walking has practical and policy implications [17]. Regarding sustainability, the relationship between security and walking is strongly related to its social dimension, since physical or environmental improvements will be of no value if people are afraid to go outside or feel insecure walking. In this sense, studying perceived insecurity seems to be more important than considering actual urban insecurity and its aspects, especially in cities with low crime rates [18,19]. A United Nations Report focusing on Safe Cities and Safe Public Spaces establishes that when women and girls are not safe walking on city streets, it has a massive impact on their lives [20]. With regard to the environmental dimension of sustainability, higher levels of perceived security increase walking preferences and walking activity, this being the most sustainable form of travel [21,22]. With respect to the economic dimension, the costs of using private vehicles and the external costs associated with the use of motorized modes are reduced when walking is increased.
Studies have shown that perceived insecurity discourages people from walking [4,6,23,24,25,26,27], affects women more than men [18,28,29,30,31] and that determined elements of the built environment contribute to perceived insecurity among pedestrians [28]. However, there is a dearth of research about how security affects their preferences for walking. The present study aims to address this gap in the literature, analyzing not only the relationship between security and walking as the chosen mode of transport; but also the relationship between security and walking as the preferred mode of transport. Another research gap refers to the estimated effects of the built environment on perceived security that are likely to have been misrepresented in previous studies [3]. In this sense, this paper fills the gap in this literature analyzing how certain elements of the built environment influence the choice of walking as the preferred mode of travel, or as the transport mode most usually chosen.
This study concentrates on the university population and focuses on the city of Granada, a walkable and safe environment with low crime rates. According to previous studies, university students present specific characteristics, given that they prefer and choose to live close to the campus where they study, which allows them to use non-motorized modes of transport to a greater extent than the rest of the population [32]. They also prefer to choose modes of transport that require travel times as short as possible to avoid being tired on arrival at the university center [33]. The greatest perceived insecurity among university women has been identified as a global phenomenon [16] and influences their mobility decisions [34]. The work has been produced from the data obtained in a survey carried out with university students in Granada (Spain), a walkable and safe city.
The research question of this paper, “Do university students’ security perceptions influence their walking preferences and their walking activity?”, is supported by four hypotheses related to insecurity, deterrents to walking, gender, and location, which were established considering the most relevant academic contributions:
Hypothesis 1 (H1 Insecurity).
University students’ perceived insecurity influences the probability of walking and it has a different effect on the chances of choosing walking as a preferred mode or as the usual mode.
Hypothesis 2 (H2 Deterrents to walking).
The barriers of the built environment negatively affect the chances of choosing walking as the preferred mode of travel.
Hypothesis 3 (H3 Gender).
There is a lower preference for walking on the part of women.
Hypothesis 4 (H4 Location).
The chances that a student who lives in the center walks regularly and prefers walking are higher than someone who lives in the periphery.
The paper is divided into four parts. The first details a bibliographic review on the relationships between built environment, perceived security and gender. The second describes the methodology used; the third provides the results; and lastly, discussion and conclusions are shown.

2. Theoretical Review

Walkability is a multi-dimensional concept that can be broadly defined as the extent to which the built environment, considered as the human-made space in which people live, work and play on a daily basis, supports all activities, services and infrastructures found in urban spaces, and is pedestrian friendly and enables walking [1,35,36]. Hence, a good quality of built environment is essential to improve walkability [4,37,38,39], which is often evaluated by considering a varying number of built environment attributes. Forsyth and Southworth [40] stated that a walkable environment should include a short distance, free of major barriers, a safe environment in terms of traffic and crime, adequate pedestrian infrastructure, and a walking area with attractive landscaping and architecture design. Although there is no consensus on how to analyze the several built environment attributes related to walkability, research has shown that the dimensions of the built environment beneficial for walking trips are the 5Ds density; diversity; design; destination accessibility, and distance to public transport [41]. However, 3Ds (design, diversity and density) are the most common criteria addressed in previous studies and used to construct walkability indexes [1,6,41,42,43].
The 3Ds, density, diversity, and design, reflect a general mechanism by which the built environment affects travel behavior. Regarding density, studies have shown for diverse urban contexts that people living in neighborhoods with high population density and diverse land uses are more likely to walk and engage in physical activity [1,7,43,44,45,46,47]. Thus, residents in dense urban areas have a greater desire to walk than residents of suburban or rural areas [48]. Li et al. [7] found for Portland, Oregon, that with high density of places of employment and housing the probability of engaging in walking activities increases. In addition to those with a high density, neighborhoods with a mix of residential buildings and a diversity of services, together with the possibility of social interactions, contribute to adults having attractive walking experiences, and encourage a greater number of active daily trips [47,49]. Regarding design, neighborhoods with traversable designs give people who live in them a greater tolerance for walking greater distances, compared to neighborhoods that are automobile-oriented with a large number of roads to cross, traffic conflicts (parking and access driveways), and steps to climb [50,51,52]. Oyeyemi et al. [53] showed the importance of certain physical attributes of the built environment such as pavement quality and the presence of obstacles on sidewalks, which are relevant components to promote walkability. Also for South America, sidewalks in poor condition have been found to be a barrier to walking [54], especially for the elderly and disabled [55].
Numerous researchers have reviewed the mixed findings regarding the association between walkability, safety and security demonstrating that walkability is not only associated with the physical environment, but safety and security also play an important role in attracting people to public spaces for walking [4,6,23,24,25,26,27]. Moreover, it is considered that security should be the foundation for a sustainable city, because with the lack of security, daily activities can become risky. In this way, design, diversity, and density can affect perceived security which, in turn, affects the decision on travel behavior [6]. Hence, the characteristics of the built environment affect walking activity and physical activity through subjective perception, producing a positive association between perceived security of a neighborhood and walking frequency in the neighborhood [21,22].
The association between insecurity and walking has been found especially relevant in certain contexts. In some Latin American and Asian cities, perceived security against crime was found to be a major problem influencing walkability and deterring people from walking [3,54,56,57]. In Mexico, concern about insecurity explains the rejection of walking as a form of travel when people live in fortified housing developments [58]. Walking in Cali (Colombia) was perceived negatively by pedestrians because of perceptions of insecurity; the quality of illumination and pedestrian infrastructure (e.g., narrow sidewalks, darkness under bridges, etc.) [57]. In Tripoli, Libya, Abdulla et al. [6] indicated that the pedestrian’s level of walking was influenced by feelings of safety and security; built environment factors and a set of considerations for user comfort. On the contrary, for Washington metropolitan areas, Carlson et al. [59], found a low connection between security and walking. These different results seem to be influenced by the different contexts where the studies are carried out and highlight the need to carry out more research to clarify the interaction between perceived security and walkability.
Certain environmental characteristics of particular neighborhoods may generate fear and can discourage people from walking [57,60,61,62,63], since fear or the feeling of insecurity can be felt subjectively, regardless of the real crime rate in the city. Certain individual socioeconomic factors, such as age or gender, also influence the perception of insecurity [64,65], although there are urban zones where people from all groups prefer not to walk due to the high level of perceived insecurity [66]. In addition, it has been established that security is not perceived by zone in a homogeneous way, but that there are certain urban elements in cities [66], acting as environmental markers that decrease the probability of walking [67,68,69,70]. Elements that fragment the space and increase the perception of insecurity include darkness; the presence of garbage or graffiti; lack of maintenance; unkempt and abandoned buildings; small gardens; and stairways [4,7,63,68,71,72,73]. The lack of street lighting has a very significant impact on feelings of security and is positively related to the increased risk of crime [69,74,75,76].
Regarding nature, the results vary according to context. The presence of tall bushes and leafy trees increases the perceived security at night for men and women in the context of Australia [28]. This fact is in contrast to a study carried out in South Africa that found that the presence of trees at night reduces the perception of security since they can be regarded as hiding places for criminals [77]. This result is probably explained by the differences in the prevalence of crime between Australia and South Africa, Australia being a jurisdiction with very low crime rates. Greenways support active transportation, leisure and social engagement for many adults, certain factors also cause fear, especially for adults with mobility limitations [69]. However, creating green spaces may not be enough to encourage individuals to walk, both because of the difference in contexts and because more elements have to be taken into account [78]. For instance, a well-integrated transport system, long sight lines along pavements, walkways visible from nearby buildings, no confined spaces to entrances and courtyards, and no poor lighting conditions promote security by improving the chances of being seen and escaping, are key factors in improving perceived security [29,79,80,81,82,83]. Lee et al. [84] determines that security, along with convenience and comfort, is one of the attributes controllable through policies to improve the positive factors, while reducing the effects of the negative factors.
Perceptions of security while walking are the product of complex interrelationships between the built environment and socioeconomic factors [16,48]. It has been shown that perceived insecurity in relation to elements of the built environment influences mobility decisions [28,34] and that there are individual characteristics that influence perceptions of security. While young people are statistically more at risk of being victimized, older and/or disabled individuals tend to be more fearful. Gender is considered a very relevant variable of perceived insecurity and its relationship with walking. In general, women’s fear differs from that of men and there is evidence of a greater perception of insecurity by women in their journeys on foot [18,28,29,30,31]. The reasons that make women present higher levels of insecurity include the likelihood of being a victim of crime, previous victimization, and witnessing other people’s victimization [85,86,87,88]. It must be noted that sexual assaults and rapes, under-reported crimes, mainly affect women [16], and this has an impact in that their perceptions of security are more closely associated with elements of the built environment compared to men [83]. Unsafe places for women are formed from mental maps developed from external information and personal experiences [29,89] that include closed places with limited escape routes (provides the criminal with attack opportunities) such as underpasses or underground car parks and, second, deserted open spaces (opportunity to attack without being seen), as previously commented.
The greatest perceived insecurity among university women has been identified as a global phenomenon [16] and influences their mobility decisions [34]. Although the level of perceived insecurity changes depending on real crime rates of a particular urban context, women walk less frequently at night than men do and also avoid traveling during rush hours more than men do [90]. According to the study by Foster et al. [12] for Perth (Australia), fear of crime is greater for women and reduces the probability of walking. For Tripoli, Abdulla et al. [6] showed that, apparently, gender affects fear of crime to the point that the interviewees never walked alone at night through the old city. In addition, in other previous studies, for different spatial and social contexts, it has been found that sexual violence against women as they travelled led to an increase in the use of private vehicles [16,91,92,93,94,95].

3. Materials and Methods
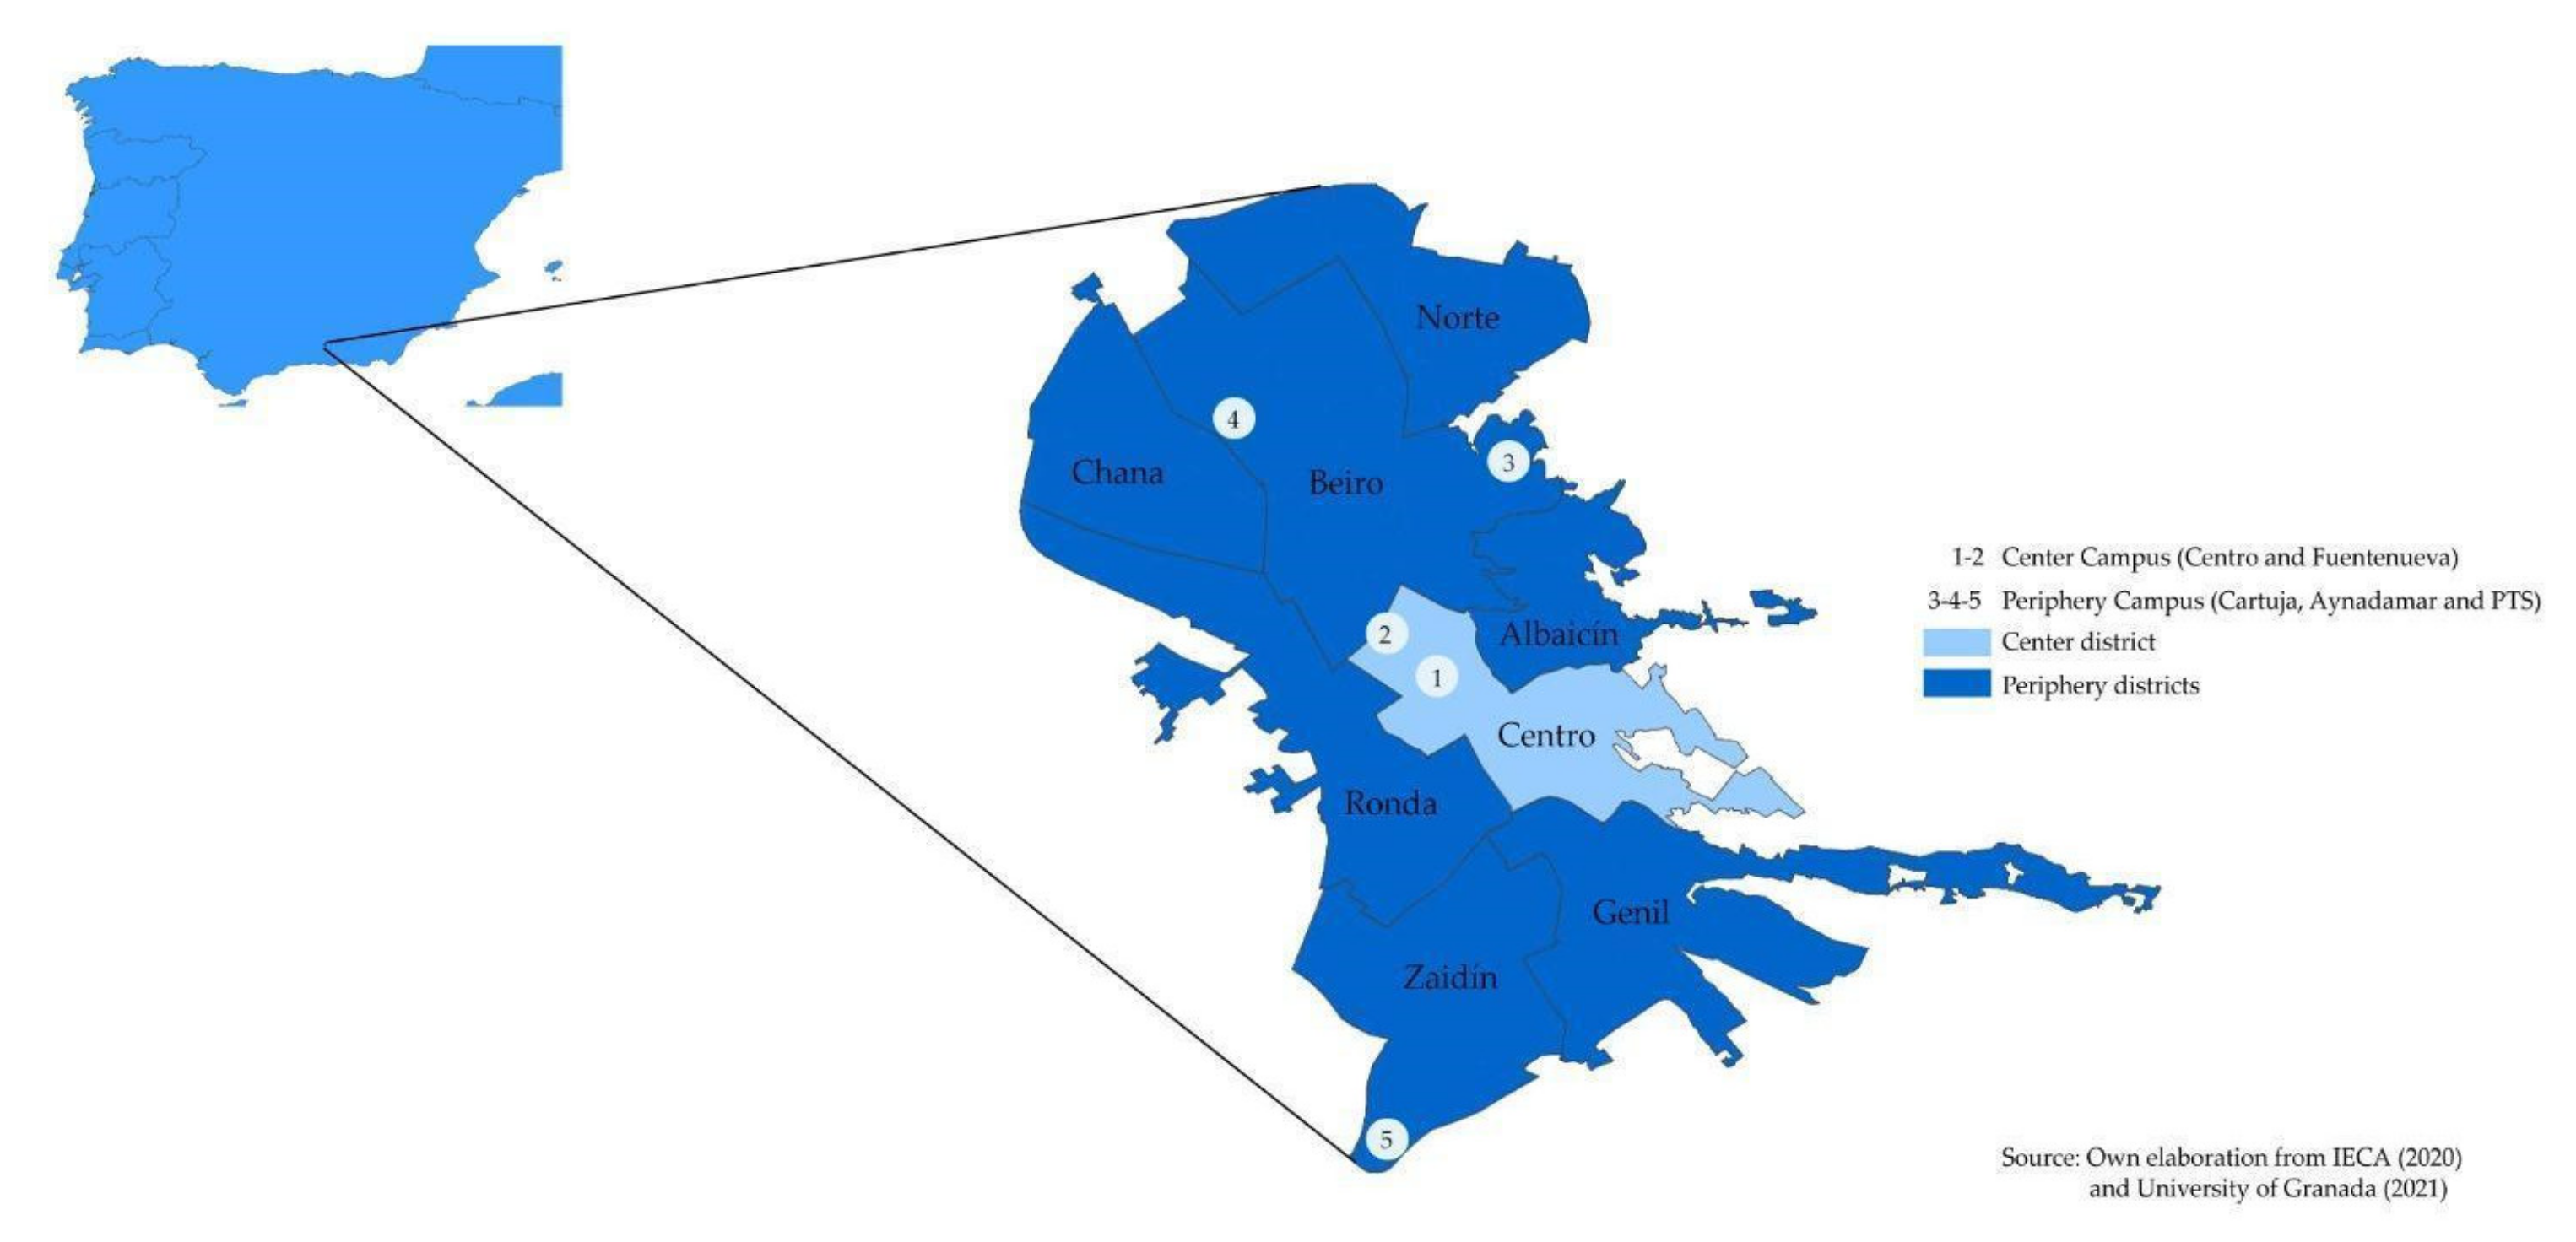
3.1. Study Area

This study was carried out in Granada. The city supports a significant university population that lives in various areas of the city and studies on different campuses. Granada is a city located in the South of Spain. It has 233,648 inhabitants with an area of 88.06 km2 [96] and is divided into eight districts: Norte, Chana, Beiro, Albayzin, Ronda, Zaidín, Genil, and Centro (Figure 1). Granada is a city with ideal attributes for its walkability and safety [97,98,99]. The maximum distance between the city center and the suburbs is approximately 3.5 km, approximately 40 min walking. 80% of pedestrian trips take less than 20 min. The city center is the area that receives the majority of the city’s pedestrian flows. Also, the different neighborhoods have high levels of autonomy based on the distribution of services [100]. The Central district offers the best physical conditions, most favorable for non-motorized mobility. In fact, 77% of the population surveyed for the implementation of the city’s Sustainable Urban Mobility Plan indicated that the city center is a destination in which the ease of walking stands out compared to the difficulty of using a car due to the difficulty of parking and restricted access [99,100]. For this reason, the districts have been subdivided into the Central district and the others, grouped together as the Periphery.
An important part of the economic and social activity of the city of Granada is related to its University, which contributes 6.12% to GDP, and generates 7.7% of jobs in the province [101]. The University of Granada had 41,293 students during the 2019/2020 academic year, in which this study was carried out, distributed in five university campuses with different centers and degree courses. In this work we have divided the five campuses into two groups, Centro and Fuentenueva located in the central district of the city and Cartuja; Aynadamar and PTS, distributed in the periphery [102] (Figure 1).
The most recent data on the modal distribution of mobility in the city of Granada comes from the Mobility Survey carried out for the preparation of the Sustainable Urban Mobility Plan. According to these data, the usual mode of transport was distributed as follows: walking, 54%; by car, 19%; transit, 20% and other, 7%. Regarding preferences, a higher percentage, 60.6% of the people surveyed, would prefer to go by foot; 17.2% to use public transport; 11.7% to go by car; and 10.5% would prefer cycling [100]. This mobility survey incorporated some questions on traffic safety, but did not incorporate perceived security that is rarely factored into urban policies through mobility plans. Therefore, security policies are usually related to law enforcement policies. Nevertheless, reducing crime rates does not necessarily lead to a reduction in subjective perceived security. According to the Global Peace Index, which analyzes countries and territories that have a 99.7% world population, Spain is one of the safest countries in the world and is among the 35 countries with the highest level of peace [103]. The crime rate in Granada is low (0.49 criminal offenses per hundred thousand inhabitants) and similar to Spain’s (0.47 criminal offenses per hundred thousand inhabitants) [104]. However, the most important deterrent for short trips is the perception of insecurity when walking due to fear of crime [99]. In this sense, on the one hand, the crime index in Granada (25.41 out of 100) is low and lower than Spain’s (31.59 out of 100), and on the other, the security index when walking during the day in Granada is very high (89.58 out of 100), more than the data for Spain (81.90 out of 100). Finally, the security index when walking during the night is high (74.59 out of 100), again more than the data for Spain (62.59) [105].

3.2. Questionnaire

Since security and crime security data are difficult to obtain, audits and questionnaires are used to obtain information on pedestrian perceptions about security [18,106]. This paper uses information from a web-survey designed using a theoretical framework on perceived security and walking activity in Granada. The web-survey was open to University students and accessible for one month in 2020 starting in February and the questionnaire was interrupted in the first week of March, due to the extraordinary situation caused by COVID-19. A total of 321 respondents filled in the form and, finally, there were 312 valid surveys. For a population of 38,073 students from the campuses in the city center (Centro and Fuentenueva) and periphery (Cartuja and PTS), a margin of error of 5.5% and a confidence level of 95% were reached. There was no representative sample for the Aynadamar Campus in the periphery. From each stratum, a sample of 159 participants was reached for the city center campuses and 153 students for the Periphery Campus.
The survey consisted of 22 questions and was structured into four sections. In Section 1, they were asked to rate their preference for walking from 1 to 5 (1 = I always avoid walking; 2 = I avoid walking on many occasions; 3 = I sometimes prefer to walk; 4 = I prefer to walk on many occasions; 5 = I always prefer walking) and the usual mode of transport in the daily trips of the student. Section 2 contains information about the socioeconomic characteristics of the respondent, including gender (male, female); age and employment (paid employment; no paid employment). Section 3 includes location characteristics, very important in the case of university students, given that they prefer and choose to live close to the campus where they study [32]. Specifically, it asks about the campus where they study and the district where they live.
The level of specific security related to built environment attributes is a phenomenon that cannot be objectively measured but can be evaluated using ordinal variables and level of overall security is an aggregate measure of how to perceive security with different aspects of the built environment [14]. Thus, in the Section 4 of the survey, participants were asked about the perceived security while walking and specific perceived security in terms of the presence of certain attributes of the built environment related to the 3 Ds dimensions of walkability, that is, Design and street patterns; Diversity and Density. Five response options are used to measure the perceived security (1 = very insecure, 2 = insecure, 3 = neutral, 4 = secure and 5 = very secure). Security related to these attributes may be called “specific security”. Regarding Design and street patterns, security in terms of the presence of lighting has been included; darkness; cleanliness; vegetation; underground passages; waste ground; spaciousness; pedestrian zone; stairways. In relation to diversity, the presence of open stores; pubs; official buildings were examined. And regarding Density, the presence of people in the street, high people density and the presence of traffic, traffic density are assessed. Specifically, the attributes considered are consistent with the literature reviewed and are summarized in Table 1.

3.3. Definition and Measurement of Variables

The variables considered in this study are grouped according to the theoretical review. Two dependent variables are analyzed. Prefwalk, is a binary variable that defines the preference for walking and which takes the value 1 for the responses “I prefer to walk on many occasions” and “I always prefer walking” and the value 0 in all other cases. Walk is a binary variable that defines whether walking is the most usual travel mode chosen by the respondents (value 1) or not (value 0). The explanatory variables were classified into three groups, socioeconomic characteristics that were gender, age and employment; characteristics of location, campus where students study and home district where they live; and Perceived security variables. Regarding socioeconomic characteristics, Gender is a binary variable that takes the value of 1 for female and 0 for male. Age is a continuous variable that refers to the age of the respondent. Employment is a binary variable that takes the value 1 if the participant has paid employment and 0 if he/she does not have paid employment at the time of the survey. Regarding the location variables, Home and Campus, both are binary, the first takes the value 1 if they live in the central district of the city and 0 in the other cases; the second takes the value 1 if they study in the city center (Centro or Fuentenueva) and 0 in the other cases. This division between the center and the periphery responds to the fact that the city center is the most walkable area of Granada [100]. In relation to perceived security, the variable security walking Insec_walk takes the value 1 if the response corresponds to “very insecure” and “insecure” and 0 when the values are “very secure”, “secure” and “neutral”. The specific security indicators in relation to the different attributes of the built environment have been reduced to a smaller number of variables through Non-Linear Principal Component Analysis.

3.4. Non-Linear Principal Component Analysis and Logit Model

Different methods have been used to study the relationship between walkability and level of security in streets. A review of these methods can be found in [4]. According to the authors, the most widely used methods are logit, probit and linear regression. Nevertheless, other methods such as principal component analysis (PCA) have been used to build synthetic measures [8,18]. The binary logit and ordered logit model have been used to predict the probability of walking journeys based on various attributes of the built environment, including perceived security factors [28,31]. The binary logit has also been used to identify the factors that affect pedestrian satisfaction and to verify their differences according to land use and type of walking space [84] and to predict the propensity of cycling as a function of perceived environment attributes and the objective environment [107].
In this paper, a binary logit model has been used to explain walking (preferred transport mode and chosen transport mode [binary variables]) as a function of a set of explanatory variables. Previously, Non-Linear Principal Component Analysis (NLPCA) was used because the level of perceived security while walking, related to specific built environment attributes, is ordinal categorical. These variables should not be used directly as explanatory variables in the regression model because the marginal effect is not the same for all the values of these categorical variables. We are also interested in measuring perceived specific security by reducing the observed multi-dimensional variables into a lower number of numerical variables. After applying NLPCA to reduce the dimensions of the built environment illustrating perceived security, LM is used to model the binary nature of the dependent variables, which depend on the effect that the synthetic variables obtained with NLPCA and other visible variables have on walking as a preferred travel mode or as a chosen travel mode in Granada. In addition, we attempt to analyze the effect of the University Campus and the zone where the university students live.

4. Results

4.1. Descriptive Statistics

Table 2 contains the information on mean, variance and maximum and minimum values of the analyzed variables. 60.3% of the participants prefer to walk and 53.2% choose to walk as their usual mode of travel. Regarding the socioeconomic characteristics of the sample, 68.9% of the people surveyed are women; the average age is 21.7 years and only 21.5% have paid employment. The location characteristics indicate that 28.2% live in the central district of the city, while 51.3% study in the city center campus. With respect to insecurity, 35.9% of the sample feels insecure or very insecure walking, in general. And the attributes that generate security are lighting; open shops and high people density (from the dimensions Design and street patterns, Diversity and Density). On the other hand, underground passages and waste ground are the attributes whose presence generates the greatest insecurity, (from the Design and street patterns dimension).

4.2. Non-Linear Principal Component Analysis (NLPCA)

A set of 14 ordinal variables were considered to explain specific perceived security related to built environment attributes. Non-linear (Categorical) Principal Component Analysis (NLPCA) was carried out in SPSS statistical software. This methodology was applied to the 14 ordinal variables in order to obtain continuous variables to explain perceived security. The principal component structure obtained using varimax rotation yielded 3 factors and extracted 62.965% of the total variance (Table 3). Factor 1 accounted for 33.612% of the variance. The most important items that had loading were spaciousness, shops, pedestrian zone, lighting, high density of people and cleanliness. This factor can be characterized as “Facilitators” to walking. Factor 2 accounted for 18.348% of the variance and had loading on 3 items. This factor can be characterized as “Deterrents” to walking since the significant variables are Underground passages, Waste ground, stairways, Vegetation and Darkness. Factor 3 accounted for 11.105% of the variance and had loading on items Pubs, High people Density, Stairs and Traffic, most of them related to the presence of people, which is why it was called “People”. The internal consistency of these factors was tested using Cronbach’s alpha and found to be very adequate for Factor 1 (0.873). However, it is lower for Factor 2 (0.731) and Factor 3 (0.694). The overall fit was very high for both factors (0.955).

4.3. Regression Models

The objective of this work is to model walking as the preferred travel mode and as the most usual travel mode, taking into account socioeconomic characteristics, location and walking security perceived by university students. First, a test was carried out to contrast the independence between the Prefwalk and Walk variables. This test allows us to say that the Prefwalk and Walk variables are not statistically independent since the p-value is 0.000517, less than 0.01 and therefore H0 is rejected with a value for Chi2 of 12.05368. In both cases, four models are presented. The first incorporates the socioeconomic variables (Gender, Age and Employment); in the second, the location variables are added (Home and Campus); in the third, specific security factors are incorporated (Facilitators; Deterrents and People); and in the fourth, general perceived insecurity while walking is added (Insec_walk).
Table 4 shows the models for walking as the preferred transport mode (Prefwalk). It can be seen how, by including the location and the specific security variables, the model improves, that is, the Akaike information criterion (AIC) decreases. According to the results obtained, with regards to socioeconomic factors, gender is the only significant variable. In the Mod 1.4 model, the chances (odds) that a woman (Gender = 1) prefers to walk is two times less than a man (1/0.476 = 2.1), assuming that the rest of the variables remain constant (H3 Gender). That is, the response Prefwalk is two times less likely to occur when predictor Gender is equal to 1. In relation to the location characteristics, the place where university students reside (Home) is a significant variable, so that the chances (odds) that a student who lives in the center (Home = 1) prefers to walk is 2.4 times higher than someone who lives in the periphery (H4 Location). Regarding the factors related to perceived security, Deterrents to walking, is a significant variable, whereby the barriers of the built environment negatively affect the chances of choosing walking as the preferred mode of travel (H2 Deterrents to walking). Finally, the inclusion of perceived insecurity while walking, in general, improves the goodness of the model and the percentage of positive responses, which go from 66.3% to 77.9%. Students who feel insecure while walking (Insecwalk = 1) are 8.3 (1/0.12) times less likely to have walking as their preferred mode of travel (H1 Insecurity).
Table 5 shows the models for walking as the most usual travel mode (Walk). It can be seen how, by including the specific security variables, the model improves, that is, the Akaike Criterion (AIC) decreases. According to the results obtained, with respect to socioeconomic factors, gender is no longer a significant variable. The location characteristics, both Campus and Home, are significant in the choice of walking as the usual mode of transport. The chances (odds) that a student who lives in the center (Home = 1) walks regularly is 2.5 times higher than someone who lives in the periphery (Mod 2.4). And the chances (odds) that a student who studies in the center (Campus = 1) walks regularly is 2.7 times higher than someone who studies in the periphery campuses (H4 Location). Regarding the factors related to perceived security, there is no significance. However, the inclusion of perceived insecurity while walking, in general, improves the goodness of the model, although to a lesser extent than in the previous case, and the percentage of positive responses goes from 60.6% to 63.5%. In this case, students who feel unsafe walking (Insec_walk = 1) are 1.9 (1/0.53) times less likely to have walking as their preferred mode of travel (H1 Insecurity). It can also be seen that the greatest increase, in terms of the percentage of positive responses, in the model of preference for walking (Table 4) has been produced by including the Insec_walk variable (11.6 points), while in the case of the walking model (Table 5) this greater increase occurred when including the location variables (6.7 points).

5. Discussion and Conclusions

This study has examined the effect of socioeconomic variables, location and perceived security, based on scientific literature, on the choice of walking as the preferred mode and as the usual mode of travel by a sample of 312 university students from Granada (Spain), by using NLPCA and Logit models. It is well known that perceived insecurity is one of the main deterrents of walking activity, especially in certain urban contexts of Latin American and Asian cities [3,6,57,58].
The main contributions of this paper for the field of knowledge have shown that perceived insecurity has a higher effect on the chances of choosing walking as a preferred mode than as the usual mode. It has also shown that the barriers of the built environment, the location and gender influence the walking preferences and walking activity of the university students. These relationships that have been established in this study can occur in other cities or urban areas, thus lending a general character to the results which are supported by the reviewed literature.
A novel aspect is introduced in that perceived security, in whole, has a different effect on the chances of choosing walking as the usual mode, or as a preferred mode, both in a walkable and safe environment with low crime rates, such as the city of Granada, and for the case of university students. Specifically, our results show that a student who perceives walking insecurity (Insec_walk) is up to 8.3 times more likely to prefer another mode of travel, while they will be 1.9 times less likely to have walking as their usual travel mode (H1 Insecurity). In addition, the university students surveyed demonstrated different levels of security while walking in the presence of certain elements of the built environment. More precisely, through the use of NLPCA, three factors of specific security were extracted from 14 built environment attributes related to the 3 Ds dimensions of walkability. The Factor Facilitators to walking (33.612% of the variance) had loading in attributes identified by literature as positive for walking activity: spaciousness, stores, pedestrian zone, lighting, high density of people, and cleanliness [69,74,75,76]. Special mention should be made of the Factor Deterrents to walking (18.348% of the variance), which had loading on Underground passages, Waste ground, Stairways/Steps, Vegetation and Darkness. These results are in line with those found by Ferrer and Ruiz [99], using qualitative methods, for Granada city where the main common barriers to walking were absence of people, poor street lighting or walking along a conflictive area. Deterrents to walking was a significant variable to explain walking preferences (H2 Deterrents to walking). Furthermore, barriers of built environment negatively affect the chances of choosing walking as the preferred mode of travel, confirming that these attributes behave as environmental signals that decrease preferences for walking [4,7,67,68,69,70,71], also in the case of university students in Granada. Thus, perceived security plays a significant role in attracting people to public spaces for walking and it also has a relationship with walkability dimensions [4,6,24].
Regarding the socioeconomic variables, gender is the only significant variable in the model where the explained variable is the preference for walking, with the chances that a woman prefers to walk being twice as low as for a man (H3 Gender). This lower preference for walking on the part of women had also been found in other studies and in different contexts, which relate violence and sexual assaults with the greater perceived insecurity of walking on the part of women [16,91,92,93,94,95].
The location variables show that when the student lives or studies in the city center, it is 2.5 and 2.7 times more likely that walking is their usual travel mode compared to those students who live or study in the periphery. This result is in line with the peculiarity of university students, for whom it is important to live close to the campus where they study [32]. In fact, the greatest increase in the percentage of positive responses in the model where walking as a usual mode is the explanatory variable occurs when the location variables are included (H4 Location).
The limitations of this study refer to the lack of consideration of variables that could have been relevant to explain walking preferences and walking activity, such as ethnicity, sexual orientation and identity, and disability. Other limitations were that the effects on security perceptions at different times of the day were not considered, nor the effect of COVID-19. These limitations, as well as the analysis of the experience of security when going to different locations, could be lines of future research.
Finally, the political implications of this study show that urban planning and mobility policies should include analysis of the factors that generate perceived insecurity, which have different effects on preferences and choices of the mode of travel. As established by Zhao et al. [22] and Calonge and Reillo [58], urban planners should consider people’s perceptions when they design the built environment, given that interventions to improve the levels of perceived security in the urban environment can increase the chances of choosing walking as the usual mode, and, especially, promotes the development towards more sustainable cities.

Author Contributions

Conceptualization, C.L., C.M.-B., I.C.-P. and J.C.-O.; data curation, C.M.-B. and I.C.-P.; formal analysis, C.L., C.M.-B. and J.C.-O.; funding acquisition, C.L.; investigation, C.L., C.M.-B. and J.C.-O.; methodology, C.L. and J.C.-O.; project administration, C.L.; resources, C.M.-B. and I.C.-P.; software, J.C.-O.; supervision, C.L. and J.C.-O.; validation, C.L. and J.C.-O.; writing—original draft, C.M.-B. and I.C.-P.; writing—review & editing, C.L. All authors have read and agreed to the published version of the manuscript.

Funding

This research received no external funding.

Institutional Review Board Statement

Not applicable.

Informed Consent Statement

Not applicable.

Data Availability Statement

The data presented in this study are available on request from the corresponding author. Data was obtained from own survey and are available with the permission of all authors.

Acknowledgments

Authors acknowledge the technical support from R+D+i ERDF project MOMIGEN- Ref. B-SEJ-238-UGR20.

Conflicts of Interest

The authors declare no conflict of interest.

References

  1. Habibian, M.; Hosseinzadeh, A. Walkability index across trip purposes. Sustain. Cities Soc. 2018, 42, 216–225. [Google Scholar] [CrossRef]
  2. Brand, C.; Goodman, A.; Ogilvie, D. Evaluating the impacts of new walking and cycling infrastructure on carbon dioxide emissions from motorized travel: A controlled longitudinal study. Appl. Energy 2014, 128, 284–295. [Google Scholar] [CrossRef] [PubMed] [Green Version]
  3. Arellana, J.; Saltarín, M.; Larrañaga, A.M.; Alvarez, V.; Henao, C.A. Urban walkability considering pedestrians’ perceptions of the built environment: A 10-year review and a case study in a medium-sized city in Latin America. Transp. Rev. 2019, 40, 183–203. [Google Scholar] [CrossRef]
  4. Fonseca, F.; Ribeiro, P.J.G.; Conticelli, E.; Jabbari, M.; Papageorgiou, G.; Tondelli, S.; Ramos, R.A.R. Built environment attributes and their influence on walkability. Int. J. Sustain. Transp. 2021, 1–20. [Google Scholar] [CrossRef]
  5. Ruiz-Padillo, A.; Pasqual, F.; Uriarte, A.; Cybis, H. Application of multi-criteria decision analysis methods for assessing walkability: A case study in Porto Alegre, Brazil. Transp. Res. PART-Transp. Environ. 2018, 63, 855–871. [Google Scholar] [CrossRef]
  6. Abdulla, K.M.A.; Abdelmonem, M.G.; Selim, G. Walkability in historic urban spaces: Testing the safety and security in Martyrs’ Square in Tripoli. Archnet-IJAR 2017, 11, 163–177. [Google Scholar] [CrossRef] [Green Version]
  7. Li, F.; Fisher, K.J.; Brownson, R.C.; Bosworth, M. Multilevel modelling of built environment characteristics related to neighbourhood walking activity in older adults. J. Epidemiol. Community Health 2005, 59, 558–564. [Google Scholar] [CrossRef] [Green Version]
  8. Handy, S.; Cao, X.; Mokhtarian, P.L. Self-Selection in the Relationship between the Built Environment and Walking: Empirical Evidence from Northern California. J. Am. Plann. Assoc. 2006, 72, 55–74. [Google Scholar] [CrossRef]
  9. Jore, S.H. The Conceptual and Scientific Demarcation of Security in Contrast to Safety. Eur. J. Secur. Res. 2019, 4, 157–174. [Google Scholar] [CrossRef] [Green Version]
  10. Shaer, A.; Rezaei, M.; Moghani Rahimi, B.; Shaer, F. Examining the associations between perceived built environment and active travel, before and after the COVID-19 outbreak in Shiraz city, Iran. Cities 2021, 115, 103255. [Google Scholar] [CrossRef]
  11. Adkins, A.; Barillas-Longoria, G.; Nevárez Martínez, D.; Ingram, M. Differences in social and physical dimensions of perceived walkability in Mexican American and non-hispanic white walking environments in Tucson, Arizona. J. Transp. Health 2019, 14, 100585. [Google Scholar] [CrossRef]
  12. Foster, S.; Giles-Corti, B.; Knuiman, M. Does Fear of Crime Discourage Walkers? A Social-Ecological Exploration of Fear as a Deterrent to Walking. Environ. Behav. 2014, 46, 698–717. [Google Scholar] [CrossRef]
  13. Larrañaga, A.M.; Rizzi, L.I.; Arellana, J.; Strambi, O.; Cybis, H.B.B. The influence of built environment and travel attitudes on walking: A case study of Porto Alegre, Brazil. Int. J. Sustain. Transp. 2016, 10, 332–342. [Google Scholar] [CrossRef]
  14. Lucchesi, S.; Larranaga, A.; Ochoa, J.; Samios, A.; Cybis, H. The role of security and walkability in subjective wellbeing: A multigroup analysis among different age cohorts. Res. Transp. Bus. Manag. 2021, 40, 100559. [Google Scholar] [CrossRef]
  15. Cozens, P. Crime prevention through environmental design in Western Australia: Planning for sustainable urban futures. Int. J. Sustain. Dev. Plan. 2008, 3, 272–292. [Google Scholar] [CrossRef] [Green Version]
  16. Ceccato, V.; Loukaitou-Sideris, A. Fear of Sexual Harassment and Its Impact on Safety Perceptions in Transit Environments: A Global Perspective. Violence Women 2021, 28, 26–48. [Google Scholar] [CrossRef] [PubMed]
  17. Leslie, E.; Saelens, B.; Frank, L.; Owen, N.; Bauman, A.; Coffee, N.; Hugo, G. Residents’ perceptions of walkability attributes in objectively different neighbourhoods: A pilot study. Health Place 2005, 11, 227–236. [Google Scholar] [CrossRef]
  18. Paydar, M.; Kamani-Fard, A.; Etminani-Ghasrodashti, R. Perceived security of women in relation to their path choice toward sustainable neighborhood in Santiago, Chile. Cities 2017, 60, 289–300. [Google Scholar] [CrossRef]
  19. Valera, S.; Guàrdia, J. Perceived insecurity and fear of crime in a city with low-crime rates. J. Environ. Psychol. 2014, 38, 195–205. [Google Scholar] [CrossRef] [Green Version]
  20. UN Women. Safe Cities and Safe Public Spaces: Global Results Report. 2017. Available online: https://dspace.ceid.org.tr/xmlui/handle/1/1275 (accessed on 5 November 2021).
  21. Mason, P.; Kearns, A.; Bond, L. Neighbourhood walking and regeneration in deprived communities. Health Place 2011, 17, 727–737. [Google Scholar] [CrossRef] [PubMed]
  22. Zhao, L.; Shen, Z.; Zhang, Y.; Sheng, F. Study on the Impact of the Objective Characteristics and Subjective Perception of the Built Environment on Residents’ Physical Activities in Fuzhou, China. Sustainability 2020, 12, 329. [Google Scholar] [CrossRef] [Green Version]
  23. Echeverria, S.E. Reliability of Self-Reported Neighborhood Characteristics. J. Urban Health Bull. N. Y. Acad. Med. 2004, 81, 682–701. [Google Scholar] [CrossRef] [PubMed] [Green Version]
  24. Loukaitou-Sideris, A.; Eck, J.E. Crime prevention and active living. Am. J. Health Promot. AJHP 2007, 21 (Suppl. S4), 380–389. [Google Scholar] [CrossRef] [PubMed]
  25. Kerr, Z.; Evenson, K.R.; Moore, K.; Block, R.; Diez Roux, A.V. Changes in Walking Associated with Perceived Neighborhood Safety and Police-Recorded Crime: The Multi-Ethnic Study of Atherosclerosis. Prev. Med. 2015, 73, 88–93. [Google Scholar] [CrossRef] [Green Version]
  26. Karim, H.A.; Azmi, D.I. Convenience and Safety of Walking Experience in Putrajaya Neighbourhood Area. Procedia Soc. Behav. Sci. 2013, 101, 318–327. [Google Scholar] [CrossRef] [Green Version]
  27. Shashank, A.; Schuurman, N. Unpacking walkability indices and their inherent assumptions. Health Place 2019, 55, 145–154. [Google Scholar] [CrossRef]
  28. Basu, N.; Haque, M.M.; King, M.; Kamruzzaman, M.; Oviedo-Trespalacios, O. The unequal gender effects of the suburban built environment on perceptions of security. J. Transp. Health 2021, 23, 101243. [Google Scholar] [CrossRef]
  29. Koskela, H.; Pain, R. Revisiting fear and place: Women’s fear of attack and the built environment. Geoforum 2000, 31, 269–280. [Google Scholar] [CrossRef]
  30. Bianco, M.; Lawson, C. Trip Chaining, Childcare, and Personal Safety. In Proceedings of the Women’s Travel Issues Second National Conference; Report FHWA-PL-97-024, FHWA. U.S. Department of Transportation: Washington, DC, USA, 1997; Volume 1, pp. 124–142. [Google Scholar]
  31. Clifton, K.; Livi, A. Gender differences in walking behavior, attitudes about walking, and perceptions of the environment in three Maryland communities. In Proceedings of the Conference on Research on Women's Issues in Transportation, Chicago, IL, USA, 18–20 November 2004; Transportation Research Board: Washington, DC, USA; Volume 2, pp. 79–88.
  32. Capasso da Silva, D.; Rodrigues da Silva, A. Sustainable modes and violence: Perceived safety and exposure to crimes on trips to and from a Brazilian university campus. J. Transp. Health 2020, 16, 100817. [Google Scholar] [CrossRef]
  33. Hewawasam, C.; Abeysinghe, U.; Saparamdu, S. Assessing factors affecting university students’ preference of walking; comparing university of Moratuwa & university of Sri Jayewardenepura. 2020. In Proceedings of the FARU 2020 Conference Proceedings, Moratuwa, Sri Lanka, 6–9 November 2020. [Google Scholar]
  34. Mark, L.; Heinrichs, D. More than time and money - Influences on mobility of low-income women in the Villa 20 in Buenos Aires, Argentina. J. Transp. Health 2019, 15, 100652. [Google Scholar] [CrossRef]
  35. Taleai, M.; Taheri Amiri, E. Spatial multi-criteria and multi-scale evaluation of walkability potential at street segment level: A case study of tehran. Sustain. Cities Soc. 2017, 31, 37–50. [Google Scholar] [CrossRef]
  36. Roof, K.; Oleru, N. Public Health: Seattle and King County’s Push for the Built Environment. J. Environ. Health 2008, 71, 24–27. [Google Scholar]
  37. Jacobs, J.; Backholer, K.; Strugnell, C.; Allender, S.; Nichols, M. Socio-economic and Regional Differences in Walkability and Greenspace around Primary Schools: A Census of Australian Primary School Neighbourhoods. J. Community Health 2021, 46, 98–107. [Google Scholar] [CrossRef]
  38. Liao, B.; van den Berg, P.E.W.; van Wesemael, P.J.V.; Arentze, T.A. Empirical analysis of walkability using data from the Netherlands. Transp. Res. Part Transp. Environ. 2020, 85, 102390. [Google Scholar] [CrossRef]
  39. Wang, H.; Yang, Y. Neighbourhood walkability: A review and bibliometric analysis. Cities 2019, 93, 43–61. [Google Scholar] [CrossRef]
  40. Forsyth, A.; Southworth, M. Cities Afoot—Pedestrians, Walkability and Urban Design. J. Urban Des. 2008, 13, 1–3. [Google Scholar] [CrossRef]
  41. Ewing, R.; Cervero, R. Travel and the Built Environment. J. Am. Plann. Assoc. 2010, 76, 265–294. [Google Scholar] [CrossRef]
  42. Cervero, R.; Kockelman, K. Travel demand and the 3Ds: Density, diversity, and design. Transp. Res. Part Transp. Environ. 1997, 2, 199–219. [Google Scholar] [CrossRef]
  43. Frank, L.D.; Schmid, T.L.; Sallis, J.F.; Chapman, J.; Saelens, B.E. Linking objectively measured physical activity with objectively measured urban form: Findings from SMARTRAQ. Am. J. Prev. Med. 2005, 28 (Suppl. S2), 117–125. [Google Scholar] [CrossRef] [PubMed]
  44. Kerr, J.; Norman, G.; Millstein, R.; Adams, M.A.; Morgan, C.; Langer, R.D.; Allison, M. Neighborhood environment and physical activity among older women: Findings from the San Diego cohort of the women’s health initiative. J. Phys. Act Health 2014, 11, 1070–1077. [Google Scholar] [CrossRef] [PubMed]
  45. Huang, R.; Moudon, A.V.; Zhou, C.; Saelens, B.E. Higher residential and employment densities are associated with more objectively measured walking in the home neighborhood. J. Transp. Health 2019, 12, 142–151. [Google Scholar] [CrossRef] [PubMed]
  46. Ribeiro, A.I.; Hoffimann, E. Development of a Neighbourhood Walkability Index for Porto Metropolitan Area. How Strongly Is Walkability Associated with Walking for Transport? Int. J. Environ. Res. Public Health 2018, 15, 2767. [Google Scholar] [CrossRef] [PubMed] [Green Version]
  47. Marquet, O.; Miralles-Guasch, C. The Walkable city and the importance of the proximity environments for Barcelona’s everyday mobility. Cities 2015, 42, 258–266. [Google Scholar] [CrossRef]
  48. Yang, Y.; Diez Roux, A.V.; Auchincloss, A.H.; Rodriguez, D.A.; Brown, D.G. Exploring walking differences by socioeconomic status using a spatial agent-based model. Health Place 2012, 18, 96–99. [Google Scholar] [CrossRef] [PubMed] [Green Version]
  49. Saelens, B.E.; Handy, S.L. Built Environment Correlates of Walking: A Review. Med. Sci. Sports Exerc. 2008, 40 (Suppl. S7), S550–S566. [Google Scholar] [CrossRef] [Green Version]
  50. Boer, R.; Zheng, Y.; Overton, A.; Ridgeway, G.K.; Cohen, D.A. Neighborhood Design and Walking Trips in Ten, U.S. Metropolitan Areas. Am. J. Prev. Med. 2007, 32, 298–304. [Google Scholar] [CrossRef] [Green Version]
  51. Olszewski, P.; Wibowo, S.S. Using equivalent walking distance to assess pedestrian accessibility to transit stations in Singapore. Transp. Res. Rec. 2005, 38–45. [Google Scholar] [CrossRef]
  52. Park, S.; Kang, J.; Choi, K. Finding determinants of transit users’ walking and biking access trips to the station: A pilot case study. KSCE J. Civ. Eng. 2014, 18, 651–658. [Google Scholar] [CrossRef]
  53. Oyeyemi, A.L.; Conway, T.L.; Adedoyin, R.A.; Akinroye, K.K.; Aryeetey, R.; Assah, F.; Cain, K.L.; Gavand, K.A.; Kasoma, S.S.; Kolbe-Alexander, T.L.; et al. Construct Validity of the Neighborhood Environment Walkability Scale for Africa. Med. Sci. Sports Exerc. 2017, 49, 482–491. [Google Scholar] [CrossRef] [Green Version]
  54. Larranaga, A.M.; Arellana, J.; Rizzi, L.I.; Strambi, O.; Cybis, H.B.B. Using best–worst scaling to identify barriers to walkability: A study of Porto Alegre, Brazil. Transportation 2019, 46, 2347–2379. [Google Scholar] [CrossRef]
  55. Moura, F.; Cambra, P.; Gonçalves, A.B. Measuring walkability for distinct pedestrian groups with a participatory assessment method: A case study in Lisbon. Landsc. Urban Plan. 2017, 157, 282–296. [Google Scholar] [CrossRef]
  56. Moayedi, F.; Zakaria, R.; Bigah, Y.; Mustaffar, M.; Othman, C.; Puan, O.; Klufallah, M.; Zen, I.S. Conceptualising the Indicators of Walkability for Sustainable Transportation. J. Teknol. Sci. Eng. 2013, 65, 2180–3722. [Google Scholar] [CrossRef] [Green Version]
  57. Villaveces, A.; Nieto, L.A.; Ortega, D.; Ríos, J.F.; Medina, J.J.; Gutiérrez, M.I.; Rodríguez, D. Pedestrians’ perceptions of walkability and safety in relation to the built environment in Cali, Colombia, 2009–10. Inj. Prev. 2012, 18, 291–297. [Google Scholar] [CrossRef] [PubMed] [Green Version]
  58. Calonge-Reillo, F. More fear, less walking: Taking a walk in fortified housing environments in urban Mexico. J. Hous. Built Environ. 2021. [Google Scholar] [CrossRef]
  59. Carlson, J.A.; Frank, L.D.; Ulmer, J.; Conway, T.L.; Saelens, B.E.; Cain, K.L.; Sallis, J.F. Work and Home Neighborhood Design and Physical Activity. Am. J. Health Promot. 2018, 32, 1723–1729. [Google Scholar] [CrossRef]
  60. Adlakha, D.; Hipp, J.A.; Brownson, R.C. Neighborhood-based differences in walkability, physical activity, and weight status in India. J. Transp. Health. 2016, 3, 485–499. [Google Scholar] [CrossRef] [Green Version]
  61. Frank, L.; Giles-Corti, B.; Ewing, R. The influence of the built environment on transport and health. J. Transp. Health 2016, 3, 423–425. [Google Scholar] [CrossRef]
  62. Lewis, D.A.; Maxfield, M.G. Fear in the Neighborhoods: An Investigation of the Impact of Crime. J. Res. Crime Delinq. 1980, 17, 160–189. [Google Scholar] [CrossRef]
  63. Schroeder, H.W.; Anderson, L.M. Perception of personal safety in urban recreation sites. J. Leis Res. 1984, 16, 178–194. [Google Scholar] [CrossRef]
  64. Van Soomeren, P. Safe and Secure Cities. The physical urban environment and reduction of urban insecurity: A general introduction. In Proceedings of the Conference on the Reduction of Urban Insecurity, Barcelona, Spain, 17–20 November 1987. [Google Scholar]
  65. Pouliou, T.; Elliott, S.J.; Paez, A.; Newbold, K.B. Building obesity in Canada: Understanding the individual- and neighbourhood-level determinants using a multi-level approach. Geospatial Health 2014, 9, 45–55. [Google Scholar] [CrossRef] [Green Version]
  66. Shach-Pinsly, D.; Ganor, T. A New Approach for Assessing Secure and Vulnerable Areas in Central Urban Neighborhoods Based on Social-Groups’ Analysis. Sustainability 2021, 13, 1174. [Google Scholar] [CrossRef]
  67. Mendes de Leon, C.F.; Cagney, K.A.; Bienias, J.L.; Barnes, L.L.; Skarupski, K.A.; Scherr, P.A.; Evans, D.A. Neighborhood Social Cohesion and Disorder in Relation to Walking in Community-Dwelling Older Adults: A Multilevel Analysis. J. Aging Health 2009, 21, 155–171. [Google Scholar] [CrossRef] [Green Version]
  68. Loukaitou-Sideris, A. Is it safe to walk? Neighborhood safety and security considerations and their effects on walking. J. Plan. Lit. 2006, 20, 219–232. [Google Scholar] [CrossRef]
  69. Ottoni, C.A.; Sims-Gould, J.; Winters, M. Safety perceptions of older adults on an urban greenway: Interplay of the social and built environment. Health Place 2021, 70, 102605. [Google Scholar] [CrossRef]
  70. Yen, I.H.; Fandel Flood, J.; Thompson, H.; Anderson, L.A.; Wong, G. How Design of Places Promotes or Inhibits Mobility of Older Adults: Realist Synthesis of 20 Years of Research. J Aging Health 2014, 26, 1340–1372. [Google Scholar] [CrossRef] [PubMed] [Green Version]
  71. Foster, C.; Hillsdon, M.; Thorogood, M. Environmental perceptions and walking in English adults. J. Epidemiol. Community Health 2004, 58, 924–928. [Google Scholar] [CrossRef] [Green Version]
  72. Atkins, S.; Husain, M.S.; Storey, A. The Influence of Street Lighting on Crime and Fear of Crime; Home Office Crime Prevention Unit: London, UK, 1991; p. 59. [Google Scholar]
  73. Gim, T.-H.T.; Ko, J. Maximum Likelihood and Firth Logistic Regression of the Pedestrian Route Choice. Int. Reg. Sci. Rev. 2017, 40, 616–637. [Google Scholar] [CrossRef]
  74. Craig, C.L.; Brownson, R.C.; Cragg, S.E.; Dunn, A.L. Exploring the effect of the environment on physical activity: A study examining walking to work. Am. J. Prev. Med. 2002, 23 (Suppl. S2), 36–43. [Google Scholar] [CrossRef]
  75. Kelly, C.E.; Tight, M.R.; Hodgson, F.C.; Page, M.W. A comparison of three methods for assessing the walkability of the pedestrian environment. J. Transp. Geogr. 2011, 19, 1500–1508. [Google Scholar] [CrossRef]
  76. Pain, R.; MacFarlane, R.; Turner, K.; Gill, S. ‘When, Where, if, and but’: Qualifying GIS and the Effect of Streetlighting on Crime and Fear. Environ. Plan. Econ. Space 2006, 38, 2055–2074. [Google Scholar] [CrossRef] [Green Version]
  77. Potgieter, L.J.; Gaertner, M.; O’Farrell, P.J.; Richardson, D.M. Does vegetation structure influence criminal activity? Insights from Cape Town, South Africa. Front. Biogeogr. 2019, 11, 1–15. [Google Scholar] [CrossRef] [Green Version]
  78. Hogendorf, M.; Oude Groeniger, J.; Noordzij, J.M.; Beenackers, M.A.; van Lenthe, F.J. Longitudinal effects of urban green space on walking and cycling: A fixed effects analysis. Health Place 2020, 61, 102264. [Google Scholar] [CrossRef] [PubMed]
  79. Jacobs, J. The Death and Life of Great American Cities; Knopf Doubleday Publishing Group: New York, NY, USA, 1961; p. 466. [Google Scholar]
  80. Kelly, E. What makes women safe? Hous. Rev. 1986, 35, 202–203. [Google Scholar]
  81. Warr, M. Dangerous Situations: Social Context and Fear of Victimization*. Soc. Forces 1990, 68, 891–907. [Google Scholar] [CrossRef]
  82. Wekerle, G.; Whitzman, C. Safe Cities. Guidelines for Planning, Design, and Management; Van Nostrand-Reinhold: New York, NY, USA, 1995. [Google Scholar]
  83. Börjesson, M. Valuing perceived insecurity associated with use of and access to public transport. Transp. Policy 2012, 22, 1–10. [Google Scholar] [CrossRef] [Green Version]
  84. Lee, S.; Han, M.; Rhee, K.; Bae, B. Identification of Factors Affecting Pedestrian Satisfaction toward Land Use and Street Type. Sustainability 2021, 13, 10725. [Google Scholar] [CrossRef]
  85. Hale, C. Fear of Crime: A Review of the Literature. Int. Rev. Vict. 1996, 4, 79–150. [Google Scholar] [CrossRef]
  86. Hirtenlehner, H.; Farrall, S. Is the ‘Shadow of Sexual Assault’ Responsible for Women’s Higher Fear of Burglary? Br. J. Criminol. 2014, 54, 1167–1185. [Google Scholar] [CrossRef] [Green Version]
  87. Otis, M.D. Perceptions of Victimization Risk and Fear of Crime among Lesbians and Gay Men. J. Interpers. Violence 2007, 22, 198–217. [Google Scholar] [CrossRef] [PubMed]
  88. Yates, A.; Ceccato, V. Individual and spatial dimensions of women’s fear of crime: A Scandinavian study case. Int. J. Comp. Appl. Crim. Justice 2020, 44, 277–292. [Google Scholar] [CrossRef] [Green Version]
  89. Loukaitou-Sideris, A. Is it safe to walk here? Design and policy responses to women’s fear of victimization in public places. Transp. Res. Board 2005, 2, 102–112. [Google Scholar]
  90. Uteng, T.P.; Cresswell, T. Gendered Mobilities; Ashgate Publishing, Ltd.: Farnham, UK, 2008; 296p. [Google Scholar]
  91. Ceccato, V.; Paz, Y. Crime in São Paulo’s metro system: Sexual crimes against women. Crime Prev. Community Saf. 2017, 19, 211–226. [Google Scholar] [CrossRef] [Green Version]
  92. Kash, G. Always on the defensive: The effects of transit sexual assault on travel behavior and experience in Colombia and Bolivia. J. Transp. Health 2019, 13, 234–246. [Google Scholar] [CrossRef]
  93. Mackett, R.L. The health implications of inequalities in travel. J. Transp. Health 2014, 1, 202–209. [Google Scholar] [CrossRef]
  94. Malik, B.Z.; Rehman, Z.; Khan, A.H.; Akram, W. Women’s mobility via bus rapid transit: Experiential patterns and challenges in Lahore. J. Transp. Health 2020, 17, 100834. [Google Scholar] [CrossRef]
  95. Orozco-Fontalvo, M.; Soto, J.; Arévalo, A.; Oviedo-Trespalacios, O. Women’s perceived risk of sexual harassment in a Bus Rapid Transit (BRT) system: The case of Barranquilla, Colombia. J. Transp. Health 2019, 14, 100598. [Google Scholar] [CrossRef]
  96. Instituto de Estadística y Cartografía de Andalucía. Directorio de Establecimientos con Actividad Económica en Andalucía. Andalucía Pueblo a Pueblo—Fichas Municipales. 2020. Available online: https://www.juntadeandalucia.es/institutodeestadisticaycartografia/sima/ficha.htm?%20mun=18087 (accessed on 9 December 2021).
  97. Talavera-Garcia, R.; Soria-Lara, J.A. Q-PLOS, developing an alternative walking index. A method based on urban design quality. Cities 2015, 45, 7–17. [Google Scholar] [CrossRef]
  98. Grindlay, A.L.; Ochoa-Covarrubias, G.; Lizárraga, C. Urban Mobility and Quality of Public Spaces: The Case of Granada, Spain; Urban Transport XXVI; WIT Press: Southampton, UK, 2020; Volume 200, pp. 37–48. [Google Scholar]
  99. Ferrer, S.; Ruiz, T. The impact of the built environment on the decision to walk for short trips: Evidence from two Spanish cities. Transp. Policy 2018, 67, 111–120. [Google Scholar] [CrossRef]
  100. Ayuntamiento de Granada. Plan de Movilidad Urbana Sostenible de Granada. 2013. Available online: http://www.movilidadgranada.com/pmus_index.php#descarga (accessed on 9 December 2021).
  101. Canal UGR. La UGR Representa el 6.12% del PIB Granadino, y Genera el 7,7% del Empleo de la Provincia. 2020. Available online: https://canal.ugr.es/noticia/ugr-representa-612-pib-granadino-y-genera-77-empleo-provincia/ (accessed on 9 December 2021).
  102. Universidad de Granada. Campus de la UGR. 2021. Available online: https://www.ugr.es/universidad/campus (accessed on 9 December 2021).
  103. Institute for Economics & Peace. Global Peace Index 2019: Measuring Peace in a Complex World. Sydney. 2019. Available online: http://visionofhumanity.org/reports (accessed on 9 December 2021).
  104. Ministerio del Interior. Balance de Criminalidad, 2019; Gobierno de España. Ministerio del Interior: Madrid, Spain, 2020.
  105. Numbeo. Crime and Security indexes. 2021. Available online: https://es.numbeo.com/criminalidad (accessed on 9 December 2021).
  106. Miralles-Guasch, C. Las encuestas de movilidad y los referentes ambientales de los transportes. EURE Santiago 2012, 38, 33–45. [Google Scholar] [CrossRef] [Green Version]
  107. Ma, L.; Dill, J. Associations between the objective and perceived built environment and bicycling for transportation. J. Transp. Health 2015, 2, 248–255. [Google Scholar] [CrossRef]
Figure 1. Districts and university campus in Granada city. Source: Own elaboration from IECA (2020) and University of Granada (2021).
Sustainability 14 01880 g001
Table 1. Specific security. Built environment attributes.
Walkability DimensionBuilt Environment Attributes
Design and street patternsLighting
Darkness
Cleaning
Vegetation
Underground passages
Waste ground
Spaciousness
Pedestrian zone
Stairs
DiversityOpen stores
Pubs
Official buildings
DensityHigh people density
Traffic density
Table 2. Descriptive statistics of the sample (N = 312 individuals).
VariableMeanSDMinMax
Prefwalk0.6030.4900.0001.00
Walk0.5320.5000.0001.00
Socioeconomic characteristics
Gender0.6890.4640.0001.00
Age21.71.8718.025.0
Employment0.2150.4110.0001.00
Locational characteristics
Home0.2820.4510.0001.00
Campus0.5130.5010.0001.00
Walkability dimension. Built environment attributes
Design and street patterns
Lighting4.0451.0841.005.00
Darkness2.0291.001.005.00
Cleaning3.3471.1551.005.00
Vegetation3.1291.1001.005.00
Underground passages1.4430.6941.004.00
Waste ground1.4080.7131.004.00
Spaciousness3.9941.0551.005.00
Pedestrian zone3.7311.1261.005.00
Stairs2.2730.9601.005.00
Diversity
Open stores4.2780.9971.005.00
Pubs2.8131.1451.005.00
Official buildings3.5151.0831.005.00
Density
High people density4.1471.0751.005.00
Traffic density3.1481.1741.005.00
General insecurity walking
Insec_walk0.3590.4800.0001.00
Table 3. Specific security related to built environment attributes. Rotated Component Loading a.
Built Environment AttributesF1_FacilitatorsF2_DeterrentsF3_People
Spaciousness0.830.050.181
Open stores0.812−0.0090.389
Pedestrian zone0.7740.184−0.025
Lighting0.764−0.0270.197
High people density0.7270.0130.45
Cleaning0.7020.136−0.052
Official buildings0.6380.2170.18
Vegetation0.580.507−0.277
Traffic density0.5360.1330.419
Underground passages0.0140.8180.192
Waste ground−0.0230.8140.142
Stairs0.1650.6910.453
Darkness0.2060.594−0.154
Pubs0.2270.1720.744
Variable principal normalization. a Rotation method: Varimax with Kaiser normalization. The rotation has converged in 6 iterations.
Table 4. Logit model results. Dependent variable Prefwalk.
Mod1.1Mod1.2Mod1.3Mod1.4
VariableCoef.Coef.Coef.Coef.
const1.07540.4250−0.5428 0.62554
Socioeconomic characteristics
Gender−1.1321 ***
(0.3223)
−1.2060 ***
(0.2994)
−0.972***
(0.378)
−0.742 **
(0.476)
Age0.0086
(1.0086)
0.0342
(1.0348)
0.0752
(1.078)
0.052
(1.053)
Employment−0.1331
(2.9312)
0.0112
(1.0113)
−0.0830
(0.920)
−0.050
(0.951)
Locational characteristics
Home--1.0375 ***
(2.8220)
0.955 ***
(2.599)
0.860 **
(2.364)
Campus--−0.2994
(0.7413)
−0.267
(0.766)
−0.261
(0.770)
Factors: Specific security related to built environment attributes
F1_ Facilitators----0.118
(1.126)
0.093
(1.098)
F2_Deterrents----0.567 ***
(1.763)
0.356 **
(1.428)
F3_People----0.197
(1.218)
0.198
(1.220)
General insecurity walking
Insec_walk------−2.120 ***
(0.120)
R2-McFadden0.04320.07630.12240.2627
AIC409.1708399.2948385.995329.145
% success60.361.566.377.9
Notes: n = 312; ** p < 0.05, *** p < 0.01; AIC = Akaike information criterion; odds-ratio in bracket.
Table 5. Logit model results. Dependent variable Walk.
Mod2.1Mod2.2Mod2.3Mod2.4
VariablesCoef.Coef.Coef.Coef.
const0.0631−1.5032−1.386−1.061
Socioeconomic characteristics
Gender0.0799
(1.0832)
−0.0495
(0.9517)
−0.081
(0.922)
0.027
(1.027)
Age0.0032
(1.0032)
0.0459
(1.0470)
0.0420
(1.043)
0.034
(1.034)
Employment−0.2768
(0.7582)
−0.3860
(0.6798)
−0.384
(0.681)
−0.370
(0.691)
Locational characteristics
Home--0.9966 ***
(2.7091)
0.9829 ***
(2.6723)
0.924 ***
(2.518)
Campus--0.9693 ***
(2.6360)
0.961 ***
(2.613)
0.999 ***
(2.714)
Factors: Specific security related to built environment attributes
F1_ Facilitators----−0.026
(0.974)
−0.043
(0.958)
F2_Deterrents----−0.061
(0.940)
−0.137
(0.872)
F3_People----0.068
(1.070)
0.057
(1.060)
General insecurity walking
Insec_walk------−0.638 **
(0.528)
R2-McFadden0.00260.07880.08020.0932
AIC438.1192409.2778414.668411.039
% success54.260.960.663.5
Notes: n = 312; ** p < 0.05, *** p < 0.01; AIC = Akaike information criterion; odds-ratio in bracket.
Publisher’s Note: MDPI stays neutral with regard to jurisdictional claims in published maps and institutional affiliations.

