
Assessing the Impact of a New Urban Greenway Using Mobile, Wearable Technology-Elicited Walk- and Bike-Along Interviews


Abstract
1. Introduction
2. Methods
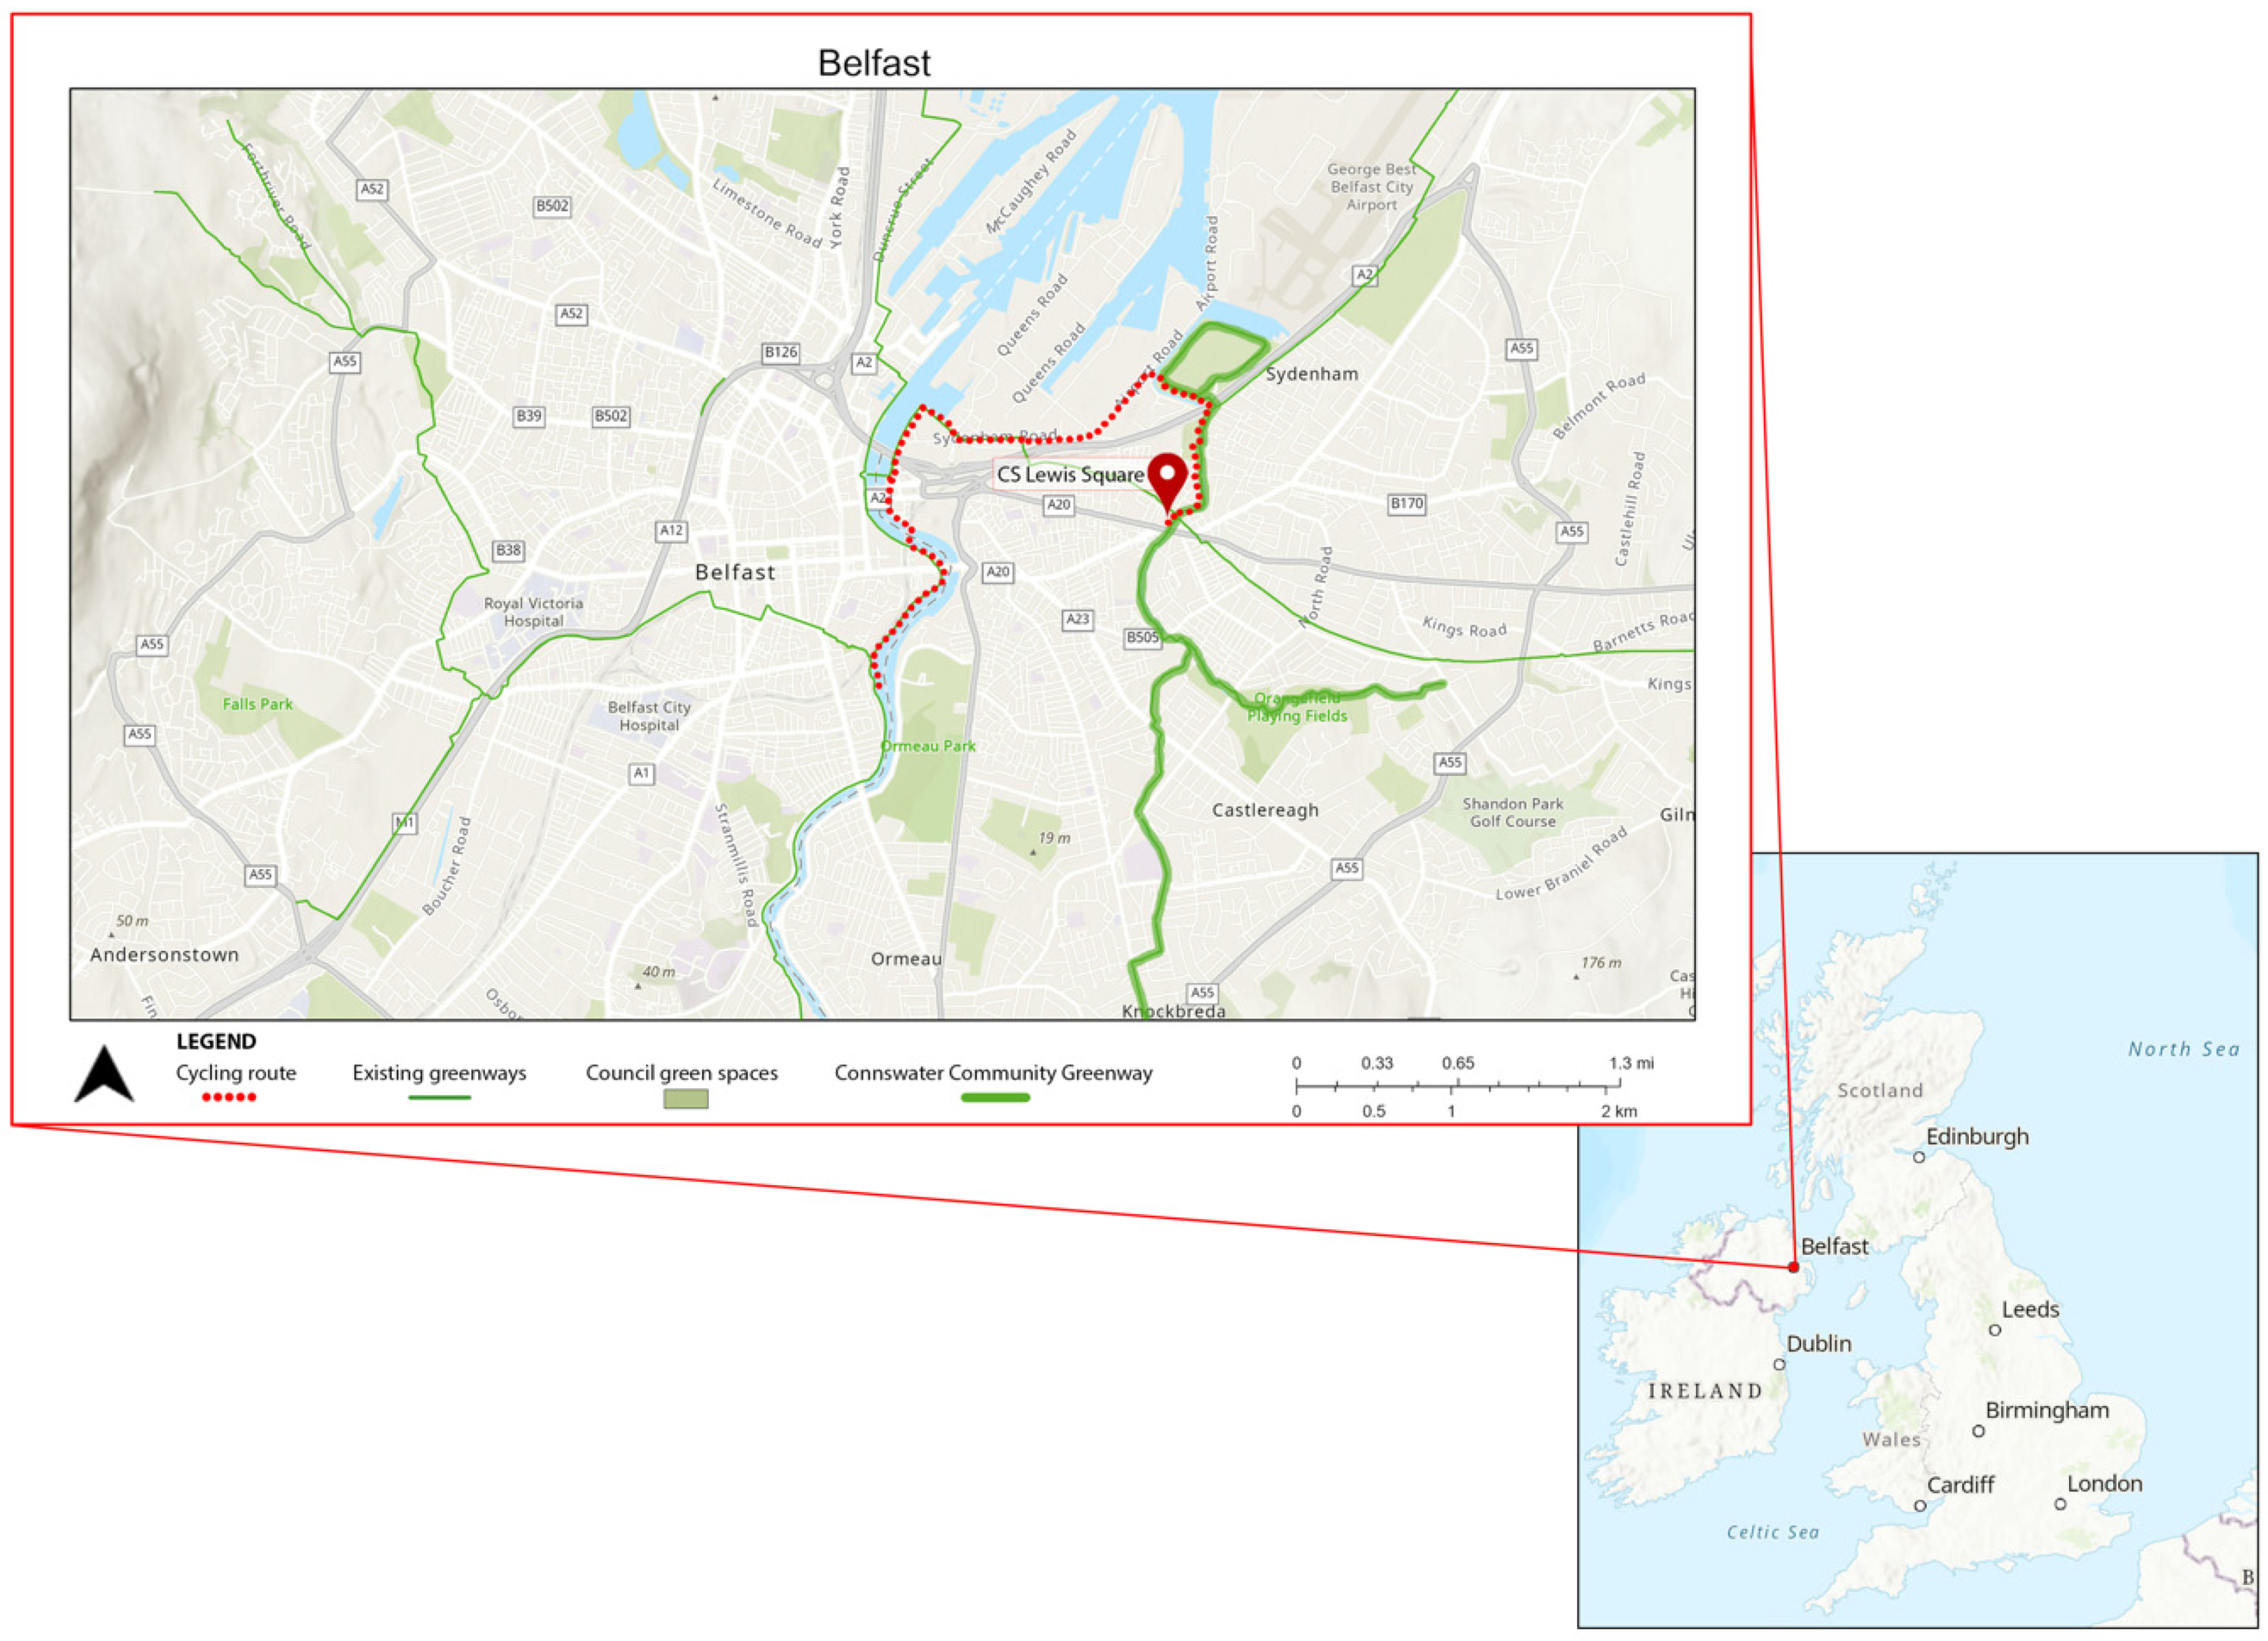
2.1. Study Context
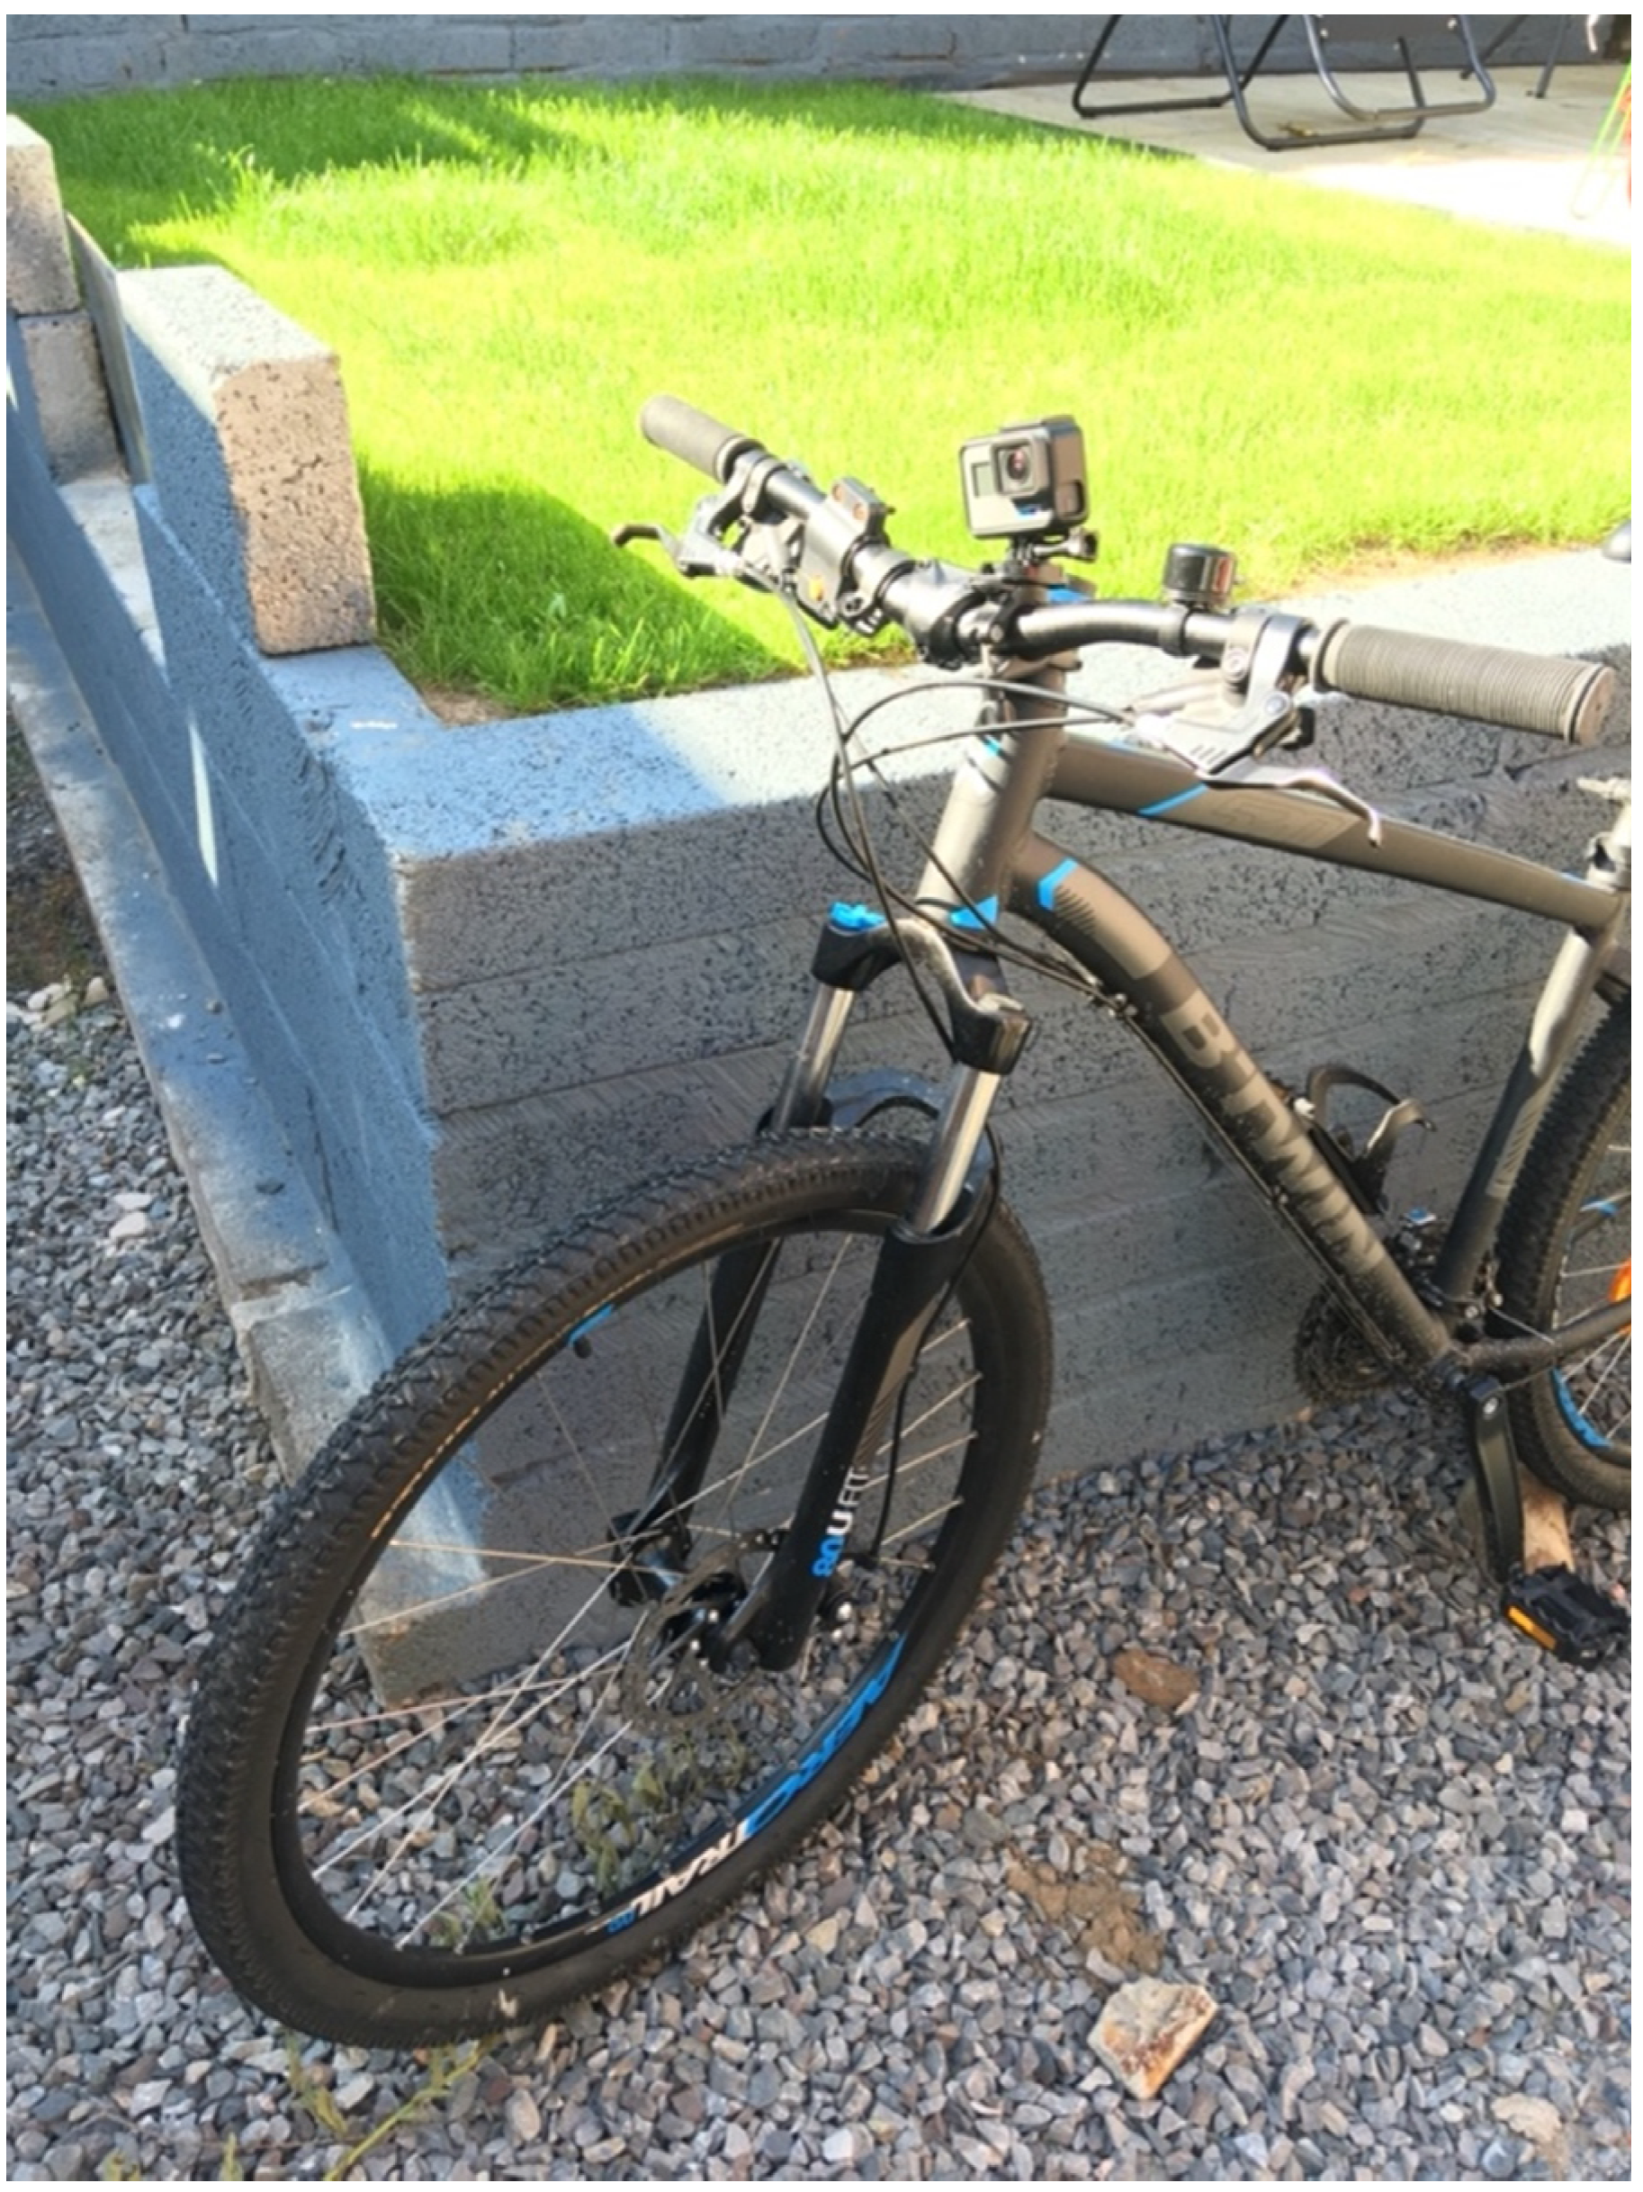
2.2. Data Collection
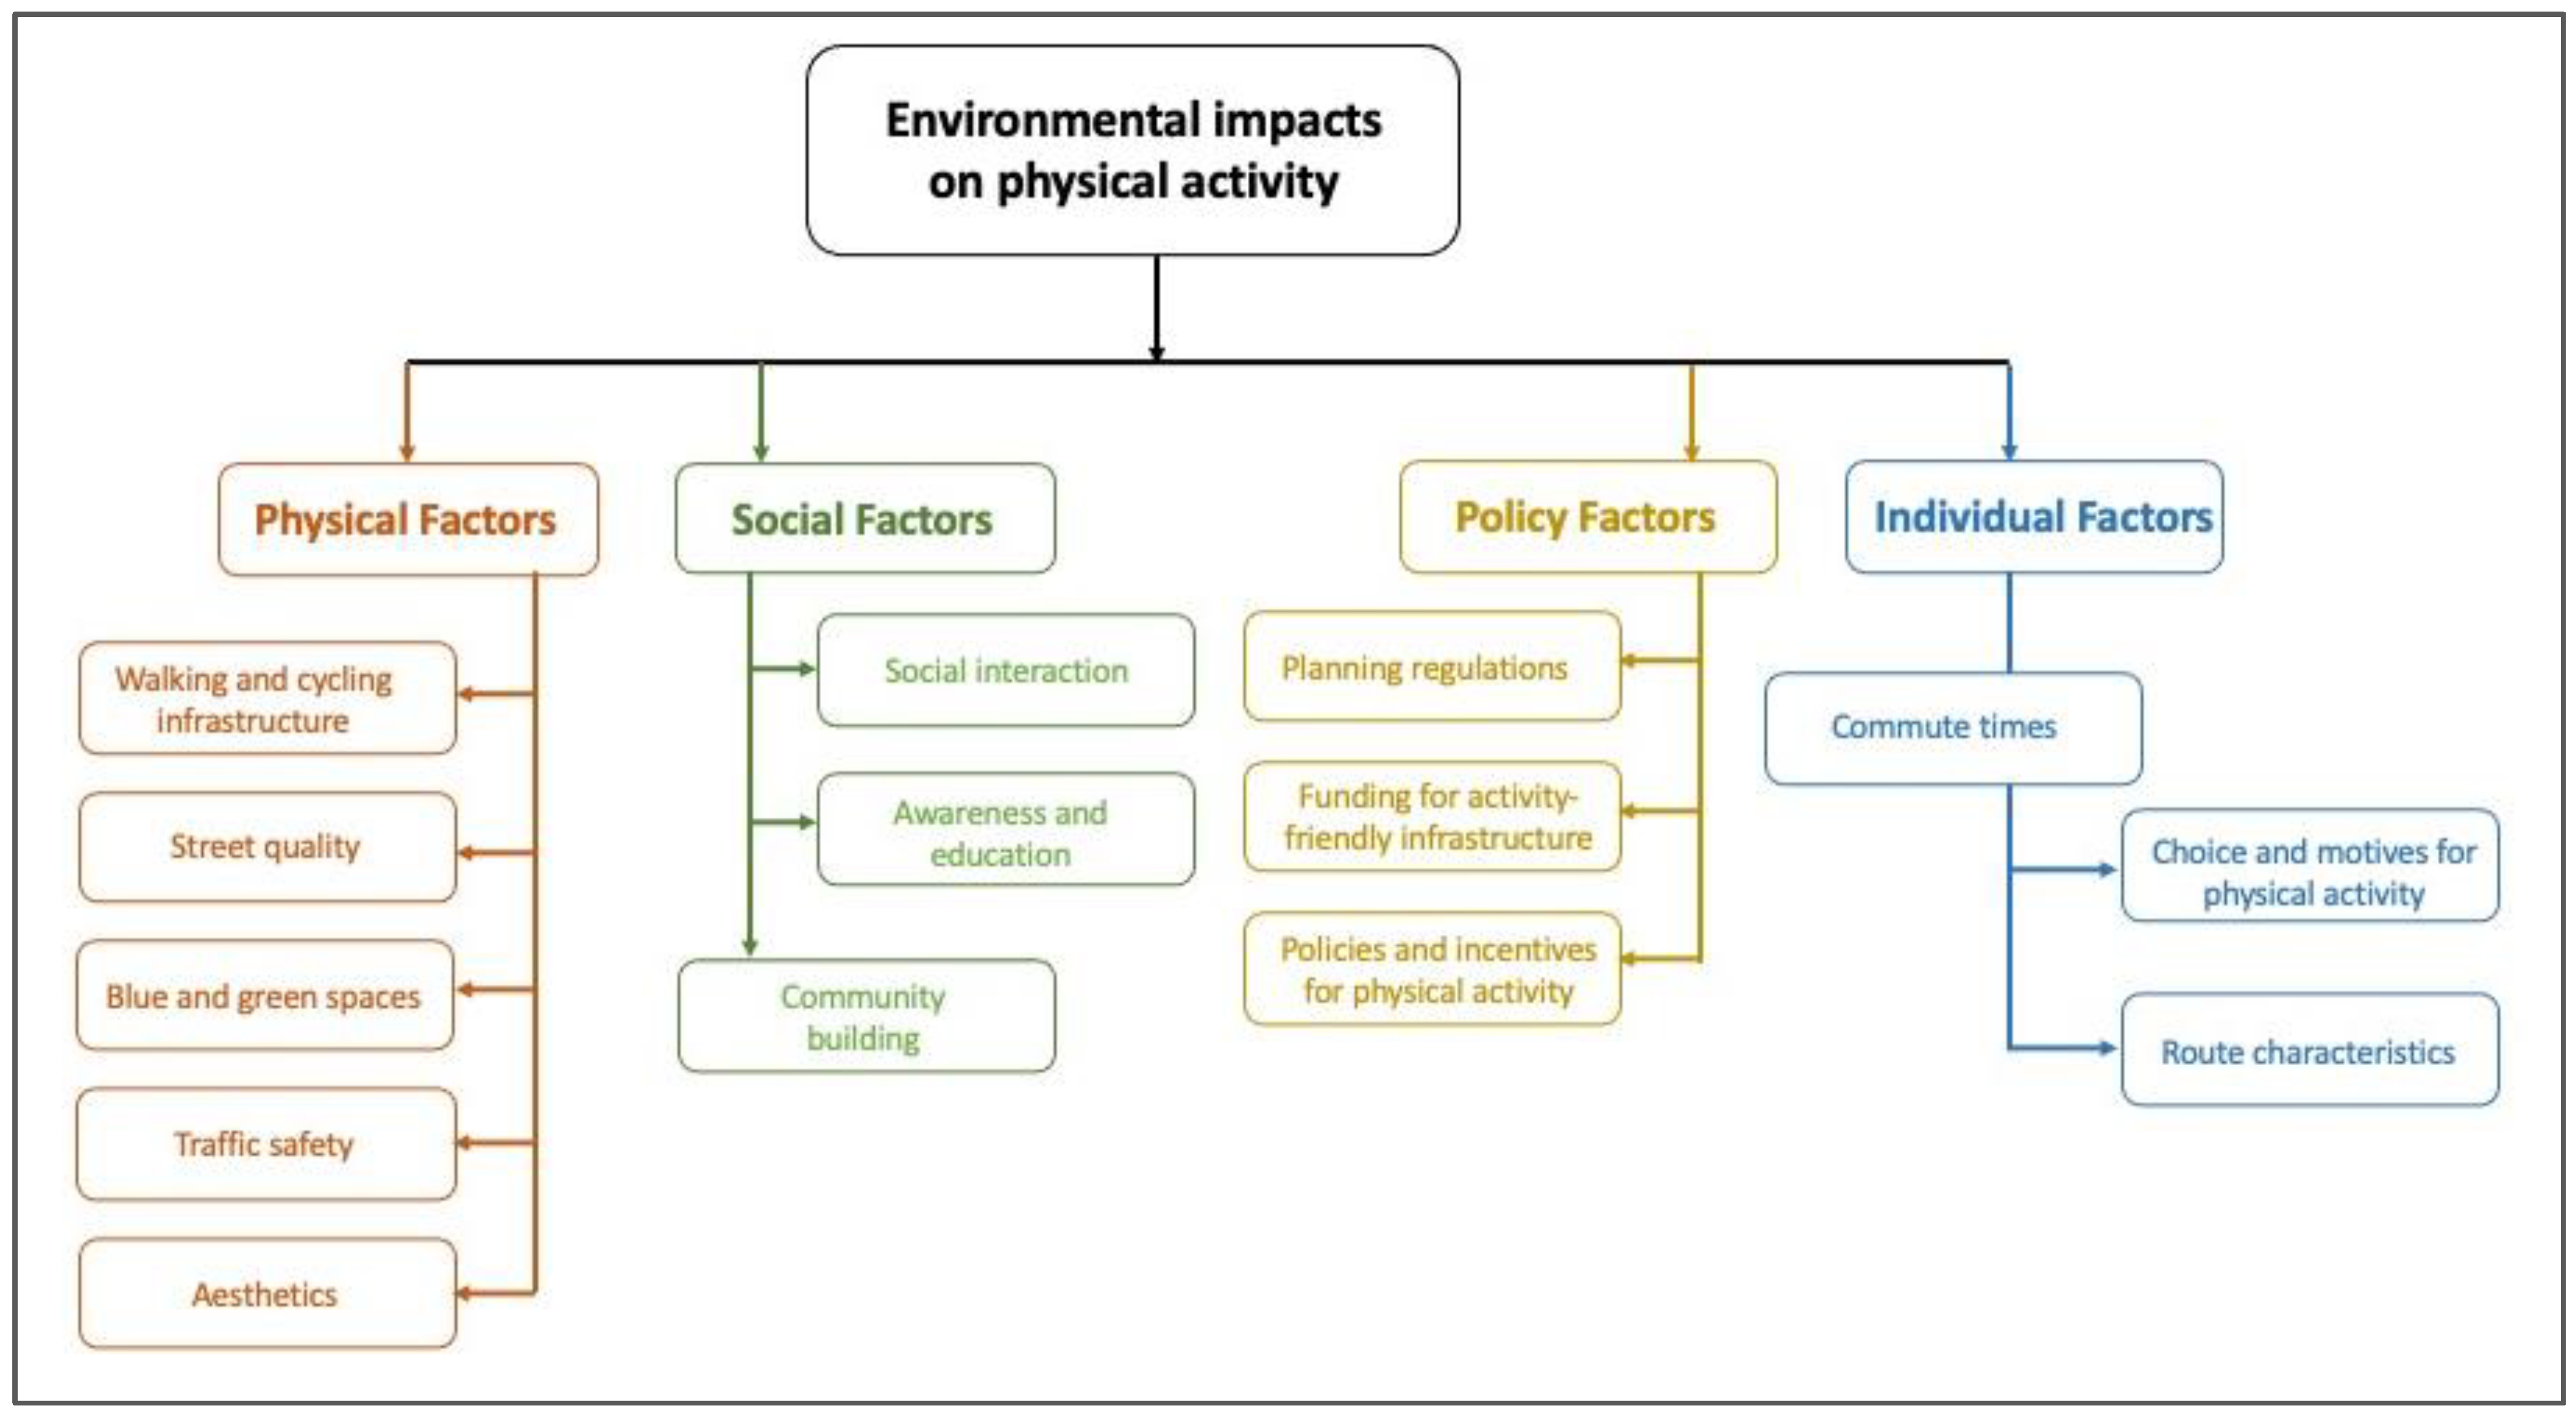
3. Results
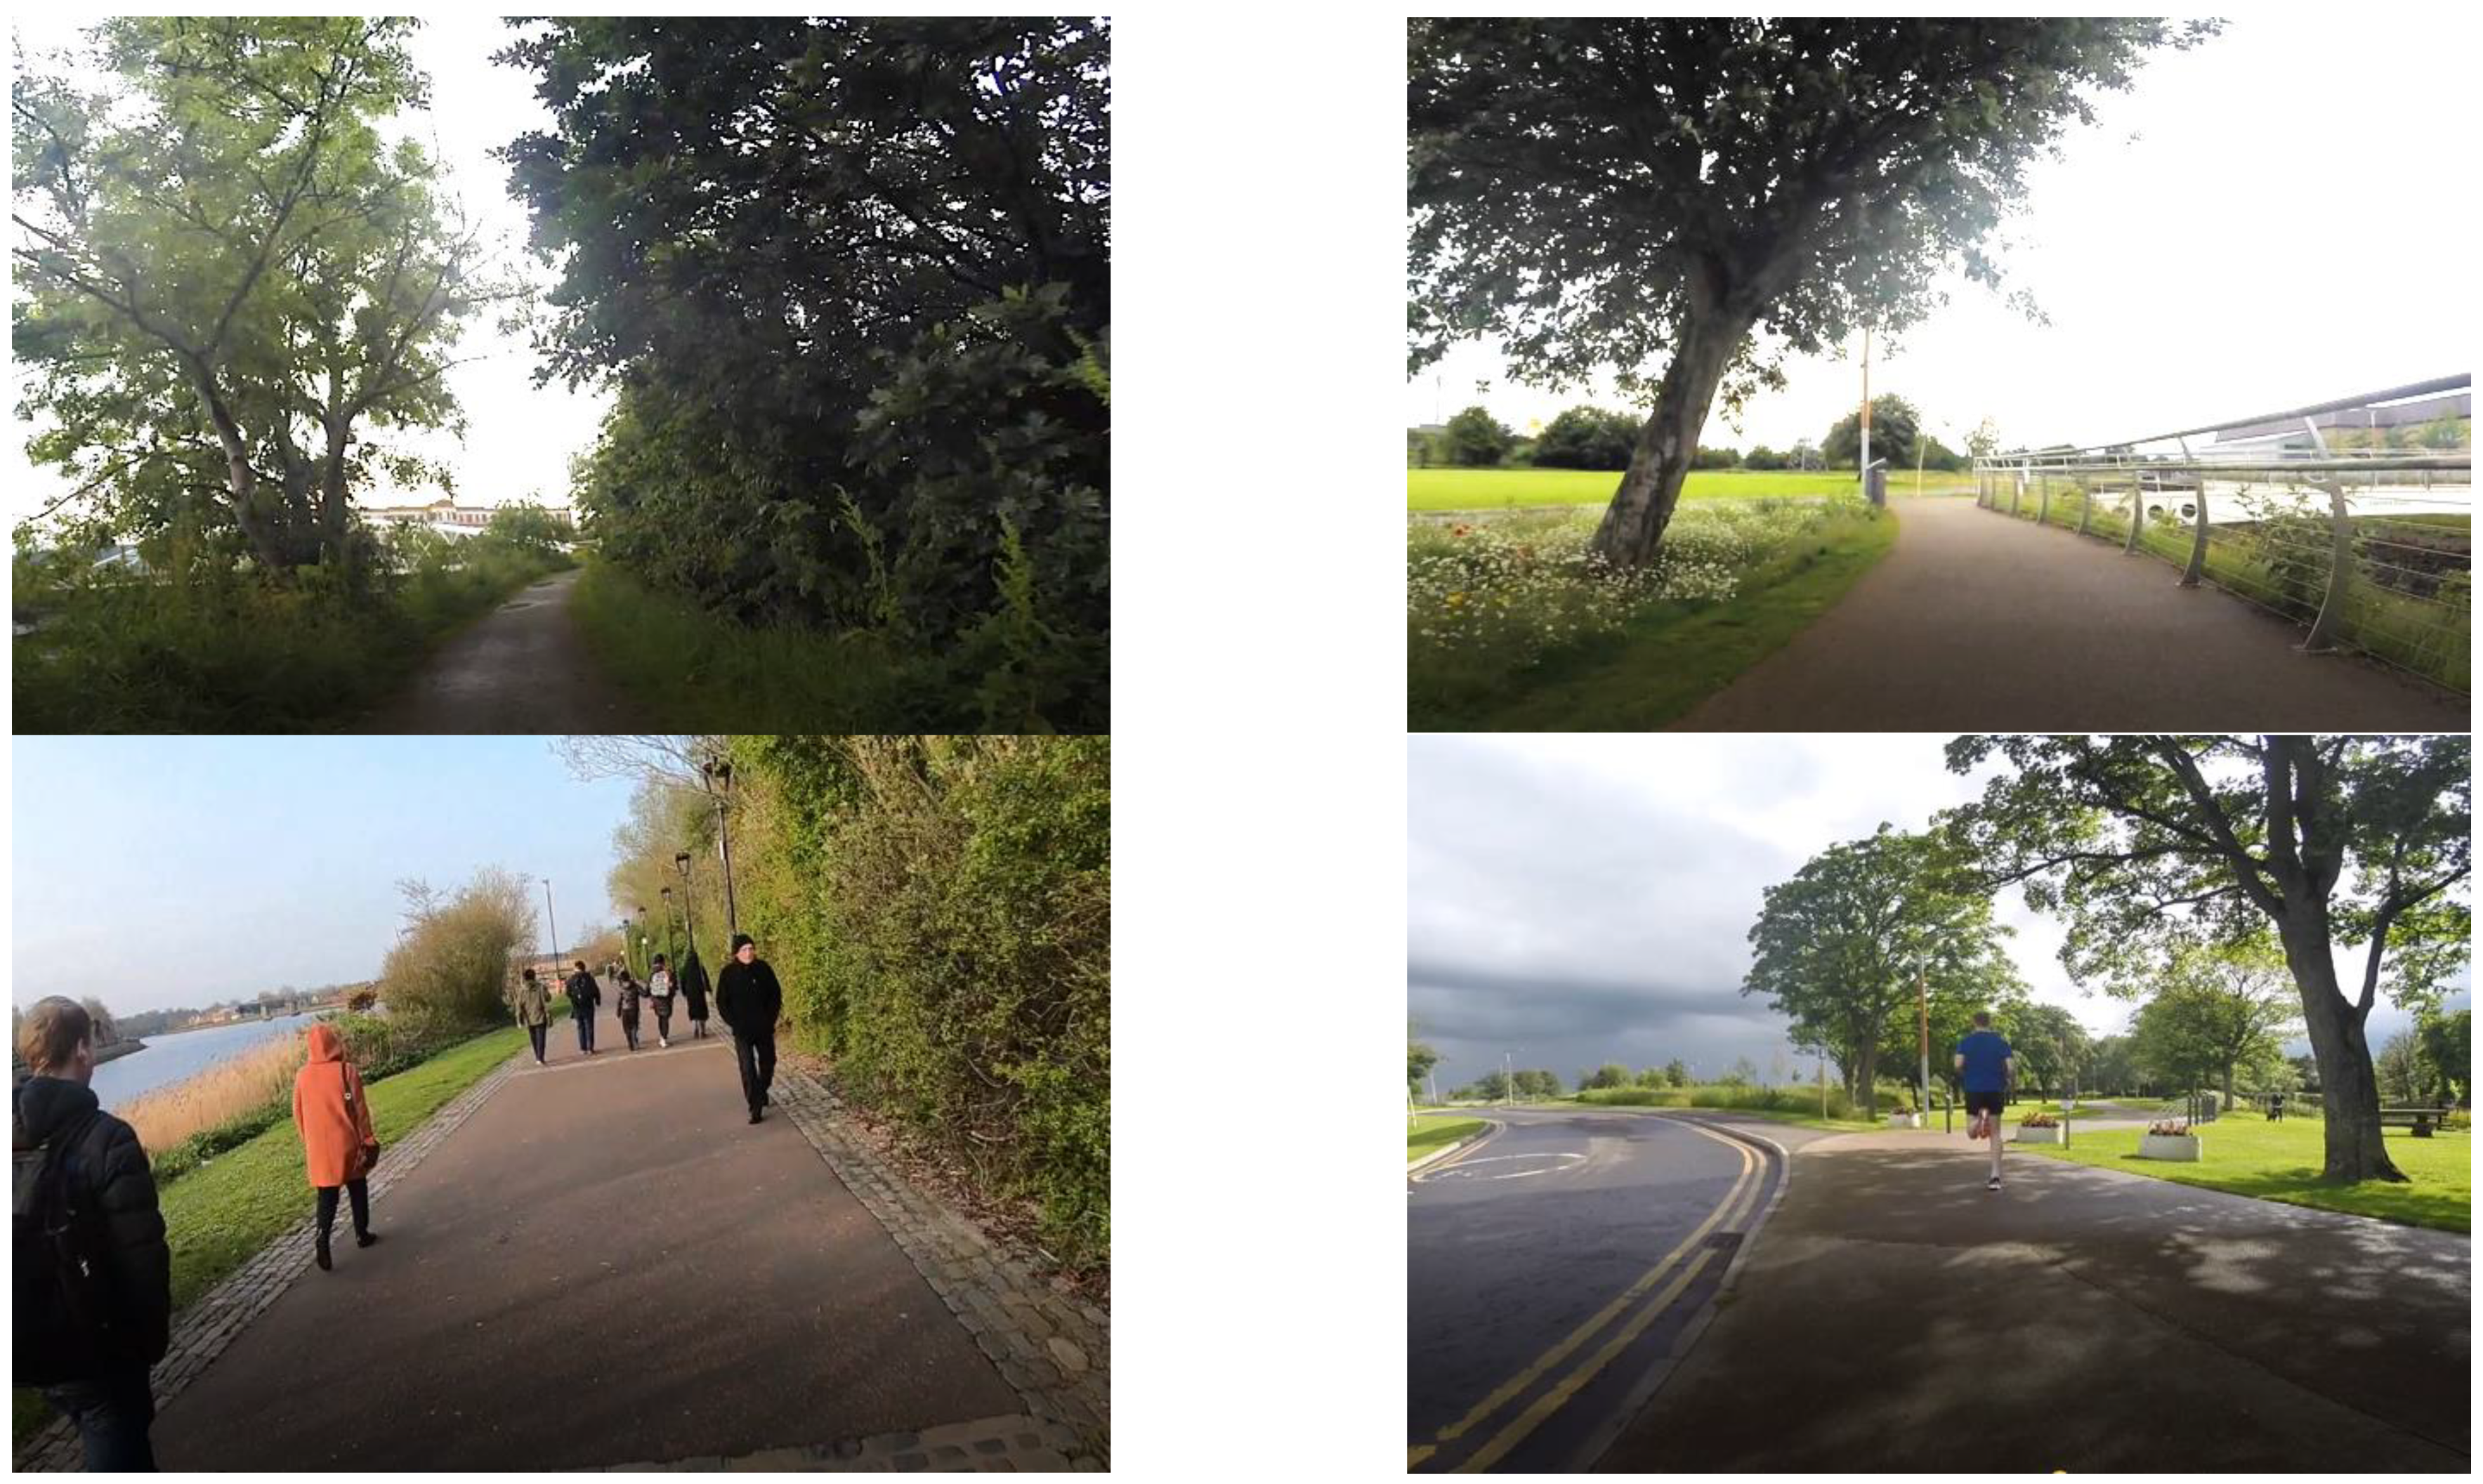
3.1. Physical Factors
“It’s a lovely space, big wide path around it now, which can comfortably accommodate cyclists and pedestrians, so feels very safe.”(Male, age 65)
“That bit we just looked at the video that would be more what I would come here for leisure on a Sunday with a family or every Saturday come down, would come down this way to go to the park. It’s not the quickest way but we do it because it’s scenic.”(Female, age 31)
“I like this bridge especially at night and because it’s well lit up, so this is real kind of attraction and a safety feature. You don’t feel like you’re going to hit a pedestrian.”(Female, age 28)
“After along day at work, the greenery here offers a break and helps calm me down. It is like a soothing balm for the daily stress and busy lives. Going out for a walk or run uplifts my mood immediately.”(Female, age 38)
“Wonderful again, because you’re seeing the city, you’re seeing the water, you’re seeing the reflections, and if you look to your right, you’re seeing all the boats. So really pleasant, feels spacious with the Odyssey building [a sports and entertainment complex] on your left. It’s a nice, pleasant approach to the city centre and the new bridge.”(Male, age 52)
“It really does feel like you’re almost in the countryside here. Sitting here on a bench and breathing in fresh air, smelling the flowers, and just watching the ducks in the lake and different birds in the trees helps me connect with nature and makes me happy.”(Female, age 66)
“I did notice that it was going along, so you do hear some birds, bird song and things which is really nice, does give you the feel that you’re actually, you know in the countryside in a nice rural setting.”(Male, age 71)
“I think it’s quite nice. And then there is lake here, and I saw some swans there, it is very lovely to see some wild animals in parks. And you can see the kids play with the birds…it’s very nice park and in summertime I know this park is really beautiful. You can see the swans and pigeons. It’s not very frequent to see these animals in parks in Belfast. So maybe that would be a motivation for me to visit this park again.”(Female, age 48)
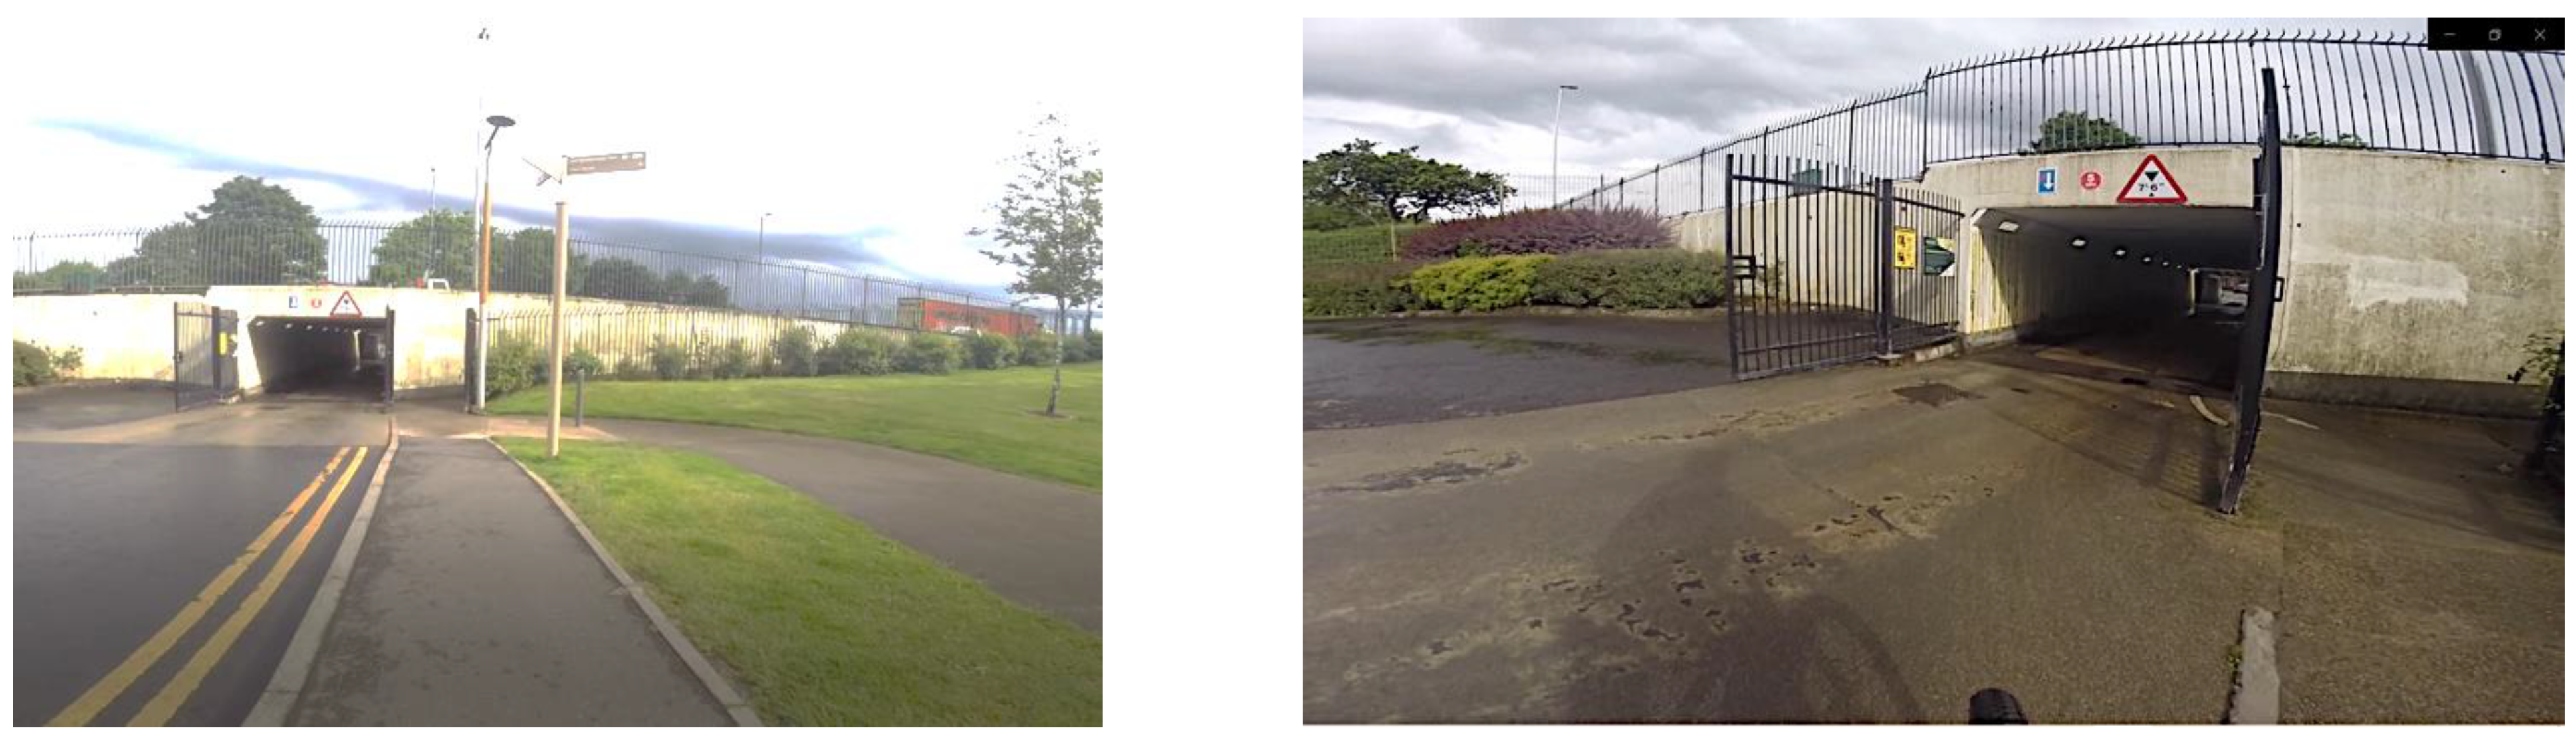
“An issue I have with this part coming into the tunnel is that you really risk getting hit by a car because as the tunnel is really long and very dark you can’t see out.”(Male, age 33)
“The tunnel is a bit awkward. It’s hard to see who’s coming through the tunnel. On the way out, it’s evident cars coming down and there’s also some pedestrians in the tunnel so trying to manoeuvre around a car and pedestrians in the tunnel.”(Female, age 41)
“Challenge is really going into Victoria Park because you’ve got a tunnel, so you do have to be careful particularly if you are with group, you have to look out for the traffic, the visibility going into the park is a bit of a blind corner, dark in the tunnel, and it is not lit.”(Male, age 44)
“This is particularly a bad area now, from a cyclist point of view, because that not really thought out how best to cross here, now there’s a new road going in, and we hope that they’ll improve this crossing. This is again a safe wide footpath. You just need to be mindful that there’s traffic about, and traffic cutting in here. So, good sign to let you know you’re on a route for pedestrians and cyclists.”(Male, age 52)
“They don’t tend to think that people are using that walkway. Because it’s an industrial estate there is an assumption that it’s cars and stuff so there’s not a lot of foot passenger and so there’s sometimes issues with them blocking the paving.”(Female, age 46)
“Try to educate people and make them think a bit more about their use of the greenway, whether it’s cyclists who go too fast, and people with dogs either who should be on leads, or dogs that are on big, long leads, and people who just stop suddenly in the middle of the greenway.”(Female, age 53)
3.2. Social Factors
“In terms of the greenway, and this infrastructure that currently is in place, it is kind of a factor enabling people to talk to people who they don’t know, talking to strangers that maybe you wouldn’t normally do… I think it’s hugely important. I mean along the greenway or in the park or C.S. Lewis square you meet people from different areas. On your street you meet your neighbours who are all maybe the same social status as yourself, but down here middle-class people can meet working-class, kids can meet adults. It’s a big benefit, I think, of having a greenway.”(Female, age 41)
“However, I think particularly for people you know living in maybe you know built up areas or areas where they don’t necessarily have a garden, having something like this on your doorstep as really a fabulous open space for people.”(Female, age 45)
“I was thinking about there’s an event here on Saturday. That’s the 24 h non-stop run. So, some people will run the equivalent of five marathons without stopping. They go all night, so I was starting to think a wee bit about that because we’ll come down and watch that for a bit.”(Male, age 62)
“Again, got little bins good, well maintained area, there’s a new shelter which is really good, and I noticed for events, so that’s good to see, a thing that’s just opened recently. And there’s a play park here for children, so I always feel safe when I’m cycling around here.”(Female, age 46)
“It’s hugely important I mean along the Greenway or in the park or C.S. Lewis square you meet people from different areas. I mean you know, on your street you meet your neighbours who are all maybe the same social status as yourself.”(Male, age 71)
“In terms of the greenway, and this infrastructure that currently is in place. Is it kind of a factor enabling people to talk to people who they don’t know. You know talking to strangers that maybe you wouldn’t normally do.”(Male, age 62)
3.3. Policy Factors
“We have repeatedly submitted appeals to the city council to create a linked bicycle network, but no one has acknowledged our requests.”(Male, age 52)
“We need to create more greenways across the city and the island at large. However, sadly, policymakers are focused on providing more parking spaces and encouraging car dependency. The greenway should be a role model for other councils and help them realise that green infrastructure has many benefits for health, physical and mental.”(Male, age 44)
“I cycle to work every day. The greenway is excellent and safe, but the stretches where I have to cycle on the road are very risky. I am a member of a local bicycling community group and we have presented these issues to the authorities, but it is obvious that motorised traffic takes greater priority.”(Female, age 28)
“It will be useful to use government funding sources to pay for protected bike lanes, rather than expanding road widths for vehicles.”(Male, age 38)
”There is so much emphasis on infrastructure for cars, but very little revenue for pedestrians and cyclists. We are all equal road users, but the city’s policies do not reflect that.”(Male, age 52)
“We should have more car-free days and targeted initiatives that make it easier and safer for for people of all ages and abilities to ride.”(Female, age 31)
“Workplaces must encourage employees to cycle to work which can result in a healthier, more productive workforce. It is well-known that cyclists tend to take fewer days off sick and save the company money.”(Male, age 42)
“Cycling is so much faster than driving, especially over short distances and when the roads are busy. It’s easier for me to bypass traffic jams and I don’t need much space at all to park once I arrive at work. I wish employers had office bikes or ‘pool’ bikes that would encourage more people to bike.”(Female, age 46)
3.4. Individual Factors
“It’s basically a route to get you from A to B. It’s not for the visual experience or the environmental experience. It’s simply a functional cycling route, which I would use if it’s wet cold one day. You know, it’s the most direct route.”(Male, age 42)
“So, it’s really handy that if I’m coming home, and I’m like oh I need milk, I know there’s a shop where I will have secure bike parking and it’s easy access and I can do it and obviously it gets more difficult when I have a bigger shop because I don’t have like a car.”(Male, age 38)
“The weather can be a factor, but it only becomes more of a deciding factor when it’s snowing or there is ice because the greenways aren’t salted.”(Male, age 71)
“I don’t mind the rain because I’ve normally got my wet gear, but if it’s windy at the same time as rain, that’s tough. So yeah, probably just really bad weather.”(Female, age 53)
“I don’t cycle for commuting reasons, so it’s probably only for leisure time, so if it is raining, it is not going to be enjoyable, so I would say I’m not going to cycle when the weather is not good here.”(Female, age 38)
“We do not own a car, so having this route so close to where we live is very convenient. It helps me and my partner cycle to work every day, and the cost savings for us are significant.”(Male, age 42)
“Walking or cycling is easy on the pocket. My bicycle was cheap to get, it is almost free to maintain, and it helps me get anywhere I need to be in the city.”(Male, age 37)
“We cannot afford to buy a new car now, so the greenway gave us a new lifeline. I was able to buy bicycles for myself and my kids. We all cycle together for the school runs in the morning and afternoon. It is actually very enjoyable, and my kids look forward to the rides.”(Female, Age 38)
“I only cycle in the parks because there is no traffic. I am afraid of being knocked over by traffic when I am cycling on the road, so I avoid it.”(Male, age 42)
”It is risky. In the mornings especially, cycling on the road in all the traffic feels very dangerous. There are some intersections which are very dangerous and drivers do not give cyclists any space to navigate.”(Female, age 28)
“I would use it throughout the day, but I tend to actually plan my cycling around times that isn’t peak traffic. I tend to not cycle during the busiest times of the day, so during rush hour, so normally, I think at the stage after six in the evening, so it’s kind of a lot quieter.”(Female, age 38)
“I like that it’s not on a road. It’s direct. You know it’s a strip route from the square to the park. Cuts a lot of traffic. Cuts a lot of public highways.”(Male, age 38)
“Some days that you are just not feeling the best, low mood, go out cycling and it lifts you; you forget about yourself. That’s a good thing. Nothing is as bad as just sitting in the house. I got into cycling, you know I had an aversion to the Newtownards Road, and I wanted to hide from people, and my health has improved, my mental health has improved significantly.”(Female, age 48)
“One reason why I just love this here. It’s safe. Because I had a bad accident, and I got knocked off my bicycle about two and a half years, ended up in the hospital, so and I still haven’t recovered mentally to cycle on roads, I just don’t like roads, don’t like roads.”(Female, age 46)
4. Discussion
4.1. Summary of Findings
4.2. Relevance of the Findings to the COVID-19 Pandemic
4.3. Implications in Terms of Individual-Level Influences on Physical Activity
4.4. Implications in Terms of Social Environment Influences on Physical Activity
4.5. Implications in Terms of Physical Environment Influences on Physical Activity
4.6. Strengths and Limitations
4.7. Recommendations for Future Research
5. Conclusions
Author Contributions
Funding
Institutional Review Board Statement
Informed Consent Statement
Data Availability Statement
Acknowledgments
Conflicts of Interest
References
- World Health Organization. WHO Guidelines on Physical Activity and Sedentary Behaviour; WHO: Generva, Switzerland, 2020.
- World Health Organisation. Obesity and Overweight–Factsheet; WHO: Generva, Switzerland, 2018.
- Guthold, R.; Stevens, G.A.; Riley, L.M.; Bull, F.C. Worldwide trends in insufficient physical activity from 2001 to 2016: A pooled analysis of 358 population-based surveys with 1.9 million participants. Lancet Glob. Health 2018, 6, e1077–e1086. [Google Scholar] [CrossRef]
- National Health Service. Statistics on Obesity, Physical Activity and Diet, England; NHS: Leeds, UK, 2019.
- Public Health England. Physical Activity: Applying All Our Health. 2019. Available online: https://www.gov.uk/government/publications/physical-activity-applying-all-our-health/physical-activity-applying-all-our-health (accessed on 20 October 2021).
- Sport England. Active Lives Survey; Sport England: Londen, UK, 2019. [Google Scholar]
- Stockwell, S.; Trott, M.; Tully, M.; Shin, J.; Barnett, Y.; Butler, L.; McDermott, D.; Schuch, F.; Smith, L. Changes in physical activity and sedentary behaviours from before to during the COVID-19 pandemic lockdown: A systematic review. BMJ Open Sport Exerc. Med. 2021, 7, e000960. [Google Scholar] [CrossRef] [PubMed]
- Tully, M.A.; McMaw, L.; Adlakha, D.; Blair, N.; McAneney, J.; McAneney, H.; Carmichael, C.; Cunningham, C.; Armstrong, N.C.; Smith, L. The effect of different COVID-19 public health restrictions on mobility: A systematic review. PLoS ONE 2021, 16, e0260919. [Google Scholar] [CrossRef] [PubMed]
- World Health Organization. Global Recommendations on Physical Activity for Health; WHO: Generva, Switzerland, 2019.
- Sallis, J.F.; Cerin, E.; Kerr, J.; Adams, M.A.; Sugiyama, T.; Christiansen, L.B.; Schipperijn, J.; Davey, R.; Salvo, D.; Frank, L.D.; et al. Built Environment, Physical Activity, and Obesity: Findings from the International Physical Activity and Environment Network (IPEN) Adult Study. Annu. Rev. Public Health 2020, 41, 119–139. [Google Scholar] [CrossRef] [PubMed]
- Sallis, J.F.; Spoon, C.; Cavill, N.; Engelberg, J.K.; Gebel, K.; Parker, M.; Thornton, C.M.; Lou, D.; Wilson, A.L.; Cutter, C.L.; et al. Co-benefits of designing communities for active living: An exploration of literature. Int. J. Behav. Nutr. Phys. Act. 2015, 12, 30. [Google Scholar] [CrossRef]
- Ogilvie, D.; Egan, M.; Hamilton, V.; Petticrew, M. Promoting walking and cycling as an alternative to using cars: Systematic review. BMJ (Clin. Res. Ed.) 2004, 329, 763. [Google Scholar] [CrossRef] [PubMed]
- Sallis, J.F.; Owen, N.; Fisher, E. Health Behavior and Health Education: Theory, Research, and Practice; John Wiley & Sons: San Francisco, CA, USA, 2009; Volume 4, pp. 465–482. [Google Scholar]
- Schilling, J.M.; Giles-Corti, B.; Sallis, J.F. Connecting Active Living Research and Public Policy: Transdisciplinary Research and Policy Interventions to Increase Physical Activity. J. Public Health Pol. 2009, 30, S1–S15. [Google Scholar] [CrossRef]
- Stevenson, M.; Thompson, J.; de Sá, T.H.; Ewing, R.; Mohan, D.; McClure, R.; Roberts, I.; Tiwari, G.; Giles-Corti, B.; Sun, X.; et al. Land use, transport, and population health: Estimating the health benefits of compact cities. Lancet 2016, 388, 2925–2935. [Google Scholar] [CrossRef]
- Maller, C.; Townsend, M.; St. Leger, L.; Henderson-Wilson, C.; Pryor, A.; Prosser, L.; Moore, M. Healthy parks, healthy people: The health benefits of contact with nature in a park context, a review of relevant literature. Parks Vic. 2009, 26, 51–83. [Google Scholar]
- Chandrabose, M.; Rachele, J.N.; Gunn, L.; Kavanagh, A.; Owen, N.; Turrell, G.; Giles-Corti, B.; Sugiyama, T. Built environment and cardio-metabolic health: Systematic review and meta-analysis of longitudinal studies. Obes Rev. 2019, 20, 41–54. [Google Scholar] [CrossRef]
- Adlakha, D. Quantifying the Modern City: Emerging Technologies and Big Data for Active Living Research. Front. Public Health 2017, 5, 105. [Google Scholar] [CrossRef]
- Hipp, J.A.; Adlakha, D.; Eyler, A.A.; Chang, B.; Pless, R. Emerging Technologies: Webcams and Crowd-Sourcing to Identify Active Transportation. Am. J. Prev. Med. 2013, 44, 96–97. [Google Scholar] [CrossRef]
- Cohen, D.A.; Setodji, C.; Evenson, K.R.; Ward, P.; Lapham, S.; Hillier, A.; McKenzie, T.L. How much observation is enough? Refining the administration of SOPARC. J. Phys. Act. Health 2011, 8, 1117–1123. [Google Scholar] [CrossRef] [PubMed]
- Ward, P.; McKenzie, T.L.; Cohen, D.; Evenson, K.R.; Golinelli, D.; Hillier, A.; Lapham, S.C.; Williamson, S. Physical Activity Surveillance in Parks Using Direct Observation. Prev. Chronic Dis. 2014, 11, E03. [Google Scholar] [CrossRef][Green Version]
- Adlakha, D.; Budd, E.L.; Gernes, R.; Sequeira, S.; Hipp, J.A. Use of emerging technologies to assess differences in outdoor physical activity in St. Louis, Missouri. Front. Public Health 2014, 2, 41. [Google Scholar] [CrossRef] [PubMed]
- Olds, T.S.; Gomersall, S.R.; Olds, S.T.; Ridley, K. A source of systematic bias in self-reported physical activity: The cutpoint bias hypothesis. J. Sci. Med. Sport 2019, 22, 924–928. [Google Scholar] [CrossRef]
- Heikinheimo, V.; Tenkanen, H.; Bergroth, C.; Järv, O.; Hiippala, T.; Toivonen, T. Understanding the use of urban green spaces from user-generated geographic information. Landsc. Urban Plan. 2020, 201, 103845. [Google Scholar] [CrossRef]
- Tokuçoğlu, F. Monitoring Physical Activity with Wearable Technologies. Noro Psikiyatr. Ars. 2018, 55, S63–S65. [Google Scholar]
- Lowe, S.; ÓLaighin, G. Monitoring human health behaviour in one’s living environment: A technological review. Med. Eng. Phys. 2013, 36, 147–168. [Google Scholar] [CrossRef]
- Fullerton, E.; Heller, B.; Munoz-Organero, M. Recognizing Human Activity in Free-Living Using Multiple Body-Worn Accelerometers. IEEE Sens. J. 2017, 17, 5290–5297. [Google Scholar] [CrossRef]
- Tully, M.A.; Hunter, R.F.; McAneney, H.; Cupples, M.E.; Donnelly, M.; Ellis, G.; Hutchinson, G.; Prior, L.; Stevenson, M.; Kee, F. Physical activity and the rejuvenation of Connswater (PARC study): Protocol for a natural experiment investigating the impact of urban regeneration on public health. BMC Public Health 2013, 13, 774. [Google Scholar] [CrossRef] [PubMed]
- IJpelaar, J.; Power, T.; Green, B. Northern Ireland Multiple Deprivation Measures 2017. J. Stat. Soc. Inq. 2017, 48, 163–174. [Google Scholar]
- Charmaz, K.; Henwood, K. Grounded theory methods for qualitative psychology. In The SAGE Handbook of Qualitative Research in Psychology; SAGE Publications Ltd.: Thousand Oaks, CA, USA, 2017; pp. 238–256. [Google Scholar]
- Strauss, A.; Corbin, J.M. Basics of Qualitative Research: Techniques and Procedures for Developing Grounded Theory; SAGE Publications: London, UK, 1998. [Google Scholar]
- Nelson, J. Using conceptual depth criteria: Addressing the challenge of reaching saturation in qualitative research. Qual. Res. 2017, 17, 554–570. [Google Scholar] [CrossRef]
- Thorpe, R.; Holt, R. (Eds.) The SAGE Dictionary of Qualitative Management Research; SAGE: London, UK, 2008. [Google Scholar]
- Sallis, J.F.; Owen, N.; Fisher, E.B. Ecological models of health behavior. In Health Behavior and Health Education: Theory, Research and Practice; Glanz, K., Rimer, B.K., Viswanath, K., Eds.; Jossey-Bass: San Francisco, CA, USA, 2008; pp. 464–485. [Google Scholar]
- Golden, S.D.; Earp, J.A.L. Social Ecological Approaches to Individuals and Their Contexts: Twenty Years of Health Education & Behavior Health Promotion Interventions. Health Educ. Behav. 2012, 39, 364–372. [Google Scholar]
- Adlakha, D.; Sallis, J.F. Activity-friendly neighbourhoods can benefit non-communicable and infectious diseases. Cities Health 2020, 1–5. Available online: https://www.tandfonline.com/doi/full/10.1080/23748834.2020.1783479 (accessed on 20 October 2021). [CrossRef]
- Sfm, C.; Van Cauwenberg, J.; Maenhout, L.; Cardon, G.; Lambert, E.V.; Van Dyck, D. Inequality in physical activity, global trends by income inequality and gender in adults. Int. J. Behav. Nutr. Phys. Act. 2020, 17, 142. [Google Scholar] [CrossRef]
- Gaskin, D.J.; Zare, H.; Delarmente, B.A. Geographic disparities in COVID-19 infections and deaths: The role of transportation. Transp. Policy 2021, 102, 35–46. [Google Scholar] [CrossRef]
- Sallis, J.F.; Adlakha, D.; Oyeyemi, A.; Salvoe, D. An international physical activity and public health research agenda to inform coronavirus disease-2019 policies and practices. J. Sport Health Sci. 2020, 9, 328–334. [Google Scholar] [CrossRef]
- Timperio, A.; Veitch, J.; Carver, A. Safety in numbers: Does perceived safety mediate associations between the neighborhood social environment and physical activity among women living in disadvantaged neighborhoods? Prev. Med. 2015, 74, 49–54. [Google Scholar] [CrossRef]
- Gates, S.; Gogescu, F.; Grollman, C.; Cooper, E.; Khambhaita, P. Transport and inequality: An evidence review for the Department for Transport. Lond. NatCen Soc. Res. 2019. Available online: https://assets.publishing.service.gov.uk/government/uploads/system/uploads/attachment_data/file/953951/Transport_and_inequality_report_document.pdf (accessed on 20 October 2021).
- Box, A.G.; Feito, Y.; Brown, C.; Petruzzello, S.J. Individual differences influence exercise behavior: How personality, motivation, and behavioral regulation vary among exercise mode preferences. Heliyon 2019, 5, e01459. [Google Scholar] [CrossRef]
- Chan, C.B.; Ryan, D.A.J.; Tudor-Locke, C. Relationship between objective measures of physical activity and weather: A longitudinal study. Int. J. Behav. Nutr. Phys. Act. 2006, 3, 21. [Google Scholar] [CrossRef] [PubMed]
- National Research Council; Committee on Population. Physical and Social Environmental Factors. In U.S. Health in International Perspective: Shorter Lives, Poorer Health; Wolf, S.H., Aron, L., Eds.; National Academies Press: Washington, DC, USA, 2013. [Google Scholar]
- Rees-Punia, E.; Hathaway, E.D.; Gay, J.L. Crime perceived safety, and physical activity: A meta-analysis. Prev. Med. 2018, 111, 307–313. [Google Scholar] [CrossRef]
- Braveman, P.; Gottlieb, L. The social determinants of health: It’s time to consider the causes of the causes. Public Health Rep. 2014, 129, 19–31. [Google Scholar] [CrossRef] [PubMed]
- Kemperman, A.; Pauline van den Berg, P.; Weijs-Perrée, M.; Uijtdewillegen, K. Loneliness of Older Adults: Social Network and the Living Environment. Int. J. Environ. Res. Public Health 2019, 16, 406. [Google Scholar] [CrossRef] [PubMed]
- Van Cauwenberg, J.; Cerin, E.; Timperio, A.; Salmon, J.; Deforche, B.; Veitch, J. Park proximity, quality and recreational physical activity among mid-older aged adults: Moderating effects of individual factors and area of residence. Int. J. Behav. Nutr. Phys. Act. 2015, 12, 46. [Google Scholar] [CrossRef]
- Schmidt, T.; Kerr, J.; Schipperijn, J. Associations between Neighborhood Open Space Features and Walking and Social Interaction in Older Adults-A Mixed Methods Study. Geriatrics 2019, 4, 41. [Google Scholar] [CrossRef]
- Kepper, M.M.; Myers, C.A.; Denstel, K.D.; Hunter, R.F.; Guan, W.; Broyles, S.T. The neighborhood social environment and physical activity: A systematic scoping review. Int. J. Behav. Nutr. Phys. Act. 2019, 16, 124. [Google Scholar] [CrossRef]
- Steinmetz-Wood, M.; Velauthapillai, K.; O’Brien, G.; Ross, N.A. Assessing the micro-scale environment using Google Street View: The Virtual Systematic Tool for Evaluating Pedestrian Streetscapes (Virtual-STEPS). BMC Public Health 2019, 19, 1246. [Google Scholar] [CrossRef]
- Lopes, A.A.d.S.; Kienteka, M.; Fermino, R.C.; Reis, R.S. Characteristics of the environmental microscale and walking and bicycling for transportation among adults in Curitiba, Paraná State, Brazil. Cad. Saúde Pública 2018, 34, e00203116. [Google Scholar] [CrossRef]
- Dias, D.J.; Cunha, J.P.S. Wearable Health Devices-Vital Sign Monitoring, Systems and Technologies. Sensors 2018, 18, 2414. [Google Scholar] [CrossRef] [PubMed]
- Graham, D.J.; Hipp, J.A. Emerging Technologies to Promote and Evaluate Physical Activity: Cutting-Edge Research and Future Directions. Front. Public Health 2014, 2, 66. [Google Scholar] [CrossRef] [PubMed]
- Coughlin, S.S.; Stewart, J. Use of Consumer Wearable Devices to Promote Physical Activity: A Review of Health Intervention Studies. J. Environ. Health Sci. 2016, 2. [Google Scholar] [CrossRef] [PubMed]
- Michie, S.; van Stralen, M.M.; West, R. The behaviour change wheel: A new method for characterising and designing behaviour change interventions. Implement. Sci. 2011, 6, 42. [Google Scholar] [CrossRef]
- Dana, N.F. Qualitative Interviewing and the Art of Questioning: Promises, Possibilities, Problems, and Pitfalls. 1992. Available online: https://files.eric.ed.gov/fulltext/ED349308.pdf (accessed on 20 October 2021).
- Walker, R.K.; Hickey, A.M.; Freedson, P.S. Advantages and Limitations of Wearable Activity Trackers: Considerations for Patients and Clinicians. Clin. J. Oncol. Nurs. 2016, 20, 606–610. [Google Scholar] [CrossRef]
- Chang, B.L.; Bakken, S.; Brown, S.B.; . Houston, T.K.; Kreps, G.L.; Kukafka, R.; Safran, C.; Stavri, Z. Bridging the digital divide: Reaching vulnerable populations. J. Am. Med Inform. Assoc. JAMIA 2004, 11, 448–457. [Google Scholar] [CrossRef]
- Gilbert, J.P.; Ng, V.; Niu, J.; Rees, E.E. A call for an ethical framework when using social media data for artificial intelligence applications in public health research. Can. Commun. Dis. Rep. 2020, 46, 169–173. [Google Scholar] [CrossRef]
- Saqr, M. Big data and the emerging ethical challenges. Int. J. Health Sci. 2017, 11, 1–2. [Google Scholar]
- Resch, B.; Puetz, I.; Bluemke, M.; Kyriakou, K.; Miksch, J.A. An Interdisciplinary Mixed-Methods Approach to Analyzing Urban Spaces: The Case of Urban Walkability and Bikeability. Int. J. Environ. Res. Public Health 2020, 17, 6994. [Google Scholar] [CrossRef]
- Chaix, B.; Kestens, Y.; Duncan, S.; Merrien, C.; Thierry, B.; Pannier, B.; Brondeel, R.; Lewin, A.; Karusisi, N.; Perchoux, C.; et al. Active transportation and public transportation use to achieve physical activity recommendations? A combined GPS, accelerometer, and mobility survey study. Int. J. Behav. Nutr. Phys. Act. 2014, 11, 124. [Google Scholar] [CrossRef]


Publisher’s Note: MDPI stays neutral with regard to jurisdictional claims in published maps and institutional affiliations. |
© 2022 by the authors. Licensee MDPI, Basel, Switzerland. This article is an open access article distributed under the terms and conditions of the Creative Commons Attribution (CC BY) license (https://creativecommons.org/licenses/by/4.0/).
Share and Cite
Adlakha, D.; Tully, M.A.; Mansour, P. Assessing the Impact of a New Urban Greenway Using Mobile, Wearable Technology-Elicited Walk- and Bike-Along Interviews. Sustainability 2022, 14, 1873. https://doi.org/10.3390/su14031873
Adlakha D, Tully MA, Mansour P. Assessing the Impact of a New Urban Greenway Using Mobile, Wearable Technology-Elicited Walk- and Bike-Along Interviews. Sustainability. 2022; 14(3):1873. https://doi.org/10.3390/su14031873
Chicago/Turabian StyleAdlakha, Deepti, Mark A. Tully, and Perla Mansour. 2022. "Assessing the Impact of a New Urban Greenway Using Mobile, Wearable Technology-Elicited Walk- and Bike-Along Interviews" Sustainability 14, no. 3: 1873. https://doi.org/10.3390/su14031873
APA StyleAdlakha, D., Tully, M. A., & Mansour, P. (2022). Assessing the Impact of a New Urban Greenway Using Mobile, Wearable Technology-Elicited Walk- and Bike-Along Interviews. Sustainability, 14(3), 1873. https://doi.org/10.3390/su14031873