Abstract
Prefabricated building constitutes the development trend of the construction industry in the future. However, many uncertainties in the construction process will surely lead to a higher cost. Therefore, it is necessary to study the cost risk evolution and transfer mechanism in the implementation process of this project. A dynamic evolution model for the cost risk of prefabricated buildings has been established in this paper. First of all, a matrix for cost risk of prefabricated buildings was established based on the WSR (Wuli-Shili-Renli) model, and all risk factors in the implementation stage were classified in accordance with the WSR principle. Second, a DBN-based dynamic evolution model was established based on the risk matrix, and the structure and node parameters of the Dynamic Bayesian Network were determined with the aid of the K2 structure learning algorithm and parameter learning method. In view of the probability change process of risks over time, the dynamic evolution path of risks was predicted in different cases through causal reasoning and diagnostic reasoning. Eventually, the model was applied into construction projects. The research results show that: because prefabricated components need to be made by prefabricated component factories, the management systems of prefabricated component factories are usually not perfect, and the probability of management risks is higher. The occurrence of management risks not only has an impact on other risks at the current time node, but also causes other risks to occur in the subsequent transportation and construction phases at the next moment, which eventually leads to the occurrence of risk events.
1. Introduction
Today, urban construction has entered a stage guided by new concepts of “innovation, coordination, green, openness, and sharing”. Prefabricated building refers to buildings transformed with elements produced by prefabricated component manufacturers, and then delivered and assembled at construction site [1]. This method is advantageous because of its easy construction, materials saving, energy conservation and environmental protection, and less dependence on labor. It is highly attractive to the construction industry in China [2]. With continuous introduction of relevant policies by the state and localities, prefabricated building projects are implemented and landed successfully, realizing sound and steady development. Figure 1 describes statistics of newly-started prefabricated building areas and percentage in China in recent years. In the promotion of prefabricated buildings, high construction cost is one key factor that restrics development [3]. Construction cost is uncertain due to complexity and high requirements of construction environment, supply of prefabricated components, installation technology and construction management, which increases the cost risks of prefabricated buildings [4]. In summary, it is an important means to reduce costs and promote prefabricated buildings by strengthening the management and control of cost risks.
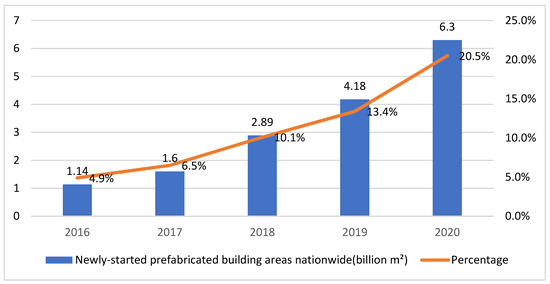
Figure 1.
2016–2020 China’s Newly Built Prefabricated Building Area and Percentage.
Why should we strengthen the risk management and control of prefabricated building costs? First of all, construction projects are characterized by long life cycle, wide scope, and great risk loss [5]. Project cost changes from the decision-making stage of projects to the completion and acceptance stage. Especially in the implementation stage, costs are prone to major changes [6]. Due to the increased links such as production, procurement, transportation and installation of prefabricated components, costs are more uncertain in the implementation stage when compared with that of cast-in-place buildings [7].
Second, prefabricated buildings can be traced back to 1940, and many countries in Europe and America, and elsewhere, vigorously promoted prefabricated buildings [8]. In the 1960s, the wave of residential industrialization swept across the United States, Canada, Japan, and other countries. They gradually improved the technical quality system of prefabricated buildings and formed a strong industrial chain of prefabricated buildings in the process of advancing scale development of prefabricated buildings and industrialized structural adjustment. France established a HQE (High Quality Environment) building certification system in 1996. Japan launched a series of tests on KSI residential industrialization system that was widely used in 2001. In addition, Japan created CASBEE (Comprehensive Assessment System for Building Environmental Efficiency), an environmentally-friendly housing evaluation system [9,10]. The concept of prefabricated buildings was proposed in China in the 1950s, and then it developed rapidly [11]. Up to now, construction technology of prefabricated buildings is still in the development stage in China. Because of construction problems, cost control is uncertain, which easily leads to an increase in construction cost of prefabricated buildings [12].
Third, strengthening of cost control aims to control costs in advance and take measures early to prevent cost risk factors that are prone to occur [13]. It should be noted that the price of prefabricated houses is generally higher than that of cast-in-place houses. Consumers are not willing to pay for low-carbon and energy-saving unless costs are low, in order to accelerate housing industrialization [14]. Thus, management and control of costs are not only necessary to reduce cost miscalculations, but also to promote prefabricated buildings in China.
Scholars have conducted massive research on the cost of prefabricated buildings so far. However, they analyze cost by assuming time is static, when, actually, construction project cost is constantly changing with the implementation process. Essentially, this study discusses two issues: the determination of risk factors that affect the cost of prefabricated buildings, and the exploration of the dynamic evolution path of these factors along with project process. In China, the promotion process of prefabricated buildings is directly decided by the attitude of a builder. In contrast with other literature, this study investigates cost risks that the builder should focus on during project implementation and coupling effect between risks, so as to enhance understanding of prefabricated buildings and reduce the probability of occurrence of cost accidents.
This study is organized as follows. Section 2 presents a literature review. Section 3 introduces methods and theories. Section 4 describes the introduction and establishment of dynamic evolution model for the cost risk of prefabricated buildings. Section 5 analyzes actual projects, reveals the evolution path of cost risk, and explains the coupling effect of risks between different time periods. In Section 6, the author further discusses and analyzes the established model, and provides suggestions for actual project management. The last section summarizes the results and provides a reference for builder to manage and control costs, which lays a foundation for subsequent related research. To sum up, this study is of guiding significance for advancing future development of prefabricated buildings, strengthening cost control of prefabricated buildings, and enhancing industry competitiveness.
2. Literature Review
2.1. Costs of Prefabricated Buildings
In recent years, scholars have discussed and studied the cost of prefabricated buildings from different angles and levels. From different stages of prefabricated buildings, Yan, E.H. analyzed cost risk factors in the design stage, finding that the reasonable splitting of prefabricated components greatly affects design cost [15]. Chang, C.G. explored cost risk factors in the transportation stage, constructed an optimization model of transportation loading plan, and pointed out that transportation efficiency was the key factor affecting cost in transportation stage [16]. Based on the whole process management of projects, Hossam, E.H. suggested building a specific risk management framework, which included potential risks of projects, and combined framework with integrated management model to provide reliable cost estimates and reduce cost risks [17]. Moreover, Rafaela, B. conducted real-time monitoring of prefabricated buildings by adopting full-element dynamic monitoring technology of BIM 4D modeling, to minimize costs and maximize benefits of resource allocation [18]. In some studies, cost of prefabricated buildings was evaluated and analyzed through entropy weight method, fuzzy comprehensive evaluation, comprehensive cloud model and related algorithms, in accordance with Matlab [19,20].
High cost is a common problem in prefabricated buildings worldwide. Studies have proved that cost overruns occur in about 90% of projects and 50% of construction projects in Asia [21]. Generally, when prefabrication rate is higher, cost will be more expensive. As the prefabrication rate is greater than 60%, unit cost can increase by 25–30% [22]. Furthermore, Hong, J.K. explored the relationship between prefabrication rate and cost, discovering that prefabrication rate was nearly linearly related to the cost [23].
Although research has been undertaken into the cost of prefabricated buildings, many of them assume time is static. They neither consider direct nor indirect impact of time on cost risks at different stages of a project, nor do they take into account interaction between risk factors at different stages. By contrast, this study aims to reveal the evolutionary transmission path of cost risk and help builders manage and control costs. At the same time, it introduces appropriate mathematical models to deal with problems, and clarifies interrelationship of cost risk factors in the implementation stage. Obviously, a Dynamic Bayesian Network is suitable, so it is adopted.
2.2. Dynamic Bayesian Network
The DBN (Dynamic Bayesian Network) is mainly used for the analysis, evolution, and prediction of complex problems. These functions in engineering and other fields are attracting the attention of researchers. Realizing that reliability tools generally lack modeling capabilities and analysis capabilities, Boudali, H. defined discrete-time Bayesian network, and described a dynamic system reliability modeling and analysis framework based on dynamic Bayesian network, which could effectively cope with dependencies in the model [24]. In addition, Wang, X.Z. explained the formation and causes of offshore drilling accidents according to relevant risk records of drilling projects. They also established a dynamic network analysis model, and calculated the prediction probability of drilling risks through the dynamic Bayesian network [25]. Integrating computer vision with dynamic Bayesian networks, Piao, Y.M. proposed a dynamic risk evolution assessment framework for construction sites. It automatically detected on-site risk factor information, to improve efficiency of risk assessment, and reduce the risk of construction workers falling from heights [26]. Starting from safety in an emergency, and from the perspective of scenario derivation, Yuan, C.F. applied fuzzy theory and dynamic Bayesian network models to reveal how fire accidents affected oil and gas storage and transportation. Based on the analysis of evolution of accidents, they described evolution path of oil and gas storage and transportation in fire accident scenarios [27]. At the same time, Zhao, Y.F. presented a method that promptly predicted nuclear accidents. Specifically, it firstly performed fault diagnosis based on real-time equipment information and Bayesian network, and diagnosed equipment status. Next, real-time factor predictions were obtained in accordance with fault diagnosis results and predefined factors in probabilistic risk assessment [28]. Wang, R. designed a DBN-based prediction model for bridge component state degradation, and conducted DBN modeling and parameter estimation through GeNIe software platform, predicting bridge state [29]. In summary, it is feasible to construct a cost risk evolution model for prefabricated buildings by dynamic Bayesian networks, so as to analyze the evolution path of cost risk at different time nodes, node probability, and other key links.
The Dynamic Bayesian network aims to solve the following problems: First, based on the idea of graph theory, a dynamic causal network of cost risk formation mechanism of prefabricated building is established, which reveals formation mechanism of cost risk and answers the question that what factors drive cost risk of prefabricated building. Second, based on risk formation mechanism, the probability of occurrence of risk factors is stimulated by the probability theory method, namely the dynamic Bayesian network model, providing managers with more comprehensive risk information. The findings of this study will help relevant decision makers (such as builders, construction units, etc.) clearly understand the direct and indirect causes of cost accidents so that they can, in view of decision-making needs, avoid harms and losses caused by cost overruns due to changes in related risk factors. The diversity of evolutionary results facilitates decision-making subjects to make more accurate judgments.
3. Methodology
3.1. Dynamic Bayesian Network
The model introduces a time factor on the basis of SBN. It not only inherits the advantages of static Bayesian network, but also reveals spatio-temporal evolution of uncertainty [30]. A DBN can be decomposed into multiple SBNs and transmission networks between adjacent time slices. For a dynamic Bayesian network, Xi at time is expressed as Xi[t], then the random variable at different time points is recorded as . The dynamic Bayesian network model is expressed as , where the prior network means joint probability distribution defined on the initial state X[1]; the transition network refers to the transition probability defined between sets of variables and . Therefore, the joint probability distribution of is:
When there are only two time slices (2TBN), transmission network between two adjacent static Bayesian networks is expressed as:
3.2. Dynamic Evolution of Risks Based on DBN
The dynamic evolution of risk is dynamic process in which risk factors constantly change over time in risk network, leading to mutual influence and transmission of risks. It is a system formed due to continuous evolution of risk factors in time and space. Spatially, the risk network is formed because of influence among risk factors. In time, risk factors are transmitted on adjacent time nodes, giving rise to evolution of risks. In this study, dynamic evolution of risks is analyzed by DBN risk reasoning, since risk index had different scores and weights at construction stages, and these factors would change over time. Meanwhile, risk factors changed at each moment. After determining prior probability of the root node, this study, based on causal reasoning and diagnostic reasoning, obtained the conditional probability and occurrence probability of risk accidents at each time node through GeNIe software reasoning. On the basis of analysis of changes of the node probability at each time point, the influence relationship of adjacent factors could be received, and so could the most probable path of risk evolution.
- (1)
- Causal reasoning
Causal reasoning means to calculate or predict conditional probability of occurrence of risk accidents through DBN forward causal reasoning technology when risk factor state is known [31]. Based on this, the risk probability of risk factors evolving over time can be obtained, so as to find risk factor with the largest change in risk probability at each time node. From root node, child nodes that are most likely to be affected shall be found, which will reveal the transmission path of risk factors in the whole process with the passage of time. If it is known that reasonable factor 1 occurs at Y = 0, that is, input P(S1(Y = 0) = Yes) = 1. According to the reasoning principle of dynamic Bayesian network, the risk probability of each factor at Y = 1 can be acquired. In light of change of probability at Y = 0 and Y = 1, probability of P(S3) and P(S5) changes greatly when Y = 1. It can be seen that the risk factor is transferred from S1 when Y = 0 to S3 and S5 when Y = 1. Through continuous reasoning, the risk transmission path in the whole process is acquired.
- (2)
- Diagnostic reasoning
Diagnostic reasoning retrodicts risk occurrence probability of each risk at each time node based on reverse reasoning of dynamic Bayesian network when risk accidents are known to take place at certain time nodes. It finds the transmission and evolution path of risk factors based on probability changes [32].
4. Dynamic Evolution Model for Cost Risk of Prefabricated Buildings
4.1. Establishment of Risk Indicator System
4.1.1. Factors Identification
The cost of prefabricated building refers to all fees incurred throughout the implementation of projects [33], such as: design fee of prefabricated components, production fee, transportation fee, loading and unloading fee, hoisting fee, and subsequent operation and maintenance fees. In general, the cost in the project implementation stage covers the design fee of prefabricated components, the production fee, transportation and construction fee, and operation and maintenance fees. According to characteristics of cost composition, the implementation stage can be divided into design, production, transportation, and construction, and the operation and maintenance of prefabricated components. It mainly discussed the evolutionary role of cost risk in the production, transportation, and construction of prefabricated components. The cost underwent constant dynamic changes, and various factors were intertwined, complex, and diverse. Wuli-Shili-Renli (WSR) System Approach is an important tool proposed by Chinese scholars to solve complex problems [34]. Therefore, from the perspective of system science, WSR methodology conforms to multi-angle, multi-level, and multi-dimensional characteristics of cost risk factors of prefabricated buildings. The specific steps of WSR methodology are:
- (1)
- Based on WSR theory, factors are classified according to Wuli-Shili-Renli theory, to obtain the initial influencing factors.
- (2)
- In accordance with analysis of cost risk indicators in relevant literature [35,36,37,38,39,40,41], and characteristics of prefabricated buildings, this study summarizes cost risk factors on the basis of actual investigations on construction site, initially forming the cost risk factors of prefabricated buildings, as shown in Table 1.
 Table 1. Initial Cost Risk Factors of Prefabricated Buildings.
In the design stage, the design institution has few workers with the design experience of prefabricated architectural design. Moreover, the construction institution is also weak at monitoring the design institution. Therefore, problems may happen in the design plan if too much attention is paid to a high prefabrication rate and assembly rate, or in the case of unreasonable splitting, poor constructability of design and insufficient site survey in the component’s deepened design period. The design plan exerts direct influence on the total costs of the construction project. As prefabricated building is in a fast development stage in China, and relevant policies have been improved constantly, a huge influence may be exerted on the costs of prefabricated buildings if the design in subsequent stages is changed [12,42].
As the general construction institutions cannot satisfy the production conditions of prefabricated components, the procurement of these prefabricated parts very much differs from buildings. The procurement cost of components is influenced by many factors in the procurement process, such as component plants’ management level, distance, product quality, supply term and workers’ proficiency, all of which will influence the construction of prefabricated buildings directly and lead to a certain influence on costs. The transportation plan and storage conditions also lead to a certain influence on project costs. As for construction, China has too few construction workers who are experienced in the construction of prefabricated buildings. The corresponding construction technology is immature, and management teams seldom take charge of prefabricated projects with poor management experience, all of which surely influence several construction objectives of prefabricated projects, as well as the total project costs, directly or indirectly. In addition, large hoisting equipment is required for construction. The lease and purchase price of the equipment will fluctuate if the market is immature [43,44,45].
Although prefabricated buildings have a high comprehensive performance and low repairing frequency in the operation and maintenance stage, the risk of operation cost increase will be high, if they are managed unreasonably by property management companies without enough experience [46].
4.1.2. Indicator Screening
In order to ensure that the indicator system is concise and scientific, this study introduced the random forest algorithm to screen risk factors of each risk category in Table 1. Random forest algorithm is an integrated algorithm, which integrates multiple decision trees based on a Bagging algorithm framework. The decision tree is a tree structure [47]. Branches are generated from the root according to different attributes; each branch represents the value of a whole attribute, and leaf nodes indicate the category. Information, entropy, and information gain determine which attribute the decision tree selects for branching during the branching process.
Information can eliminate random uncertainty. If objects in the set can be divided into multiple categories, the information of a certain category (xi) is defined as:
Wherein, is information of random variables, and is the probability of occurrence of .
Information entropy measures variable uncertainty, and the larger the information entropy, the more scattered the variable data of sample. When sample categories are distributed more even under different values of variables, uncertainty of classification result of variables will be greater. This can be expressed as:
Information gain is basis for the decision tree algorithm to select branch attributes. A greater information gain indicates significant influence of attribute on final classification result, and the selectivity is better. The information gain can be expressed as:
represents overall information entropy of the sample, and is the entropy after a certain attribute feature is selected. If information gain of the feature is greater, classification result will be dramatically affected. The decision tree selects attribute feature with the largest information gain as a branch node to split, and then finds the next attribute feature as a child node to continue splitting until splitting conditions are over.
First of all, a questionnaire survey was conducted on risk factors of each stage in Table 1 according to Likert five-level scale. In the questionnaire, “1” indicated basically no impact; “2” meant slight impact; “3” represented general impact; “4” implied great impact; “5” meant great impact. The questionnaire survey covered design units, component manufacturers, construction units, builders, consulting units and universities, etc. A total of 300 questionnaires were issued, of which 272 were valid. Among 28 questionnaires were excluded because their results were greatly different, so the answers were considered too subjective and not statistically significant. Figure 2 shows the distribution of age and work location of the interviewed experts and students.
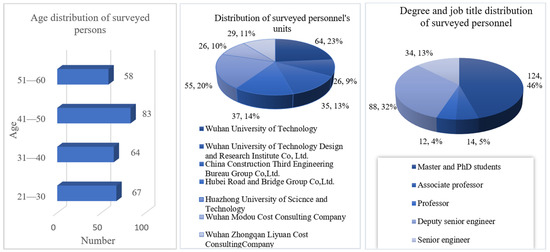
Figure 2.
Age, Educational Background, Job Title and Location of Respondents.
According to risk data obtained by the questionnaire, the random forest algorithm was achieved by using the python scikit-learn library, and the importance score of the indicator variable was obtained in view of the importance score principle. According to the breakpoints in the scoring results, the research selects the influencing factors with an importance score greater than 3 to form a prefabricated building cost risk coupling matrix [48], as listed in Table 2.
Table 2.
Coupling Matrix for Cost Risk of Prefabricated Buildings.
4.2. Establishment of Dynamic Evolution Model
4.2.1. Structure Learning Based on K2 Algorithm
The task of fitting the Bayesian network is called learning. The first step is structure learning, and second step is parameter learning. Generally speaking, the Bayesian network is constructed via the following methods: (1) The nodes, structure and parameters of Bayesian network are determined by knowledge in a specific field. (2) The nodes are determined by domain expert knowledge, and the structure and parameters learn from data learning. (3) Nodes, structures, and parameters all learn from data, and this method is adopted in this study to model influencing factors and mechanisms of cost risk of prefabricated buildings.
In order to learn BN structure from the data set, this study presented several methods, such as expectation maximization algorithm, evolutionary algorithm, and Gibbs sampling-based algorithm [49]. To be specific, the K2 score-based method proposed by Gregory, F. is called the K2 structure learning algorithm, and it is one of the most representative structure learning algorithms [50]. Moreover, the K2 algorithm is a greedy search algorithm that can be used to determine the structure of Bayesian network based on expert data. It tries to choose the network structure that maximizes posterior probability of the network, and reduces computational complexity by requiring nodes as input for priority ordering, determining the network structure thereby. In the K2 algorithm, candidate parent node of node is initially set to an empty set. Each node is visited according to the order specified in the previous sorting. If the network score is maximized due to addition of the parent node, Pai will be added as the parent node of node .
The K2 algorithm learns the network structure as follows: searching for the network structure with the largest posterior probability under a given database, or in other words, obtained makes the biggest; , and have nothing to do with . Therefore, the ultimate goal is to maximize . According to a series of derivations:
is the probability of network structure D of a given database and is the number of nodes in BN.
Assume is a set including n discrete random variables, and each variable has possible values (Vi1, Vi2, …, ). Assume that contains cases, and each case is an instantiation to random variables in . Bs represents a belief network that happens to contain random variables in . stands for parent node of variable Xi in . represents the j-th instantiation of that includes instantiations. indicates value Vik of in the database D and is instantiated as At the same time:
K2 algorithm aims to find Bs, to maximize posterior probability:
When the best network structure is found, data Nijk under this structure can be substituted into the above formula to get the maximum value. It can be seen from the formula that, as long as the local of each variable is maximized, the overall will be maximum. The part of each variable is extracted as a new scoring function:
According to statistical analysis of expert knowledge, the K2 algorithm was used to learn the structure of BN model in different time slices, in order to make the model capable of processing time series information. Through testing the number of parent nodes, this study determined the maximum number of parent nodes when each structure remained stable. After determination of order of factors and maximum number of parent nodes, Full BNT-1.0.7 of MATLAB software helped acquire structure of BN model of different time slices. On the basis of determining the static Bayesian network, a multi-layer adjacency matrix aij was introduced to determine influence relationship (T means a time node) between current time node and the next time node [51], obtaining the topology structure of DBN. Based on the above structural learning results, the GeNIe software tool was applied to build a dynamic evolution model for cost risk of prefabricated buildings, as shown in Figure 3.
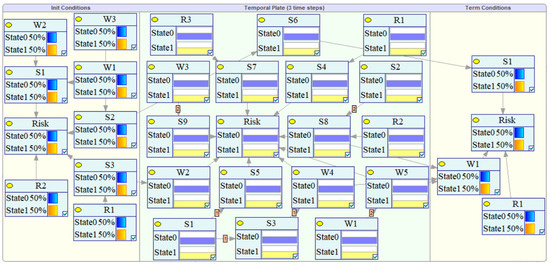
Figure 3.
Dynamic Evolution Model for Cost Risk of Prefabricated Buildings.
4.2.2. Parameter Learning
Conditional probability of discrete random variables is usually represented by a conditional probability table in which local probability is listed when a child node adopts each feasible value for each combination of values of its parent node. Joint probability distribution of variables set can be determined by local conditional probability tables that include unknown parameters to be estimated based on expert knowledge, such as maximum likelihood estimation algorithm, expectation maximization algorithm, and Bayesian estimation [52]. The maximum likelihood estimation algorithm aims to find a parameter that maximizes the likelihood function. It is advantageous because if there is enough information, a good estimation will be obtained [53]. Therefore, it was adopted in this study for parameter learning based on expert knowledge.
It judges similarity between the model and sample in view of closeness between parameter and sample. If the value of a parent node is known, the values of a child node could be acquired through calculation, further obtaining conditional probability of the child nodes. Provided that parameters in the model structure conform to Dirichlet distribution and are discretized, a set of observation data sets is given , and the likelihood function model of can be described as:
or equivalently, using log likelihood, described as:
Further expanded, it can be described as:
wherein, is node in the model; pa(j) is parent node of ; represents the conditional probability of when the parent node is known. can be viewed as the maximum likelihood estimation of , which is expressed as follows:
The network parameters of the model included conditional probability distribution between parent and child nodes in the same time slice, state transition probability distribution of risks between different time slices, and the marginal probability distribution of risk levels. Firstly, in a simulation environment of MATLAB 2016a, based on an expert knowledge data set, the MLE method was used to learn the conditional probability distribution of the risk evolution model. Subsequently, a fuzzy Bayesian network was constructed in combination with fuzzy set theory, which better solved ambiguity of nodes between different time slices [54]. The operation of triangular fuzzy number and is expressed as:
According to the United Nations Intergovernmental Panel on Climate Change (IPCC), risk level is divided into 7 parts: very low, low, slightly low, medium, slightly high, high, and very high. Four experts with same weight were invited to give judgments on node connection level status between different time slices of dynamic Bayesian network for cost risk. Scores of experts were averaged and then, according to Formula (15), the area average method is:
Fuzzy mean probability was converted into an accurate probability value. In the second stage, it calculated state transition probability distribution of risk nodes between different time slices based on expert decision and fuzzy set theory. Through the calculation, the dynamic Bayesian network was completed.
5. Case Study
Through case analysis, this study aims to verify model accuracy, and analyze results of risk evolution in accordance with actual engineering data. The Shuangyashan Chengxiang project is located in Shuangyashan City, Heilongjiang Province, covering a total construction area of 216,943 m2, with 2 floors underground and 15 floors above ground. The project adopts a precast concrete frame shear wall structure.
5.1. Model Construction
The structure of the dynamic Bayesian network was constructed based on a virtual environment of MATLAB2016a, and according to expert knowledge, the K2 algorithm and a multi-layer adjacency matrix. Since the time of three stages was not exactly the same, and in order to elaborately show evolution process of risks in time nodes, the whole construction process was divided into 5 time nodes when the DBN model was constructed, with node 1 and node 5 referring to design, and operation and maintenance respectively. The production, transportation and construction stages in GeNIe software were 0~2 time nodes respectively, corresponding to time node 0 in the production stage. The transportation was time node 1, and construction was time node 2. Figure 4 refers to the constructed DBN model.
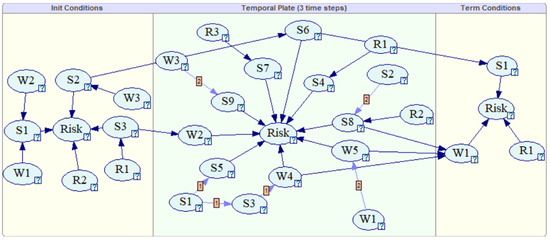
Figure 4.
Dynamic Bayesian Network for Cost Risk of Prefabricated Buildings.
This study learned the conditional probability distribution and state transition probability distribution table of each node in a dynamic Bayesian network by virtue of the MLE algorithm and fuzzy set theory. Associated nodes required many conditional probability tables, so node S1 in the design stage was taken as a case for analysis. Node S1 directly depended on the node W1 and the node W2; each node had two states: occurring (Yes) and not occurring (No). Nodes could learn based on expert knowledge through the MLE method. Table 3 describes the conditional probability of node S1:
Table 3.
Conditional Probability of Node S1.
According to the table, the state transition probability between nodes in different time slices is obtained by expert knowledge through a series of calculations, as shown in the following Table 4:
Table 4.
State Transition Probability between Nodes.
5.2. Causal Reasoning
To begin with, the conditional probability of each node in DBN was given under the condition of no evidence input, as shown in Figure 5. Risk probability of key nodes was acquired through an automatic update. As time went by, probabilities of some nodes had changed significantly, such as S9, W2, S3 and another, whose probabilities increased significantly. The reason for this was that, in a dynamic Bayesian network, as time went back, some nodes would be affected by other unrelated nodes in previous time node, which raised risk probability. Meanwhile, the probability of each risk factor in the construction stage is significantly higher than that in production and transportation stages, indicating that the risk factor was constantly changing over time during project implementation.
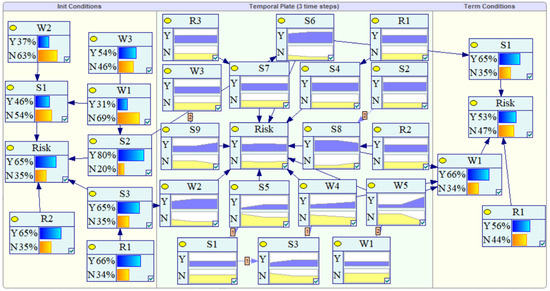
Figure 5.
Dynamic Bayesian Network without Evidence.
In practice, it is common to observe input of evidence. However, in the production process of PC components, the management of the component manufacturer was relatively loose, and management risk is greatly different from normal, so the environmental risk is large and the Shili factor risk is observed, that is, P(S1/S2) = 1. In DBN, set nodes S1 and S2 to Y at time node 0 corresponding to the production stage. After probability updating, the probability of each node is shown in Figure 6 below.

Figure 6.
Causal Inference Results.
In the figure, Y and N respectively represent the probability of Yes and No of risks. This shows clearly that, after the occurrence of risk factors S1 and S2, the risk is quickly transmitted to nodes S3 (The improper stacking and transportation protection of components), S5 (Unreasonable transportation plan), and S8 (Hoisting position deviation of prefabricated components), so that these nodes face greater risks in production and transportation stages. Meanwhile, the management risk of prefabricated component manufacturers will lead to an increase in risks of W4 (Steel corrosion or low temperature cold brit-tleness) in construction stage. As a whole, the risks of the entire system enlarge due to original management risk, and risks in subsequent transportation and construction stages. In other words, risks are managed by the first few risk factors, and, through a series of transmission and evolution processes, the risks of the entire system are changed. After the occurrence of risk factor is observed, it does not immediately lead to an accident, nor is it passed down fixedly along a line, but through staggered lines. At the same time, it does not happen immediately in time, and may produce impact at the next time node. Therefore, risk evolution is a complex process that constantly changes over time and should be considered in the construction process.
5.3. Diagnostic Reasoning
Based on diagnostic reasoning of DBN, this study obtained posterior probability of each node through update probability in the DBN model while observing whether risks at each time node occurred. The posterior probability could be used to judge the degree of importance of risk factor. During construction, when risks occurring at nodes 0 and 1 were observed, evidence could be set on total nodes. Please refer to Figure 7 for posterior probability of each node after probability updating. According to the figure, when total risk occurs, the risks of each subsystem clearly increase, and so do the risk factors of nodes S4, S5, S7 and other nodes. According to reasoning forward based on the connection of risk factors, the risks evolved through following paths: R1—S4—Risk, S1—S5—Risk, R3—S7—Risk, R2—S8—Risk.
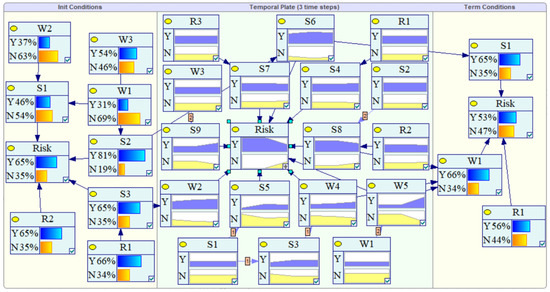
Figure 7.
Diagnostic Reasoning Results.
Nodes S5 and S7 are only affected by other risk factors at same time nodes, and their probability changes roughly the same as risks. The same change trend is also found in Node W2 and Node S6. However, Node S4 node is affected by Node R1 at the previous moment, so risk probability rises when it is T = 2. As for Node S7, risk occurs from T = 0 to T = 2, and risk of Node S7 node (Low management level of construction site) also goes up significantly during this time period. Figure 8 lists the time probability distribution of nodes:
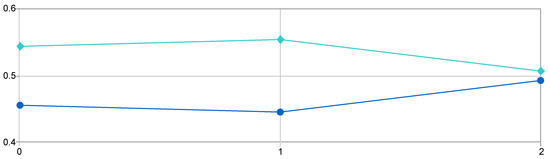
Figure 8.
Time Probability Distribution of Low management level of construction site (S7).
Therefore, during the period from T = 0 to T = 1, risks evolve in transmission paths of R1—S4—Risk and W2—Risk between T = 1 and T = 2, apart from S1—S5—Risk, R3—S7—Risk, R2—S8—Risk, S6—Risk in the risk network at a single time. These paths are dynamic evolution paths of risk factors in network under the influence of time.
6. Discussion
This paper constructs a dynamic Bayesian network model for theoretical analysis. The results show that there is a causal relationship between risk factors that influence each other. In order to make the research results more practical, some key findings are discussed as follows:
In this incident, R1 and S1 affected S4 when it was T = 0 (production stage), and resulted in S5 when it was T = 1. Combination of R1 and S1 led to improper cost control of prefabricated buildings from T = 0 to T = 1, which improved cost risk. Since risk occurred from T = 0 to T = 1, construction risk S7 and R2 increased, causing an increase in cost risk at T = 2 compared to previous work. This finding is consistent with Na Lou’s research [36].
According to causal reasoning and diagnostic reasoning of DBN, prefabricated buildings are badly in need of prefabricated components that are provided by component manufacturers. However, most manufacturers lack a complete management system and production responsibility system. Hence, it is highly possible to trigger technical and management risks of production personnel. When a risk occurs in production stage, it will promptly cause risk factors in subsequent transportation and construction stages, and improve probability of continuous risks, thereby enhancing risk probability of entire system and bringing about cost accidents. This shows that risk factors are positively correlated to risk events in DBN model constructed in this study, which is consistent with facts, and proves the model is reasonable. Specifically, when controlling cost risk of prefabricated building, people should not only consider risks in the design and production stages of prefabricated components, but also take into account risks evolving into transportation and construction stages from the design and production stages. After the direct influence factors of accidents are found, more attention should be placed on dynamic evolution paths of the risks in the whole accident.
7. Conclusions
- (1)
- In the implementation process of prefabricated projects, the implementation process is divided into N stages according to process flow, under the guidance of WSR methodology. The random forest algorithm is used to sort the importance of features, so as to determine risks, and the cost risk coupling matrix is established in accordance with the WSR principle. Moreover, with the aid of the DBN model, this study establishes a dynamic evolution model for the cost risk of prefabricated buildings in the project implementation stage. Model analysis helps successfully find evolution paths of risk factors at a single moment. Meanwhile, based on probability changes, it quantitatively analyzes dynamic evolution process of risks: S1→S5→Risk, R1→S4→Risk, R2→S8→Risk, R3→S7→Risk. The model is proved correct and feasible by comparing case analysis results with realities.
- (2)
- Prefabricated projects propose high requirements for project integrity and management coordination. In the production of prefabricated components (T=0), it is difficult for management systems of component manufacturers to meet the requirements. Moreover, there are insufficient systems, unsound overall production management, and weak awareness of personnel as a whole, which greatly increases management risks. In the long run, they will boost the occurrence probability of risks in the failure of implementing lean management of manufacturers. In the subsequent transportation stage (T=1), the risk probability of unreasonable transportation plans may increase; the risk is transmitted from time node T = n to T = n + 1, and evolves throughout the entire process. Accidents take place due to transmission of risks under the current network and their dynamic evolution over the timing sequence. In short, in production, transportation, and construction stages of prefabricated components, there is a necessity to focus on the risk transfer relationship between adjacent time nodes.
- (3)
- This study introduces DBN to analyze the cost risk of prefabricated buildings, which provides ideas for future research on cost risk. However, there are shortcomings because it only discusses risk evolution process in production, transportation, and construction stages of prefabricated components under the condition that network structure remains same. In the future, more efforts should be made to further explore the dynamic evolution process of risks in different risk network structures.
Author Contributions
Conceptualization, M.Y.; Data curation, S.Z.; Formal analysis, M.Y.; Methodology, J.W.; Software, Q.H.; Writing—original draft, M.Y.; Resources, X.S. All authors have read and agreed to the published version of the manuscript.
Funding
This study was supported by National key R&D projects, grant number (2018YFC0704301), Science and Technology Project of Wuhan Urban and Rural Construction Bu-reau, China (201943), Re-search on theory and application of prefabricated building construction management (20201h0439); Wuhan Mo Dou construction consulting co., ltd. (20201h0414), Pre-liminary Study on the Prepa-ration of the 14th Five-Year Plan for Housing and Urban-Rural Development in Hubei Province (20202s0002).
Institutional Review Board Statement
Not applicable.
Informed Consent Statement
Informed consent was obtained from all subjects involved in the study.
Data Availability Statement
The case analysis data used to support the findings of this study are available from the corresponding author upon request.
Conflicts of Interest
The authors declare no conflict of interest.
References
- El-Abidi, K.M.A.; Ofori, G.; Zakaria, S.A.S. Using Prefabricated Building to Address Housing Needs in Libya: A Study based on Local Expert Perspectives. Arab. J. Sci. Eng. 2019, 44, 8289–8304. [Google Scholar] [CrossRef]
- Li, X.J.; Chen, W.; Ali, A.; Shilpi, B. Game analysis on prefabricated building evolution based on dynamic revenue risks in China. J. Clean. Prod. 2020, 267, 121730. [Google Scholar] [CrossRef]
- Mesároš, P.; Mandi, T. Factors affecting the use of modern methods and materials in construction. In Proceedings of the IOP Conference Series, Materials Science and Engineering, Tomsk, Russia, 5–9 October 2015. [Google Scholar]
- Zhai, X.L.; Richard, R.; Anthony, M. Factors impeding the offsite production of housing construction in China: An investigation of current practice. Constr. Manag. Econ. 2014, 32, 40–52. [Google Scholar] [CrossRef]
- Yoon, J.C.; Han, J.S.; Lee, S.C. Issues and Improvements on Cost Determination and Cost Management in Construction Industry. Korean Account. J. 2018, 27, 255–288. [Google Scholar] [CrossRef]
- Bon, G.H.; Ming, S.; Kit, Y.L. Key constraints and mitigation strategies for prefabricated prefinished volumetric construction. J. Clean. Prod. 2018, 183, 183–193. [Google Scholar] [CrossRef]
- Xiang, P.C.; Jin, Z.; Zhou, X.Y. Construction Project Risk Management Based on the View of Asymmetric Information. J. Constr. Eng. Manag. 2012, 138, 1303–1311. [Google Scholar] [CrossRef]
- Xu, G.M. The Construction Site Management of Concrete Prefabricated Buildings by ISM-ANP Network Structure Model and BIM under Big Data Text Mining. Int. J. Interact. Multi. 2020, 6, 138–145. [Google Scholar] [CrossRef]
- He, W.; Zhang, Y.Q.; Gao, W.J. Life Cycle Environmental and Cost Performance of Prefabricated Buildings. Sustainibility 2020, 12, 2609. [Google Scholar] [CrossRef] [Green Version]
- Steinhardt, D.A.; Karen, M. Adoption of prefabricated housing–the role of country context. Sustain. Cities Soc. 2016, 22, 126–135. [Google Scholar] [CrossRef] [Green Version]
- Ting, L.; Xue, X.L.; Yuna, W. A systematic overview of prefabricated construction policies in China. J. Clean. Prod. 2021, 280, 124–139. [Google Scholar] [CrossRef]
- Chang, Y.; Li, X.D.; Masanet, E. Unlocking the green opportunity for prefabricated buildings and construction in China. Resour. Conserv. Recy. 2018, 139, 259–261. [Google Scholar] [CrossRef]
- Ji, Y.B.; Lin, Q.; Yan, L. Assessing and Prioritising Delay Factors of Prefabricated Concrete Building Projects in China. Appl. Sci. 2018, 8, 2324. [Google Scholar] [CrossRef] [Green Version]
- Clyde, Z.D.; Li, F.; Xue, X.L. An Internet of Things-enabled BIM platform for on-site assembly services in prefabricated construction. Automat. Constr. 2018, 89, 146–161. [Google Scholar] [CrossRef]
- Yan, E.H.; Yong, Q.L. Technical Analysis of Optimal Design for Building Structure Considering Cost Constraint of Project. Appl. Mech. Mater. 2014, 496, 2563–2568. [Google Scholar] [CrossRef]
- Chang, C.G.; Wu, F.F.; Dan, L. Optimization Model of Load and Transportation for Prefabricated Construction Components. In Proceedings of the 2016 International Forum on Energy, Environment and Sustainable Development, Shenzhen, China, 16–17 April 2016. [Google Scholar]
- Hossam, E.H.; Ahmed, H.I.; Raymond, F.F. Risk management framework for Continuous Flight Auger piles construction in Egypt. Alex. Eng. J. 2017, 57, 2667–2677. [Google Scholar] [CrossRef]
- Rafaela, B.; Carlos, T.F.; Daniela, D.V. Site logistics planning and control for engineer-to-order prefabricated building systems using BIM 4D modeling. Automat. Constr. 2019, 98, 248–264. [Google Scholar] [CrossRef]
- Shtub, A.; Yoav, Z.M. A neural-network-based approach for estimating the cost of assembly systems. Int. J. Prod. Econ. 1993, 32, 189–207. [Google Scholar] [CrossRef]
- Antonio, F.T. Cost drivers-based method for machining and assembly cost estimations in mould manufacturing. Int. J. Adv. Manuf. Technol. 2014, 70, 1437–1444. [Google Scholar] [CrossRef]
- Cantarelli, C.C.; Wee, V.; Molin, E.J.E. Different cost performance: Different determinants? The case of cost overruns in Dutch transport infrastructure projects. Transp. Policy 2012, 22, 88–95. [Google Scholar] [CrossRef] [Green Version]
- Qing, L. Model of economic evaluation system for prefabricated energy-saving buildings. J. Shenyang Jianzhu Univ. 2011, 13, 303–306. [Google Scholar]
- Hong, J.K.; Geoffrey, Q.P.; Shen, Z.D. Barriers to promoting prefabricated construction in China: A cost—benefit analysis. J. Clean. Prod. 2018, 172, 649–660. [Google Scholar] [CrossRef]
- Boudali, H.; Dugan, J.B. A discrete-time Bayesian network reliability modeling and analysis framework. Reliab. Eng. Syst. Safe. 2004, 87, 337–349. [Google Scholar] [CrossRef]
- Wang, X.Z.; Kou, X.H.; Huang, J.F. Offshore drilling accident analysis based on Dynamic Bayesian Network. J. Phys. Conf. Ser. 2021, 2029, 012–022. [Google Scholar] [CrossRef]
- Piao, Y.M.; Xu, W.P.; Wang, T.K. Dynamic Fall Risk Assessment Framework for Construction Workers Based on Dynamic Bayesian Network and Computer Vision. J. Constr. Eng. Manag. 2021, 147, 402–418. [Google Scholar] [CrossRef]
- Yuan, C.F.; Ma, S.M.; Hu, Y.C. Scenario Deduction on Fire Accidents for Oil–Gas Storage and Transportation Based on Case Statistics and a Dynamic Bayesian Network. J. Hazard. Toxic Radioact. Waste 2020, 24, 04020004. [Google Scholar] [CrossRef]
- Zhao, Y.F.; Tong, J.J.; Zhang, L.G. Rapid source term prediction in nuclear power plant accidents based on dynamic Bayesian networks and probabilistic risk assessment. Ann. Nucl. Energy 2021, 158, 108217. [Google Scholar] [CrossRef]
- Wang, R.; Ma, L.; Yan, C. Condition deterioration prediction of bridge elements using Dynamic Bayesian Networks (DBNs). In Proceedings of the 2012 International Conference on Quality, Reliability, Risk, Maintenance, and Safety Engineering, Chengdu, China, 15–18 June 2012; Volume 3. [Google Scholar]
- Liu, M.X.; Hommersom, A.; Maarten, V.D. Hybrid time Bayesian networks. Int. J. Approx. Reason 2017, 80, 460–474. [Google Scholar] [CrossRef]
- Cai, B.P.; Liu, Y.H.; Zhang, Y.W. A dynamic Bayesian networks modeling of human factors on offshore blowouts. J. Loss Prev. Proc. 2013, 26, 639–649. [Google Scholar] [CrossRef]
- Li, C.Z.; Sankaran, M.; Ling, Y. Dynamic Bayesian Network for Aircraft Wing Health Monitoring Digital Twin. Aiaa J. 2017, 55, 930–941. [Google Scholar] [CrossRef]
- Marzena, K.; Beata, G.; Adam, K. Cost Analysis of Prefabricated Elements of the Ordinary and Lightweight Concrete Walls in Residential Construction. Materials 2019, 12, 3629. [Google Scholar]
- Qiang, W.; Li, S.Q. Shale gas industry sustainability assessment based on WSR methodology and fuzzy matter-element extension model: The case study of China. J. Clean. Prod. 2019, 226, 336–348. [Google Scholar] [CrossRef]
- Peng, J.L.; Zhou, J.; Meng, F.Y. Analysis on the hidden cost of prefabricated buildings based on FISM-BN. PLoS ONE 2021, 16, e0252138. [Google Scholar] [CrossRef]
- Lou, N.; Guo, J.J. Study on Key Cost Drivers of Prefabricated Buildings Based on System Dynamics. Adv. Civ. Eng. 2020, 2020, 8896435. [Google Scholar] [CrossRef]
- Rafiq, M.; Choudhry, M.A.; Aslam, J.W. Cost and Schedule Risk Analysis of Bridge Construction in Pakistan: Establishing Risk Guidelines. J. Constr. Eng. Manag. 2014, 140, 04014020. [Google Scholar] [CrossRef]
- Sadeh, H.; Mirarchi, C.; Pavan, A. Integrated Approach to Construction Risk Management: Cost Implications. J. Constr. Eng. Manag. 2021, 147, 04021113. [Google Scholar] [CrossRef]
- Garry, D.; Creedy; Martin, S. Evaluation of Risk Factors Leading to Cost Overrun in Delivery of Highway Construction Projects. J. Constr. Eng. Manag. 2010, 136, 528–537. [Google Scholar]
- Liu, G.Q.; Yuan, Q.; Ji, Y.B. Research on Identification and Evaluation Criteria of Factors Affecting Construction Cost of Prefabricated Buildings in EPC Mode. Constr. Econ. 2019, 40, 86–92. [Google Scholar]
- Qi, B.K.; Ya, Z.; Fan, W.Y. The Method of Identifying Risk Factors in the Life Cycle of Prefabricated Buildings. J. Shenyang Jianzhu Univ. 2016, 18, 257–261. [Google Scholar]
- Yuan, Z.M.; Ni, G.D.; Wang, L.X. Research on the Barrier Analysis and Strength Measurement of a Prefabricated Building Design. Sustainibility 2020, 12, 2994. [Google Scholar] [CrossRef] [Green Version]
- Duan, Y.; Li, G.L. Analysis on the Quality Problems and Preventive Measures of Prefabricated Building Construction. In Proceedings of the 2018 7th International Conference on Advanced Materials and Computer Science, Dalian, China, 1–8 July 2018. [Google Scholar]
- Cheng, B.Q.; Kun, L.; Li, J.C. Comprehensive assessment of embodied environmental impacts of buildings using normalized environmental impact factors. J. Clean. Prod. 2022, 334, 130–153. [Google Scholar] [CrossRef]
- Li, X.J. Research on Investment Risk Influence Factors of Prefabricated Building Projects. J. Civ. Eng. Manag. 2020, 26, 599–613. [Google Scholar] [CrossRef]
- Wang, S.M.; Wang, C.J.; Li, W.L. Study on the operational efficiency of prefabricated building industry bases in Western China based on the DEA model. Arab. J. Geosci. 2021, 14, 6. [Google Scholar] [CrossRef]
- Matthias, S.L.; Rosie, Y.Y. The random forest algorithm for statistical learning. Stata J. 2020, 20, 3–29. [Google Scholar] [CrossRef]
- Chen, J.H. Research on Customs Risk Assessment Model of Soybean Processing Trade Enterprises Based on Machine Learning. Master’s Thesis, Chinese Academy of Agricultural Sciences, Beijing, China, 2021. [Google Scholar]
- Olga, N.K.; Jaroslaw, Z.; Srinivas, A. Parallel globally optimal structure learning of Bayesian networks. J. Parallel Distr. Com. 2013, 73, 1039–1048. [Google Scholar] [CrossRef]
- Gregory, F.; Cooper; Edward, H. A Bayesian method for the induction of probabilistic networks from data. Mach. Learn. 1992, 9, 309–347. [Google Scholar] [CrossRef]
- Gong, P.S.; Zhang, X.F.; Ding, L.P. Construction of Safety Risk Assessment Model for Metro Construction Based on ISM. Constr. Technol. 2015, 44, 321–325. [Google Scholar]
- Ji, Z.W.; Xia, Q.B.; Meng, G.M. A Review of Parameter Learning Methods in Bayesian Network. In Proceedings of the 11th International Conference on Intelligent Computing (ICIC), Fuzhou, China, 20–23 August 2015. [Google Scholar] [CrossRef]
- Gao, X.G.; Guo, Z.G.; Ren, H. Learning Bayesian network parameters via minimax algorithm. Int. J. Approx. Reason 2019, 108, 62–75. [Google Scholar] [CrossRef]
- Vilém, N. Topology in the Alternative Set Theory and Rough Sets via Fuzzy Type Theory. Mathematics 2020, 8, 432. [Google Scholar] [CrossRef] [Green Version]
Publisher’s Note: MDPI stays neutral with regard to jurisdictional claims in published maps and institutional affiliations. |
© 2022 by the authors. Licensee MDPI, Basel, Switzerland. This article is an open access article distributed under the terms and conditions of the Creative Commons Attribution (CC BY) license (https://creativecommons.org/licenses/by/4.0/).