
Life Cycle Assessment of Boron Industry from Mining to Refined Products


Abstract
:1. Introduction
- Section 1 describes the boron reserves, borate extraction techniques, beneficiation techniques, and chemical process for derivation of boric acid (BA), borax pentahydrate (BP), borax decahydrate (BD), and sodium perborate (SP).
- Section 2 describes the methodology within the scope of four main stages of LCA.
- Section 3 discusses the analysis results in the context of comparative impact categories.
- Section 4 discusses the results compared with the literature.
- Section 5 concludes with the summary of analysis results and recommendations to reduce the environmental effects of all the stages of the boron industry, from mining to refined products.
1.1. Boron Mining in Turkey
1.2. Boron Processing Method in Turkey
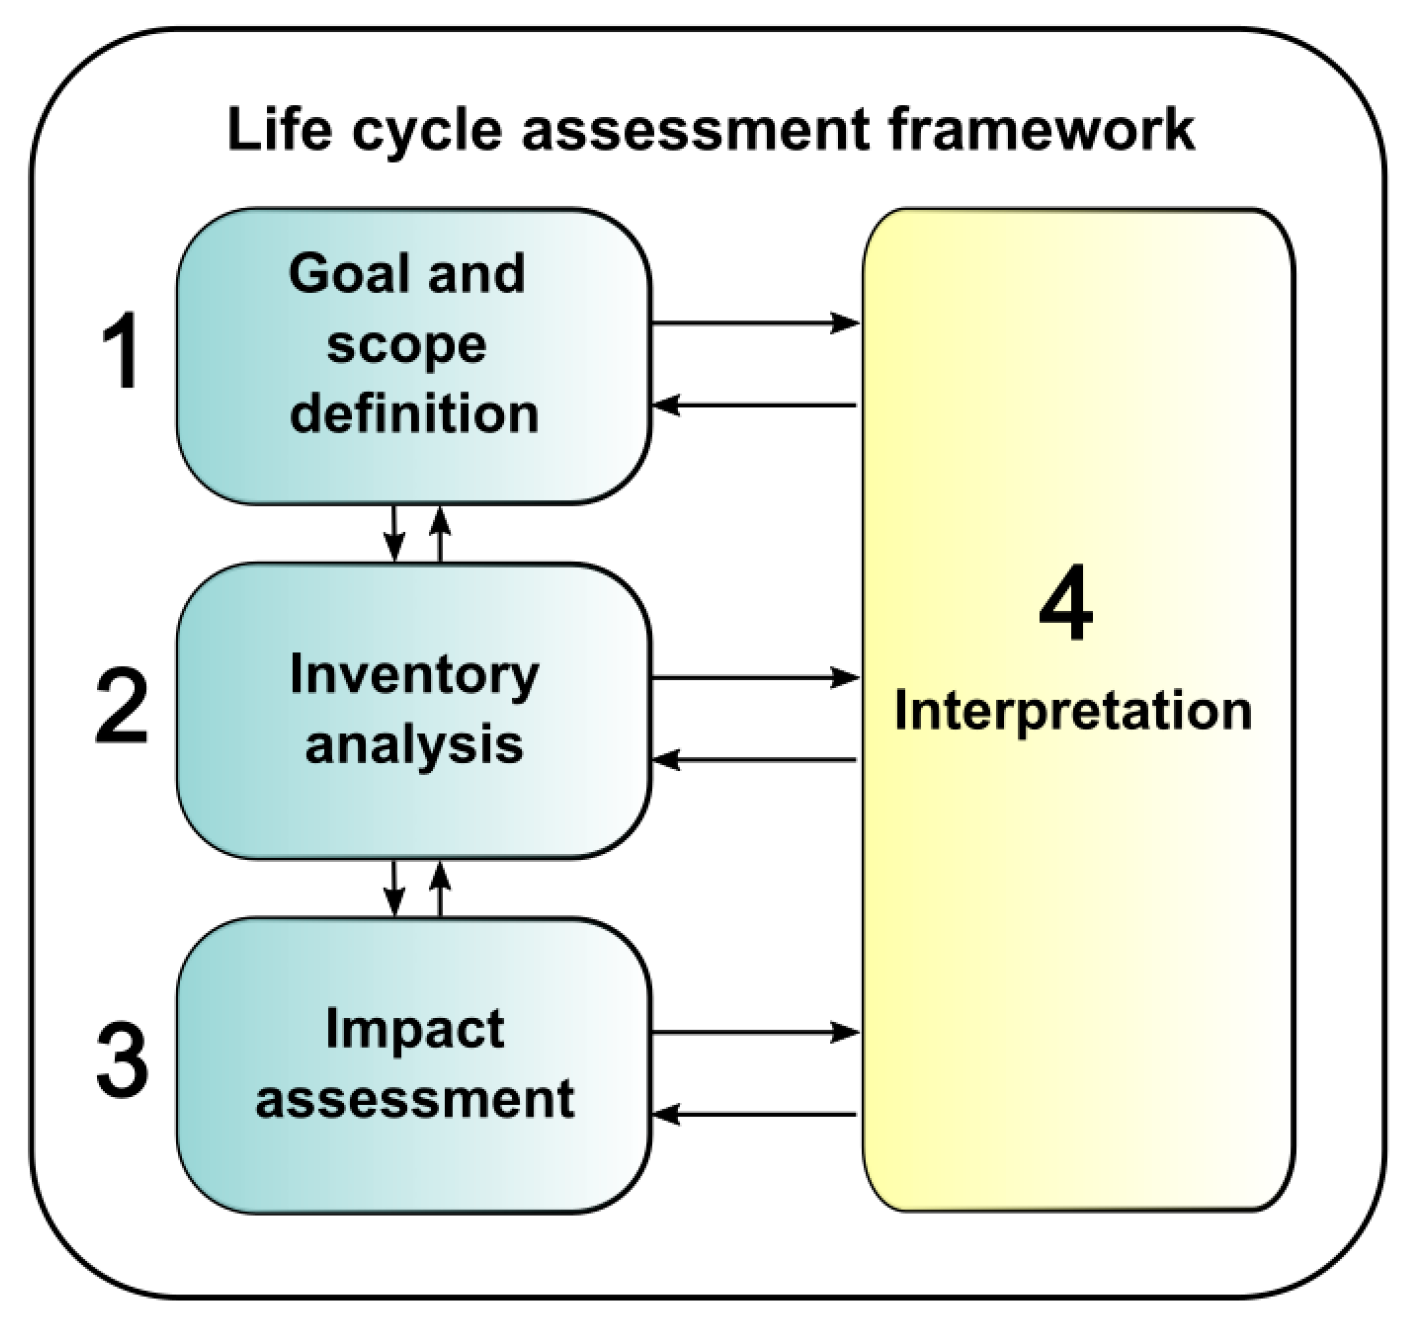
2. Materials and Methods
2.1. Goal and Scope Definition of the Study
- Determining all the environmental impacts that occurred by all the steps in the boron mining industry in Turkey, such as climate change, ozone depletion, human toxicity, air emissions, etc. such that these results will help to other cradle-to-gate LCA studies where boron included.
- Comparison of the results between different processes,
- Understanding the impacts of each flow (types of boron).
- The system boundaries can be evaluated as the main system and subsystems. The main system consists of mining, beneficiation, and refinement. The subsystem of the mining is the drilling, blasting, extraction, loading, hauling, and transportation; the subsystem of the beneficiation is the apron feeder, classifier screw, jaw crusher, dust collecting system, roll crusher, belt conveyors, and washing; the subsystem of the refinement is the dissolving tank, sieving, pressure filtration, crystallizer, and dryer. Since the cradle-to-gate approach was selected, the transportation for final delivery, the packaging of refined products, the use of the products, recycling, recovery, or final disposal are excluded.
- FU: Comparison of 1 ton of refined boron products: BA, BD, BP, and SP.
2.2. Life Cycle Inventory (LCI) Analysis
2.3. Life Cycle Impact Assessment (LCIA)
2.4. Interpretation
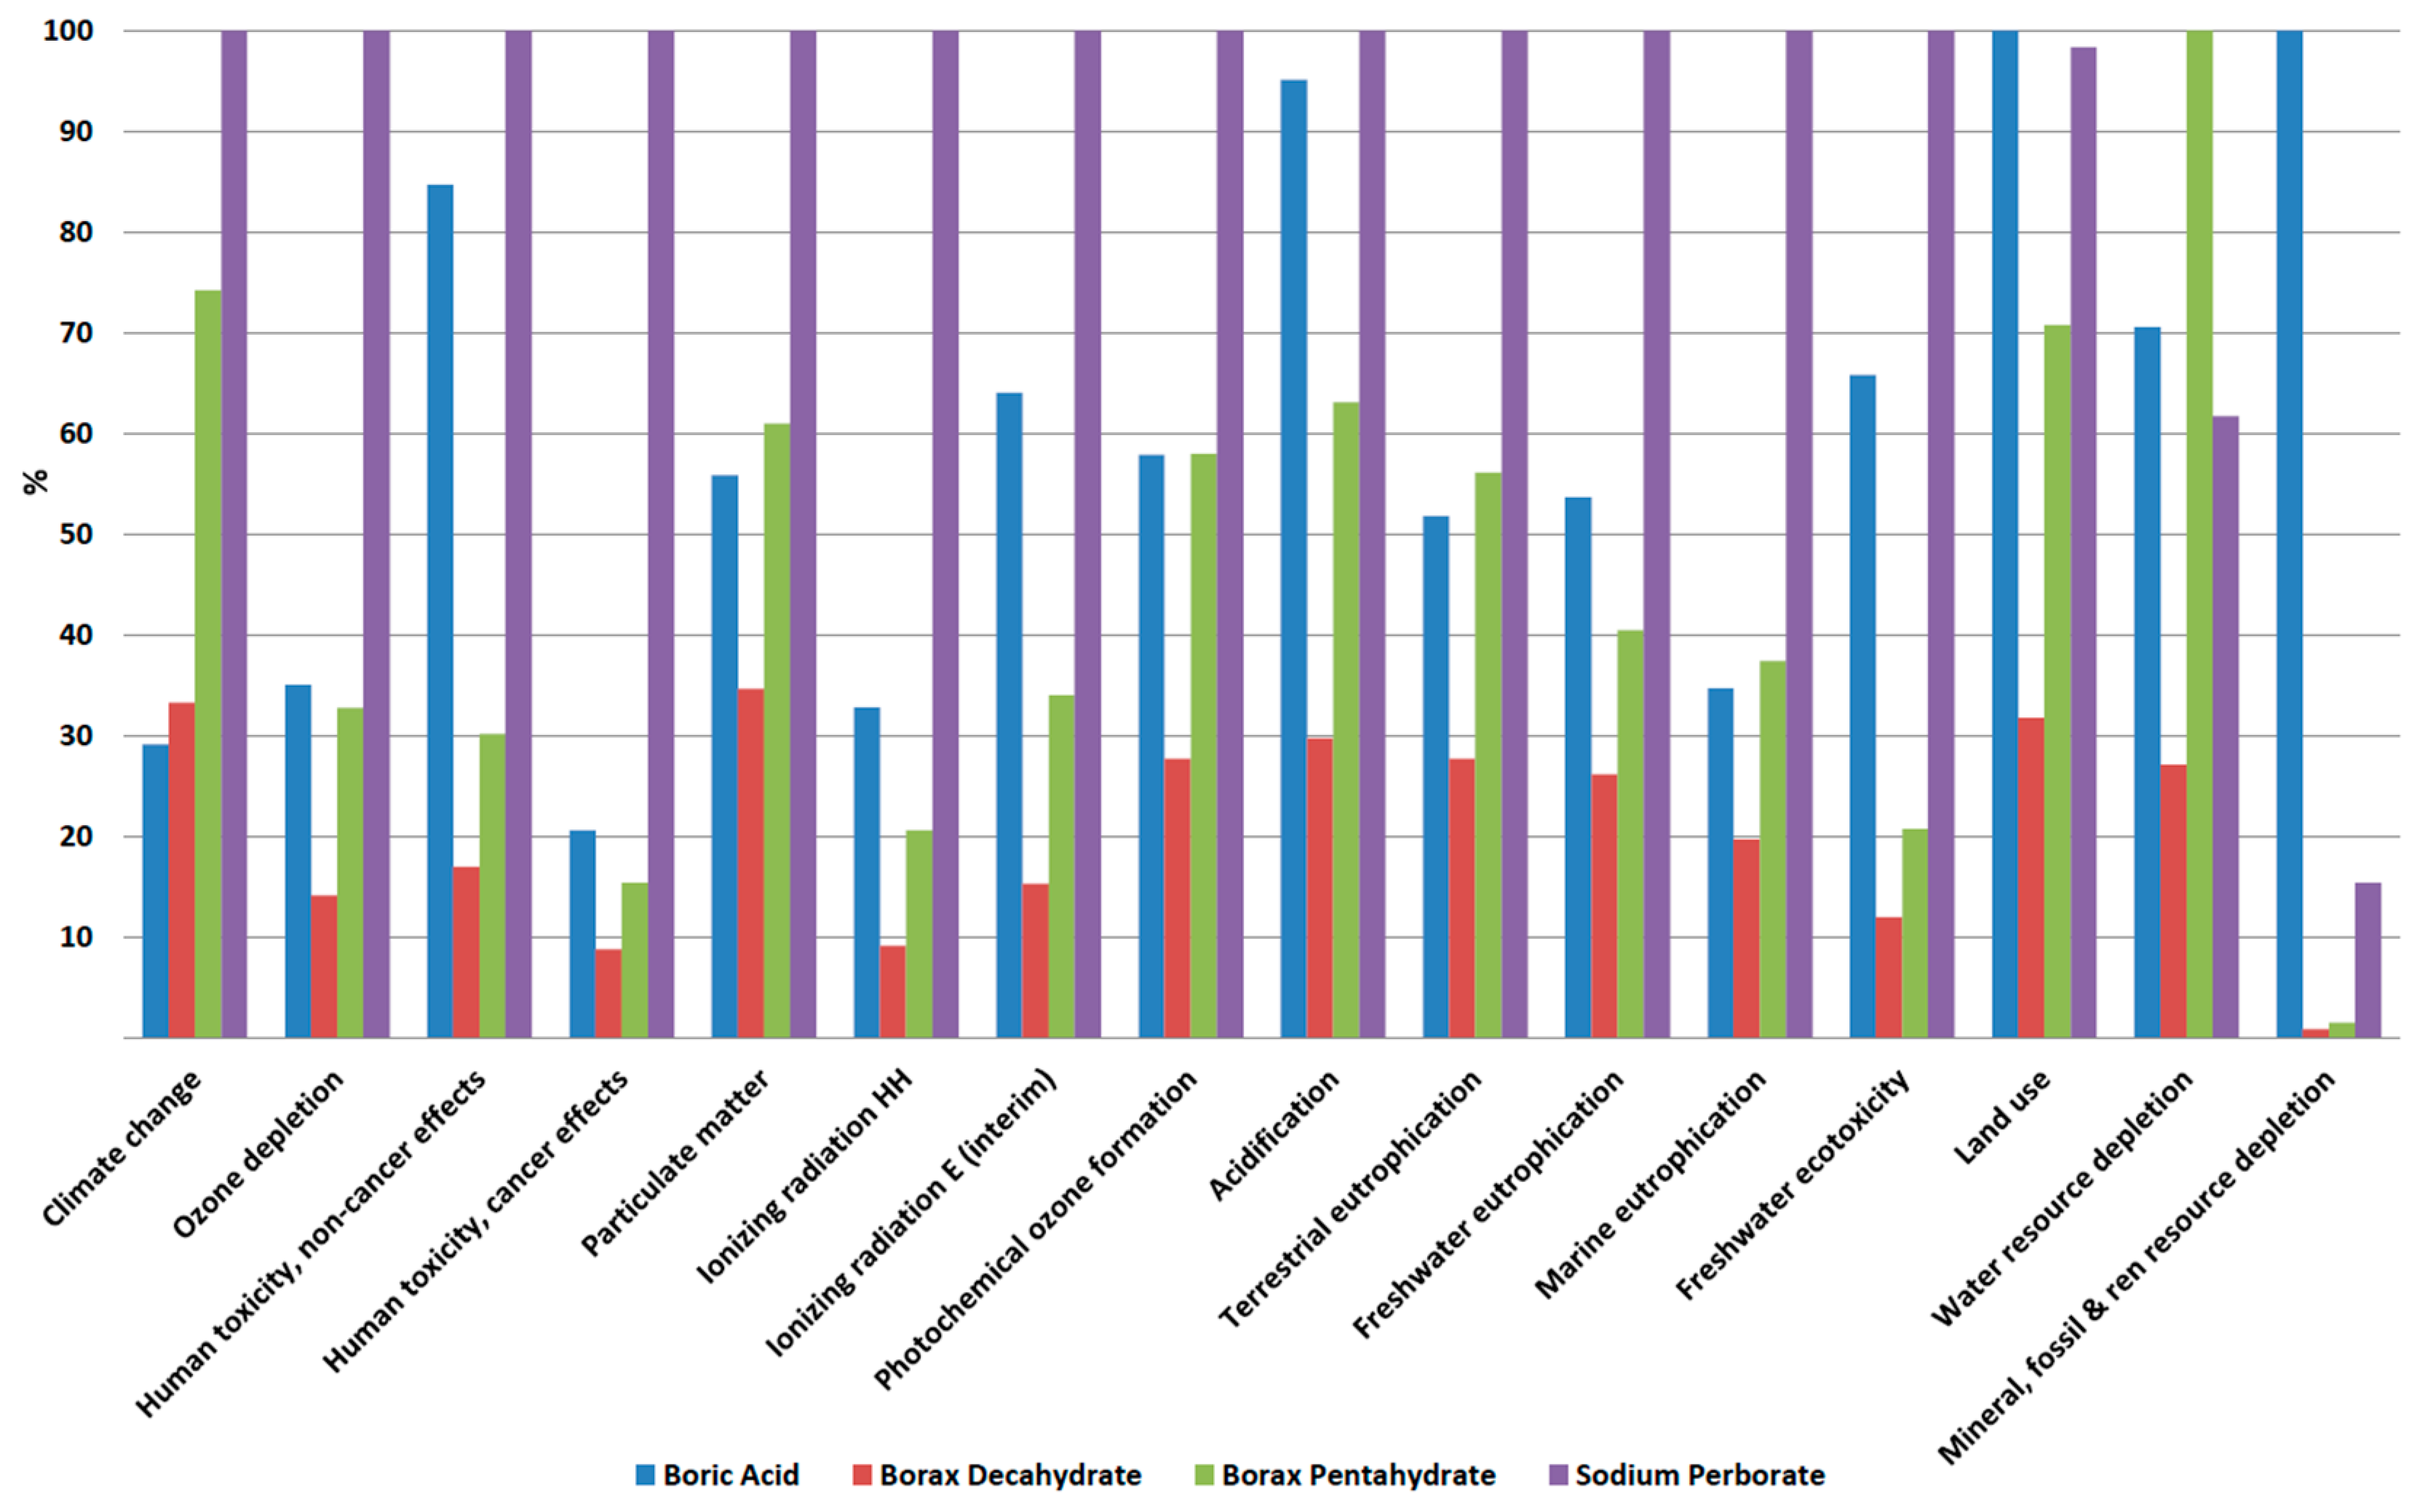
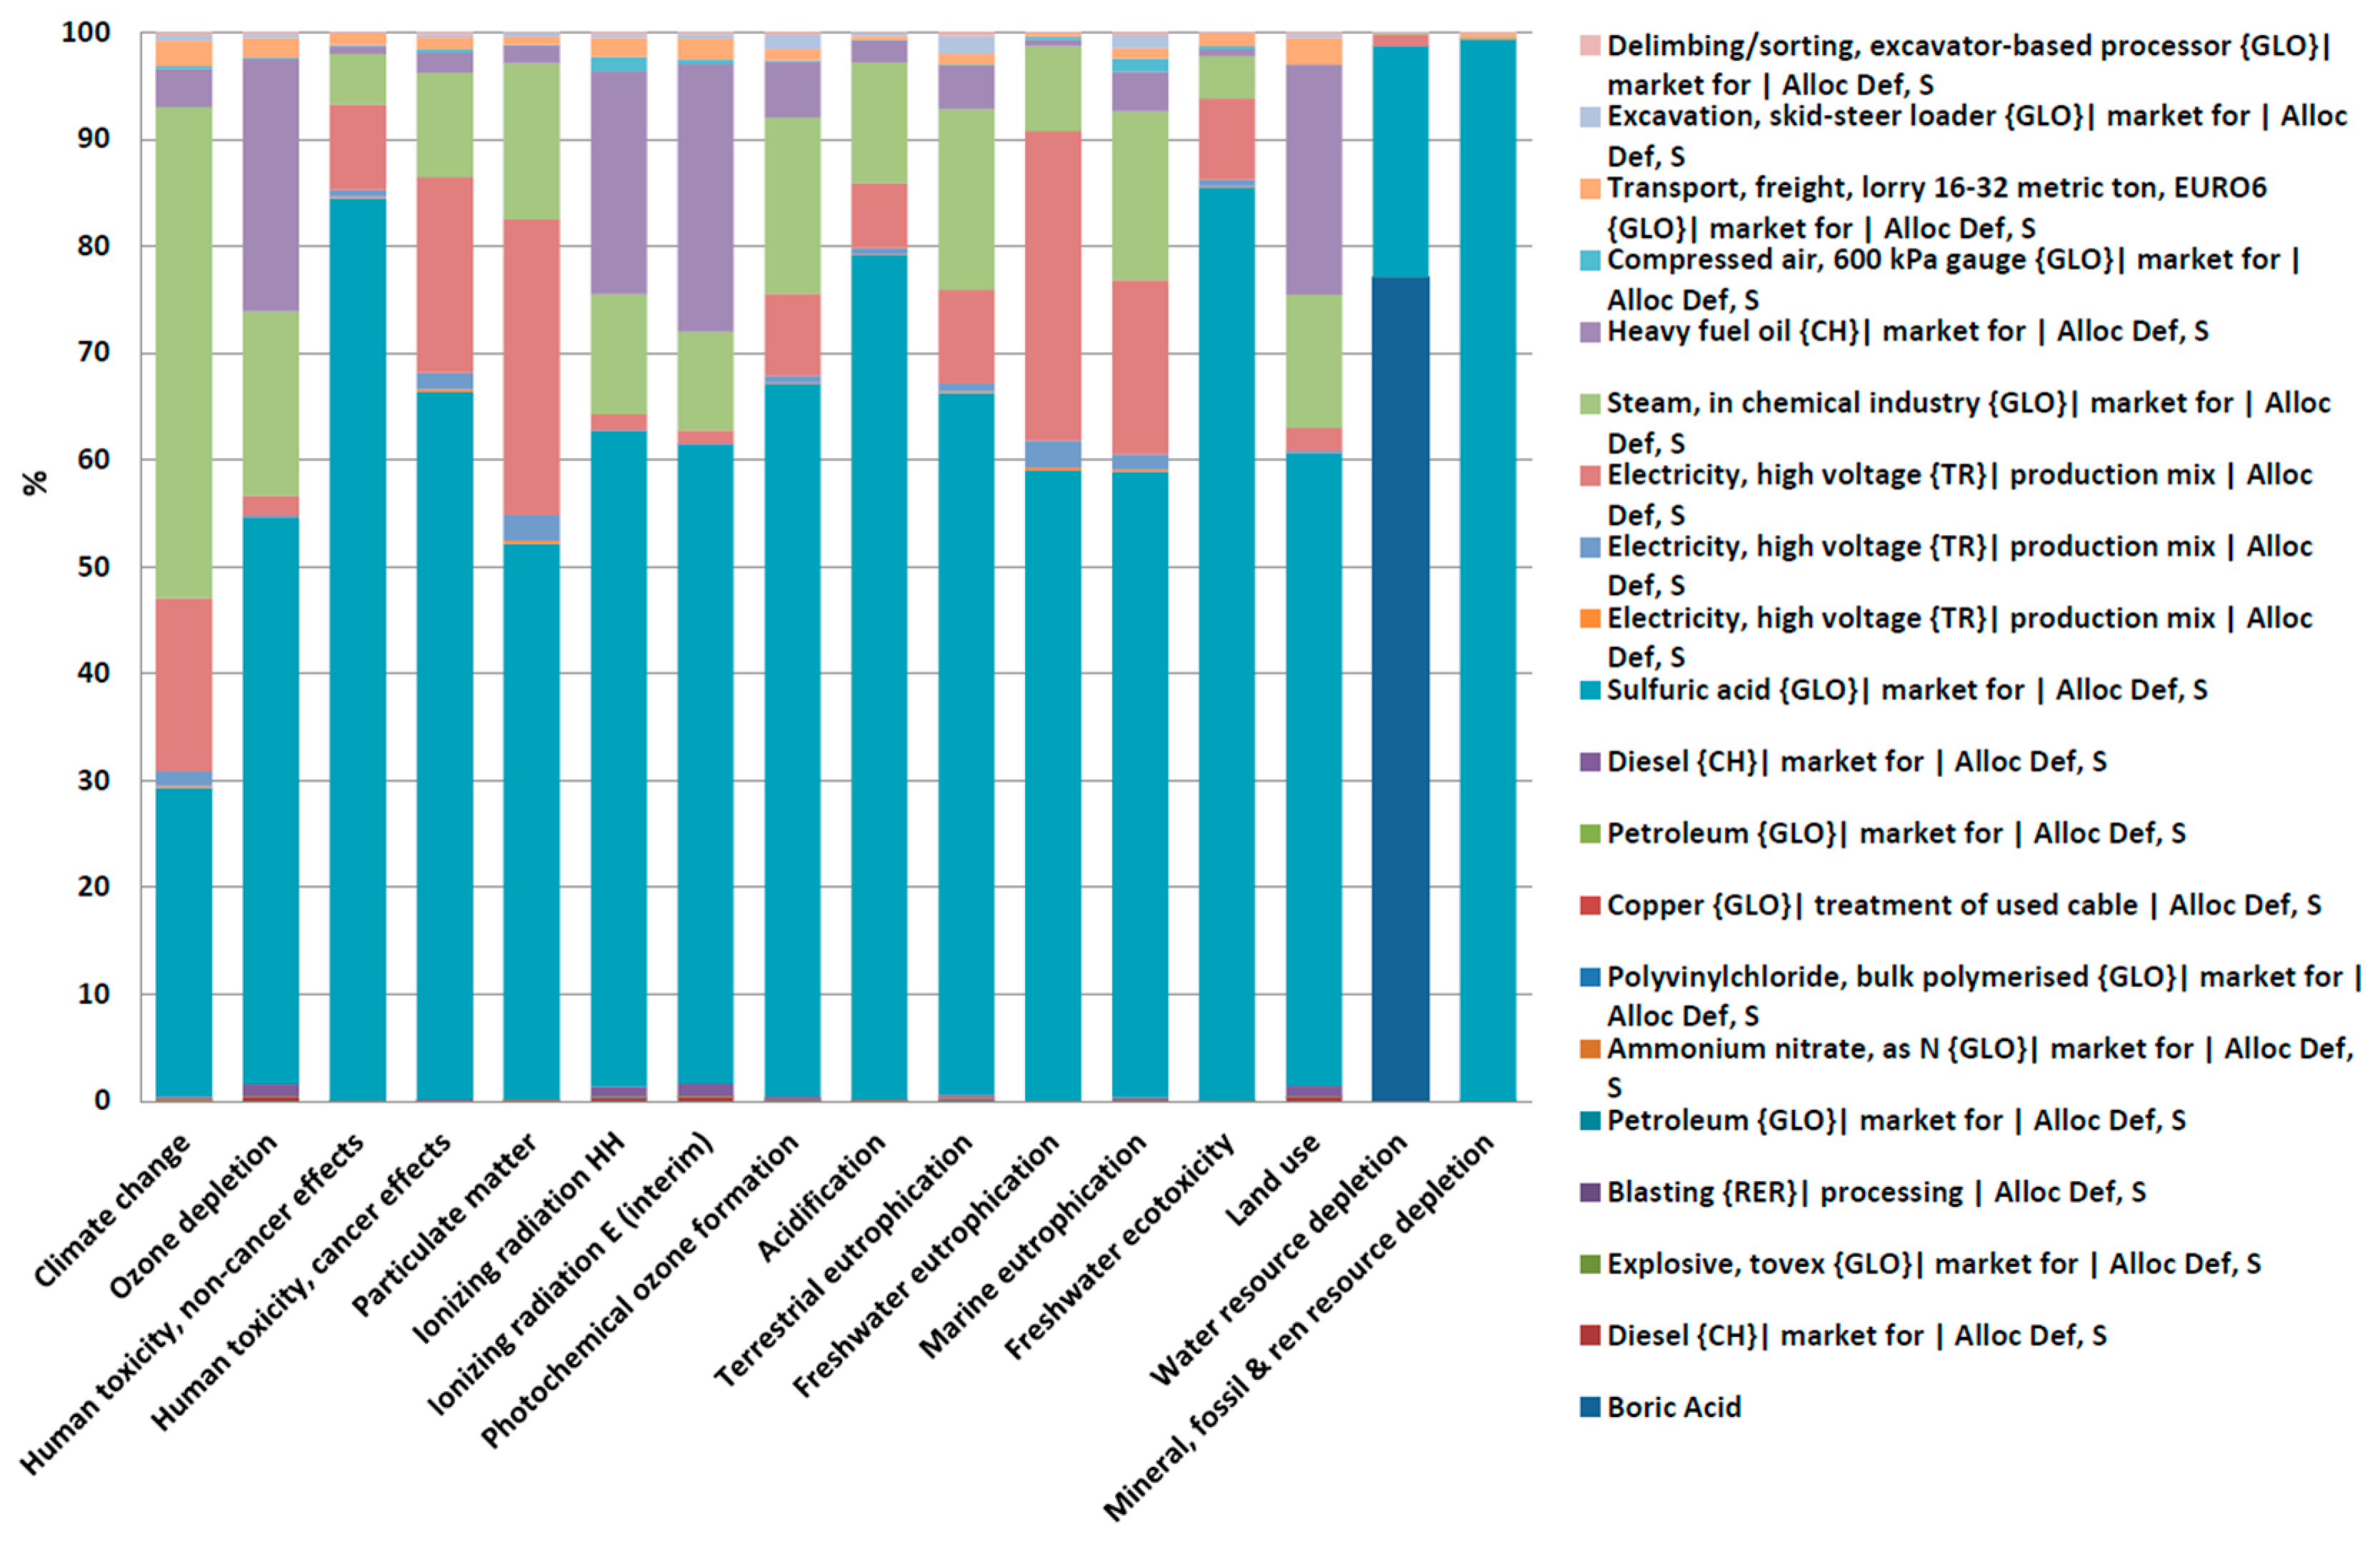
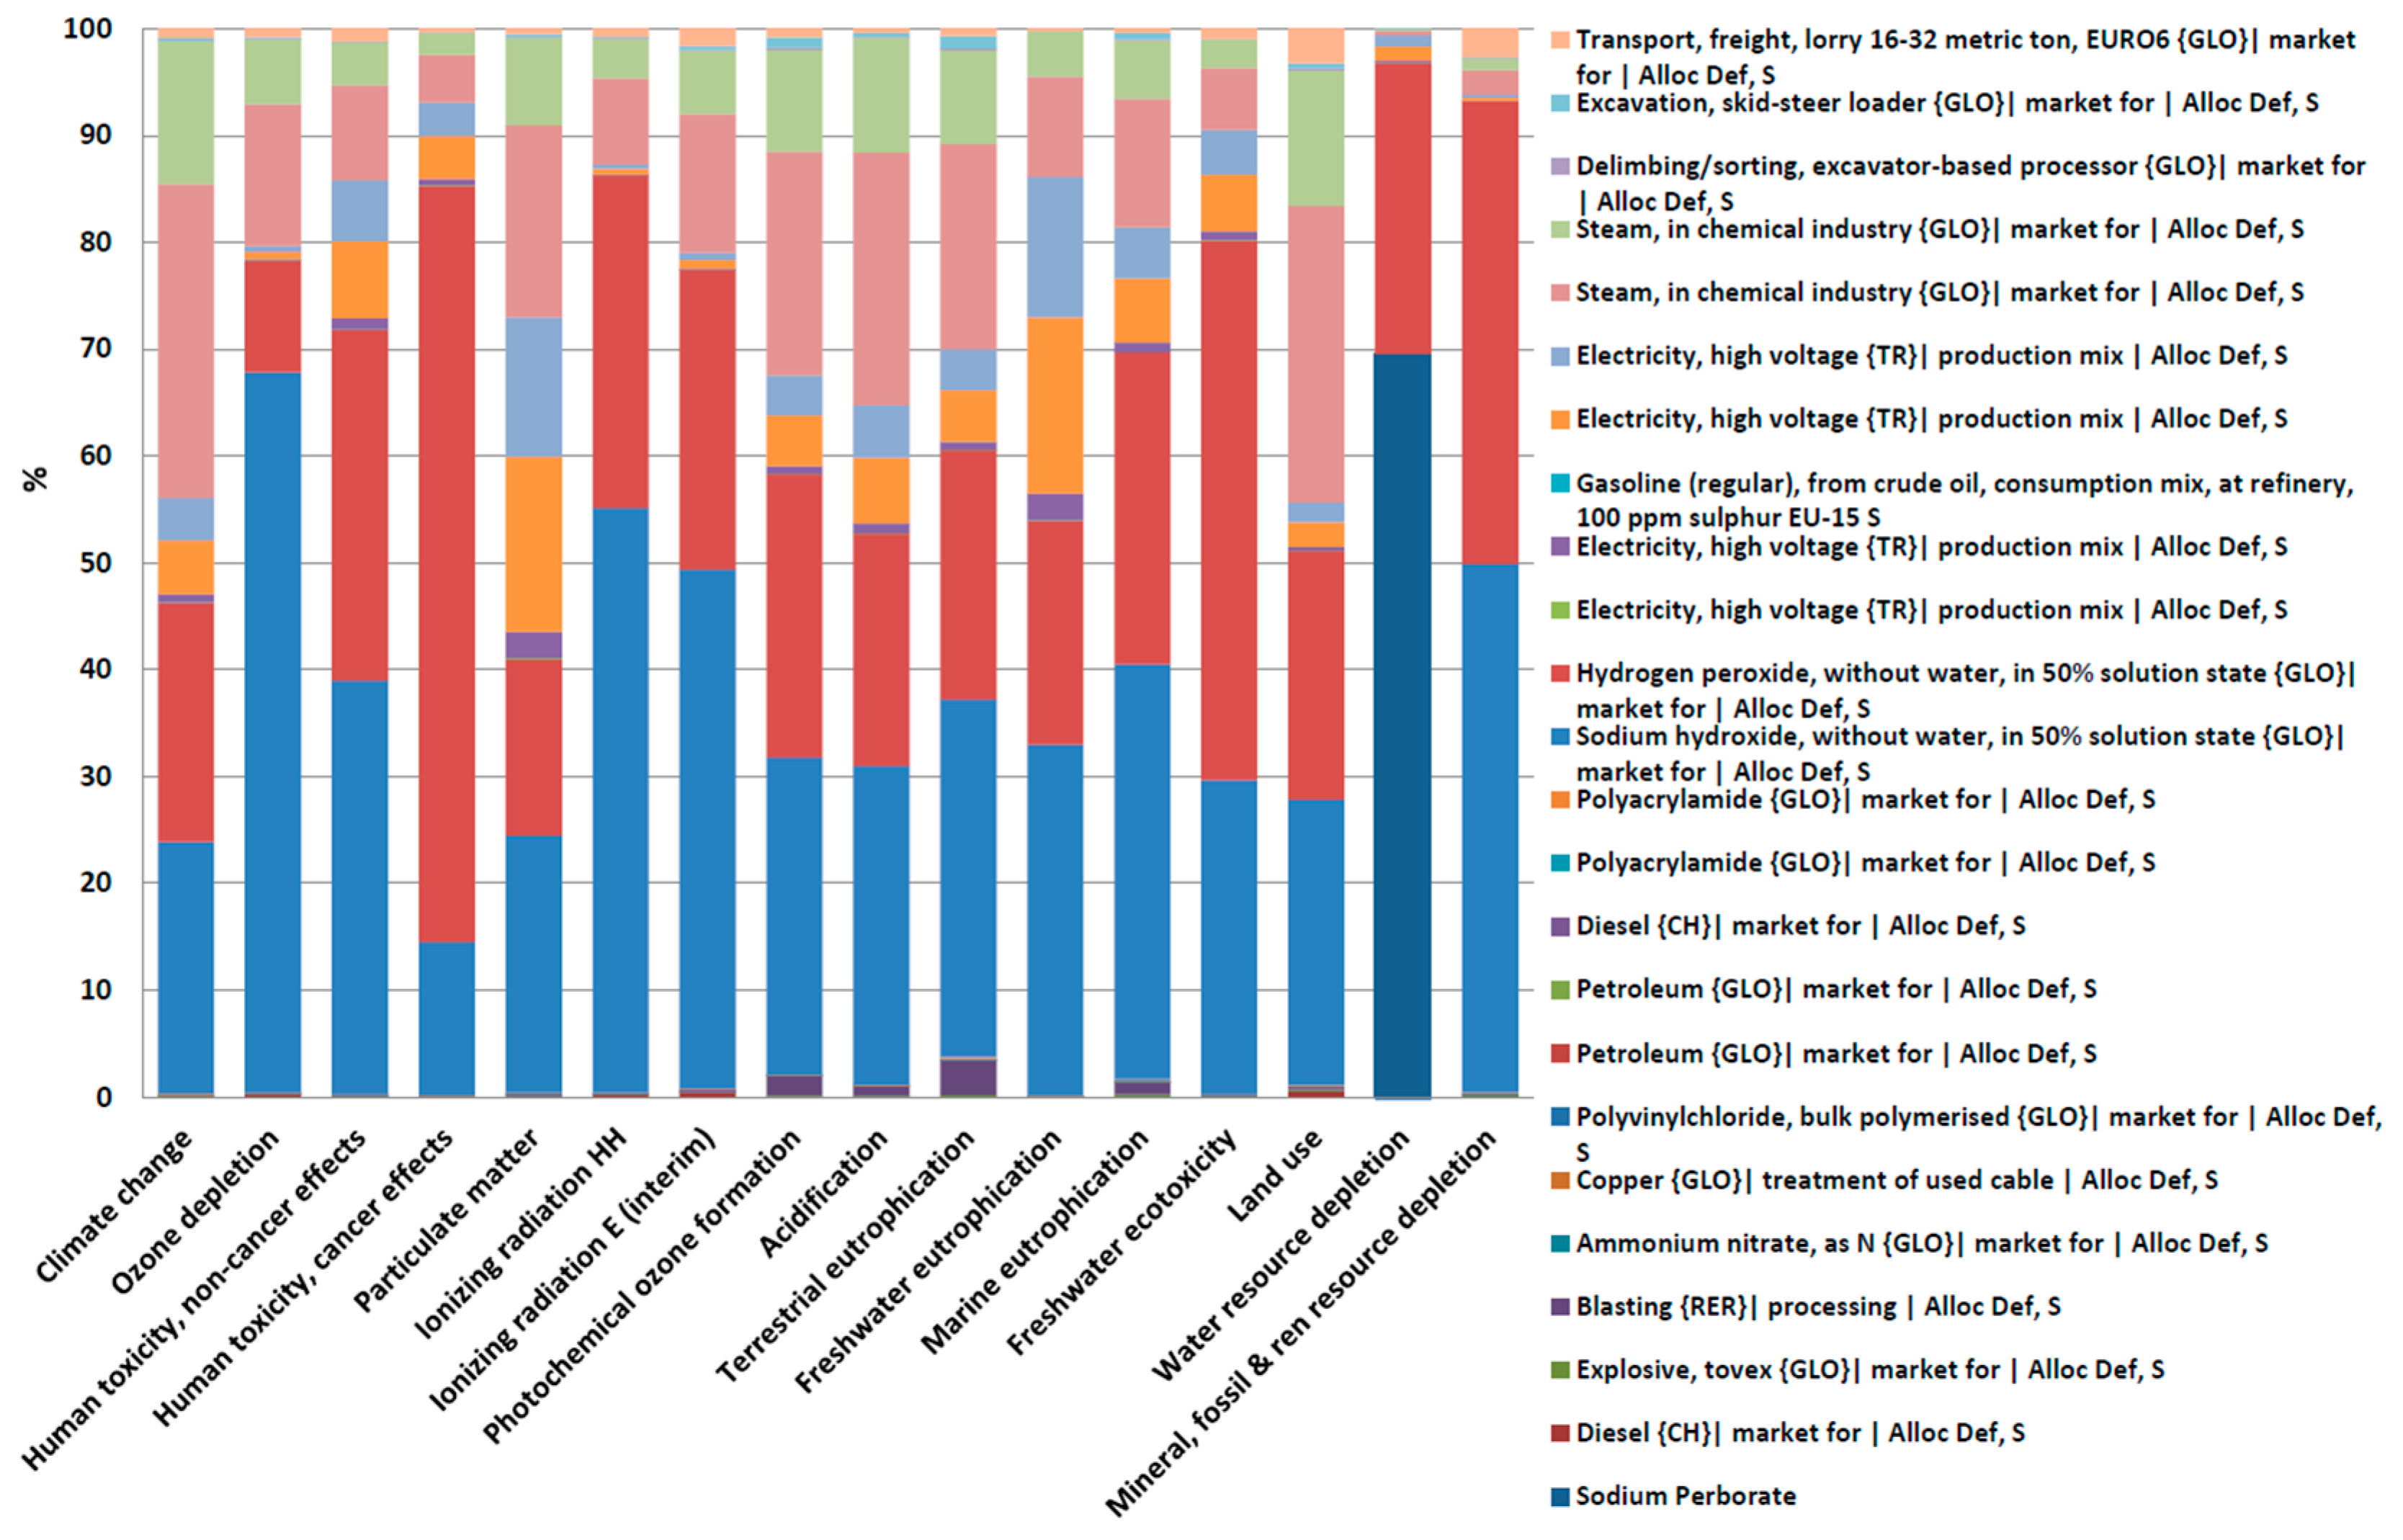
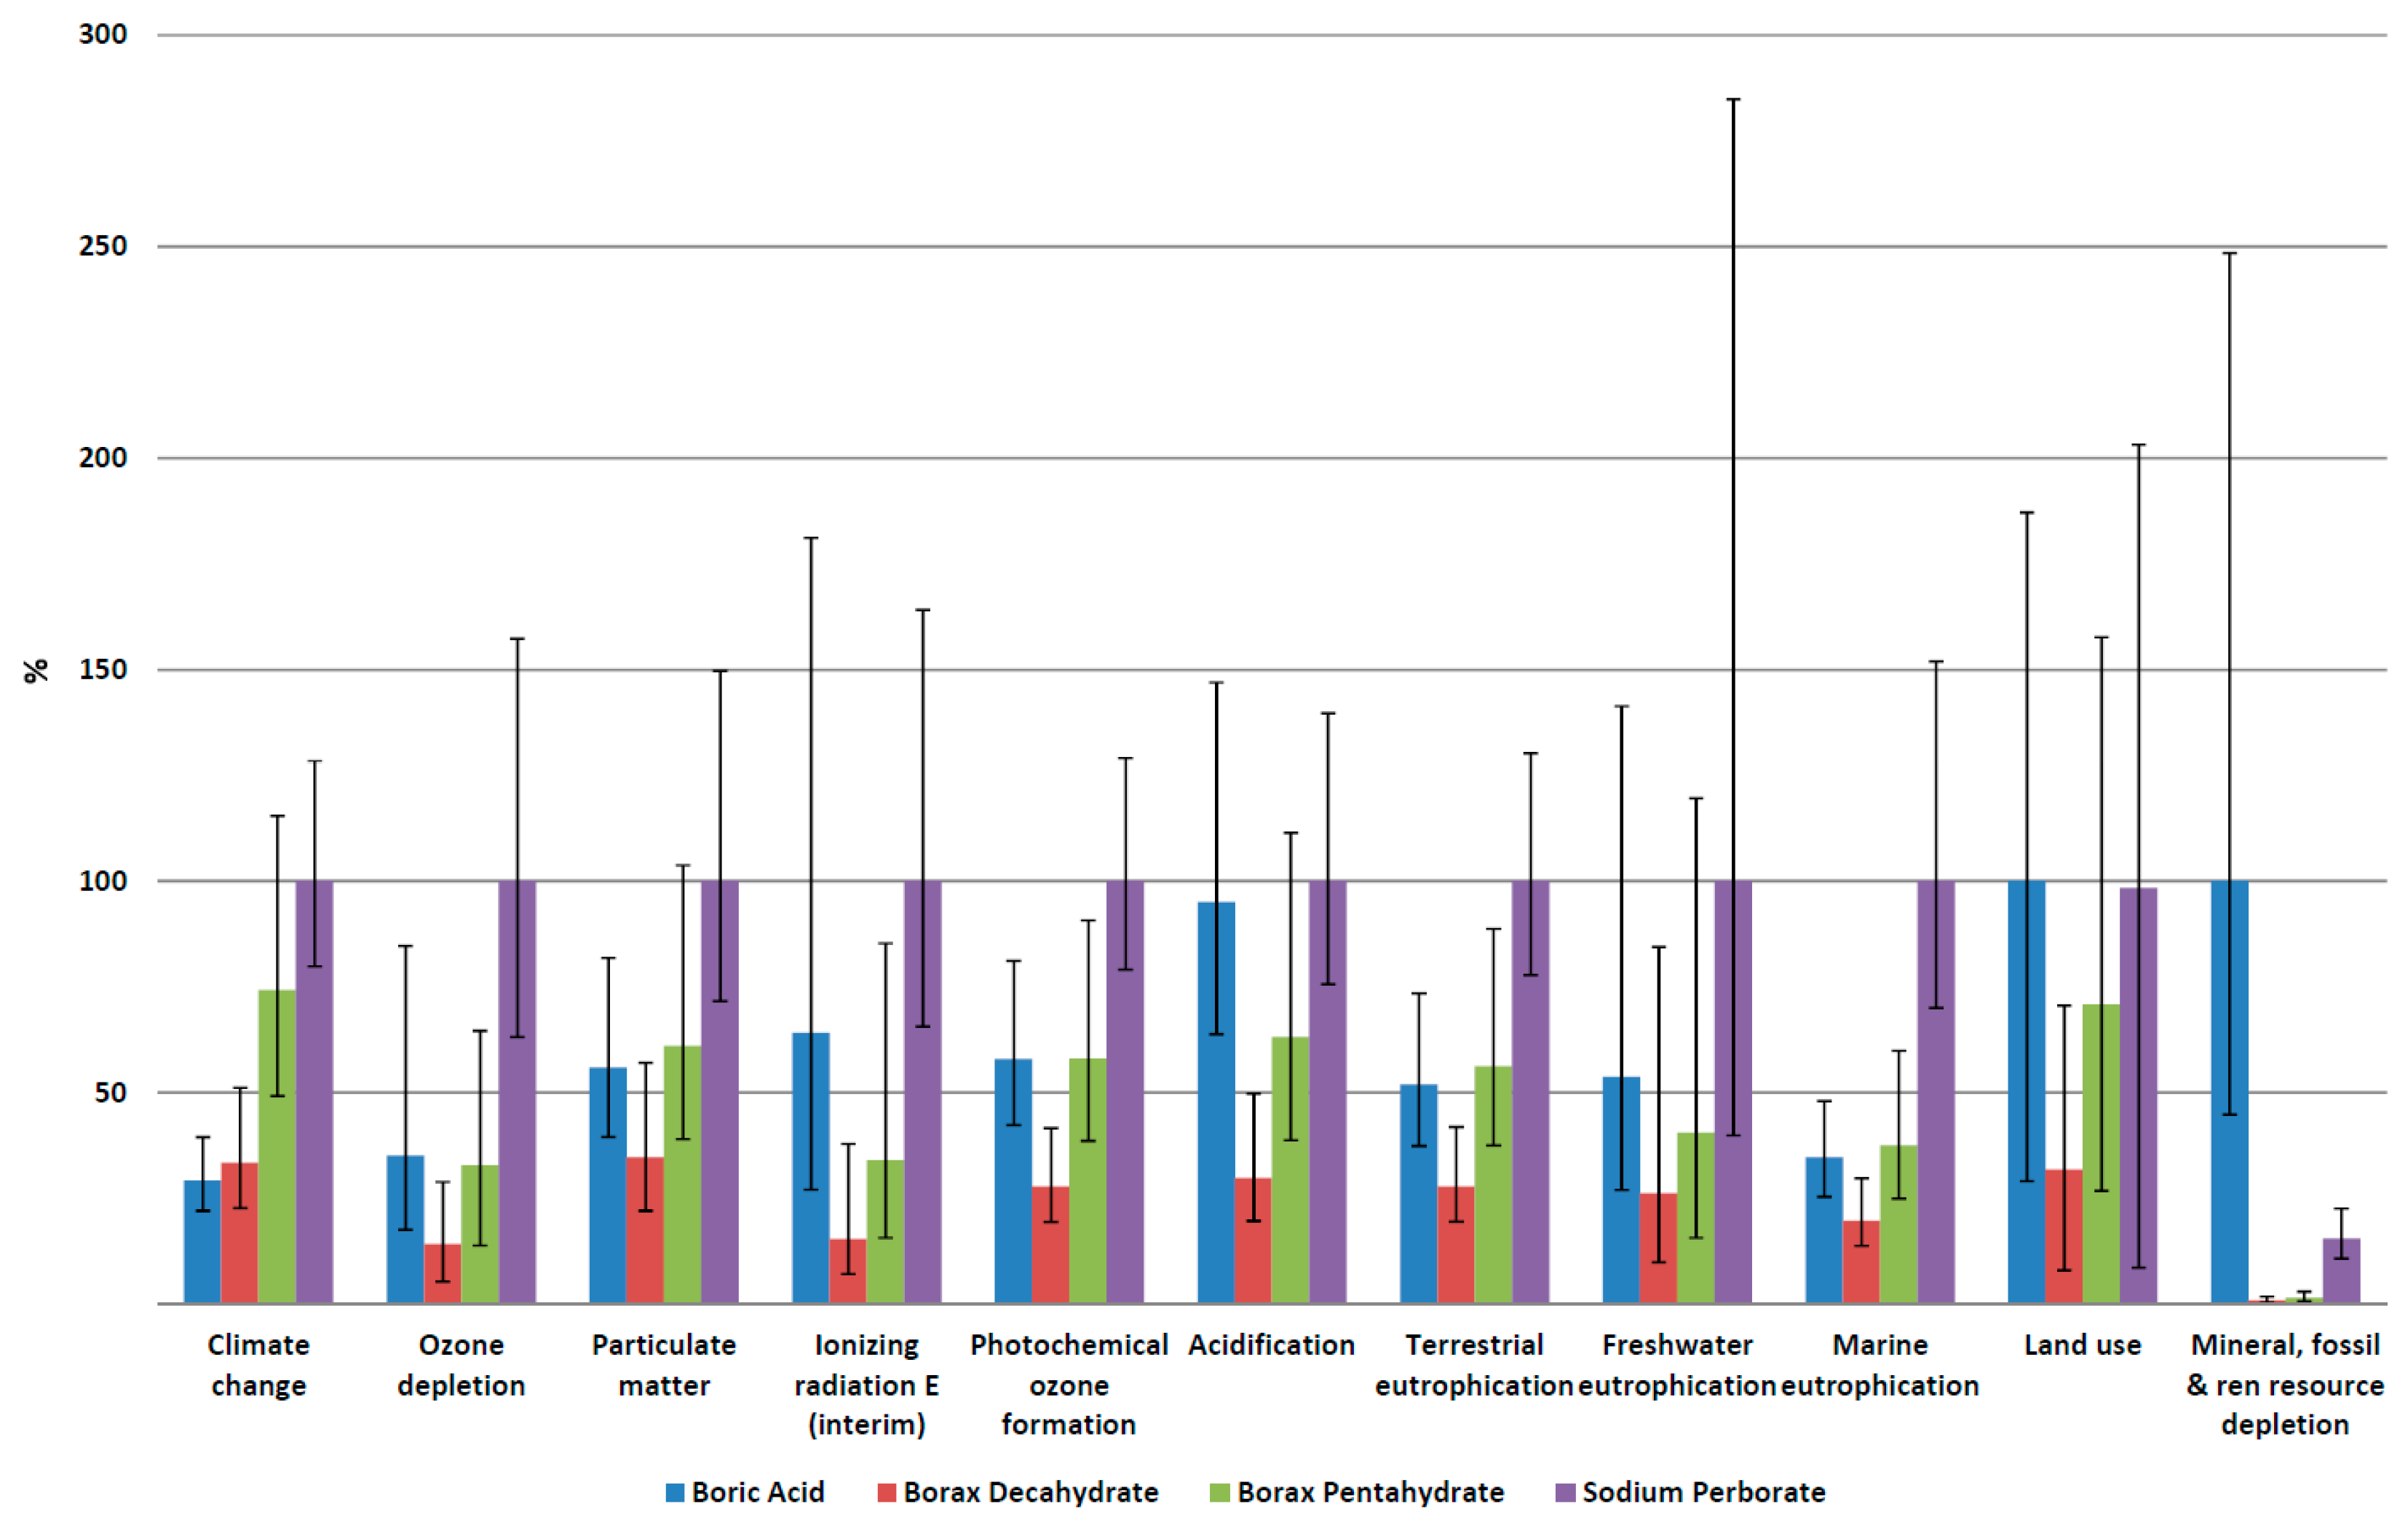
3. Results
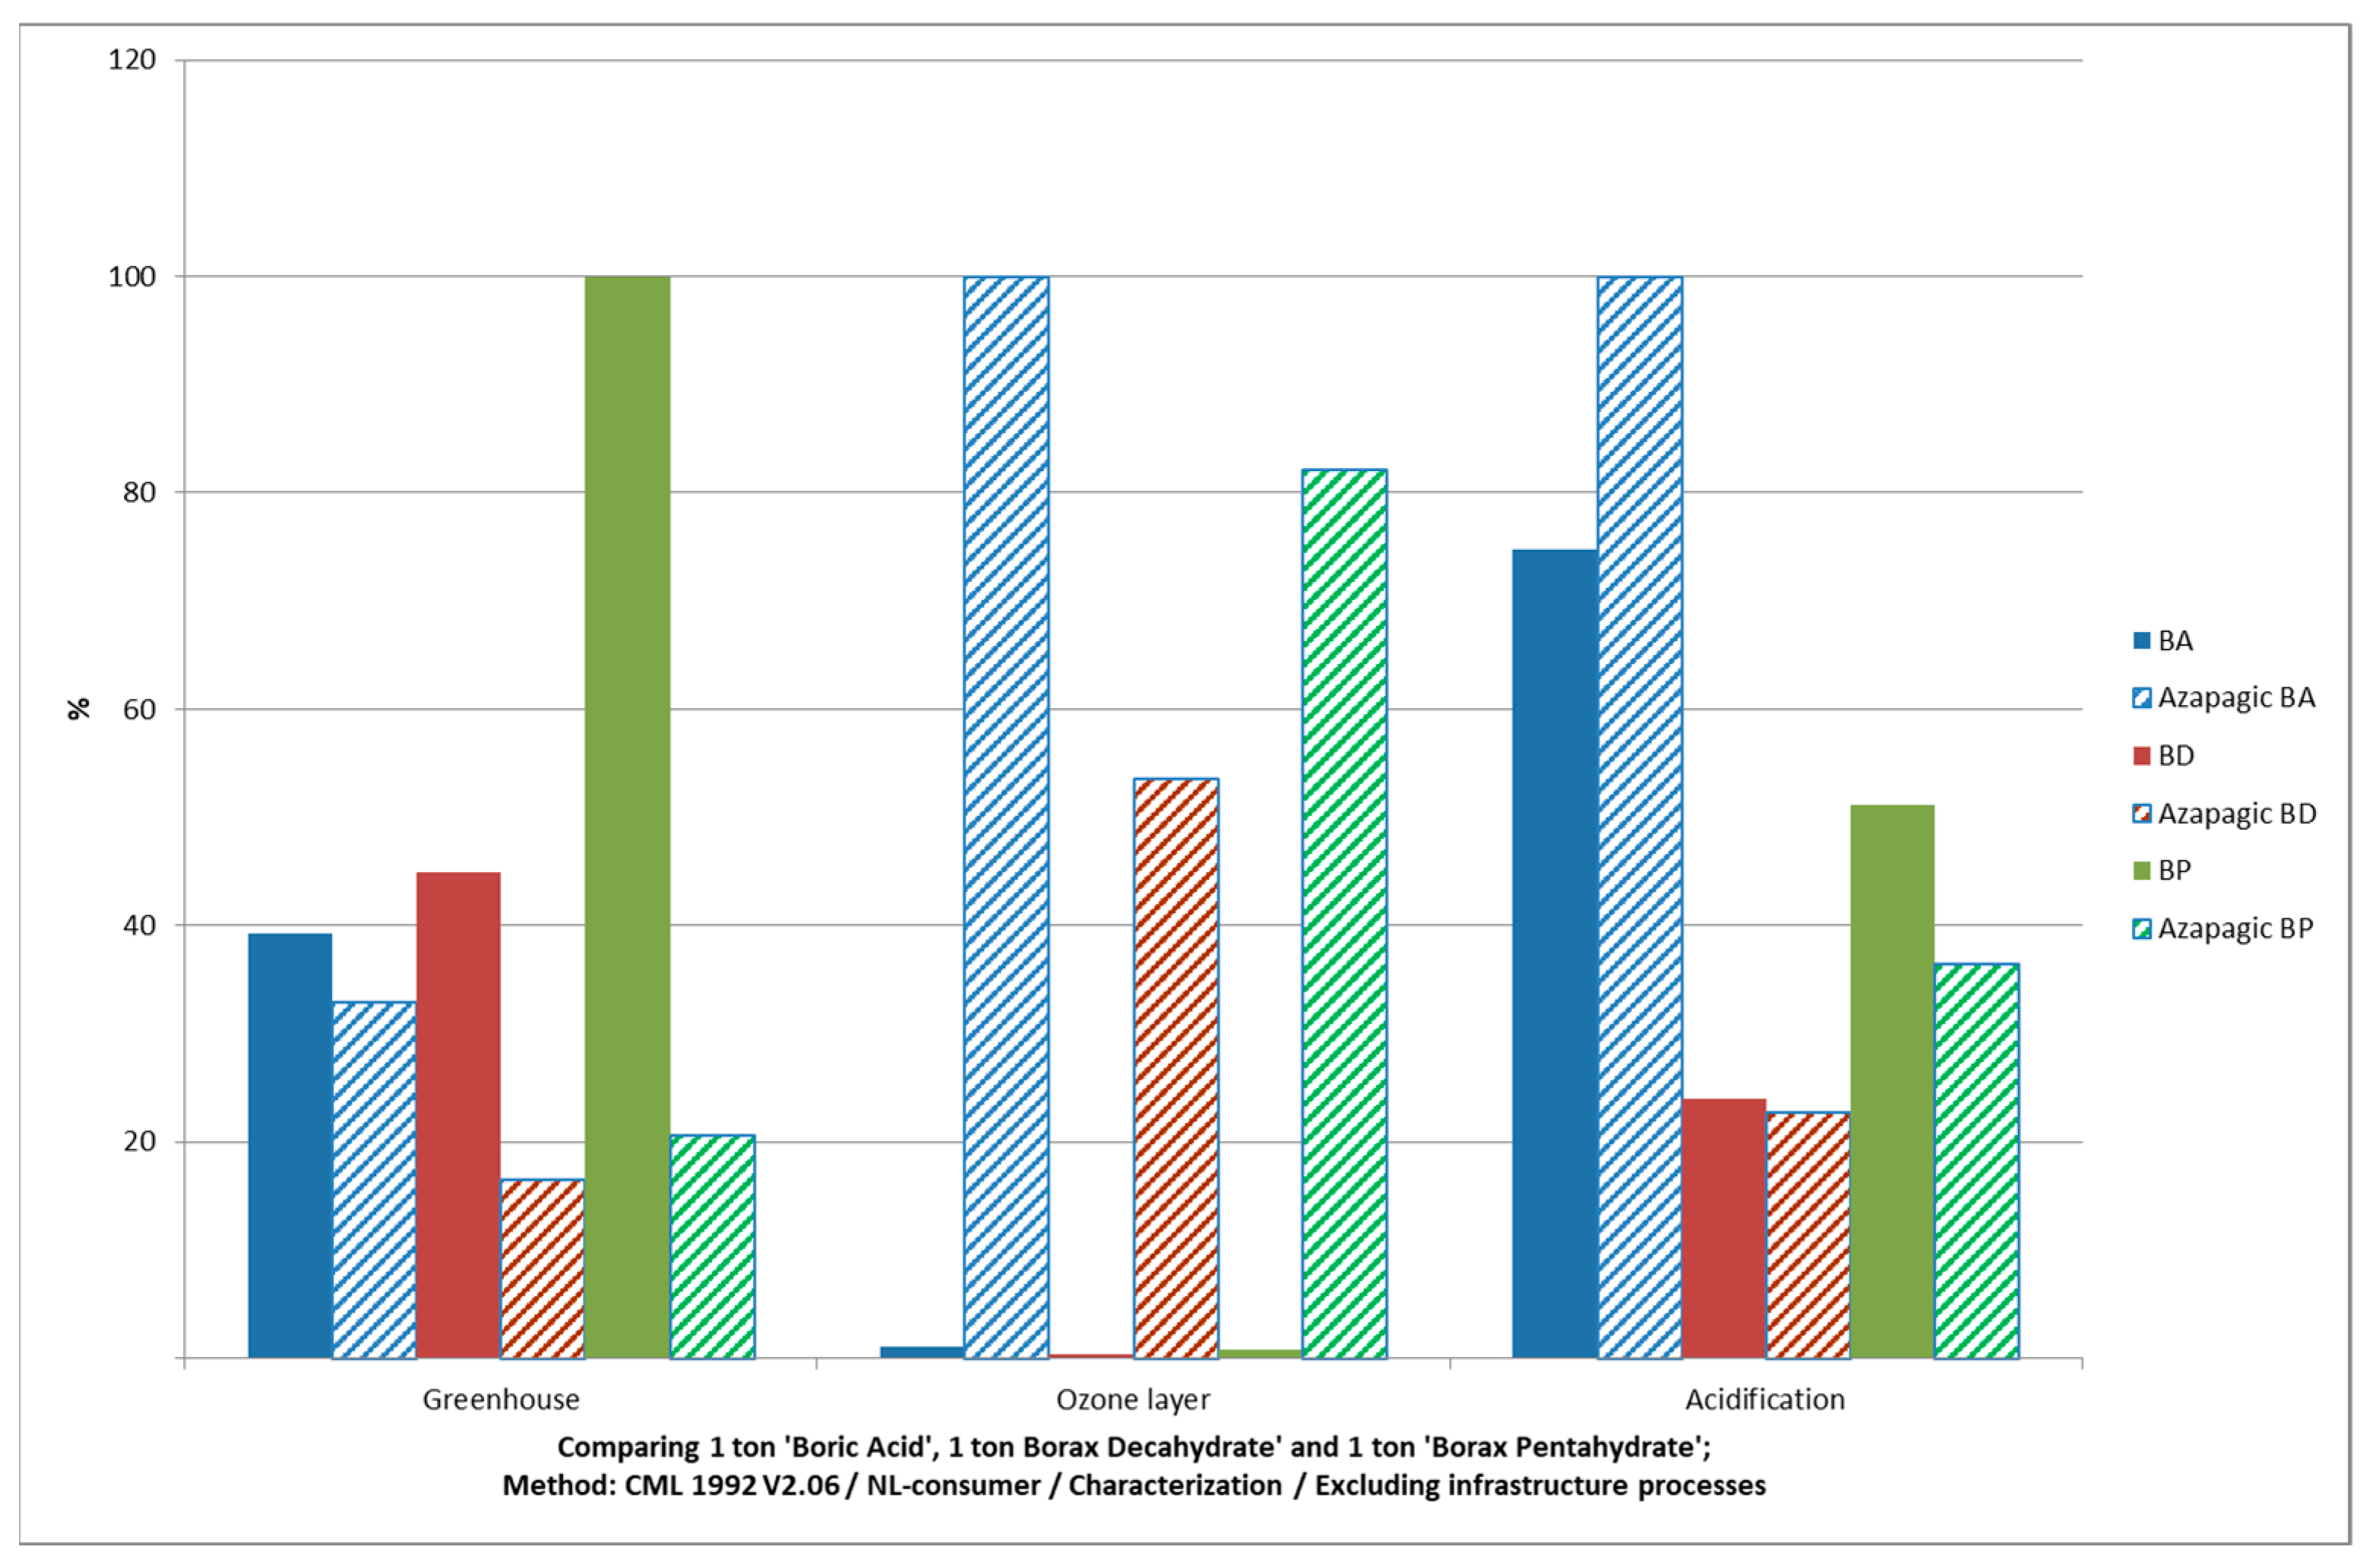
4. Discussion
5. Conclusions
Supplementary Materials
Author Contributions
Funding
Institutional Review Board Statement
Informed Consent Statement
Data Availability Statement
Conflicts of Interest
Abbreviations
| BA | Boric Acid |
| BD | Borax Decahydrate |
| BP | Borax Pentahydrate |
| kg CO2 eq | Carbon Dioxide Equivalent |
| kg CFC-11 eq | Ozone Depletion Potential OZDP kg CFC-11 Equivalent |
| CTUh | Comparative Toxic Unit for Humans |
| kBq U235 eq | Unit for Ionizing Radiation Described in Kilo Becquerel |
| U-235 Equivalent | |
| kg NMVOC eq | Non-methane Volatile Organic Compounds Equivalent |
| Molc N eq | Mole of Nitrogen Equivalent |
| kg P eq | Kilograms of Phosphorus Equivalent |
| kg N eq | Kilogram of Nitrogen Equivalent |
| CTUe | Comparative Toxic Unit for Ecosystems |
| kg C deficit | Kilograms of Carbon Deficit |
| m³ water eq | Volume of Water Equivalent |
| kg Sb eq | Kilogram of Antimony Equivalent |
| MJ | Mega Joule |
| SP | Sodium Perborate |
Appendix A

| Usage Industry | Usage Area |
|---|---|
| Military and armored vehicles | Armor plates, ceramic plates, firearm barrels, etc. |
| Glass | Borosilicate glasses, laboratory glasses, aircraft glasses, boron glass, pyrex, insulated glass fiber, textile glass fiber, optical fibers, glass ceramics, bottles, other float glasses, automotive glasses, etc. |
| Electronics and Computer | Current plates, heat-wear resistant fiber optic cables, semiconductors, vacuum tubes, dielectric materials, capacitors, delayed fuses, microchips, LCD screens, CD drivers, electrical capacitors, batteries, laser printer toners, cell phones, modems, televisions, etc. |
| Energy | Storage of solar energy, solar cells, fuel cells, etc. |
| Photography and Vision Systems | Camera, lenses, cameras, and binoculars. |
| Pharmaceutical and Cosmetics | Disinfectants, antiseptics, toothpastes, lens solutions, colognes, perfumes, shampoos, etc. |
| Agricultural | Biological growth and control chemicals, fertilizers, pest-plant killers, weeds, etc. |
| Chemical | Reduction of some chemicals, electrolytic processes, flotation drugs, bath solutions, catalysts, petroleum paints for waste cleaning purposes, non-flammable and non-melting paints, textile paints, adhesives, cooling chemicals, corrosion inhibitors, ink, paste and varnishes, matches, lime inhibitors, disinfectant liquids, soap, powder detergents, powder whiteners, brighteners, embalming, etc. |
| Construction | For enhancing strength and insulation of cement |
| Protector | Wood materials, wood preservatives, dryers of paint and varnish |
| Nuclear | Reactor components, neutron absorbers, reactor control rods, safety purposes in accidents, and nuclear waste storage |
| Space and aviation | Friction-abrasion and heat resistant materials, rocket fuel, satellites, planes, helicopters, zeppelins, balloons, etc. |
| Medicine | In osteoporosis treatment, allergic diseases, psychiatry, bone development, and magnetic resonance imaging devices |
| Automotive | Airbags, hydraulics, plastic parts, metal parts, oils, antifreezes, etc. |
| Metallurgy | In the coating industry, stainless and alloy steel, abrasion-resistant materials, abrasives, etc. |
| Paper | As a whitener |
| Sports equipment | Ski equipment, tennis rackets, fishing rods, golf clubs, impact protectors, etc. |
| Textile | Heat resistant fabrics, fire retardant, preventive cellulosic materials, isolation materials, textile dyes, leather colorants, artificial silk polishing materials, etc. |
References
- ETI Mining Operations General Directorate. Eti Mine Works General Directorate Sector Report; ETI Mining Operations General Directorate: Ankara, Turkey, 2019. [Google Scholar]
- Eryıldız, B. Su-Atık Sulardan Bor Giderimi. Master’s Thesis, Istanbul Technical University, Istanbul, Turkey, 2019. [Google Scholar]
- Taş, O.O. Emet Espey Bor Tesisi Ince Gölet Atiklarinin Kolon Flotasyonu Ile Zenginlestirilebilirliğinin Araştirilmasi. Master’s Thesis, Dumlupınar University, Kütahya, Turkey, 2010. [Google Scholar]
- Karcıoğlu, Z. Endüstriyel Atıksulardan Kimyasal Koagülasyon Yöntemi Ile Bor Giderimi. Master’s Thesis, Ataturk University, Erzurum, Turkey, 2009. [Google Scholar]
- Karakaş, I.H. Bor Endüstrisi Atıksularının Nanofiltrasyonla Arıtılabilirliğinin Incelenmesi. Master’s Thesis, Ataturk University, Erzurum, Turkey, 2008. [Google Scholar]
- Kerenciler, S. Emet Espey Bor Tesisi Tesisi Ince Gölet Atıklarının Jameson Flotasyon Kolonunda Zenginleştirilebilirliğinin Araştırılması. Master’s Thesis, Dumlupınar University, Kütahya, Turkey, 2008. [Google Scholar]
- Güney, B. Bor Oksitten Elementel Bor Tozu Üretim Parametrelerinin Araştırılması. Master’s Thesis, Gazi University, Ankara, Turkey, 2007. [Google Scholar]
- Yılmaz, O. Balıkesir-Bigadiç Bor Atıklarının Flotasyon Yöntemiyle Zenginleştirilmesi Çalışmaları. Master’s Thesis, Balıkesir University, Balıkesir, Turkey, 2006. [Google Scholar]
- Yenmez, N. Stratejik bir maden olarak bor minerallerin Türkiye için önemi. J. Geogr. 2009, 19, 59–94. [Google Scholar]
- Ferreira, H.; Leite, M.G.P. A Life Cycle Assessment study of iron ore mining. J. Clean. Prod. 2015, 108, 1081–1091. [Google Scholar] [CrossRef]
- Şengül, H.; Bayrak, F.; Köksal, M.A.; Ünver, B. A cradle to gate life cycle assessment of Turkish lignite used for electricity generation with site-specific data. J. Clean. Prod. 2016, 129, 478–490. [Google Scholar] [CrossRef]
- Farjana, S.H.; Huda, N.; Mahmud, M.P.; Lang, C. A global life cycle assessment of manganese mining processes based on EcoInvent database. Sci. Total. Environ. 2019, 688, 1102–1111. [Google Scholar] [CrossRef] [PubMed]
- Farjana, S.H.; Huda, N.; Mahmud, M.P.; Lang, C. Comparative life-cycle assessment of uranium extraction processes. J. Clean. Prod. 2018, 202, 666–683. [Google Scholar] [CrossRef]
- Farjana, S.H.; Huda, N.; Mahmud, M.P. Life cycle assessment of cobalt extraction process. J. Sustain. Min. 2019, 18, 150–161. [Google Scholar] [CrossRef]
- Norgate, T.; Haque, N. Using life cycle assessment to evaluate some environmental impacts of gold production. J. Clean. Prod. 2012, 29, 53–63. [Google Scholar] [CrossRef]
- Azapagic, A. Life cycle assessment and its application to process selection, design and optimisation. Chem. Eng. J. 1999, 73, 1–21. [Google Scholar] [CrossRef]
- An, J.; Xue, X. Life cycle environmental impact assessment of borax and boric acid production in China. J. Clean. Prod. 2014, 66, 121–127. [Google Scholar] [CrossRef]
- Wu, J.; Li, B.; Lu, J. Life cycle assessment on boron production: Is boric acid extraction from salt-lake brine environmentally friendly? Clean Technol. Environ. Policy 2021, 23, 1981–1991. [Google Scholar] [CrossRef]
- Etimaden. Eti Maden Operations General Directorate. Available online: https://www.etimaden.gov.tr.htm (accessed on 5 April 2021).
- Öner, U. Türkiye’nin Alternatif Enerji Kaynakları Ve Bor Madeninin Endüstride Kullanım Alanlarının Araştırılması. Master’s Thesis, Istanbul Commerce University, Istanbul, Turkey, 2007. [Google Scholar]
- Aykul, Ö. Eti Bor Emet-Hisarcık Kolemanit Atıklarının Dekrepitasyon Yöntemi Ile Zenginleştirilmesi. Master’s Thesis, Dumlupınar University, Kütahya, Turkey, 2008. [Google Scholar]
- Sarıhan, Z.B.O. Sulardan Bor Giderimi Ve Elde Edilen Çamurdan Katma Değeri Yüksek Ürün Geri Kazanimi Ile Sürdürülebilir Bir Proses Geliştirilmesi. Master’s Thesis, Gebze Technical University, Gebze, Turkey, 2019. [Google Scholar]
- Çolak, S.H. Kolemanit Atıklardan Kimyasal Liç Yöntemiyle Bor Türevlerinin Eldesi. Master’s Thesis, Çanakkale Onsekiz Mart University, Çanakkale, Turkey, 2020. [Google Scholar]
- Kılınç, E.; Mordoğan, H.; Tanrıverdi, M. Bor minerallerinin önemi, potansiyeli, üretimi ve ekonomisi. In Endüstriyel Hammaddeler Sempozyumu; Dokuz Eylül Üniversitesi: İzmir, Turkey, 2001; pp. 18–19. [Google Scholar]
- Eti Mining Operations General Directorate. Eti Mine Works General Directorate Sector Report; Eti Mining Operations General Directorate: Ankara, Turkey, 2020. [Google Scholar]
- Handırı, İ. Kolemanitten Amonyum Tuzları, Inorganik Ve Organik Asitler Kullanılarak Borik Asit Üretimi. Master’s Thesis, Süleyman Demirel University, Isparta, Turkey, 2010. [Google Scholar]
- Ataş, A. Bigadiç Bor Açık Işletmesinin Bilgisayar Yardımıyla Modellenerek Revizyonu. Master’s Thesis, Afyon Kocatepe University, Afyonkarahisar, Turkey, 2019. [Google Scholar]
- Durmaz, K. Eti Maden İşletmeleri Hisarcık Barajı Atıklarının Seramik Sektöründe Kullanılabilirliğinin Araştırılması. Master’s Thesis, Dumlupınar University, Kütahya, Turkey, 2018. [Google Scholar]
- Sargın, S.S. Emet Bor Işletme Müdürlüğü Espey Açik Ocak Işletmesinin Iş Sağliği Ve Güvenliğinin Farkli Risk Değerlendirme Yöntemleri Ile Analizi. Master’s Thesis, Dumlupınar University, Kütahya, Turkey, 2019. [Google Scholar]
- Yegül, E.E. Bor Zenginleştirme Tesislerinde Araürün Tenörlerinin Arttırılması Için Yöntemlerin Incelenmesi. Master’s Thesis, Hacettepe University, Ankara, Turkey, 2007. [Google Scholar]
- Ak, M. Emet Bor Işletme Müdürlüğü Hisarcık Ve Espey Konsantratör Atıklarının Mikrodalga Enerjisi Yardımıyla Zenginleştirilebilirliğinin Araştırılması. Master’s Thesis, Dumlupınar University, Kütahya, Turkey, 2011. [Google Scholar]
- Türkiye Cumhuriyeti Başbakanlık Devlet Planlama Teşkilatı. Kimya Sektörü Özel Ihtisas Komisyonu Bor Bileşikleri Alt Komisyon Raporu; Türkiye Cumhuriyeti Başbakanlık Devlet Planlama Teşkilatı: Ankara, Turkey, 1987; p. 13. [Google Scholar]
- Türkiye Cumhuriyeti Başbakanlık Devlet Planlama Teşkilatı. Madencilik Özel Ihtisas Komisyonu Raporu; Türkiye Cumhuriyeti Başbakanlık Devlet Planlama Teşkilatı: Ankara, Turkey, 2001; pp. 36–42. [Google Scholar]
- Bongono, J.; Elevli, B.; Laratte, B. Functional Unit for Impact Assessment in the Mining Sector—Part 1. Sustainability 2020, 12, 9313. [Google Scholar] [CrossRef]
- Langfitt, Q.M. Analyses of Functional Unit and Normalization Options for Presentation of Transportation Life Cycle Assessment Results. Ph.D. Thesis, Washington State University, Pullman, WA, USA, 2017. [Google Scholar]
- Farjana, S.H.; Huda, N.; Mahmud, M.P.; Saidur, R. A review on the impact of mining and mineral processing industries through life cycle assessment. J. Clean. Prod. 2019, 231, 1200–1217. [Google Scholar] [CrossRef]
- Nunes, A.O.; Viana, L.R.; Guineheuc, P.M.; da Silva Moris, V.A.; de Paiva, J.M.; Barna, R.; Soudais, Y. Life cycle assessment of a steam thermolysis process to recover carbon fibers from carbon fiber-reinforced polymer waste. Int. J. Life Cycle Assess. 2018, 23, 1825–1838. [Google Scholar] [CrossRef] [Green Version]
- Türkbay, T.; Bongono, J.; Alix, T.; Laratte, B.; Elevli, B. Prior knowledge of the data on the production capacity of boron facilities in Turkey. Clean. Eng. Technol. 2022; submitted. [Google Scholar]
- Azapagic, A. Environmental System Analysis: The Application of Linear Programming to Life Cycle Assessment. Ph.D. Thesis, University of Surrey, Guildford, UK, 1996. [Google Scholar]
- Bojarski, A.D. Life Cycle Thinking and General Modelling Contribution to Chemical Process Sustainable Design and Operation. Ph.D. Thesis, Universitat Politècnica de Catalunya, Barcelona, Spain, 2010. [Google Scholar]
- Heijungs, R.; Guinée, J.B.; Huppes, G.; Lankreijer, R.M.; Udo de Haes, H.A.; Wegener Sleeswijk, A.; Ansems, A.M.; Eggels, P.G.; Duin, R.V.; De Goede, H.P. Environmental Life Cycle Assessment of Products: Guide and Backgrounds (Part 1); Centre of Environmental Science: Leiden, The Netherlands, 1992. [Google Scholar]
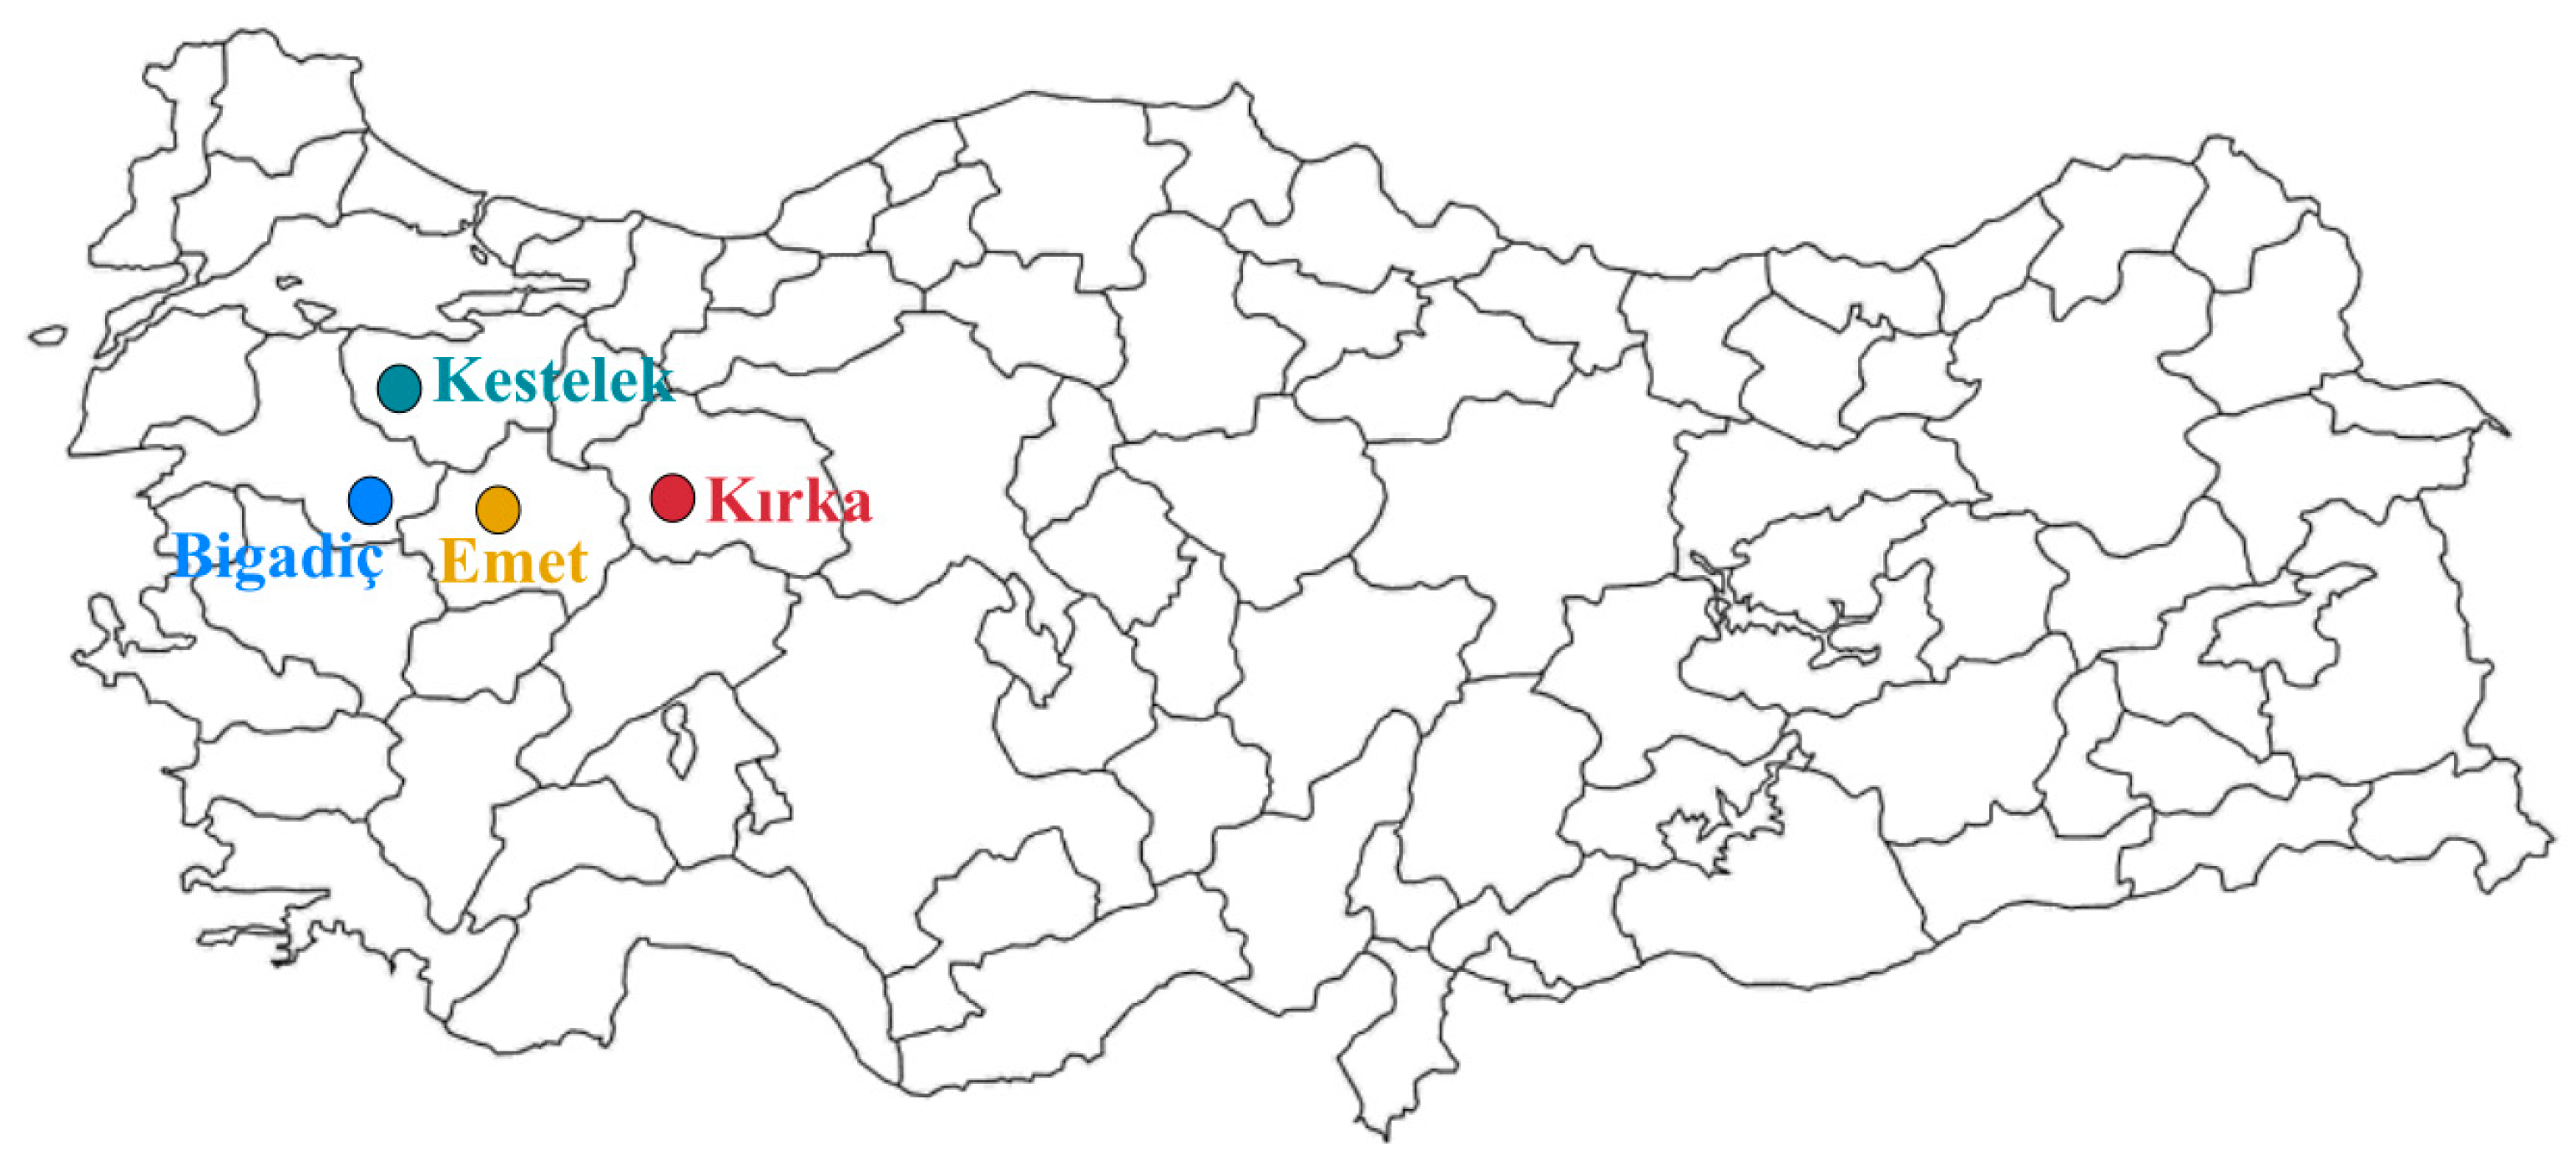


| Facility | Ore Reserve (ton) | Extracted Run-of-Ore | Concentrated Products | Refined Products |
|---|---|---|---|---|
| Emet | 1,806,998.09 | Colemanite | Colemanite | BA |
| Bigadiç | 620,689.75 | Colemanite and Ulexite | Colemanite and Ulexite | Grained Colemanite |
| Kırka | 17,924,014 | Tincal | Tincal | BD, BP |
| Anhydrous Borax | ||||
| Kestelek | 5,254,923 | Colemanite | Colemanite | - |
| Bandırma | - | - | - | BA, BD, BP, SP, Boron Oxide |
Publisher’s Note: MDPI stays neutral with regard to jurisdictional claims in published maps and institutional affiliations. |
© 2022 by the authors. Licensee MDPI, Basel, Switzerland. This article is an open access article distributed under the terms and conditions of the Creative Commons Attribution (CC BY) license (https://creativecommons.org/licenses/by/4.0/).
Share and Cite
Türkbay, T.; Laratte, B.; Çolak, A.; Çoruh, S.; Elevli, B. Life Cycle Assessment of Boron Industry from Mining to Refined Products. Sustainability 2022, 14, 1787. https://doi.org/10.3390/su14031787
Türkbay T, Laratte B, Çolak A, Çoruh S, Elevli B. Life Cycle Assessment of Boron Industry from Mining to Refined Products. Sustainability. 2022; 14(3):1787. https://doi.org/10.3390/su14031787
Chicago/Turabian StyleTürkbay, Tuğçe, Bertrand Laratte, Ayşenur Çolak, Semra Çoruh, and Birol Elevli. 2022. "Life Cycle Assessment of Boron Industry from Mining to Refined Products" Sustainability 14, no. 3: 1787. https://doi.org/10.3390/su14031787
APA StyleTürkbay, T., Laratte, B., Çolak, A., Çoruh, S., & Elevli, B. (2022). Life Cycle Assessment of Boron Industry from Mining to Refined Products. Sustainability, 14(3), 1787. https://doi.org/10.3390/su14031787