Article

Comprehensive Evaluation of the Eco-Geological Environment in the Concentrated Mining Area of Mineral Resources

1
College of Surveying and Mapping Engineering, Changchun Institute of Technology, Changchun 130021, China
2
College of Jilin Emergency Management, Changchun Institute of Technology, Changchun 130012, China
3
School of Environment, Northeast Normal University, Changchun 130117, China
4
College of Water and Environmental Engineering, Changchun Institute of Technology, Changchun 130012, China
*
Author to whom correspondence should be addressed.
Sustainability 2022, 14(11), 6808; https://doi.org/10.3390/su14116808
Submission received: 6 May 2022 / Revised: 28 May 2022 / Accepted: 30 May 2022 / Published: 2 June 2022

Abstract

:
The urbanization rate in China has been increasing in recent years, and along with the increasing intensity of human engineering activities, ecological and geological (eco-geological) degradation have become key factors impeding sustainable urban development. Taking the concentrated mineral exploitation area of Tonghua City as an example, the distribution of mines in the area is concentrated and the spatial heterogeneity is significant. This paper includes 14 evaluation indicators in three aspects: eco-geological environment background, anthropogenic and mining engineering activities, and environmental pollution. Then, based on game theory combined with ANP-CV (Analytic Network Process and Coefficient of Variation), two empowerment methods, GIS spatial calculation is used to evaluate the eco-geological environment quality (EEQ). The results showed that the EEQ was divided into grades I–V from high to low, with areas of 21.13%, 30.35%, 27.00%, 14.30%, and 7.22%, respectively; the EEQ of the Hun River basin has a high spatial autocorrelation and low EEQ, and the EEQ grade of mines was divided on this basis; the hot spot analysis is useful for determining the EEQ, as well as for allocating mine restoration resources in a sensible manner. Finally, we propose countermeasures to improve EEQ, and this study can provide a scientific basis for ecological construction and geological environmental protection in Tonghua City.

1. Introduction

Ore demand remains high around the world, particularly in China, the United States, India, and other populated countries [1,2]. With the growth of consumer markets in developing countries, energy demand is rising, and ore demand frequently surpasses supply [3,4,5]. For example, global iron ore production has increased 1.77 times since the 1970s [6], demand for cobalt ore has increased in the rapidly growing electric vehicle market [7], and global coal power continues to expand despite the Paris Agreement requirement to decarbonize global electricity generation by mid-century [8]. Since 1978, a huge number of resource-based cities have been built to support China’s rapid urbanization pace [9], and the entire process, from extraction to transportation to consumption, has resulted in different levels of environmental degradation [10]. In China, high-intensity urban mineral resource development has constrained the sustainable development of towns and cities [11], and mine rehabilitation has become an inevitable need for the sustainable development of the mining industry [12]. A quantitative evaluation of the eco-geological environment quality (EEQ) of mining areas is beneficial to the pre-planning of mine ecological restoration projects [13]. The main objective of this study is to explore methods suitable for the impactful evaluation of regional mine eco-geological environments to guide mineral resource development and environmental protection in mining cities or key mining areas.
The geological environment is the part of the lithosphere close to the earth’s surface that interacts with the atmosphere, water, and biosphere [14], and has a special and close connection with the development of human society. Based on the theory of environmental geology [15], the essence of mine geology refers to the human–earth relationship, i.e., the relationship between mining activities and the geological environment. The geological action caused by mining activities and various geological phenomena form a relatively independent environmental system [16], i.e., the mine geological environmental system. Broadly speaking, the mining geo-environmental system includes all human activities within the sphere of influence around the mine, and when the natural equilibrium state of the earth’s surface and lithosphere within the system is constantly changed, it leads to many geological environmental problems and prominent geological disasters. The phenomenon of change and destruction resulting from the interaction between mining activities and ore bodies and their processes, and the problems arising from this process of geological activity, are mine geological environmental problems [17]. The Chinese government attaches great importance to such geological environmental issues to avoid inducing greater secondary disasters. In 2009, the Chinese Ministry of Land and Resources issued the Regulations on Mine Geo-environmental Protection, which were amended three times in 2015, 2016, and 2019, respectively, and formulated relevant documents such as the Specification for the Preparation of Mine Geo-environmental Protection and Restoration and Management Program.
The ecological environment and the geological environment interact with each other, influence each other, and constrain each other, forming a relatively unified whole that integrates all environmental elements generated by human-land-life activities [18]. The eco-geological environmental system is the ecological background for resource-based cities to achieve sustainable development and the key to promoting the coordinated development of regional resources, the environment, and the economy and society [19]. The Chinese State Council announced the National Sustainable Development Plan for Resource-based Cities in 2013 to guide the sustainable development plans of resource-based cities and resource development planning (2013–2020). It is worth noting that the Northeast region is rich in natural resources, including Jilin, Heilongjiang, and Liaoning [20], so much so that more resource-based cities are being formed, but there is less literature on the Northeast region. The damage to the eco-geological environment caused by mines includes the influence of multiple factors, and geological hazards, landscape destruction, and environmental pollution have a cumulative effect [21]. Evaluating eco-geological environmental problems of mines and fully grasping the current situation requires a combination of survey tools such as remote sensing, field sampling, and historical survey data collection [22].
Over the years, many scholars have analyzed and evaluated the eco-geological environmental problems generated by mining activities. Rybak [23] proposed a conceptual plan for waste-free production in mining and metallurgical processes to reduce eco-geological damage. Niemiec [24] analyzed the reclamation model of abandoned mines in the region according to the different eco-geological environmental conditions of abandoned mines. Xiao [25] developed an O-U (Overground-Underground) model to assess the ecological resilience of mining areas. Yuan [26] used a coupled coordination degree model to assess the sustainable development potential of mining cities in the west. Most of the studies in China have focused on large open-pit coal mining areas in western China. In fact, some of the resource-based cities are characterized by “many small mines and few large mines”, and based on this characteristic, “concentrated mining area of mineral resources” have been formed [27], and the EEQ evaluation in this area is still lacking. In general, the comprehensive evaluation of the eco-geological environment in the concentrated mining area of mineral resources is a very relevant issue. The purpose of this work is to realize the ecological restoration zoning of the national land space in resource-based cities and to improve the regional EEQ.
In 2013, Tonghua City was officially listed as one of the resource-based cities in China, and the resource and environment base of urban development is in crisis, and the industry has a high degree of homogeneity. In this study, the regional EEQ is evaluated by taking the concentrated mining area of mineral resources in Tonghua City as an example, considering the regional characteristics. In order to achieve the objectives, it is necessary to solve the following tasks: (1) to establish a set of evaluation systems considering eco-geological environmental conditions, environmental pollution status, and anthropogenic influence; (2) to quantitatively evaluate the EEQ of the concentrated mining area; and (3) to explore countermeasures to improve the EEQ and to provide objective suggestions for eco-geological environmental protection and resource allocation in resource-based cities.

2. Materials and Methods
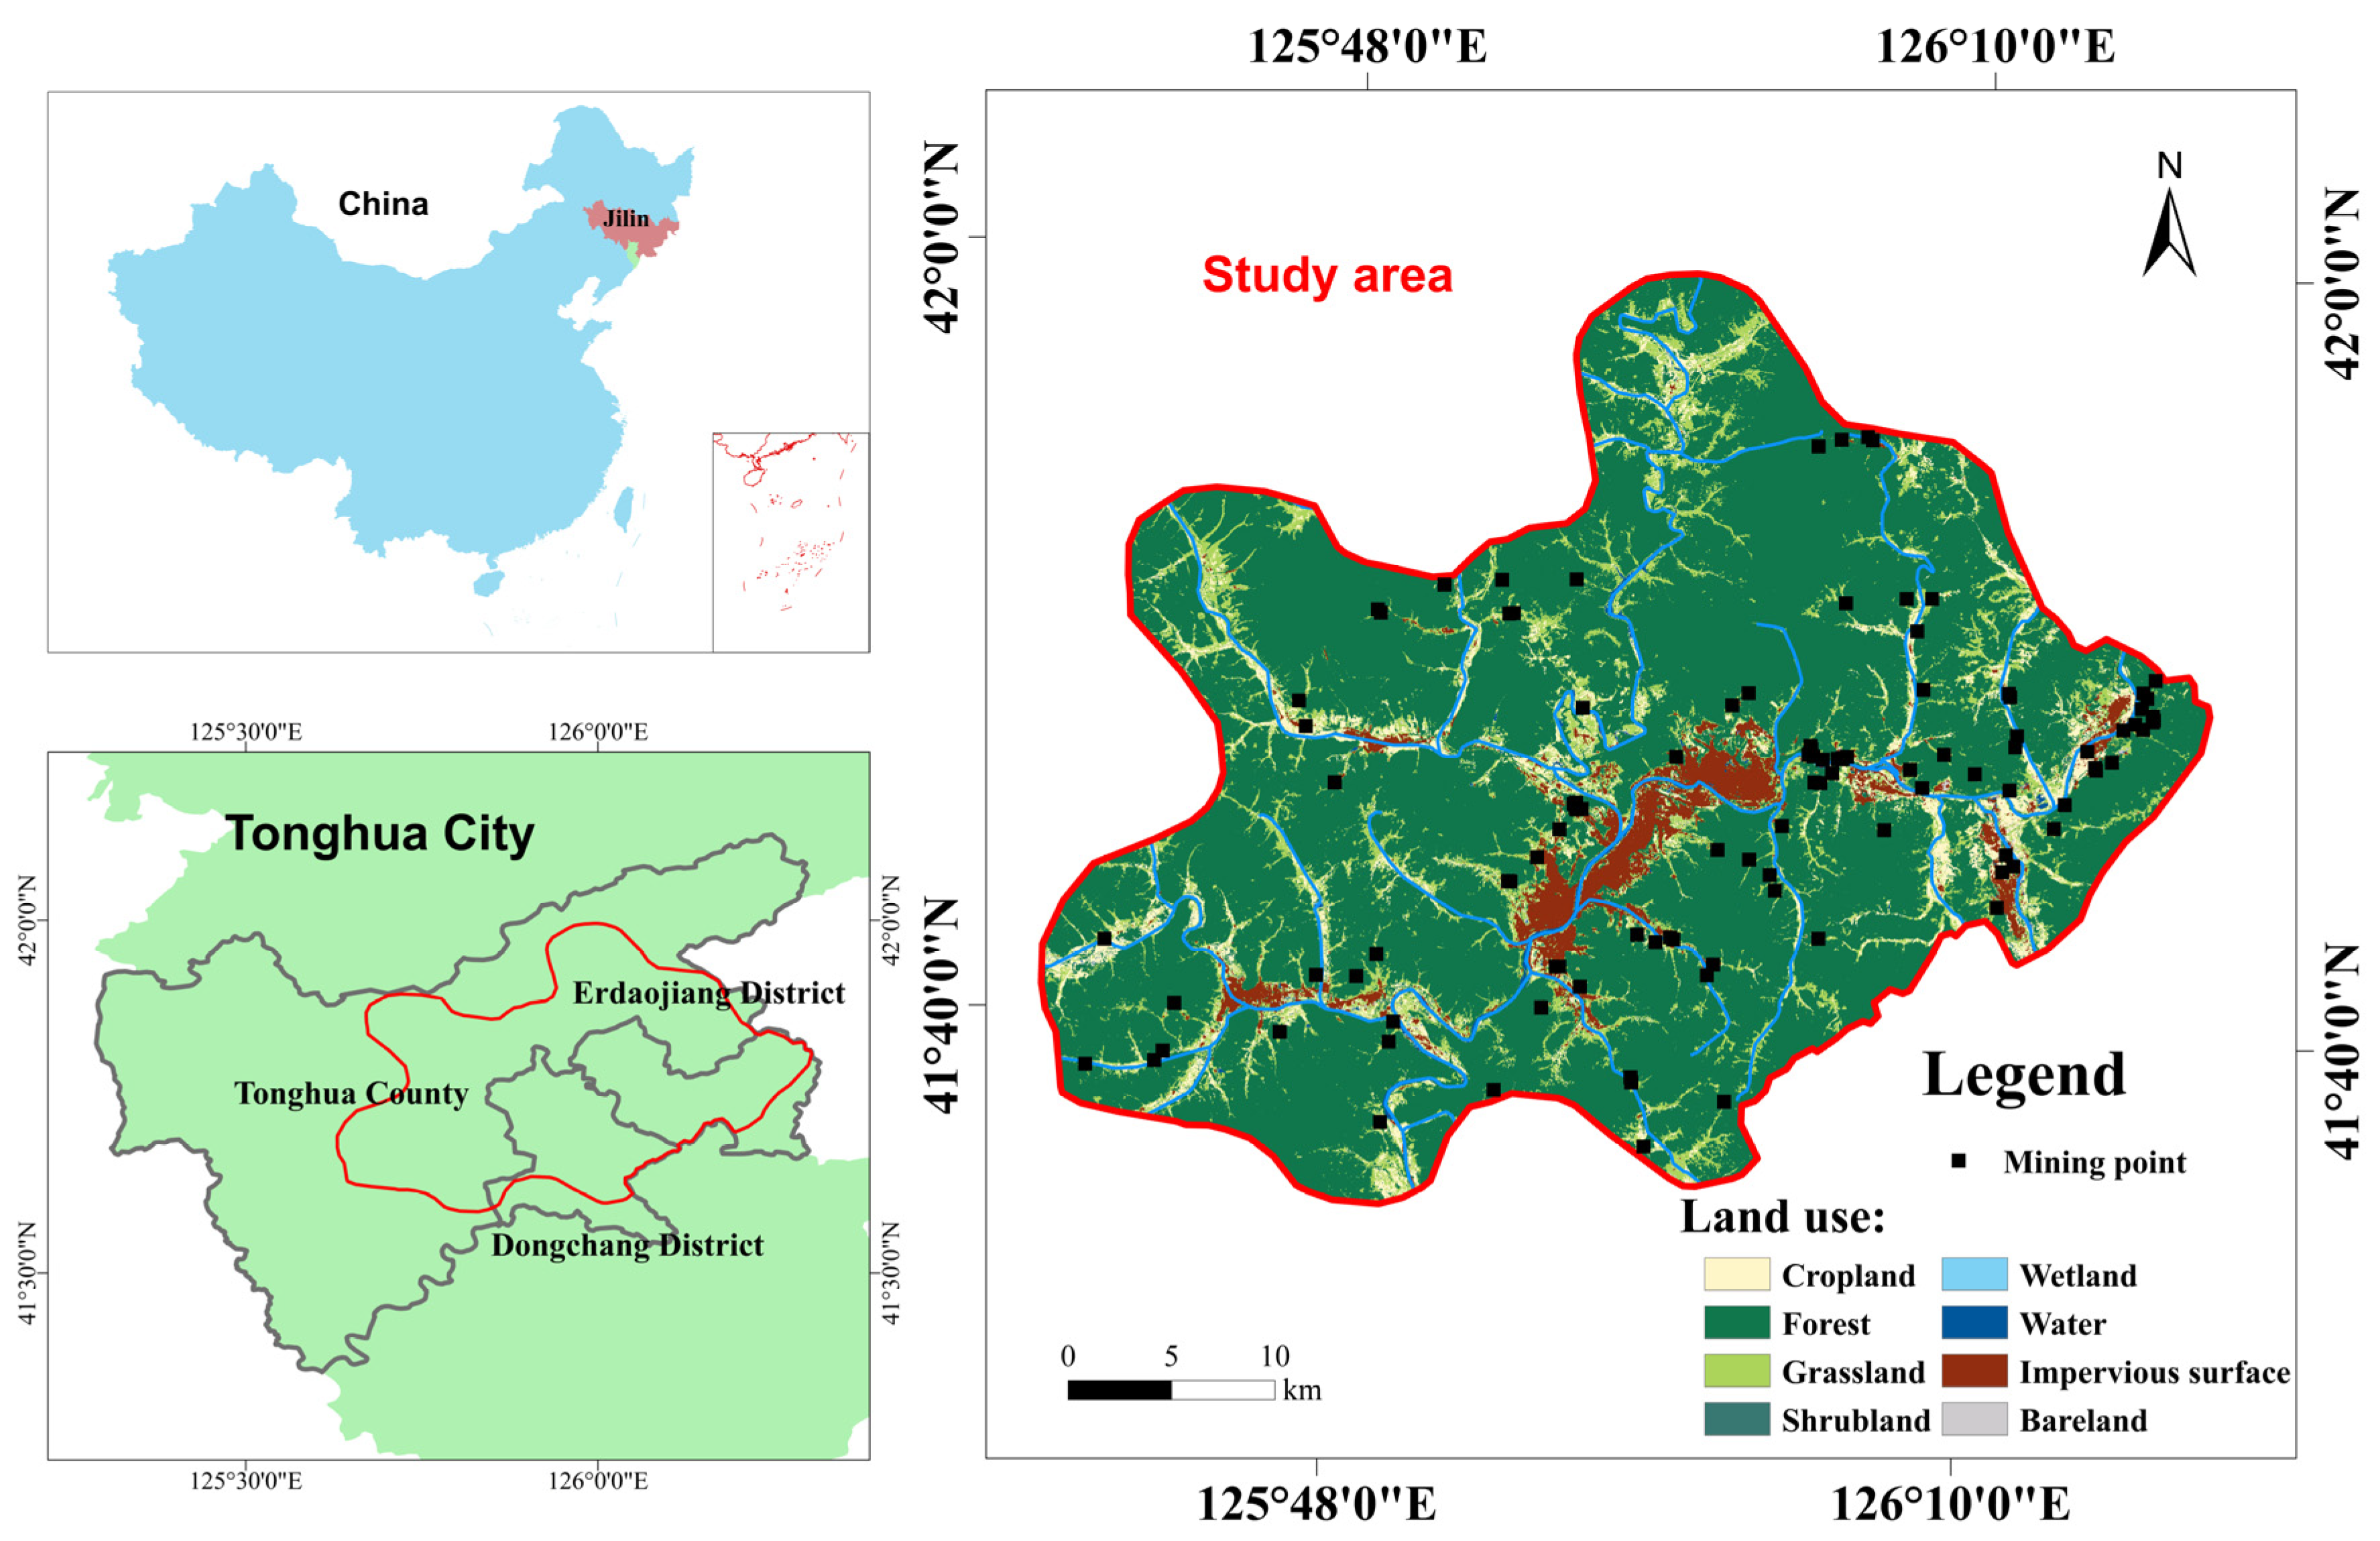
2.1. Study Area

The geographical location of Tonghua City is in the southeastern part of Jilin Province, China, and the study area is located within Tonghua City (Figure 1). The geographical coordinates are 125°35′–126°20′ E, 41°35′–42°00′ N, 37 km in length from north to south and 66 km in width from east to west. The study area includes parts of the Erdaojiang mining area, Dongchang district mining area, and Tonghua county mining area, with an area of about 1462 km2.
The study area belongs to the north temperate continental monsoon climate, influenced by the topography of Changbai Mountain, with an obvious continental climate. The average annual temperature is 4.9~6.5 °C, and the average annual precipitation is 800~900 mm. The main rivers in the study area are the Hun River and the Hani River. The landform type in the area is mainly low and medium mountains, with distributed inter-mountain valley plains. The micro-landscapes along the rivers are often steep cliffs or steep slopes, with dense inter-mountain valleys and large slope drops.
Tonghua City has 107 mines in the concentrated mining area of mineral resources. From the analysis of mineral resources categories, the developed mineral resources of non-metallic mines dominate, and there are 38 mines with valid mining licenses in Tonghua City, with nearly 10,000 employees in the mines and an actual annual production capacity of 10,162,000 tons. The problems related to the ecological and geological environment in the study area mainly include mining enterprises occupying and destroying land vegetation resources, the influence and destruction of aquifers, topographic and geomorphological landscape destruction, groundwater pollution and soil heavy metal pollution, solid waste, wastewater, and liquid discharge, as well as collapse, landslide, and debris flow disasters.

2.2. Investigative Framework

The extent to which EEQ was influenced by internal and external factors was evaluated using techniques and methods such as RS, GIS, field survey, ANP, and spatial autocorrelation analysis in this study. In order to meticulously assess the EEQ in the study area, geological environment survey information for 107 mines in 2015 was collected from the General Geological and Environmental Monitoring Station of Jilin Province. The general framework of this study is shown in Figure 2.

2.3. Evaluation Indicators Selection

An appropriate, reasonable, and representative index system is the key to objectively reflecting EEQ in the study area [28]. Based on the concept of eco-geological environment system and research progress [29,30,31], combining the influence of internal system factors of geological and ecological conditions on the eco-geological environment and the influence of external system factors of mining activities and social economy the on eco-geological environment, and through communication with experts, 14 evaluation indexes were finally summarized, and the principles of selecting indexes are shown in Table 1.

2.4. Data Sources and Classification of Indicators

The research data primarily contain remote sensing, meteorological, and basic geographic information vector data based on the evaluation indexes chosen in Section 2.3, and Table 2 lists the corresponding data sources for each indicator. The DEM data used in this study were obtained with a spatial resolution of 30 m from the geospatial data cloud sharing platform (http://www.gscloud.cn, accessed on 1 January 2022) and were used to generate topographic slope data. The Normalized Difference Vegetation Index (NDVI) for 2015 in the study area was calculated in Google Earth Engine (https://earthengine.google.com, accessed on 22 February 2022), and the results were synthesized based on the NDVI maxima of the July–September images. Land use data were obtained from the Global Land Cover Map FROM-GLC version2 (2015_v1) dataset (http://data.ess.tsinghua.edu.cn/fromglc2015_v1.html, accessed on 18 March 2022) and were divided into eight categories according to cropland, forest, grassland, shrubland, wetland, water, impervious surface, and bare land. Precipitation data were obtained from the National Tibetan Plateau Scientific Data Center (https://data.tpdc.ac.cn, accessed on 30 March 2022), and the annual rainfall for 2015 was selected. Population density data were obtained from the 2015 WorldPop dataset with a spatial resolution of 100 m (https://www.worldpop.org, accessed on 19 March 2022). Other geographic information data were obtained from the national geographic information database (https://www.webmap.cn, accessed on 3 January 2022) and vector data provided by the General Geological and Environmental Monitoring Station of Jilin Province.
All indicators are shown in Figure 3. ArcGIS 10.8 (Esri, Redlands, CA, USA) was used for data resampling and projection transformation. Then, the grid data of the index assessment layer was formed with a spatial resolution of 250 m × 250 m, and a unified the WGS 1984 UTM Zone 52N projection coordinate system was uniformly used for the coordinates.
Eventually, 14 indicators were chosen to characterize the current state of mine EEQ from three perspectives: eco-geological environment background, mine human engineering activities, and soil and water pollution. The impact of EEQ in the study area is classified into five grades: good, better, medium, poor, and poor areas (V1, V2, V3, V4, V5), which are quantitatively assessed using remote sensing data and field survey data, and the corresponding grading thresholds are shown in Table 3.

2.5. Calculate the Weights of the Iindicators

The impact of mining activities on EEQ has obvious and long-term spatial heterogeneity [49,50]. By selecting reasonable evaluation indicators and determining the weights, the impact range can be accurately assessed. The subjective assignment method is based on the rich a priori knowledge of experts, and the objective assignment method can explain the intrinsic connection of the data itself. In this paper, we synthesize the advantages of the two evaluation methods, and apply the game theory method to find the comprehensive weights of each evaluation index based on the subjective and objective weights, i.e., we combine the ANP and coefficient of variation methods for 14 evaluation indicators, respectively, and give full play to the value of the data. The comprehensive weight calculation results are shown in Table 4.

2.5.1. Weights Calculated the Coefficient of Variation Method

The Coefficient of Variation (CV) method is a method that directly uses the information contained in each indicator to obtain the weight of the indicator by calculation. It is an objective weighting method. The basic approach of this method is that in the evaluation index system, the indicators that have a greater variation in the value of the indicators, that is, the more difficult to achieve the indicators, such indicators are more reflective of the gaps in the evaluated units. The CV value is calculated as follows.
  • Standardization of the original data through Min-Max method:
Positive indicator:
a i j = x i j min ( x j ) max ( x j ) min ( x j )
Negative indicator:
a i j = max ( x j ) x i j max ( x j ) min ( x j )
where a i j —standardized value, x i j —original indicator value; max ( x j ) , min ( x j ) —maximum and minimum values, respectively, of the original indicator.
2.
Calculate the mean and standard deviation of each indicator:
X J ¯ = 1 n i = 1 n x i j
S j 2 = 1 n 1 i = 1 n ( x i j X j ¯ ) 2
3.
The CV of each indicator:
C v = S j / X j ¯
4.
The weights of each indicator:
ω j = C v / j = 1 p C v
The CV weight calculation results of the 14 factors are presented in Table 4.

2.5.2. Weights Calculated with ANP Method

The subjective empowerment method uses the Analytic Network Process (ANP), which is a further extension of the Analytic Hierarchy Process (AHP) [43]. The traditional hierarchical analysis method is widely used, but in the eco-geological environment system, the indicators are not completely independent of each other [44]. Therefore, compared with the hierarchical analysis method, the network analysis method more reasonably considers the interaction between factors or adjacent levels. ANP is divided into the following steps.
  • Network construction based on goal and criteria:
A typical ANP network is shown in Figure 4, which consists of two parts: one is the control layer, and the other is the network layer, which is built based on the criteria of the control layer and reflects how the elements or groups of elements in the network interact with each other under the corresponding goal and criteria. In addition, ANP can build subnets according to each criterion, and each subnet is composed of groups of elements that reflect the corresponding control criteria.
2.
Construct the initial super matrix without weights:
Suppose there are N element groups in the network layer, i.e., C 1 , C 2 , , C N . The elements in element group C j are denoted as e j l ( l = 1 , 2 , n j ) . The judgment matrix is constructed according to the degree of influence of each element in the element group C i on the element e j l , and the normalization vector ( W i 1 j l , W i 2 j l , , W i n i j l ) T is obtained. In this way, the elements in C j are compared with the elements in element group C i in turn to construct their respective judgment matrices, and finally the normalized feature vectors of each judgment matrix are aggregated into a matrix, W i j , and finally the unweighted super matrix W s can be obtained.
W i j = [ ω i 1 j 1 ω i 1 j 2 ω i 1 j n j ω i 2 j 1 ω i 2 j 2 ω i 2 j n j ω i n 1 j 1 ω i n 2 j 2 ω i n j j n j ]
W s = C 1 C 2 C N [ W 11 W 12 W 1 N W 21 W 21 W 2 N W N 1 W N 2 W N N ]
3.
Constructing the weight super matrix:
Pairwise comparisons of element groups are performed, judgment matrix a j is constructed, and normalization is performed.
a j = C 1 C 2 C N [ a 11 j a 22 j a 1 N j a 21 j a 12 j a 2 N j a N 1 j a N 2 j a N N j ] a 1 j a 2 j a N j
This results in a weight matrix A s that reflects the element subtraction relationship under a certain criterion.
A s = [ a 11 a 12 a 1 N a 21 a 22 a 2 N a N 1 a N 2 a N N ]
Weight super matrix is W s ω
W s ω = A s W s
4.
Calculating the limiting super matrix:
Because of the feedback introduced in the ANP method—the relationship of mutual influence—two elements can be compared both directly and indirectly. So, it is necessary to determine the priority of stable elements by the method of finding the limit super matrix.
W s l = lim k W k
where W s l denotes the limit super matrix and W denotes the weight super matrix.
The process of computing the limit super matrix is an iterative, stabilizing process, equivalent to the Markov process [45]. In the limit super matrix W s l , each column value is then the limit relative priority of each element to the corresponding element in that column under each criterion.
In this study, the control level objective is EEQ with 3 criteria (A1, A2, A3), and the network level indicators have 14 (C1~C14). A network analysis model was constructed based on the 14 evaluation indicators in Figure 2 after determining the mutual influence relationship between the indicators (Figure 5).

2.5.3. The comprehensive Weights

The game theory [51] method is used to obtain the comprehensive weights of indicators. Based on the game theory idea, the weights determined by different methods are compared and coordinated in the form of vectors in a competitive relationship, and a more balanced result is sought to ensure the geological environment evaluation is scientific.
1.
In order to make the obtained weights more reasonable and realistic, l different methods are used to assign weights to each indicator, and the set of weights of each indicator is { ω k 1 , ω k 2 , , ω k n } , k = 1 ,   2 ,   ,   l . The combined weights are any linear combination between l different vectors as:
ω i = k = 1 l α k ω k i T ( α k > 0 )
2.
In order to minimize the deviation between the combined weights and the basic weights, the combination coefficient α k is optimized:
min k = 1 l α k ω k i T ω k i 2 ( k = 1 , 2 , l )
Following the differential properties of the matrix, taking the optimal first order derivative of Equation (14), it can be transformed into following equation:
[ ω 1 i ω 1 i T ω 1 i ω 2 i T ω 1 i ω l i T ω 2 i ω 1 i T ω 2 i ω 2 i T ω 2 i ω l i T ω l i ω 1 i T ω l i ω 2 i T ω l i ω l i T ] [ α 1 α 2 α l ] = [ ω 1 i ω 1 i T ω 2 i ω 2 i T ω l i ω l i T ]
3.
Calculating the combined weights:
Normalize ( α 1 , α 2 , , α l ) :
α k * = α k k = 1 l α k
Obtain the composite index weights:
ω i * = k = 1 l α k * ω k i T

2.6. Calculation of EEQ Value of Each Grid

The EEQ evaluation value, C j , was calculated using a linear weighted combination. The information of the 14 standardized evaluation indicators contained in each grid is multiplied with the combined weights to calculate the combined value.
C j = i = 1 n w i × e i
where n is the number of factors involved in the evaluation system; w i is the weight of evaluation factor i ; and e i represents the standardization value of each indicator.

2.7. Hot Spot Analysis

The evaluation results of EEQ are often correlated in spatial distribution, i.e., they have the distribution characteristics of clustering [52]. The spatial hotspot identification methods for geographic data are Moran’s I, Getis–Ord Gi* statistics, where Getis–Ord Gi* statistics shows better in identifying different confidence-level statistical values, i.e., the optimal solution for guiding resource allocation in mine eco-geological environment restoration [53]. To analyze the rationality of mine EEQ evaluation results in the study area, Getis–Ord Gi* [54] was used to study hotspot analysis at the grid cell scale. In this study, ArcGIS 10.8 software was used to calculate the hotspot analysis of the eco-geological environment of the study area and to determine three confidence levels, i.e., 90%, 95%, and 99% of the space. Getis–Ord local statistics can be expressed as:
G i * =   j = 1 n w i j x j X ¯   j = 1 n w i j S [ n   j = 1 n w i j 2 (   j = 1 n w i j ) ] 2 n 1
where x j is the attribute value of element j , w i j is the spatial weight between elements i and j , and n is the total number of elements. X ¯ and S are:
X ¯ =   j = 1 n x j n , S =   j = 1 n x j 2 n 1 ( X ¯ ) 2
The G* statistic is calculated for each grid z-score. For statistically significant positive z-scores, the higher the z-score, the tighter the clustering for high values (hot spot). For statistically significant negative z-scores, the lower the z-score, the tighter the clustering for lower values (cold spot).

3. Result

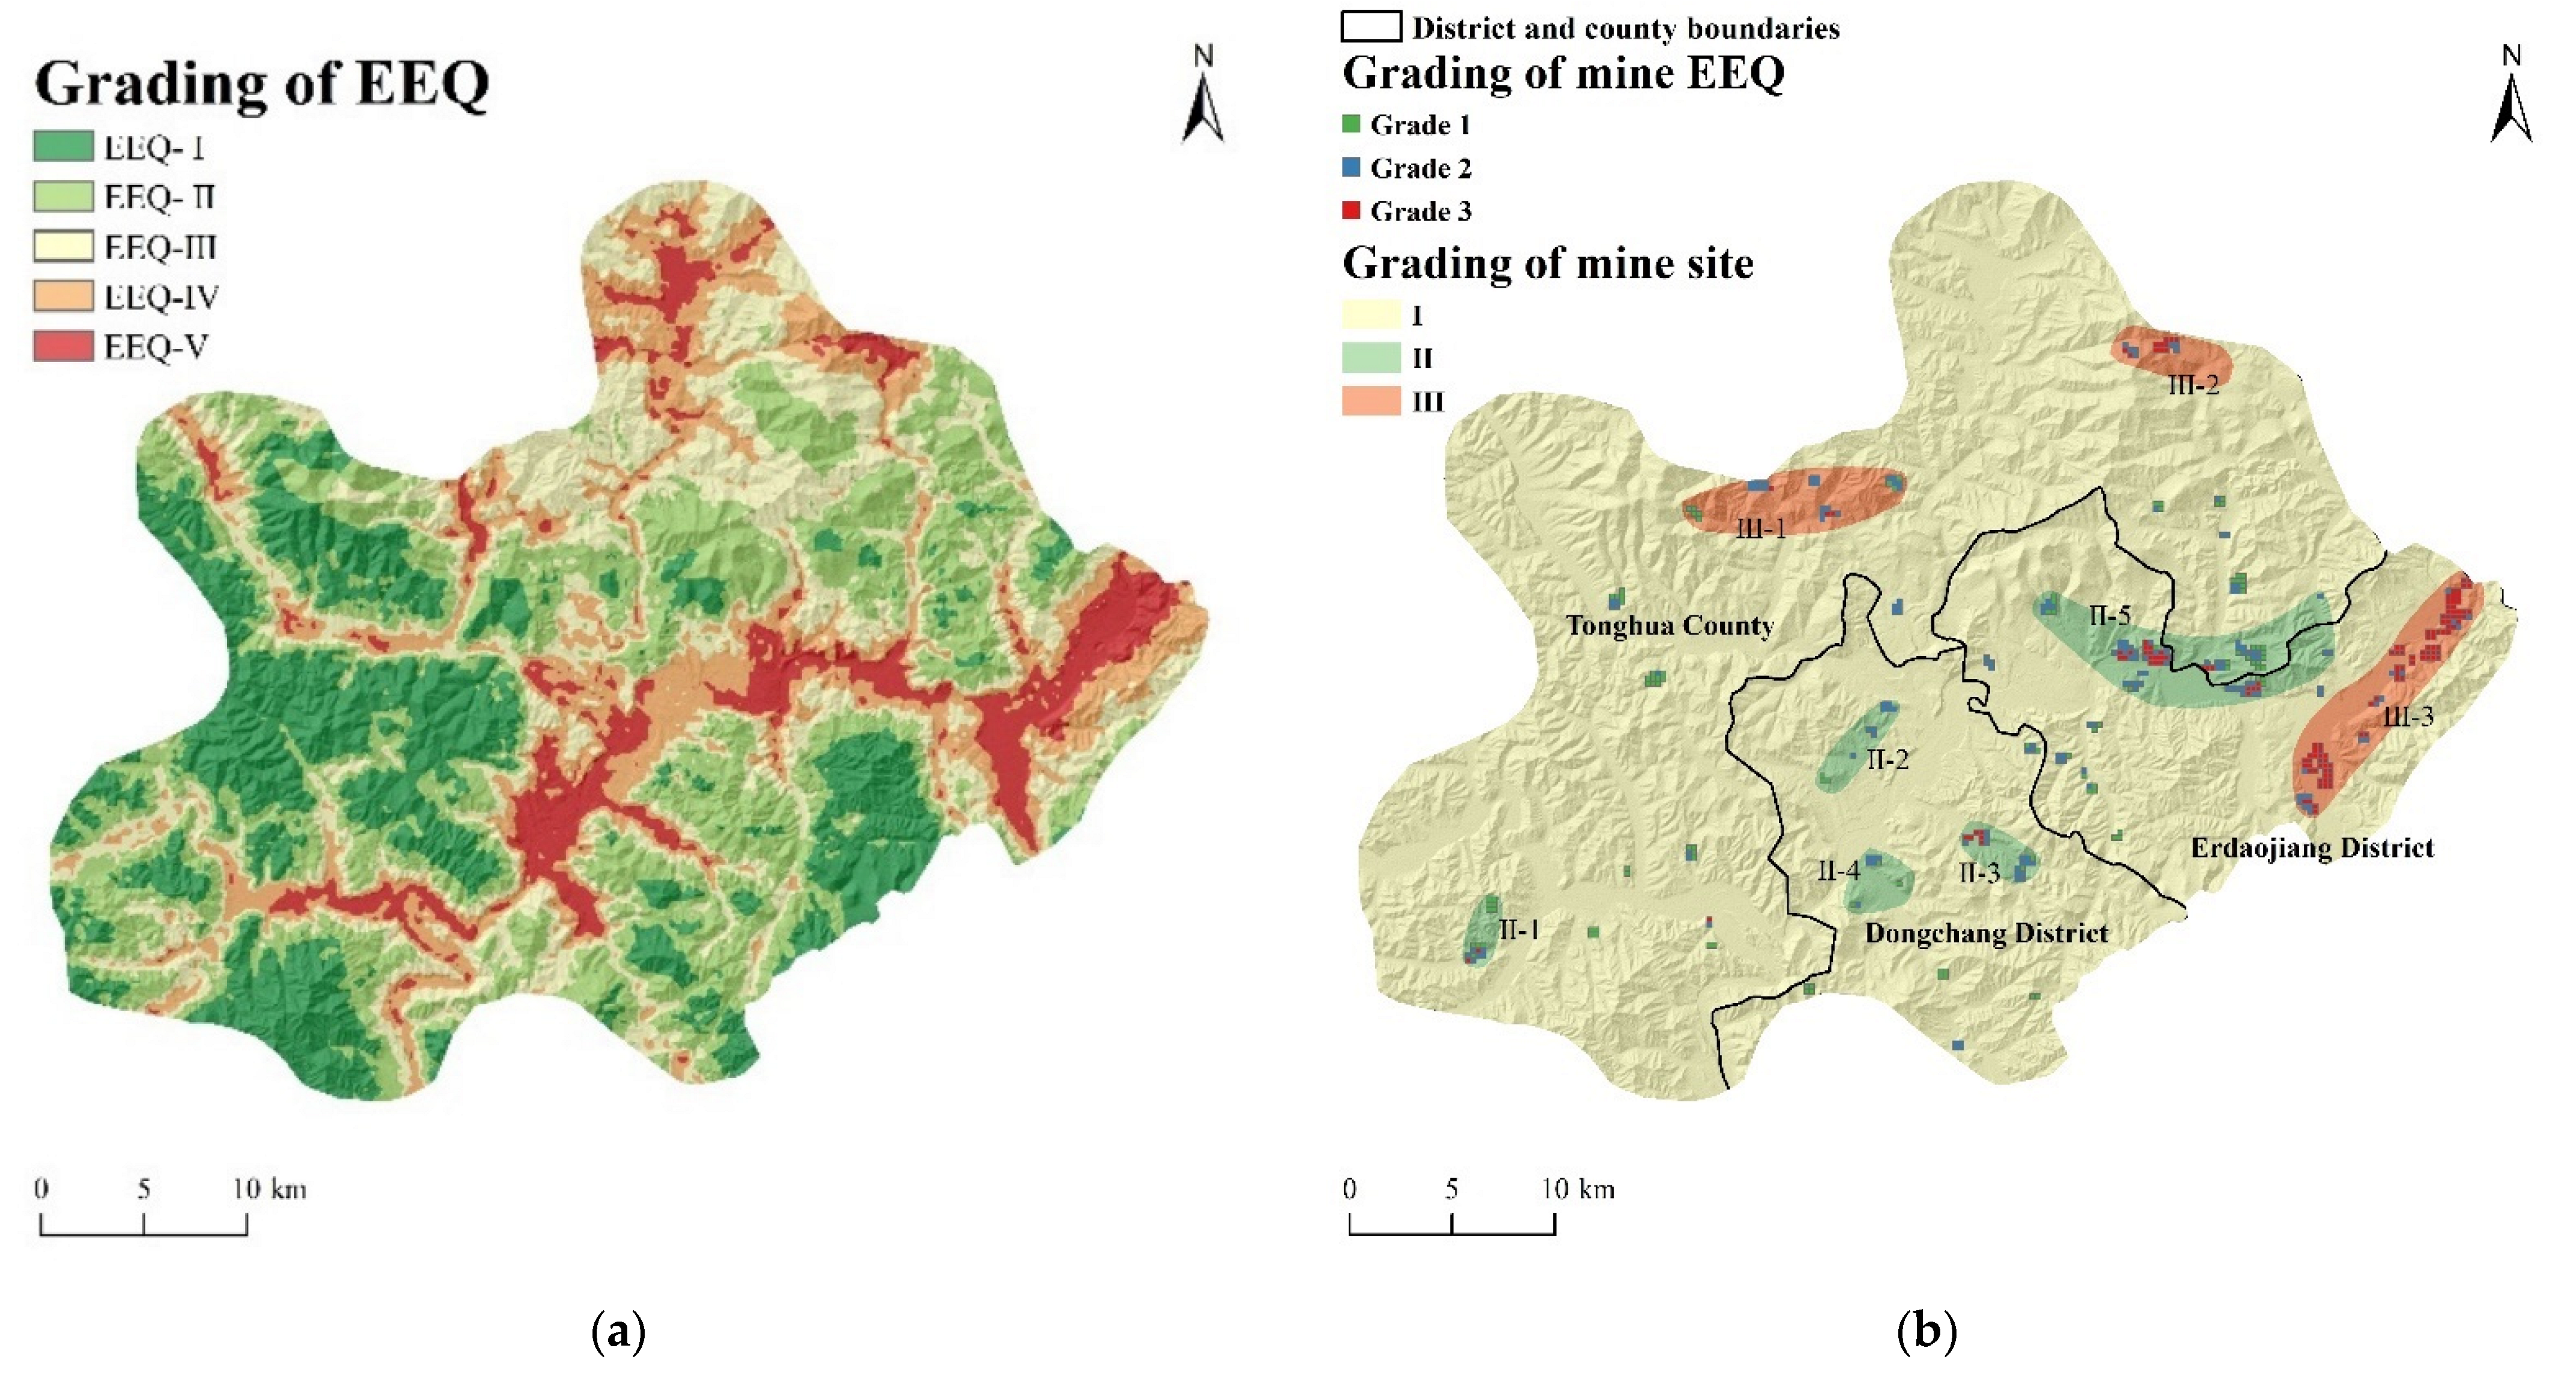
3.1. EEQ Evaluation Grading and Analysis

According to the weight assignment result (Table 4) and linear weighting model (Equation (18)), the final score of each grid was obtained by using the ArcGIS raster calculation tool to show the EEQ evaluation as shown in Figure 6a. In order to display the evaluation results more intuitively, the Natural break method is used to divide the impact evaluation into 5 levels, Ⅰ, Ⅱ, Ⅲ, Ⅳ, and Ⅴ, from high to low indicating the level. The lower the score, the worse the result of EEQ evaluation is represented.
Meanwhile, Figure 6b screens out the grids that contain open pit mining faces. In order to show the difference in EEQ of the mine more clearly, these grids are divided into three classes according to the EEQ evaluation results, and these grids are artificially clustered to obtain the EEQ partition range of the mine.
From the EEQ evaluation results (Figure 6a, Table 5), the EEQ of the study area is characterized by an obvious spatial aggregation distribution. The EEQ-I area represents the best environmental area, concentrated in the western mountainous region, with a total area of 313.31 km2. The EEQ-II area is the largest area, with a total area of 450.06 km2. The EEQ-III area is the transition area between poor and good, mainly distributed in the northeast, with a total area of 400.5 km2. The EEQ-IV area is widely wrapped around the periphery of the V area, with a total area of 212.06 km2. The EEQ-V area is distributed in the upper and middle reaches of the mainstream of the Hun River, including the tributaries Hani River, Daluoquan River, and Lagu River basin, and its location is concentrated in the eastern, central, and southeastern parts of the study area, with a total area of 107.31 km2.
Figure 6b illustrates the EEQ zoning of the mine. The EEQ of the zone severely affected by the eco-geological environment (Ⅲ) is low. This zone mainly includes parts of Ermi Town, Guanghua Town, and Daan Town in Tonghua County, and parts of Yuyuan Town, Wudaogang Town, and Tiechang Town in Erdaojiang District, and is divided into three small areas. The main mining types of Ⅲ-1 and Ⅲ-2 are metal mines, and the main mining types of Ⅲ-3 are coal mines. There were four mudslide disasters, two landslide disasters, and one landslide disaster in the area.
The EEQ of the more seriously affected eco-geological environment zone (II) is thought to be low. This zone mainly includes parts of Ermi Town, Guanghua Town, and Daan Town in Tonghua County, and parts of Yuyuan Town, Wudaojiang Town, and Tiezhuang Town in Erdaojiang District, which are divided into five small areas. The district is characterized by the prevalence of non-metallic mines. A total of 13 cave-in disasters occurred in the district.
Slightly affected by eco-geological environment zone (Ⅰ), this zone is characterized by less distribution of mining enterprises, mostly small, closed pit mines, and far from towns. Mining geological hazards are basically not developed, and EEQ level is medium-high.

3.2. Hotspots and Cold Spots of EEQ

Cold and hot spots with statistical significance are identified, with hot spots representing clusters of high values and cold spots the opposite [55], as shown in Figure 7. In fact, when the confidence level is greater than 95%, the data can be considered statistically significant [56].
The cold spots with confidence levels higher than 95% account for 19.97% of the total study area. The distribution of cold spots is related to the location of the main urban area of Tonghua City, and the population concentration area is distributed along the middle reaches of the Hun River, while the coal mining areas in Erdaojiang District are distributed on both sides of the upper reaches of the Hun River. The cold spots in this study represent areas with poor mining eco-geological environments, and there are 58 mining sites in the cold spot area, including 54% of the mining sites in the total study area.
Above the 95% confidence level, hot spots account for 21.43% of the total surface. The hot spot areas are mainly distributed in Kuaidamao town and Ermi town in Tonghua County, and some sporadic distribution at the edge of the study area, far from the urban area and with low population density, fewer mining enterprises, which are still in the undeveloped and unused stage, and the eco-geological environment of the area is stable.
Overall, there is a strong correlation between EEQ and mine development and utilization. The identification of cold and hot spots can reasonably allocate investment in environmental management and achieve sustainable development of resource extraction and eco-geological environmental protection [57].

4. Discussion

The EEQ is a prerequisite for mine reclamation in Tonghua City, and this study aims to quantify EEQ. From the results of the evaluation, it is concluded that the overall EEQ preference of the study area is high with a high concentration of mining sites in the area. Furthermore, the area covered by vegetation can be estimated by NDVI to be about 79% of the total area of the study area, and no major geological hazards have occurred in the area. However, the high degree of aggregation of mining sites in the study area creates a low EEQ preference for specific areas. From the geographical location of each mine—since 57% of the mining sites are within 1 km of rivers near the grade road—the traffic has guaranteed convenience. So, the construction cost of the ecological restoration project for the mines has a positive impact on the difficulty level, and as long as reasonable ecological restoration measures are taken, Tonghua City will gradually complete the task of restoring the national space and improve the overall EEQ.

4.1. Reliability of the Method

Some evaluation methods, such as fuzzy evaluation and informative evaluation, cannot explain the relationship between evaluation elements and each other and between evaluation elements and the eco-geological environment [58,59]. In response to the non-linear relationship between EEQ evaluation results and evaluation indicators in the study area, we chose the ANP method that can overcome the barriers between indicators, significantly explain the non-linear relationship between indicators, and with evaluation targets and combine with the coefficient of variation method to weaken the subjective interference, which is used to reveal the spatial distribution of EEQ. Therefore, this assignment method is suitable for evaluating EEQ
Regression analysis can characterize the driving factors affecting EEQ. To better explain the degree of influence of individual evaluation factors, 1000 sample points in the study area were randomly extracted, and then the regression coefficients between 14 evaluation factors and EEQ were calculated using the ordinary least squares method [60], as shown in Table 6. It is clear that mine density and NDVI contribute more to EEQ compared with other indicators in the assignment method and regression analysis calculations. Mining is the main factor limiting the ecological environment of the area, and controlling mining is an important way for sustainable development.

4.2. Suggestions for Improving EEQ in Tonghua

Section 4.1 shows that mine reclamation is the most direct way to improve EEQ. According to statistics, more than 70% of Tonghua is open pit mining, and this approach causes serious damage to the land and biomass [61]. Mine reclamation can be carried out on the basis of mine EEQ classification (Figure 6b). This includes the following three aspects: 1. Mines in subzone I can be restored mainly by natural means with artificial assistance, and the restoration direction is tailored to local conditions, following the principle of “forestry where appropriate and farming where appropriate” [62]. 2. The mines in subzone II, due to the more serious development and utilization, shall develop corresponding mine land reclamation plans and then implement engineering measures. 3. The eco-geological environment of the mines in subzone Ⅲ is seriously damaged, with a large open-pit mining area, completely losing the original geomorphological features and land cultivation value, and the reclamation work requires a large amount of investment. Therefore, it is more appropriate to build a mine park or develop commercial land in this area. All mine reclamation should be carried out without deepening the damage to the eco-geological environment.
At the same time, increasing forest cover, implementing afforestation and greening projects, and strengthening ecological protection are also effective ways to improve EEQ.

4.3. Performance in Environmental Policy

Tonghua City has steadily implemented ecological regulations and limited the development of non-essential mineral resources since being designated as a resource-based city in 2011. The demonstration project of mine geological environment treatment in Erdaojiang District, which has treated an area of nearly 11 km2, was officially launched in 2012, alleviating environmental problems such as geological disasters, land occupation, landscape destruction, and vegetation damage that existed in the region.
Within the scope of the city’s water source quasi-protected areas, secondary protected areas are set up to limit the investigation area. Certain area have been set up to prohibit investigation n the nature reserves, ecological function areas, cultural and natural heritage within a certain area; important drinking water source primary protection zones; and tourist scenic areas, historical relics, famous monuments, and other protected areas.
From the statistical yearbook collected by CNKI, we know that the annual mining output value in Tonghua gradually decreased from 5948.22 million RMB in 2014 to 616.43 million RMB in 2017 (the remaining years are not explicitly listed in the gross mining product), which shows that Tonghua has actively participated in the industrial transformation.
Due to the long history of mining in Tonghua and the lack of relevant laws in the early days, the abandoned mines left by history have become a “difficult problem” for the ecological environment. In 2021, the Natural Resources Bureau of Tonghua City issued a government document to treat 41 abandoned mines. This action represents the contribution of the Tonghua government to protecting the habitat and eco-geological environment.

4.4. Limitations and Future Work

This study uses multi-source data to evaluate EEQ and make recommendations for eco-geological environmental protection in Tonghua, but there are inevitably some limitations. Tonghua City is a resource-based city, and the EEQ evaluation system is less applicable to a city with fewer mining activities.
In this study, the evaluation base cell is a 250 m×250 m grid. Although it is possible to distinguish the trend of the indicators, it will certainly bring some influence on the zoning results, and there will be an “enclave” phenomenon.
It can be found in the conclusion of the study that the indicators about human and mining engineering activities have a greater influence on the evaluation results, so the relationship involving the living environment, production environment, and ecological geological environment of the city will be the next research direction.

5. Conclusions

The quantitative and comprehensive evaluation of EEQ in the mineral concentration mining area of Tonghua City shows that the ecological and geological environment problems in the area are significantly aggregated. Based on the EEQ evaluation, three types of mine clusters can be classified and used to determine the classification of the degree of influence by mining activities. Combined with the hot spot analysis method, it highlights the areas in the study area that need to focus on the eco-geological environment.
Overall, the EEQ evaluation shows that the areas with EEQ-Ⅰ and EEQ-Ⅱ in the whole study area account for 51.5%, and the overall eco-geological environment is at the middle to upper level.
This study is of positive significance for accelerating the eco-geological environment survey in the mineral resource development zone of the study area, promoting the geological environment monitoring in the survey area, establishing a sound eco-geological environment monitoring system, strengthening mine geological environment protection, accelerating the comprehensive management of mine geological environment, and carrying out research on mine eco-geological environment protection and management techniques and methods.

Author Contributions

Conceptualization, C.W., Y.Z. and J.Z.; methodology, C.W.; software, C.W., C.D. and J.Q.; validation, Y.Z. and C.D.; formal analysis, J.Z.; investigation, C.W., Z.C. and Z.P.; resources, Y.Z.; data curation, C.W. and J.Q.; writing—original draft preparation, C.W.; writing—review and editing, C.W., Y.Z. and J.Z.; visualization, C.W.; supervision, Y.Z. and Y.C.; project administration, Y.Z. and Y.C. All authors have read and agreed to the published version of the manuscript.

Funding

This research was funded by Jilin Province Development and Reform Commission, grant number 2021C044-3.

Institutional Review Board Statement

Not applicable.

Informed Consent Statement

Not applicable.

Data Availability Statement

Not applicable.

Acknowledgments

We appreciate the journal’s editors and reviewers for their thoughtful comments and helpful suggestions on how to improve the quality of this paper.

Conflicts of Interest

The authors declare no conflict of interest.

References

  1. Song, Y.; Wang, N.; Yu, A. Temporal and Spatial Evolution of Global Iron Ore Supply-Demand and Trade Structure. Resour. Policy 2019, 64, 101506. [Google Scholar] [CrossRef]
  2. Zuo, Z.; Cheng, J.; Guo, H.; Li, Y. Knowledge Mapping of Research on Strategic Mineral Resource Security: A Visual Analysis Using CiteSpace. Resour. Policy 2021, 74, 102372. [Google Scholar] [CrossRef]
  3. Tansel, B. Increasing Gaps between Materials Demand and Materials Recycling Rates: A Historical Perspective for Evolution of Consumer Products and Waste Quantities. J. Environ. Manag. 2020, 276, 111196. [Google Scholar] [CrossRef]
  4. Šajn, R.; Ristović, I.; Čeplak, B. Mining and Metallurgical Waste as Potential Secondary Sources of Metals—A Case Study for the West Balkan Region. Minerals 2022, 12, 547. [Google Scholar] [CrossRef]
  5. Hefni, M.; Ahmed, H.A.M.; Omar, E.S.; Ali, M.A. The Potential Re-Use of Saudi Mine Tailings in Mine Backfill: A Path towards Sustainable Mining in Saudi Arabia. Sustainability 2021, 13, 6204. [Google Scholar] [CrossRef]
  6. Christmann, P. Towards a More Equitable Use of Mineral Resources. Nat. Resour. Res. 2018, 27, 159–177. [Google Scholar] [CrossRef]
  7. Zhang, T.; Bai, Y.; Shen, X.; Zhai, Y.; Ji, C.; Ma, X.; Hong, J. Cradle-to-Gate Life Cycle Assessment of Cobalt Sulfate Production Derived from a Nickel–Copper–Cobalt Mine in China. Int. J. Life Cycle Assess 2021, 26, 1198–1210. [Google Scholar] [CrossRef]
  8. Chen, X.; Mauzerall, D.L. The Expanding Coal Power Fleet in Southeast Asia: Implications for Future CO2 Emissions and Electricity Generation. Earths Future 2021, 9. [Google Scholar] [CrossRef]
  9. Yang, H.; Zhai, G.; Zhang, Y. Ecological Vulnerability Assessment and Spatial Pattern Optimization of Resource-Based Cities: A Case Study of Huaibei City, China. Hum. Ecol. Risk Assess. 2021, 27, 606–625. [Google Scholar] [CrossRef]
  10. Yu, H.; Bian, Z.; Chen, F.; Mou, S. Land Ecosystem Degradation in Mining Area: Concept, Diagnosis, and its Regulations. Coal Sci. Technol. 2020, 48, 214–223. [Google Scholar]
  11. Song, W.; Song, W.; Gu, H.; Li, F. Progress in the Remote Sensing Monitoring of the Ecological Environment in Mining Areas. IJERPH 2020, 17, 1846. [Google Scholar] [CrossRef] [PubMed] [Green Version]
  12. Wang, H.; Xie, M.; Li, H.; Feng, Q.; Zhang, C.; Bai, Z. Monitoring Ecosystem Restoration of Multiple Surface Coal Mine Sites in China via LANDSAT Images Using the Google Earth Engine. Land Degrad. Dev. 2021, 32, 2936–2950. [Google Scholar] [CrossRef]
  13. He, F.; Gu, L.; Wang, T.; Zhang, Z. The Synthetic Geo-Ecological Environmental Evaluation of a Coastal Coal-Mining City Using Spatiotemporal Big Data: A Case Study in Longkou, China. J. Clean. Prod. 2017, 142, 854–866. [Google Scholar] [CrossRef]
  14. Keller, E.A.; Burt, E. Environmental Geology; CE Merrill Publishing Company: Columbus, OH, USA, 1985. [Google Scholar]
  15. Doyle, P. Environmental Geology. In Encyclopedia of Geology, 2nd ed.; Alderton, D., Elias, S.A., Eds.; Academic Press: Oxford, UK, 2021; pp. 660–668. ISBN 978-0-08-102909-1. [Google Scholar]
  16. Chen, L.; Zhang, H.; Zhang, X.; Liu, P.; Zhang, W.; Ma, X. Vegetation Changes in Coal Mining Areas: Naturally or Anthropogenically Driven? Catena 2022, 208, 105712. [Google Scholar] [CrossRef]
  17. Yang, Y.-Y.; Xu, Y.-S.; Shen, S.-L.; Yuan, Y.; Yin, Z.-Y. Mining-Induced Geo-Hazards with Environmental Protection Measures in Yunnan, China: An Overview. Bull. Eng. Geol. Env. 2015, 74, 141–150. [Google Scholar] [CrossRef]
  18. Guo, W.; Guo, M.; Tan, Y.; Bai, E.; Zhao, G. Sustainable Development of Resources and the Environment: Mining-Induced Eco-Geological Environmental Damage and Mitigation Measures—A Case Study in the Henan Coal Mining Area, China. Sustainability 2019, 11, 4366. [Google Scholar] [CrossRef] [Green Version]
  19. Tang, Q.; Wang, J.; Jing, Z.; Yan, Y.; Niu, H. Response of Ecological Vulnerability to Land Use Change in a Resource-Based City, China. Resour. Policy 2021, 74, 102324. [Google Scholar] [CrossRef]
  20. Li, H.; Long, R.; Chen, H. Economic Transition Policies in Chinese Resource-Based Cities: An Overview of Government Efforts. Energy Policy 2013, 55, 251–260. [Google Scholar] [CrossRef]
  21. Yang, Z.; Li, W.; Li, X.; Wang, Q.; He, J. Assessment of Eco-Geo-Environment Quality Using Multivariate Data: A Case Study in a Coal Mining Area of Western China. Ecol. Indic. 2019, 107, 105651. [Google Scholar] [CrossRef]
  22. Zhao, F.; He, M.; Wang, Y.; Tao, Z.; Li, C. Eco-Geological Environment Quality Assessment Based on Multi-Source Data of the Mining City in Red Soil Hilly Region, China. J. Mt. Sci. 2022, 19, 253–275. [Google Scholar] [CrossRef]
  23. Rybak, J.; Gorbatyuk, S.M.; Bujanovna-Syuryun, K.C.; Khairutdinov, A.M.; Tyulyaeva, Y.S.; Makarov, P.S. Utilization of Mineral Waste: A Method for Expanding the Mineral Resource Base of a Mining and Smelting Company. Metallurgist 2021, 64, 851–861. [Google Scholar] [CrossRef]
  24. Niemiec, D.; Duraj, M.; Cheng, X.; Marschalko, M.; Kubáč, J. Selected Black-Coal Mine Waste Dumps in the Ostrava-Karviná Region: An Analysis of Their Potential Use. IOP Conf. Ser. Earth Environ. Sci. 2017, 95, 042061. [Google Scholar] [CrossRef]
  25. Xiao, W.; Lv, X.; Zhao, Y.; Sun, H.; Li, J. Ecological Resilience Assessment of an Arid Coal Mining Area Using Index of Entropy and Linear Weighted Analysis: A Case Study of Shendong Coalfield, China. Ecol. Indic. 2020, 109, 105843. [Google Scholar] [CrossRef]
  26. Yuan, J.; Bian, Z.; Yan, Q.; Pan, Y. Spatio-Temporal Distributions of the Land Use Efficiency Coupling Coordination Degree in Mining Cities of Western China. Sustainability 2019, 11, 5288. [Google Scholar] [CrossRef] [Green Version]
  27. Wu, C.; Zhang, Y.; Zhang, J.; He, J.; Duan, C.; Liu, H.; Lang, Q. Application of Extension Model in Geological Environment Evaluation of Tonghua Mining Area. J. Catastrophol. 2021, 36, 228–233. [Google Scholar]
  28. Zhang, X.; Chen, M.; Guo, K.; Liu, Y.; Liu, Y.; Cai, W.; Wu, H.; Chen, Z.; Chen, Y.; Zhang, J. Regional Land Eco-Security Evaluation for the Mining City of Daye in China Using the GIS-Based Grey TOPSIS Method. Land 2021, 10, 118. [Google Scholar] [CrossRef]
  29. Wu, W.; Zhou, J.; Niu, J.; Lv, H. Study on Coupling between Mineral Resources Exploitation and the Mining Ecological Environment in Shanxi Province. Env. Dev. Sustain. 2021, 23, 13261–13283. [Google Scholar] [CrossRef]
  30. Nie, X.; Hu, Z.; Zhu, Q.; Ruan, M. Research on Temporal and Spatial Resolution and the Driving Forces of Ecological Environment Quality in Coal Mining Areas Considering Topographic Correction. Remote Sens. 2021, 13, 2815. [Google Scholar] [CrossRef]
  31. Nie, X.; Hu, Z.; Ruan, M.; Zhu, Q.; Sun, H. Remote-Sensing Evaluation and Temporal and Spatial Change Detection of Ecological Environment Quality in Coal-Mining Areas. Remote Sens. 2022, 14, 345. [Google Scholar] [CrossRef]
  32. Wang, Y.; Zhang, M.; Xue, Q.; Wu, S. Risk-Based Evaluation on Geological Environment Carrying Capacity of Mountain City–A Case Study in Suide County, Shaanxi Province, China. J. Mt. Sci. 2018, 15, 2730–2740. [Google Scholar] [CrossRef]
  33. Wang, P.; Sun, Z.; Hu, Y.; Cheng, H. Leaching of Heavy Metals from Abandoned Mine Tailings Brought by Precipitation and the Associated Environmental Impact. Sci. Total Environ. 2019, 695, 133893. [Google Scholar] [CrossRef] [PubMed]
  34. Chang, S.; Zhang, S. Geological Engineering Handbook; China Architecture & Building Press: Beijing, China, 2007. [Google Scholar]
  35. Jeong, Y.; Yu, J.; Wang, L.; Shin, J.H. Spectral Responses of As and Pb Contamination in Tailings of a Hydrothermal Ore Deposit: A Case Study of Samgwang Mine, South Korea. Remote Sens. 2018, 10, 1830. [Google Scholar] [CrossRef] [Green Version]
  36. Economou-Eliopoulos, M.; Megremi, I. Contamination of the Soil–Groundwater–Crop System: Environmental Risk and Opportunities. Minerals 2021, 11, 775. [Google Scholar] [CrossRef]
  37. Lin, J.; Chen, W.; Qi, X.; Hou, H. Risk Assessment and Its Influencing Factors Analysis of Geological Hazards in Typical Mountain Environment. J. Clean. Prod. 2021, 309, 127077. [Google Scholar] [CrossRef]
  38. Kuzevic, S.; Bobikova, D.; Kuzevicova, Z. Land Cover and Vegetation Coverage Changes in the Mining Area—A Case Study from Slovakia. Sustainability 2022, 14, 1180. [Google Scholar] [CrossRef]
  39. Lin, D.; Li, L. Environmental Study on Mining Area Living Environment Satisfaction Evaluation-Taking an Example of Huainan City. Ekoloji 2019, 28, 851–855. [Google Scholar]
  40. Xue, M.; Zhang, X.; Sun, X.; Sun, T.; Yang, Y. Expansion and Evolution of a Typical Resource-Based Mining City in Transition Using the Google Earth Engine: A Case Study of Datong, China. Remote Sens. 2021, 13, 4045. [Google Scholar] [CrossRef]
  41. Worlanyo, A.S.; Jiangfeng, L. Evaluating the Environmental and Economic Impact of Mining for Post-Mined Land Restoration and Land-Use: A Review. J. Environ. Manag. 2021, 279, 111623. [Google Scholar] [CrossRef]
  42. Lamich, D.; Marschalko, M.; Yilmaz, I.; Bednářová, P.; Niemiec, D.; Kubečka, K.; Mikulenka, V. Subsidence Measurements in Roads and Implementation in Land Use Plan Optimisation in Areas Affected by Deep Coal Mining. Env. Earth Sci. 2016, 75, 1–11. [Google Scholar] [CrossRef]
  43. Sun, X.; Shao, H.; Xiang, X.; Yuan, L.; Zhou, Y.; Xian, W. A Coupling Method for Eco-Geological Environmental Safety Assessment in Mining Areas Using PCA and Catastrophe Theory. Nat. Resour. Res. 2020, 29, 4133–4148. [Google Scholar] [CrossRef]
  44. Qin, Y.; Cao, L.; Darvishi Boloorani, A.; Wu, W. High-Resolution Mining-Induced Geo-Hazard Mapping Using Random Forest: A Case Study of Liaojiaping Orefield, Central China. Remote Sens. 2021, 13, 3638. [Google Scholar] [CrossRef]
  45. Hu, J.; Chen, X.; Chen, Y. Nitrate Sources and Transformations in Surface Water of a Mining Area Due to Intensive Mining Activities: Emphasis on Effects on Distinct Subsidence Waters. J. Environ. Manag. 2021, 298, 113451. [Google Scholar] [CrossRef] [PubMed]
  46. Wang, Y.; Dong, R.; Zhou, Y.; Luo, X. Characteristics of Groundwater Discharge to River and Related Heavy Metal Transportation in a Mountain Mining Area of Dabaoshan, Southern China. Sci. Total Environ. 2019, 679, 346–358. [Google Scholar] [CrossRef] [PubMed]
  47. Liu, G.; Wang, J.; Zhang, E.; Hou, J.; Liu, X. Heavy Metal Speciation and Risk Assessment in Dry Land and Paddy Soils near Mining Areas at Southern China. Env. Sci. Pollut. Res. 2016, 23, 8709–8720. [Google Scholar] [CrossRef]
  48. Peng, S. 1-Km Monthly Precipitation Dataset for China (1901–2020); National Tibetan Plateau Data Center: Beijing, China, 2020. [Google Scholar] [CrossRef]
  49. Komnitsas, K.; Guo, X.; Li, D. Mapping of Soil Nutrients in an Abandoned Chinese Coal Mine and Waste Disposal Site. Miner. Eng. 2010, 23, 627–635. [Google Scholar] [CrossRef]
  50. Li, H.; Xie, M.; Wang, H.; Li, S.; Xu, M. Spatial Heterogeneity of Vegetation Response to Mining Activities in Resource Regions of Northwestern China. Remote Sens. 2020, 12, 3247. [Google Scholar] [CrossRef]
  51. Li, Q.; Zhou, H.; Ma, Q.; Lu, L. Evaluation of Serviceability of Canal Lining Based on AHP–Simple Correlation Function Method–Cloud Model: A Case Study in Henan Province, China. Sustainability 2021, 13, 12314. [Google Scholar] [CrossRef]
  52. Hou, H.; Ding, Z.; Zhang, S.; Guo, S.; Yang, Y.; Chen, Z.; Mi, J.; Wang, X. Spatial Estimate of Ecological and Environmental Damage in an Underground Coal Mining Area on the Loess Plateau: Implications for Planning Restoration Interventions. J. Clean. Prod. 2021, 287, 125061. [Google Scholar] [CrossRef]
  53. Li, Y.; Zhang, L.; Yan, J.; Wang, P.; Hu, N.; Cheng, W.; Fu, B. Mapping the Hotspots and Coldspots of Ecosystem Services in Conservation Priority Setting. J. Geogr. Sci. 2017, 27, 681–696. [Google Scholar] [CrossRef]
  54. Getis, A.; Ord, J.K. The Analysis of Spatial Association by Use of Distance Statistics. Geogr. Anal. 2010, 24, 189–206. [Google Scholar] [CrossRef]
  55. Jiang, Y.; Shi, Y.; Li, R.; Guo, L. A Long-Term Ecological Vulnerability Analysis of the Tibetan Region of Natural Conditions and Ecological Protection Programs. Sustainability 2021, 13, 10598. [Google Scholar] [CrossRef]
  56. Yan, C.; Wang, L.; Zhang, Q. Study on Coupled Relationship between Urban Air Quality and Land Use in Lanzhou, China. Sustainability 2021, 13, 7724. [Google Scholar] [CrossRef]
  57. Peng, J.; Zong, M.; Hu, Y.; Liu, Y.; Wu, J. Assessing Landscape Ecological Risk in a Mining City: A Case Study in Liaoyuan City, China. Sustainability 2015, 7, 8312–8334. [Google Scholar] [CrossRef] [Green Version]
  58. Lin, J.; Lin, M.; Chen, W.; Zhang, A.; Qi, X.; Hou, H. Ecological Risks of Geological Disasters and the Patterns of the Urban Agglomeration in the Fujian Delta Region. Ecol. Indic. 2021, 125, 107475. [Google Scholar] [CrossRef]
  59. Yu, X.; Mu, C.; Zhang, D. Assessment of Land Reclamation Benefits in Mining Areas Using Fuzzy Comprehensive Evaluation. Sustainability 2020, 12, 2015. [Google Scholar] [CrossRef] [Green Version]
  60. Liu, C.; Wu, X.; Wang, L. Analysis on Land Ecological Security Change and Affect Factors Using RS and GWR in the Danjiangkou Reservoir Area, China. Applied Geography 2019, 105, 1–14. [Google Scholar] [CrossRef]
  61. Zhang, Z.; Wang, J.; Feng, Y. Linking the Reclaimed Soils and Rehabilitated Vegetation in an Opencast Coal Mining Area: A Complex Network Approach. Environ Sci Pollut Res 2019, 26, 19365–19378. [Google Scholar] [CrossRef]
  62. Xu, W.; Wang, J.; Zhang, M.; Li, S. Construction of Landscape Ecological Network Based on Landscape Ecological Risk Assessment in a Large-Scale Opencast Coal Mine Area. J. Clean. Prod. 2021, 286, 125523. [Google Scholar] [CrossRef]
Figure 1. Location and land use types of the study area in 2015.
Sustainability 14 06808 g001
Figure 2. Evaluation framework of EEQ.
Sustainability 14 06808 g002
Figure 3. Spatial distribution map of 14 evaluation indicators in the concentrated mining area of mineral resources in Tonghua city: (a) Terrain slope; (b) Annual Precipitation; (c) Lithology; (d) Distance from rivers; (e) Distance from faults; (f) NDVI; (g) Land use type; (h) Population density; (i) Distance from roads; (j) Mining point density; (k) Geological disaster density; (l) Surface water pollution; (m) Ground water pollution; (n) Soil heavy metal pollution.
Sustainability 14 06808 g003aSustainability 14 06808 g003b
Figure 4. The ANP network. ( C i denotes the element group; e i j denotes the element; connecting line denotes the relationship between elements. The relationship between elements, including internal and external dependence and feedback relationship, is shown in the arrow-tailed element group. The elements in the element group at the end of the arrow affect the elements in the element group pointed by the arrow.)
Sustainability 14 06808 g004
Figure 5. The network structure of EEQ.
Sustainability 14 06808 g005
Figure 6. (a) EEQ zoning of mineral concentration mining area; (b) Zoning of mine site.
Sustainability 14 06808 g006
Figure 7. Hotspots analysis of EEQ.
Sustainability 14 06808 g007
Table 1. Selection principles of evaluation indicators.
CriteriaEvaluation IndicatorsPrinciple of Selection
Eco-geological environment backgroundTerrain slope (°)In the mountainous hilly areas with large slopes, the geological disaster susceptibility is high, and it is the basic factor for the formation of three types of slope geological disasters, namely avalanche, landslide and debris flow [32].
Annual Precipitation (mm)According to statistics, more than 75% of geological hazards in the study area, such as collapses, landslides, and mudslides, occur between June and October, and ground collapse and ground fractures also occur mostly during this time. During the rainy season, the water level of rivers rises and falls due to the uneven distribution of rainfall, local rainstorms, and hailstorms, and strong erosion and water transport. As a result, the rainy season is a time when mines experience geological disasters. Precipitation, on the other hand, may result in a large amount of heavy metal spillage from tailings [33].
LithologySlope strength, deformation, and damage are all influenced by the structural type of rock mass. The main lithology of the strata in the area is divided into five categories, namely, hard rock masses, harder rock masses, soft interbedded rock masses, softer rock masses, and soft rock masses, according to the classification criteria of the engineering geology handbook (2007) [34] on the softness and weakness of rock formations.
Distance from river (m)This indicator has a significant distance gradient relationship with the dispersion and migration of heavy metal pollution caused by mine wastewater discharge and rainwater leaching [35,36].
Distance from fault (m)Landslides and collapses frequently occur in clusters along large tectonic fracture zones [37], especially in areas with high mining activity.
NDVIThe Normalized Difference Vegetation Index (NDVI) is an important indicator of regional ecological environment quality [38] and has a good linear correlation with the spatial distribution density of vegetation [39].
Mining and human engineering activitiesLand use typesAny changes in eco-geological environment will be directly reflected in different land use types [40]. Meanwhile, government departments can optimize the spatial planning of ecological restoration in mining cities based on land use types [41], and the quantification of land use as a qualitative indicator uses the assignment method.
Population densityThe degradation of the eco-geological environment has been accelerated by human exploitation of land and mineral resources. The development of mines and the density of the population are inextricably linked [16].
Distance from roadThe distance of the road represents different intensities of human engineering activity, and mining activities can also affect the roadbed pavement to varying degrees, and these effects are often negative [42].
Mining point densityBased on the density of distribution of mines in the study area, an assessment of the impact of mining activities across the region is made [43].
Geological disaster densityGeological hazards are representative factors that are directly related to the EEQ of a region [44]. Only geological hazards caused by mining were counted in this research, which included 37 landslides, 3 landslides, 4 debris flows, and 12 ground collapses. The direct economic losses caused by mining-induced geological disasters in 2015 totaled 45,315,000 yuan, according to the results of a statistical survey, which included the destruction of houses, railroads, roads, canals, and dams.
Water and soil pollutionSurface water pollutionSurface water is a more active participant in the water cycle, as well as an important source of water for human life, and its quality is highly susceptible to changes [45].
Ground water pollutionGroundwater pollution sources are widespread and difficult to prevent and control in the study area [46], and it is a significant factor affecting the eco-geological environment, as well as human life. Similarly, the national groundwater pollution prevention and control plan (2011–2020) emphasizes the importance of addressing groundwater pollution caused by mining activities.
Soil heavy metal pollutionMine solid waste causes heavy metal element pollution in the land, which in turn pollutes crops, terrestrial organisms, and other human food chain, ultimately endangering the health of the population, and in serious cases can lead to a high incidence of cancer in the mine population [47].
Table 2. Data type, resolution, and sources.
IndicatorData TypeResolutionData Source
Terrain slopeRaster data30 mASTER GDEM V2 (http://www.gscloud.cn/, accessed on 1 January 2022)
Annual PrecipitationRaster data1 km1-km monthly precipitation dataset for China [48] (https://data.tpdc.ac.cn/, accessed on 30 March 2022)
LithologyVector data1:50,000Jilin Provincial Geological Environment Monitoring Station
Distance from riverVector data1:1,000,000https://www.webmap.cn/, accessed on 3 January 2022
Distance from faultVector data1:1,000,000https://www.webmap.cn/, accessed on 3 January 2022
NDVIRaster data30 mLandsat 8 OIL (https://earthengine.google.com/, accessed on 22 February 2022)
Land use typesRaster data30 mFROM-GLC version2 (2015_v1) (http://data.ess.tsinghua.edu.cn/, accessed on 18 March 2022)
Population densityRaster data100 mWorldPop (https://www.worldpop.org/, accessed on 19 March 2022)
Distance from roadVector data1:1,000,000https://www.webmap.cn/, accessed on 3 January 2022
Mine point densityVector data1:50,000Jilin Provincial Geological Environment Monitoring Station
Geological disaster densityVector data1:50,000Jilin Provincial Geological Environment Monitoring Station
Surface water pollutionSampling data1:50,000Jilin Provincial Geological Environment Monitoring Station
Ground water pollutionSampling data1:50,000Jilin Provincial Geological Environment Monitoring Station
Soil heavy metal pollutionSampling data1:50,000Jilin Provincial Geological Environment Monitoring Station
Table 3. Classification of evaluation indicators of EEQ.
IndicatorsValue Classification
V1V2V3V4V5
Terrain slope˂66~1515~3535~45˃45
Annual Precipitation˂500500~600600~700700~800˃800
LithologyHard rockHarder rockSoft-ard interbedSofter rockSoft rock
Distance from river˃1000500~1000200~500100~200˂100
Distance from fault˃10,0005000~10,0003000~50001000~3000˂1000
NDVI˃0.80.6~0.80.4~0.60.2~0.4˂0.2
Land use typesForest, WaterGrassland, ShrublandCropland, WetlandImpervious landBare land
Population density0~0.040.04~0.140.14~0.300.30~0.520.52~1
Distance from road˃30001500~30001000~1500500~1000˂500
Mine point density0~0.090.09~0.210.21~0.370.37~0.630.63~1.00
Geological disaster density0~0.110.11~0.260.26~0.420.42~0.650.65~1.00
Surface water pollution0~0.360.36~0.640.64~0.790.79~0.890.89~1
Ground water pollution0~0.350.35~0.640.64~0.790.79~0.890.89~1
Soil heavy metal pollution0~0.250.25~0.450.45~0.600.60~0.750.75~1
Table 4. Subjective and objective weights and combined weights.
IndicatorsWeight 1Weight 2Weight 3
Terrain slope0.0480.0230.033
Annual Precipitation0.0620.0700.067
Lithology0.1620.0140.076
Distance from river0.0790.0280.049
Distance from fault0.1000.0030.044
NDVI0.0720.1420.113
Land use types0.0840.0870.086
Population density0.0090.0630.040
Distance from road0.0890.0520.068
Mine point density0.0560.1520.112
Geological disaster density0.0690.1360.108
Surface water pollution0.0590.0970.082
Ground water pollution0.0610.0600.061
Soil heavy metal pollution0.0500.0730.063
1 Coefficient of variation method. 2 ANP method. 3 Game method
Table 5. EEQ Evaluation Result Statistics.
GradeValue of GradeGrade Area (km2)Percentage of Total Area
EEQ-I4.15–4.64313.3121.13%
EEQ-Ⅱ3.88–4.15450.0630.35%
EEQ-Ⅲ3.57–3.88400.5027.00%
EEQ-IV3.21–3.57212.0614.30%
EEQ-V2.32–3.21107.137.22%
Table 6. Coefficient analysis.
IndicatorsRegressive CoefficientStandard Error
Terrain slope0.0020.039
Annual Precipitation0.1210.039
Lithology0.0470.011
Distance from river0.0590.030
Distance from fault0.0900.026
NDVI0.1460.034
Land use types0.0760.026
Population density0.0550.169
Distance from road0.0800.027
Mine point density0.1690.051
Geological disaster density0.0150.041
Surface water pollution0.0100.039
Ground water pollution0.0130.042
Soil heavy metal pollution0.1160.039
Publisher’s Note: MDPI stays neutral with regard to jurisdictional claims in published maps and institutional affiliations.

