Article

The Effect of Rearing Scale and Density on the Growth and Nutrient Composition of Hermetia illucens (L.) (Diptera: Stratiomyidae) Larvae

1
Thaer-Institute of Agricultural and Horticultural Sciences, Division Urban Plant Ecophysiology, Humboldt-Universität zu Berlin, 14195 Berlin, Germany
2
IGB Leibniz-Institute of Freshwater Ecology and Inland Fisheries (IGB), 12587 Berlin, Germany
3
Automatic Control and System Dynamics Lab, Technische Universität Chemnitz, 09107 Chemnitz, Germany
*
Author to whom correspondence should be addressed.
Sustainability 2022, 14(3), 1772; https://doi.org/10.3390/su14031772
Submission received: 14 January 2022 / Revised: 29 January 2022 / Accepted: 1 February 2022 / Published: 4 February 2022
(This article belongs to the Collection Sustainable Insect Farming: Feed the Future)

Abstract

:
With the worldwide industrialization of black soldier fly (BSF) production, it is necessary to better understand how the rearing scale and larvae density influence the performance of larvae and the quality of the final product. In this study, a factorial experiment was conducted to test the effect of rearing scale and density on the growth and composition of the BSF larvae. The larvae were grown in four different scales (box sizes), keeping the area and feed provided to each larva constant and in two different densities. The results reveal significant differences in the larval growth depending on the scale and density, which could be attributed to the higher temperatures achieved in the bigger scales with a temperature difference of more than 5 °C between the smallest and the biggest scale. Both the scale and the density influenced the composition of the larvae. The crude protein levels were higher on the smallest scale, and the lower density (ranging from 32.5% to 36.5%), and crude fat concentrations were the opposite (ranging from 31.7% to 20.1%). The density also influenced the concentrations of S, Mg, K, P, Fe, Zn, Cu, Al, B, and Co, in addition to the analyzed free amino acids PPS, ALA, CIT, and ANS. Furthermore, the rearing scale influenced the concentration of S, Zn, Cu, and Mo. The results provide further insight into the optimization of BSF production processes and the transfer of lab-scale results into big-scale production.

1. Introduction

The industrial mass production of insects is emerging as a sustainable approach to producing proteins from low-value substrates [1,2]. Insects have a high protein content and a high nitrogen use efficiency in comparison to conventional livestock animals [3,4]. Among insects, the saprophagous black soldier fly (BSF, Hermetia illucens) (Linneaus, 1758; Diptera: Stratiomyidae) has gained increasing attention from both academic research and the industry, with several large-scale farms built worldwide. The larvae (BSFL) can feed on waste streams [5,6] and produce protein-rich biomass that can be used as feed for fish and livestock animals [7], and ultimately reduce the emissions from wastes [8,9]. In addition to the proteins, BSFL fats could, at least partly, replace soybean oil in aquaculture [10] or can be used to produce biodiesel [11]. The BSF production residues, consisting of a mixture of rest-substrate and larvae frass, can be applied as a soil amendment and plant fertilizer [12,13]. Therefore, the production of BSF can fit in industrial symbiosis models and can play a role in circular production systems [14,15,16].
In order for the insect-based feed to compete with other cheap and available feed sources, more efficient production systems should be developed [17]. Production efficiency can be improved in multiple ways, including the mechanization and automation of production lines, by identifying and applying optimal rearing conditions that maximize insect growth at a given time and with minimal area and use of resources.
The growth rate of an insect is orchestrated by countless and interacting environmental and genetic factors [18]. Besides the effect of the rearing substrate on the growth and nutrient composition of larvae [3,19,20], abiotic factors such as temperature have a big influence on larval growth [21,22,23]. Dipteran larvae are known to form agglomerates that can increase the temperature of the substrate and boost their growth and development [24,25]. This effect could be influenced by larval density and could likely differ between rearing scales. Larval density (per area unit or per substrate amount) is an important factor that needs to be optimized for its ability to improve or hinder the growth of larvae [26]. At low densities, the larvae may not achieve sufficient substrate conditioning and cooperative digestion [27,28], while at high densities, competition over the nutrients may negatively influence the growth [29]. The density also influences other physical phenomena such as heat storage and evaporation, which change the feed properties and consequently affect the growth of the larvae. In this context, a model-based approach has been proposed using a Monod-type equation to describe the functional relation between substrate density and growth rate [30].
Several studies have shown that the performance and chemical composition of BSFL are influenced by the chemical composition of the feeding substrate [19,31,32]. A broader understanding of how to modulate the larval composition can help improve the quality of the produced BSFL, making them better suited for certain feed applications. The rearing conditions such as temperature, rearing scale, and density may also influence the nutrient composition of the larvae.
Many authors have emphasized the need for big-scale experiments and indicated that the findings of small-scale trials could not be necessarily extrapolated to big production systems [33,34,35]. Understanding how BSFL growth varies between different batch sizes is not only important to optimize the production process, but also to plan small-scale experiments with higher scalability potential.
This research aims to investigate the effect of larval density and rearing scale on the growth parameters and nutrient composition of BSF larvae. It is hypothesized that high larval density will lead to faster larval growth, but smaller individual larval weight after the feed is consumed and that the scale (the size of rearing box) will not affect the individual larval weight or the larval nutrient composition. A factorial experiment is conducted to test these two hypotheses and to assess the potential interaction between the two factors (density and scale).
Mathematical models can be used to describe larval growth, heat emission, and the production of metabolism byproducts such as CO2 or ammonia over time, and in dependence to external parameters such as temperature and feed availability. Such models are of significant importance in the automation of industrial-scale larval production. Not only do they allow the analysis of the process but also the prediction of the outcomes. Data from this work’s experiment may give further insight into how feed availability influences the growth and heat emission of the BSFL.

2. Materials and Methods

2.1. Rearing and Colony Maintenance

The BSF colony used in this study belonged to the Leibniz-Institute of Freshwater Ecology and Inland Fisheries (IGB) and was obtained from Hermetia Baruth GmbH (Baruth, Germany) in the year 2018. The colony was maintained in a rearing hall in Dahlewitz (Germany) according to a modified protocol described by Sheppard et al. [36]. In every life cycle, more than 20,000 adult flies were kept in a rearing hall in 1.2 m3 cages at 28 °C and 40% to 55% relative humidity, with 12 h of artificial white light per day. Eggs were harvested every second day from oviposition structures made of perforated plastic and placed above a 200 mL box filled with an attracting substrate. Larvae hatched from the oviposition structure on 500 g chicken feed with 30% dry matter in L boxes (Table 1) closed with lids. To obtain larvae of the same age for the experiment, the oviposition structures were daily transferred to new hatching boxes. During the rearing cycles, ~12,000 larvae (7–10 days old) were transferred to XL rearing containers and fed on demand until reaching the prepupae stage. The prepupae were separated from the remaining rest-substrate by sieving, put on in trays, and let to eclose in the cages.

2.2. Experimental Setup

A factorial experiment was carried out in the same rearing hall. The first factor was the scale represented by the different sizes of rearing boxes (four sizes), and the second factor was the density of larvae (two densities). Each treatment had 5 replicates/box (n = 5). The box sizes (scales), as well as the feed amounts, are shown in Table 1. The larval density was 6.3 (HD) and 4.2 L/cm2 (LD), and the feed per larva was 0.77 (HD) and 1.15 (LD) g/L. The feed amount was downscaled to keep the ratios of the feed to area and the feed to larvae consistent between the different scales. Seven-day-old larvae with an initial weight of 3 mg were grown for eight days in this experiment. The air temperature in the rearing hall was set to 32 °C throughout the experiment, and the boxes were all placed on the ground and were daily randomized. The ground temperature was measured using an infrared surface thermometer (IRT-350 IR thermometer, Base Tech, Hirschau, Germany) and ranged between 23 °C and 26 °C during the time of the experiment.
To achieve the same larval density and feed per larvae ratio for all box sizes, the required number of larvae (LPB) and amount of feed per box (FPB) were calculated according to Table 1. All 40 boxes were filled from the same feed batch and contained 23% chicken feed (K “11 4” o.K., Agravis Raiffeisen AG, Velten, Germany), 11% wheat bran (Weizen—Kleie, Getreidemühle T. Wolter, Wustermark, Germany) and 66% water. The composition of the feeding substrate is shown in Table 2.
At the beginning of the experiment, all boxes were filled with the required amount of feed and put on the ground in a randomized order, then the larvae were added on the top. The weight of larvae to be put in every box was estimated by multiplying the mean individual larval weight by the required number of larvae displayed in Table 1. The individual larval weight was determined by counting and weighing more than 10 groups of 2000 larvae. Thereafter, the average of the obtained values was calculated and considered as individual larval weight.

2.3. Measuring Growth and Biomass Parameters

The larvae were sampled daily by collecting more than 1.5% of the initial number of larvae added to each rearing box. The larvae were quantified and weighed on an analytical scale (MyWeigh© Balance 311, Buchholz, Germany) and put back into the rearing box. The substrate temperatures of three boxes per treatment (n = 3) were measured using a digital thermometer (TFA Dostmann GmbH, Wertheim, Germany) on days 2, 3, 4, 5, 7, and 8 in 5 locations of each box to obtain a box mean temperature. Temperatures were not measured on days 1 and 6 due to technical difficulties. The larval growth was measured in all boxes (n = 5) on a daily basis except on day 7, when only 3 boxes per treatment (n = 3) were measured. On day 6, 2 boxes in different treatments were not measured (n = 4 or 5). At the end of the experiment (Day 8), in addition to measuring the individual larval weight, all larvae were manually harvested from the boxes to measure the total larval yield and the weight of the rest-substrate. To obtain the dry weight, samples from the larvae yield and the rest-substrate samples were dried in an oven at 60 °C until no reduction in weight was observed. Additional samples were freeze-dried and used for chemical analysis.
The total number of surviving larvae was estimated for every box, and mortality was calculated according to the following equation.
M o r t a l i t y   % = N u m b e r   o f   l a r v a e   a d d e d   t o   t h e   b o x n u m b e r   o f   l a r v a e   a f t e r   h a r v e s t N u m b e r   o f   l a r v a e   a d d e d   t o   t h e   b o x × 100
Additionally, the food conversion ratio (FCR) was estimated by dividing the reduction in substrate dry weight by the total dry weight gain of the larvae.

2.4. Chemical Analyses

The sample preparation for the chemical analysis was done by grounding 200 mL of freeze-dried larvae using a coffee grinder (CLOER 7579, Arnsberg, Germany). The dry feed was grounded using a knife mill (Retsch GmbH & Co. KG, Haan, Germany). In addition, 1–2 g material was sampled and dried for 24 h at 100 °C to determine the dry matter content prior to the analysis. Aliquots of the samples were used for the determination of N (to calculate the crude protein concentration), phosphorus (P), sulfur (S), calcium (Ca), magnesium (Mg), potassium (K), sodium (Na), iron (Fe), zinc (Zn), manganese (Mn), cobalt (Co), copper (Cu), aluminum (Al), boron (B), and molybdenum (Mo). All analyses were done in three replicates per treatment and two technical replicates.
For the analysis of elements (except N), an extraction was carried out through microwave digestion (MARS Xpress, CEM, Matthews North Carolina,) according to LUFA methods Vol. III, 10.8.1.2. with 0.5 g powdered material, 5 mL HNO3 (65%), and 3 mL H2O2 (30%). The resultant digestion solution was diluted in water to reach a volume of 50 mL and then was filtered. The multi-element analysis was carried out according to ICP-OES (DIN EN ISO 11885) with an ICP emission spectrometer (iCAP 6300 Duo MFC, Thermo; Waltham, MA, USA).
The N concentration was determined by an elemental analyzer (Vario MAX, Elementar Analysensysteme GmbH, Hanau, Germany). According to LUFA Bd. III, 4.1.2. First, 300 mg powdered material per sample were combusted catalytically at 900 °C with pure oxygen. At a temperature of 830 °C, the combustion product and helium as a carrier gas were passed through specific adsorption columns for the determination of nitrogen using a thermal conductivity detector. The crude protein content was calculated from nitrogen by multiplying with a factor of 4.76 [37].

2.5. The Analysis of Free Amino Acids

10 mg of freeze-dried material were mixed with 250 µL 70% methanol (pH = 2), and 5 µL standard norleucine (1 mmol/mL) were added to the samples as an internal standard. The extraction was carried out for 15 min in an ultrasonic bath on ice. Afterwards, the samples were centrifuged for 5 min at 10,000× g at 4 °C. The supernatants were transferred to new tubes, and a re-extraction of the pellet was carried out with 100 µL 70% methanol on ice for 10 min in an ultrasonic bath. The samples were again centrifuged for 5 min at 4 °C. The supernatants were combined and filled up to a volume of 400 µL, and 100 µL protein precipitation solution (Membrapure) were added. The samples were incubated for 60 min at 4 °C, then were centrifuged for 5 min at 12,000× g at 4 °C. The supernatants were centrifuged in SPIN-X filters for 5 min at 3000× g at 4 °C. The filtrates were transferred to HPLC vials for the HPLC analysis and stored at −20 °C. 20 µL of the extract were injected into an Advanced ARACUS amino acid analyzer (Membrane Pure, Hennigsdorf, Germany) and analyzed according to the manufacturer’s protocol. The amino acids were detected by post-column derivatization with ninhydrin, and the detection was done at 440 nm and 570 nm using maintenance-free LED photometers with 45 amino acids as standards. The values were then corrected in comparison to the internal standard ninhydrin.

2.6. Statistical Analyses

All the data were analyzed using SPSS software (IBM Corp, Armonk, NY, USA). A linear mixed effect model (LMM) with maximum likelihood estimation was used to analyze the effects of the two fixed factors (Larval density and scale) on larval growth and temperature development over time [38]. The linear mixed models were used instead of repeated measures ANOVA due to the missing data in days 6 and 7 and the missing days in the temperature measurements. The pairwise comparisons between treatments were done using Bonferroni correction. The compound-symmetry covariance structure was chosen for the larval growth data and the ante-dependence covariance structure for the temperature data based on the lowest Akaike Information Criterion (AIC) value. Harvest parameters (with no repeated measurements) were analyzed using a two-ways ANOVA after testing their normality and homogeneity of variance. Kruskal-Wallis test was conducted when the parameters did not meet the assumptions of parametric tests. An outlier analysis was performed on the larval mortality, and two boxes from two different treatments with extreme values were identified (IQR multiplication factor 3) and were considered as experimental errors, and were excluded from all the analyses.

2.7. Feed Density vs. Growth, a Model-Based Approach

Not only to complement the findings but also to allow for a prediction, it is possible to model the relationship between the feed density and the larval growth and development rates using the Monod equation [39]. It is known that the growth would increase when the amount of feed increases, so does the growth rate. However, this increase saturates despite a further increase in available feed. The maximum feed ingestion rate is limited by the size of the larvae. This observation is also supported by the results of previous studies [29,40], where the growth and development rates did not increase despite increasing the feed availability.
Following this line of thought, the impact of the feed density X on the growth rate rin, could be quantified via the Monod equation as
r i n = r m a x   X X + k X
where the parameter kX is the feed density in gram feed per larvae and rin is half, and rmax is the maximum possible growth rate.
Such a model can be used to find an optimal feed density or feeding strategy, which balances costs versus gains, and also enables the prediction with dynamical growth models.
The qualitative graph of the Monod equation is shown in Figure A1. This graph shows saturation in the region of high feed density. In this saturation range, an increase or small decrease in feed density has a minimal effect on the growth rate. Accordingly, it is to be expected that other effects influence the growth rate. However, in the region of low feed density, the graph shows a disproportionate increase of the growth rate depending on the feed density, which orchestrates the growth rate. A small change in feed quantity has a large effect on the growth rate. These areas of sensitivity and saturation are especially important for the optimization of larvae rearing.
The above Monod equation was already used to obtain the relationship between the feed density and development and growth rates of BSFL [30]. In this work, the same equation was used in addition to data from other studies to compare the results and identify the resulting growth rate.
Furthermore, the model-based approach is expected to support the results of the statistical analyses from a mechanistic/phenomenological perspective (see results and discussion).

3. Results

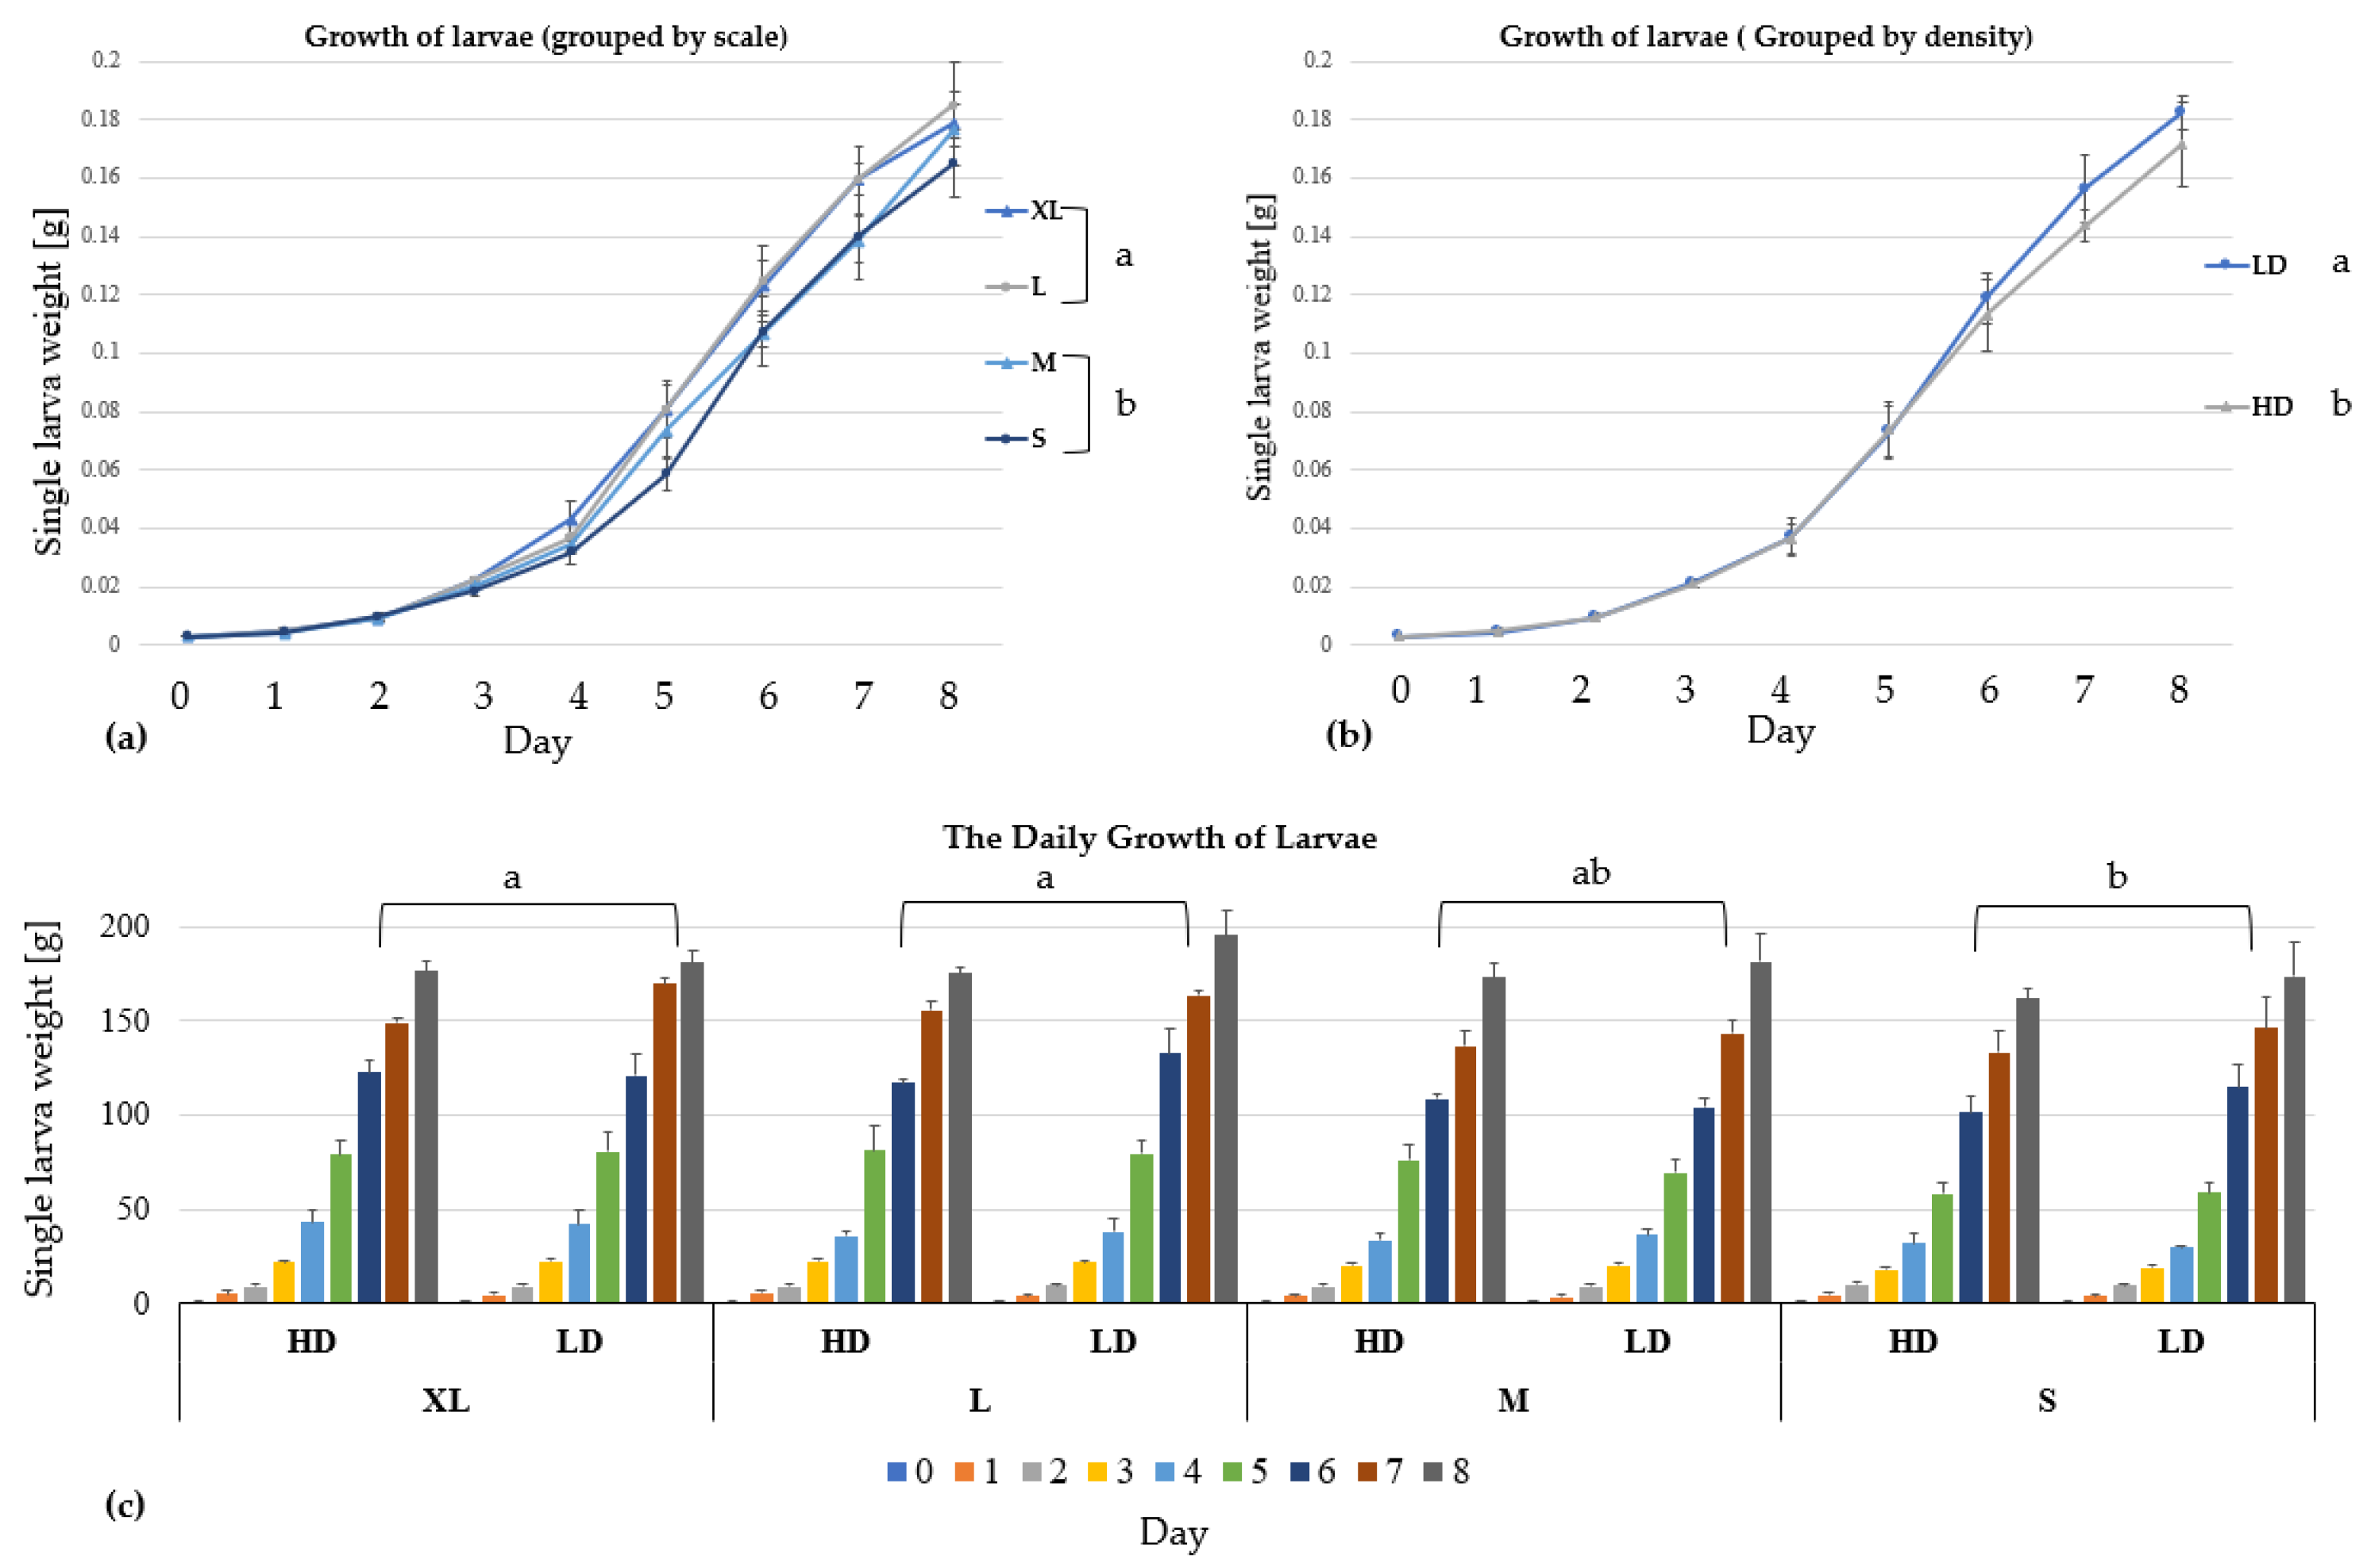
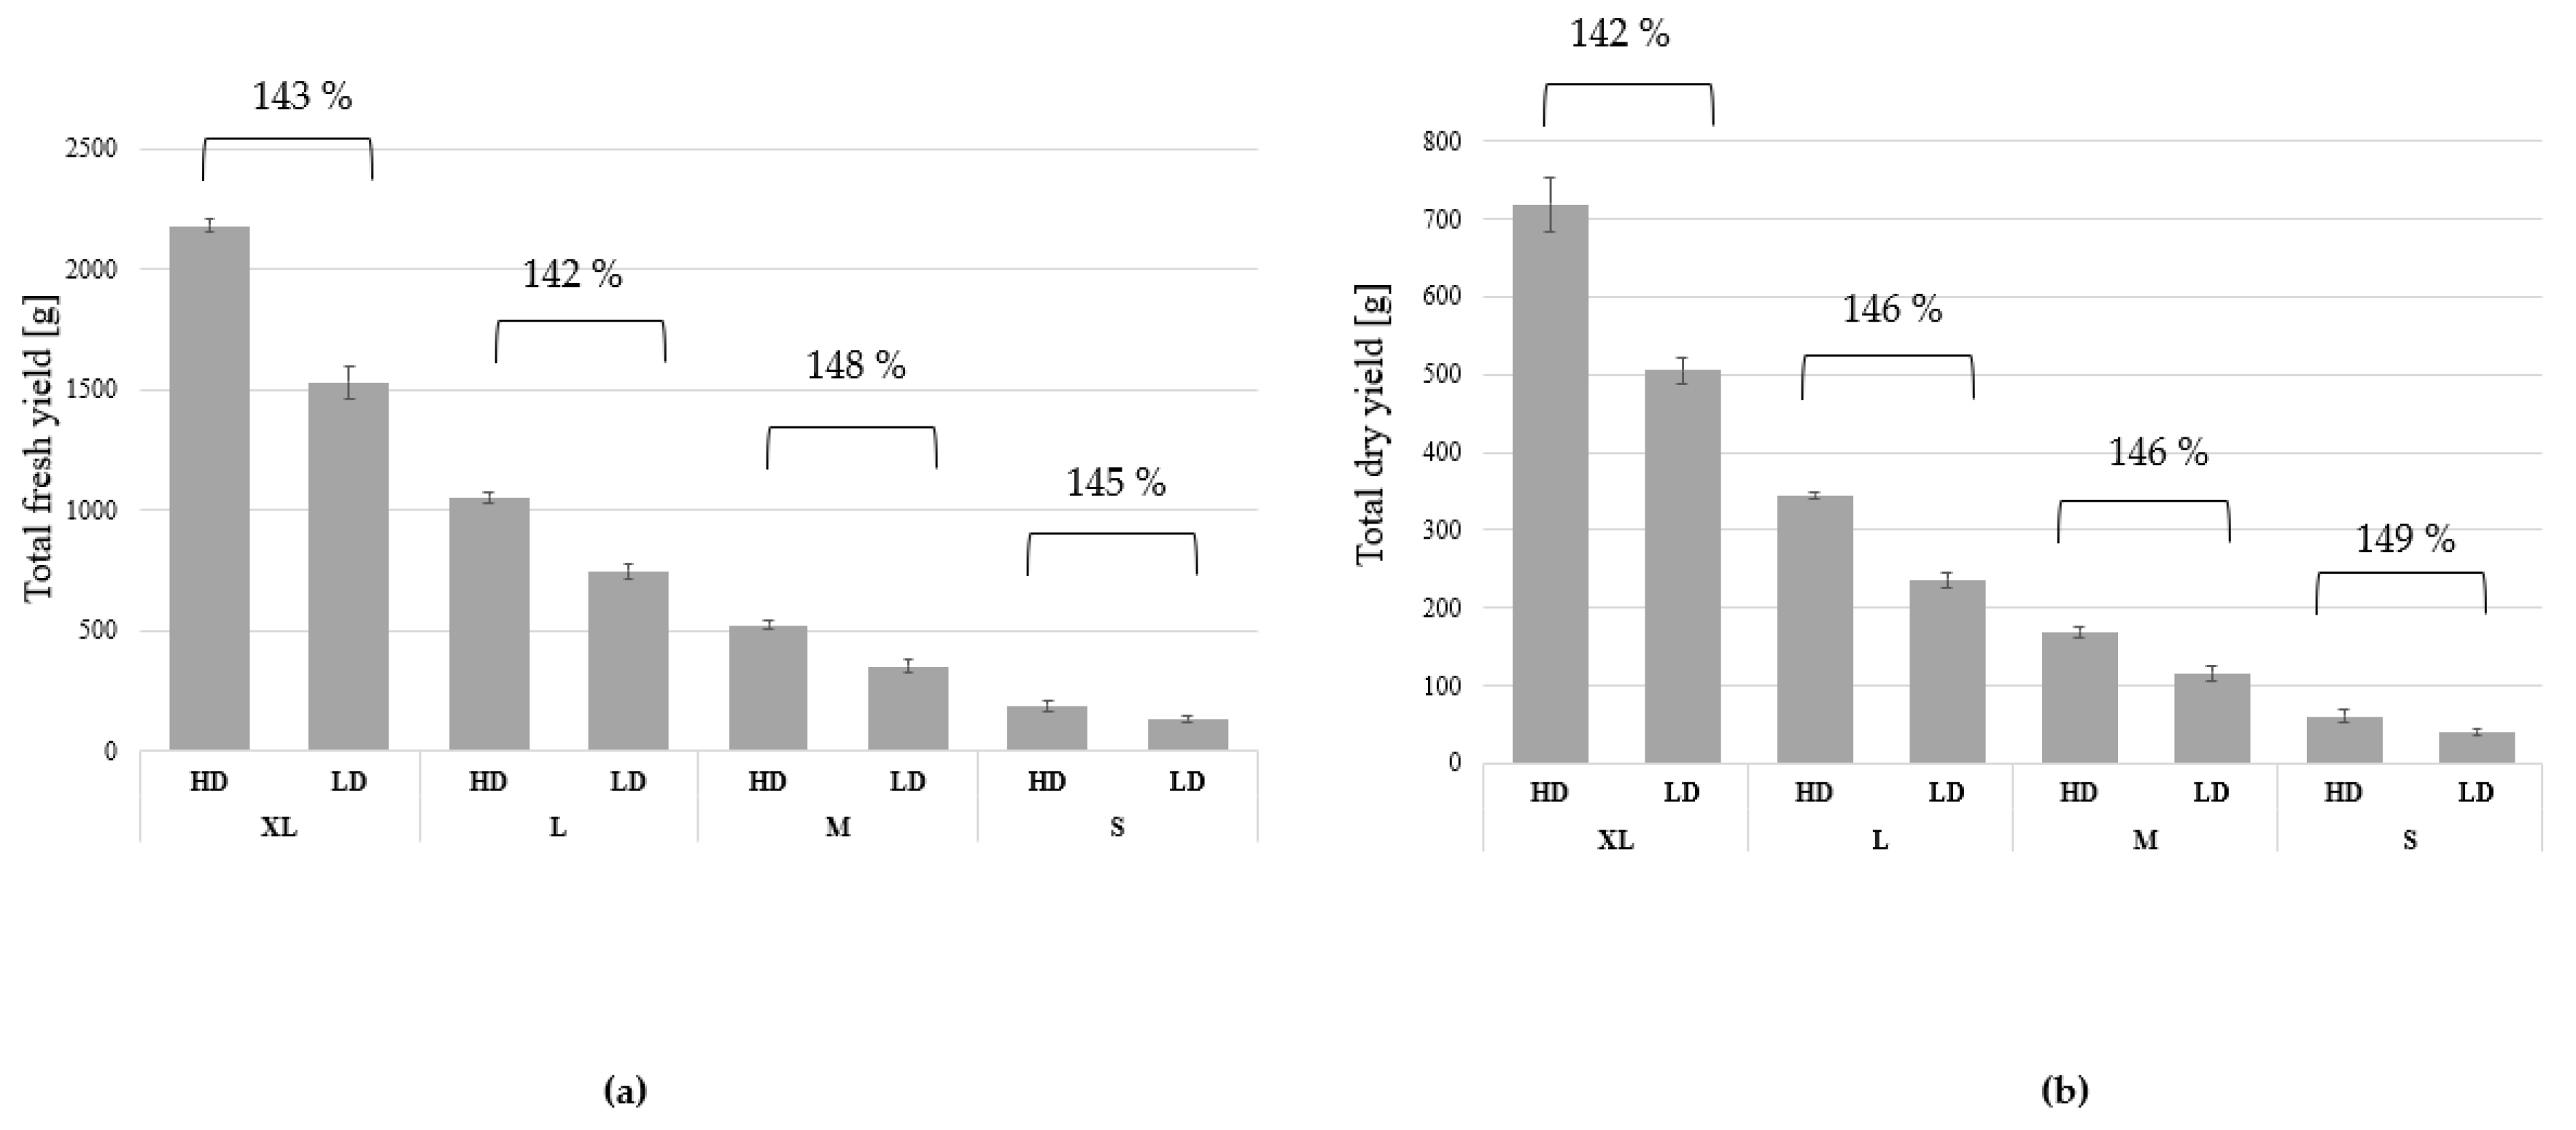
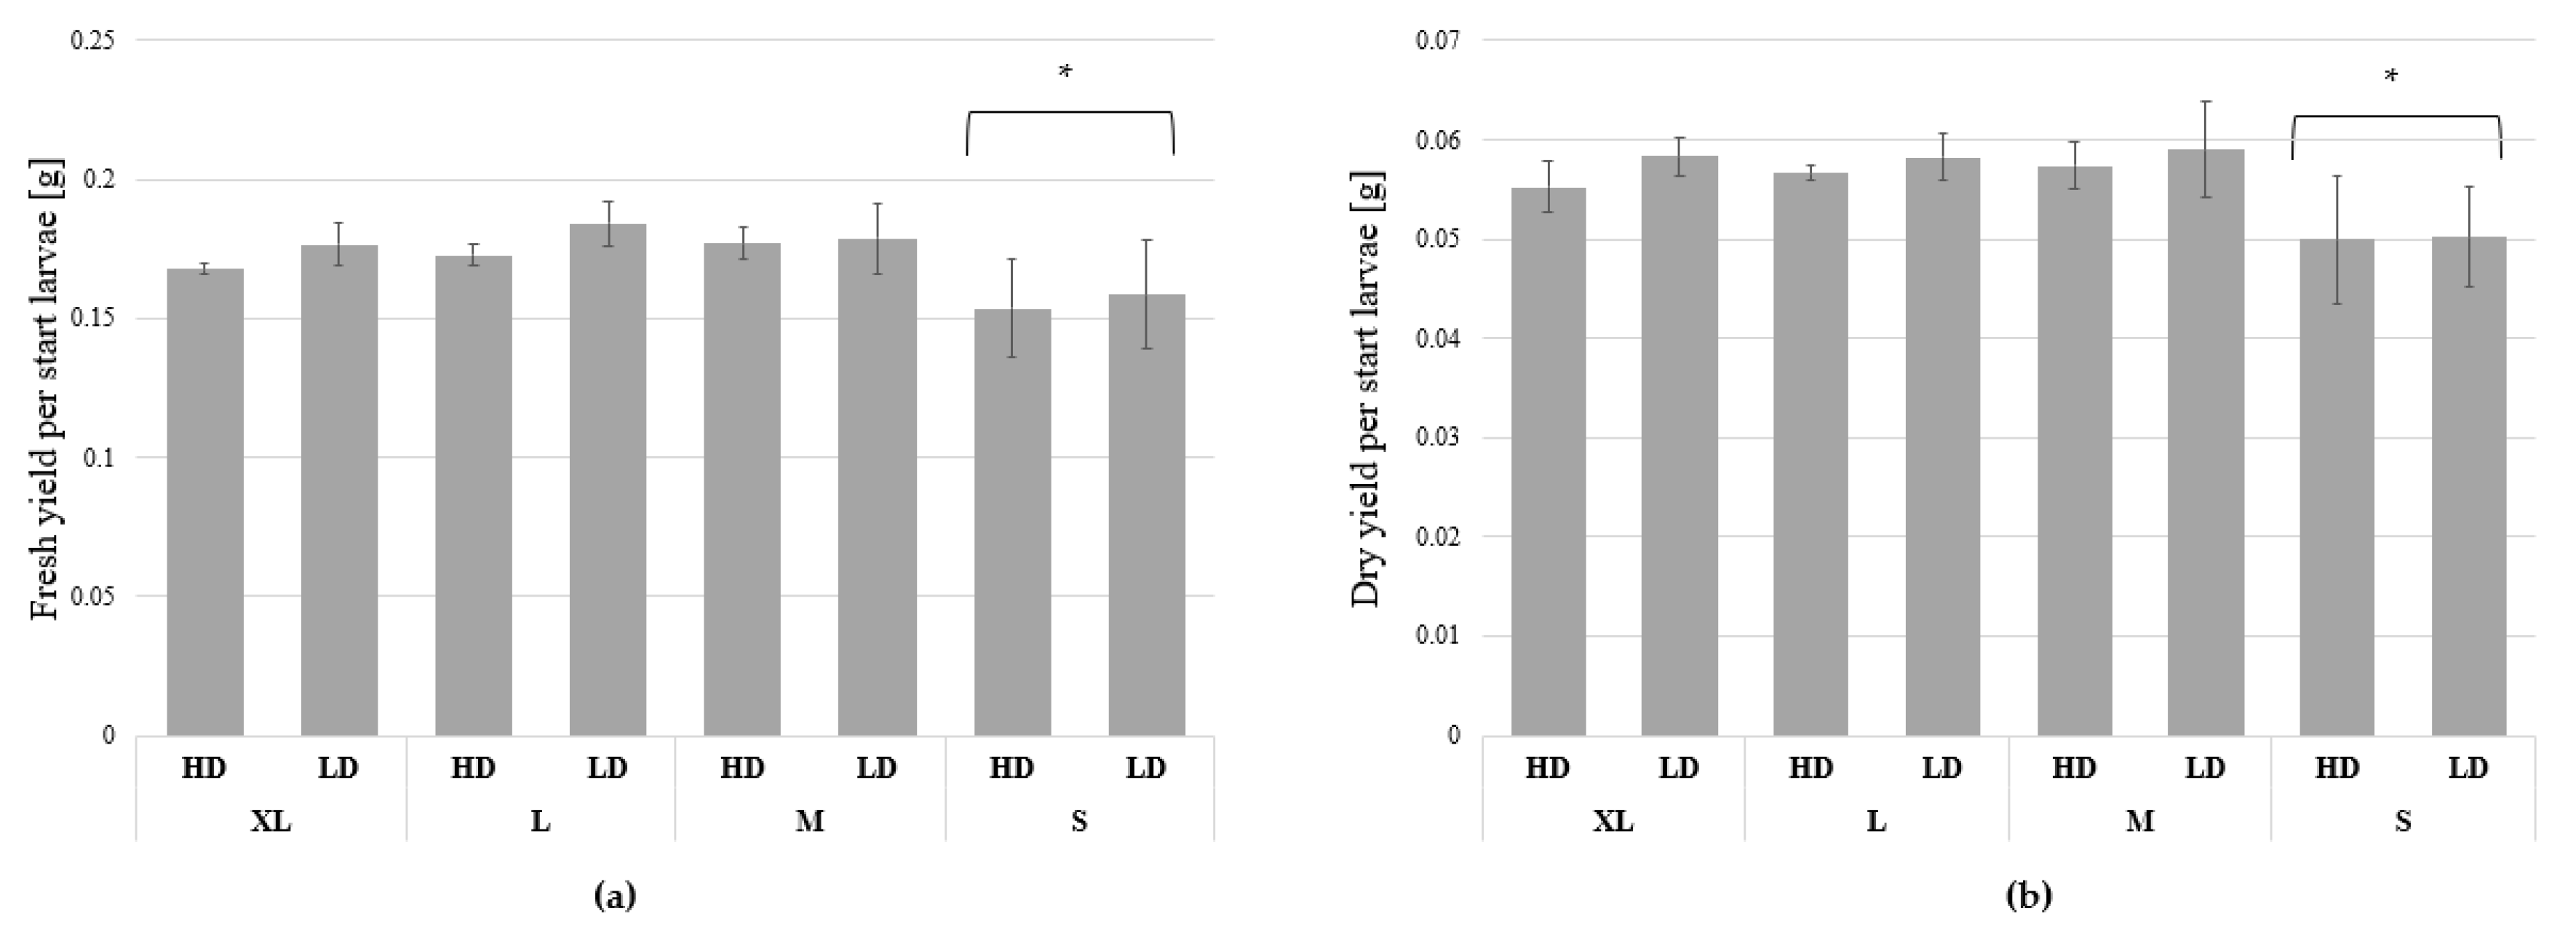
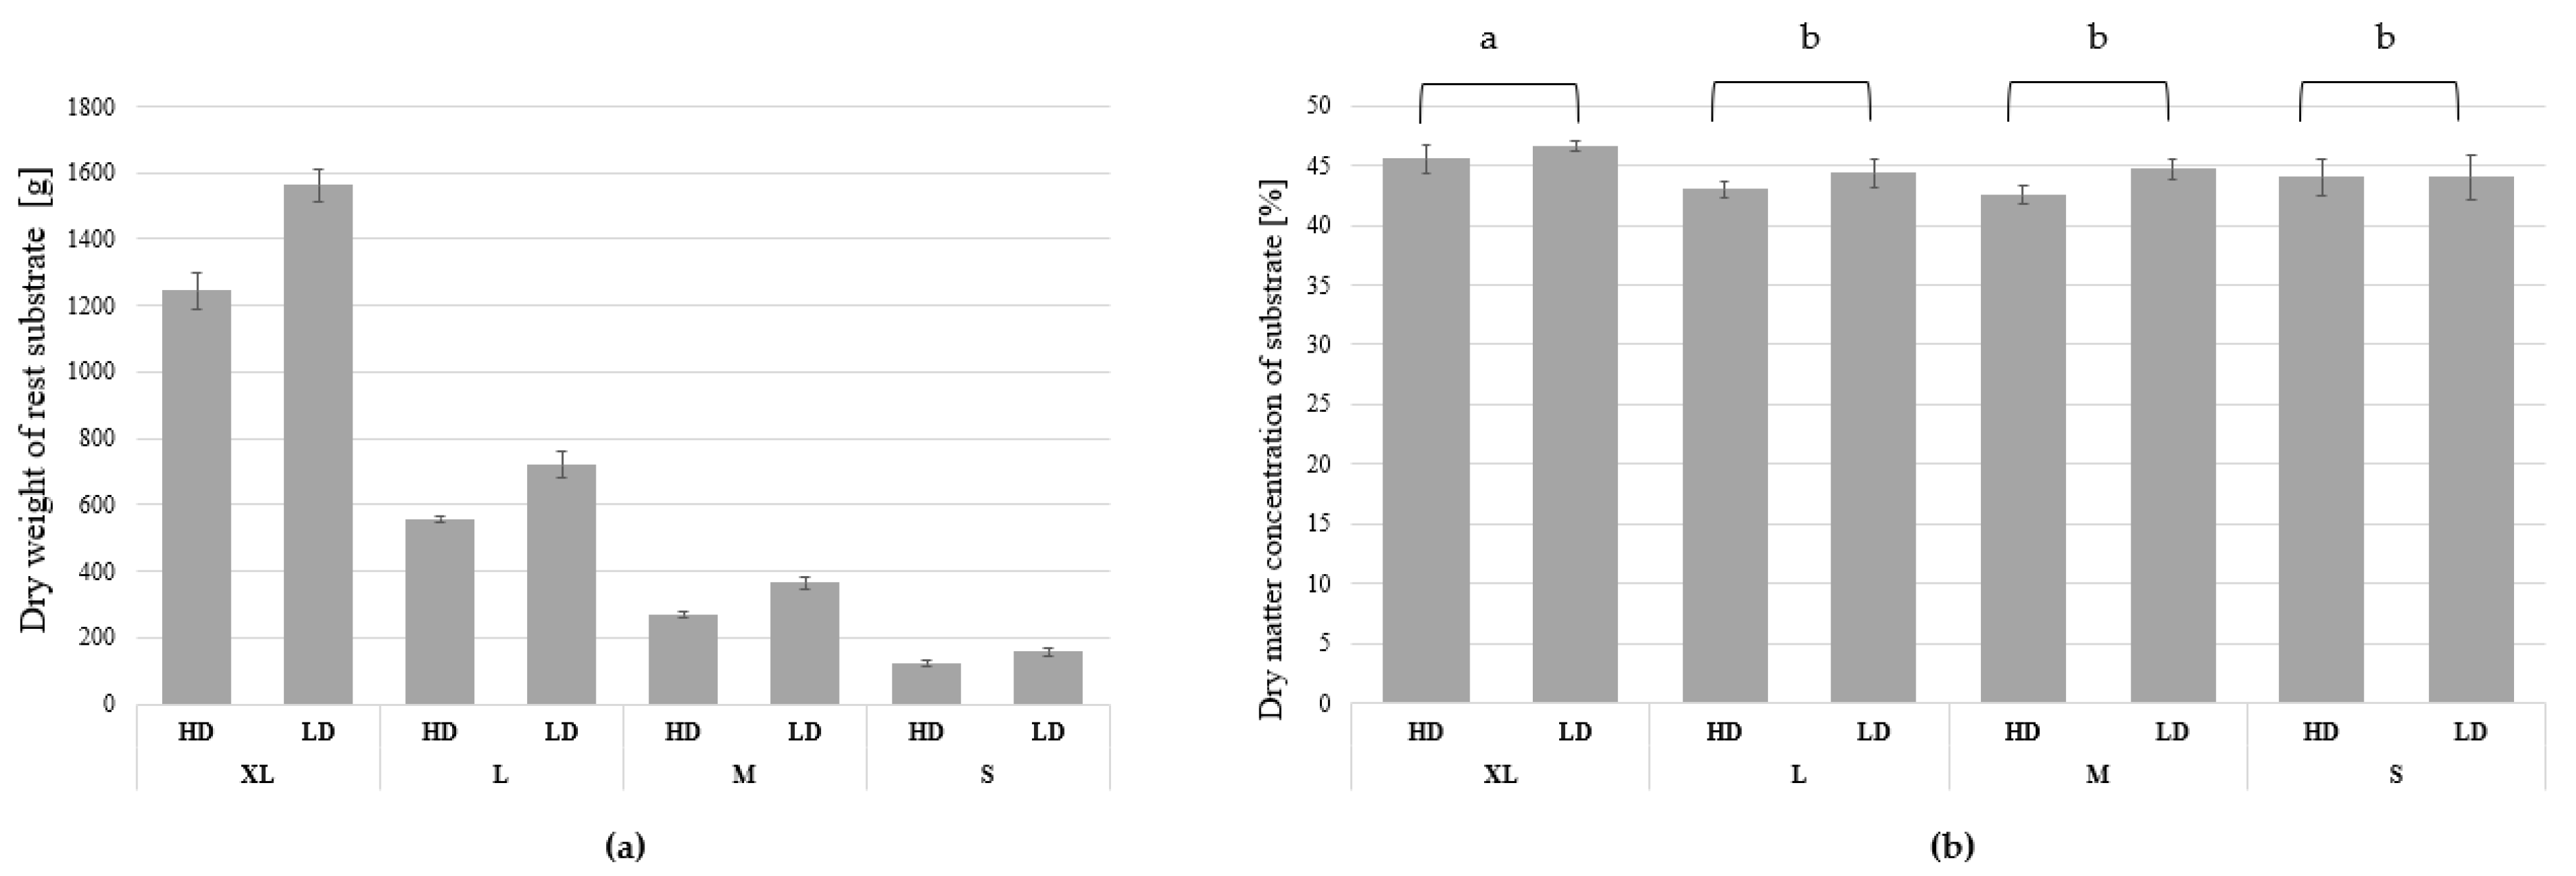
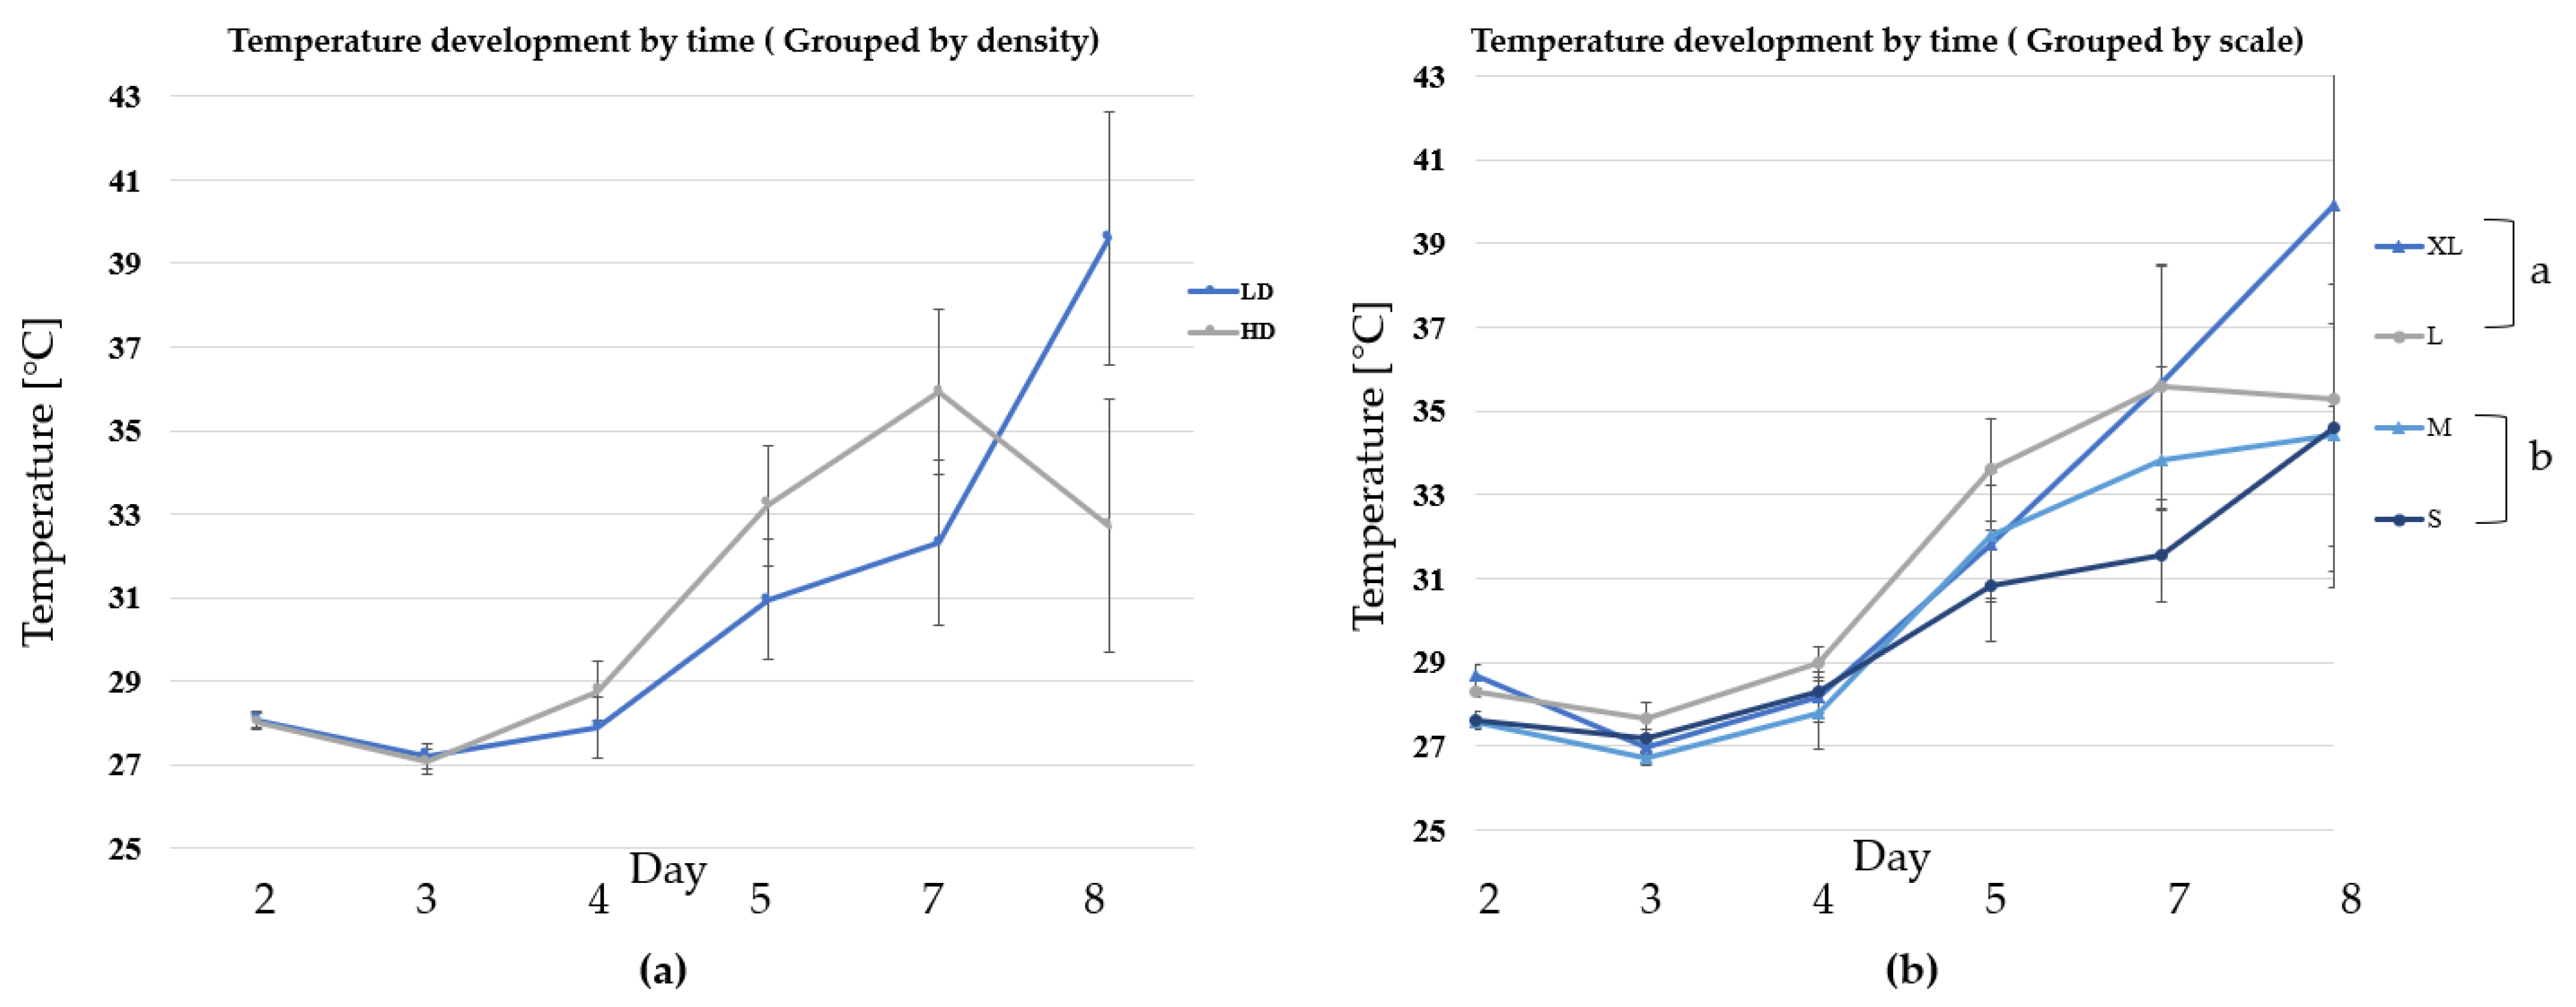
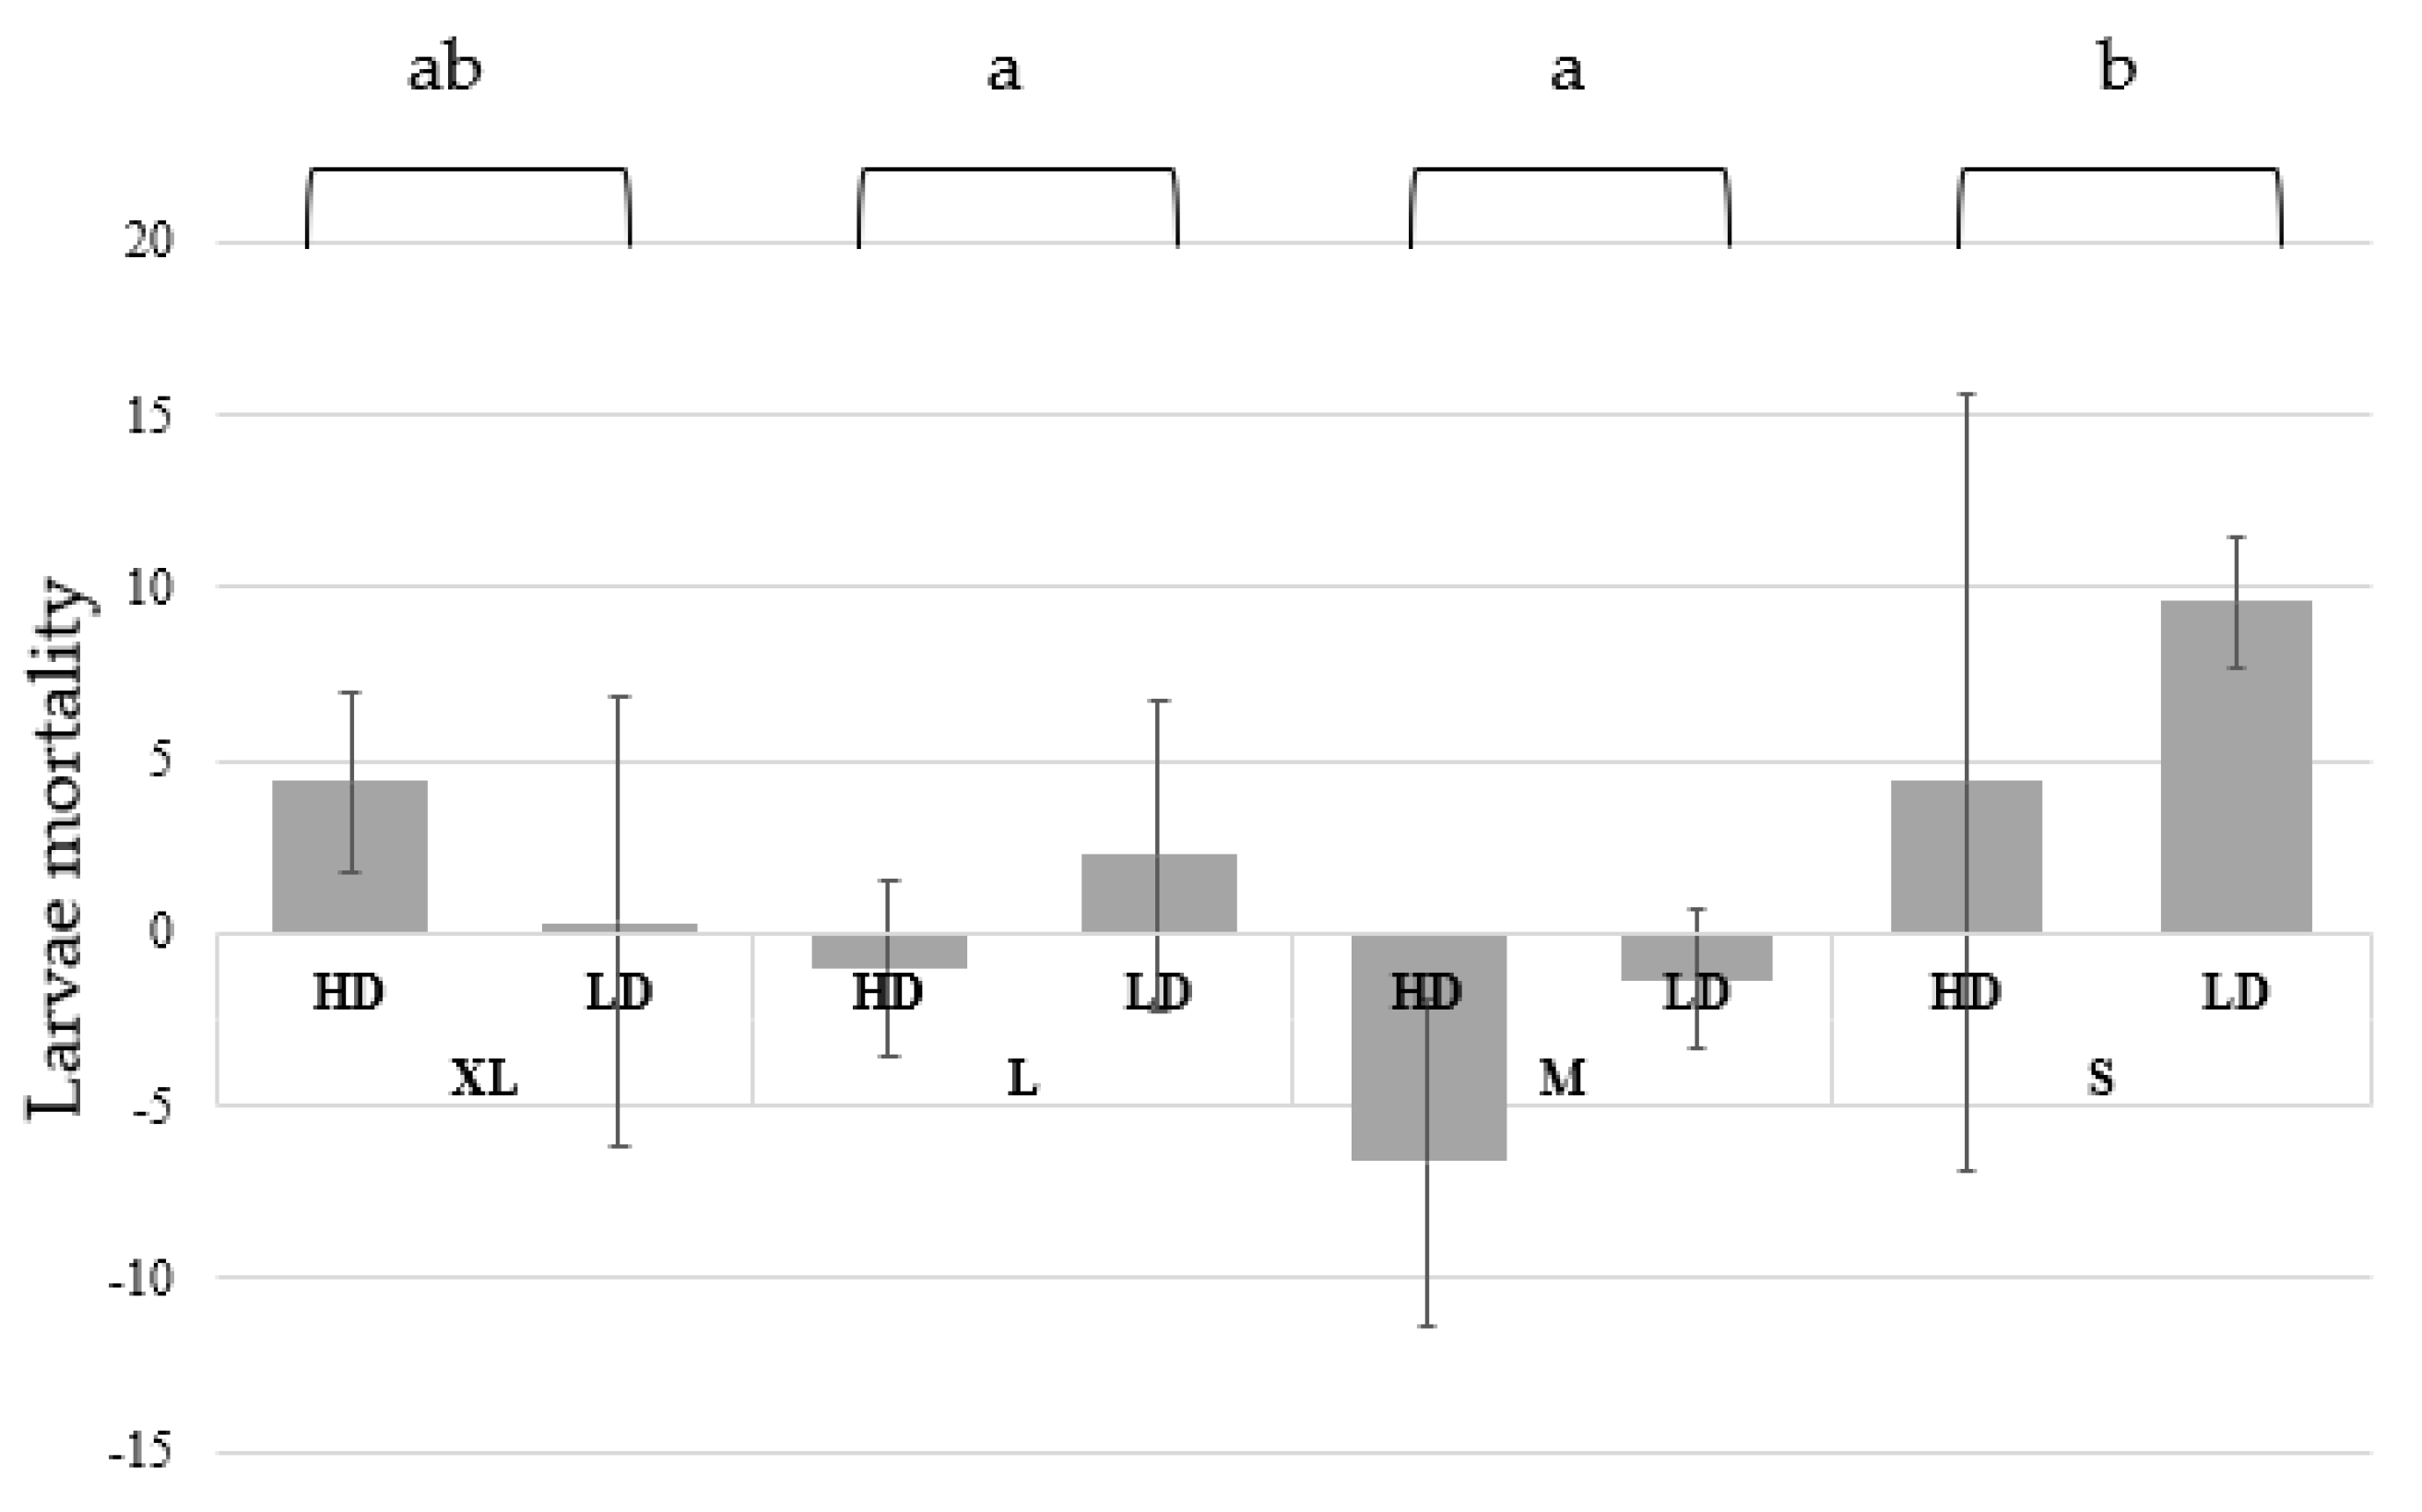
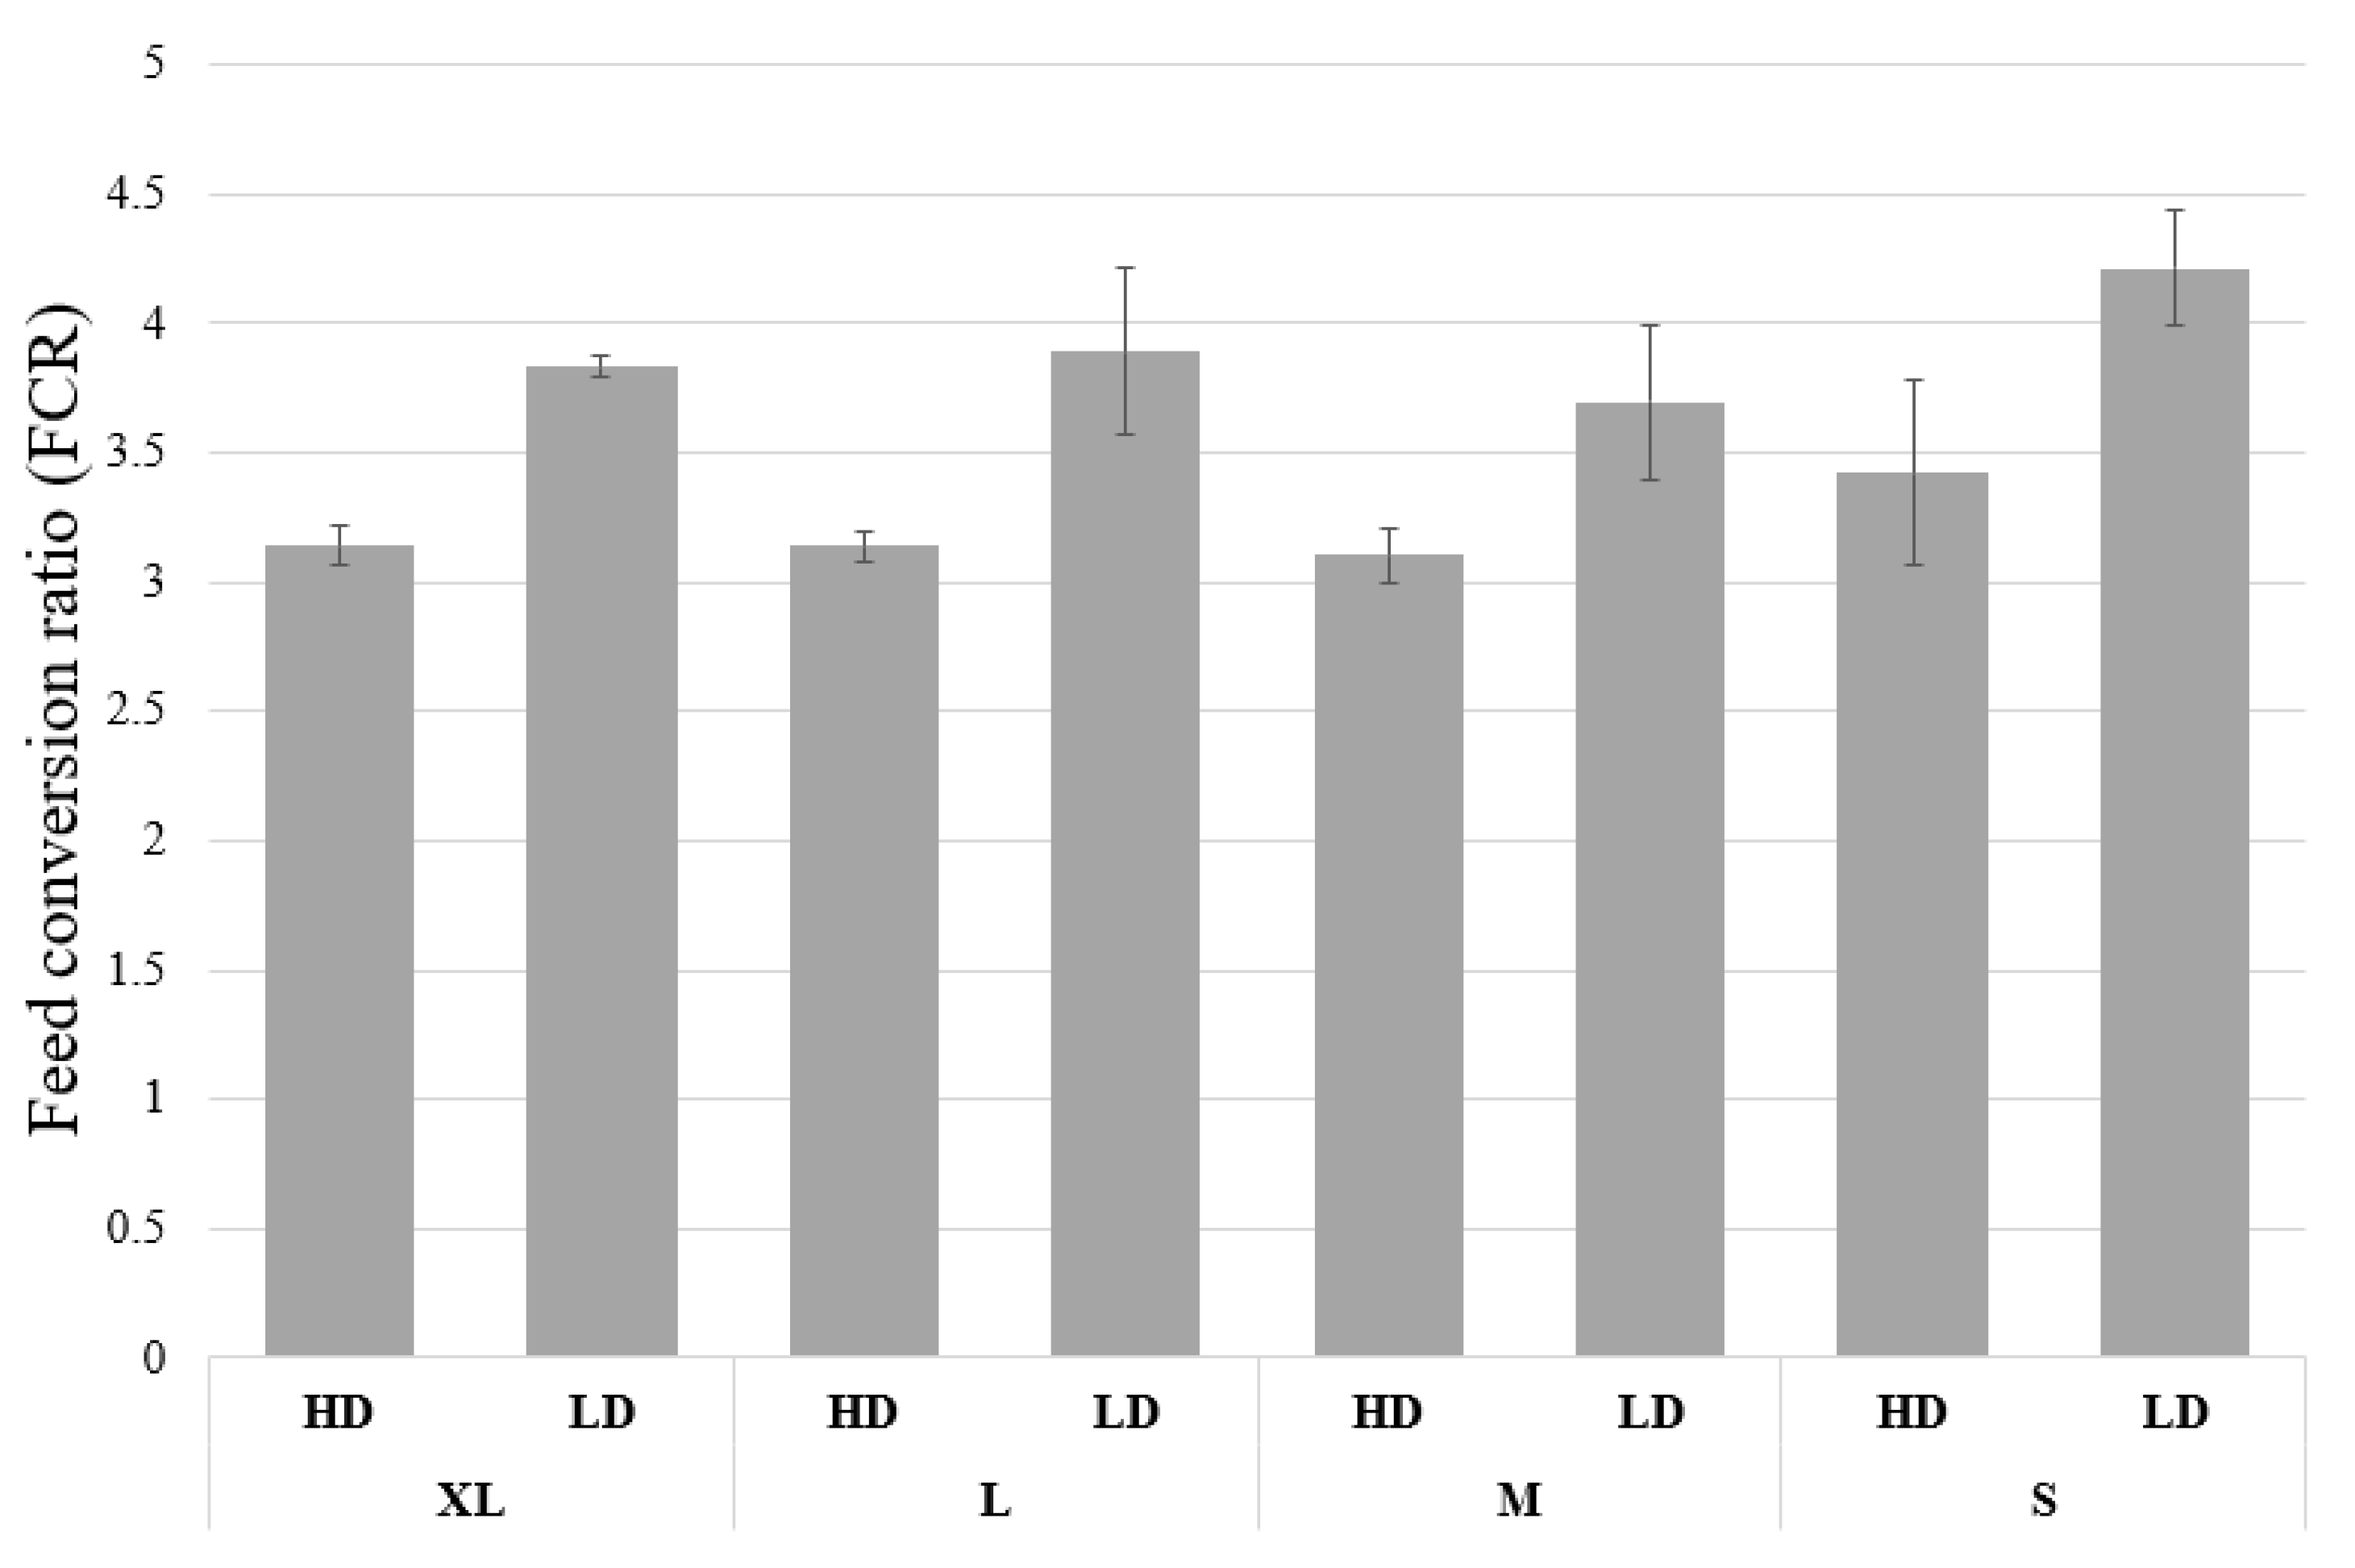
3.1. Growth and Biomass Parameters

The growth of larvae reared in two densities, and different scales was measured and is shown in Figure 1. The larvae grew in all the boxes and exceeded the weight of 150 mg on the 8th day. Both factors, larval density and scale, influenced the growth curves of the larvae and the individual larval weight. The scale factor influenced the growth curves and the final individual larval weight as the larvae had higher weight when the rearing boxes were bigger (Figure 1). The individual larval weight was significantly higher at the low density (LD) treatments in comparison to the high density (HD). The same differences were observed in the dry weight of larvae (data not shown).
The differences between the density treatments in total fresh and dry yields were consistent between the different scales (Figure 2). The 50% difference in densities applied as a treatment translated to a difference in yield ranging from 42 to 49%. The yield per larvae ratio, calculated by dividing the final yield by the start number of larvae, was influenced by the scale but not by larval density (Figure 3). The smallest scale had the lowest ratio.
The weight of the rest-substrate was also influenced by the two factors and was higher in the LD treatments (Figure 4). Nevertheless, the dry matter percentage was higher in the XL boxes while the trend between HD and LD was reversed in the smallest scale, but no significant interaction between the two factors was observed.
The temperature development in the boxes was significantly influenced by the time of measurement and the scale, in addition to an interaction between both. The density factor in this experiment did not influence the temperature but significantly interacted with the time (Figure 5). Additionally, the big two scales (XL and L) significantly differed from the M and the S scales.
The larval mortality values were the highest in the LD-S treatment (9.6%) and were not influenced by the density of larvae but by the scale (Figure 6). Mortality values were higher in the S scale and differed significantly from M and L. Only a trend between XL and S was observed. Furthermore, feed conversion ratio (FCR) was higher in LD treatments, but it did not significantly differ between the scales (Figure 7). Only a trend of increase in the S boxes was observed.

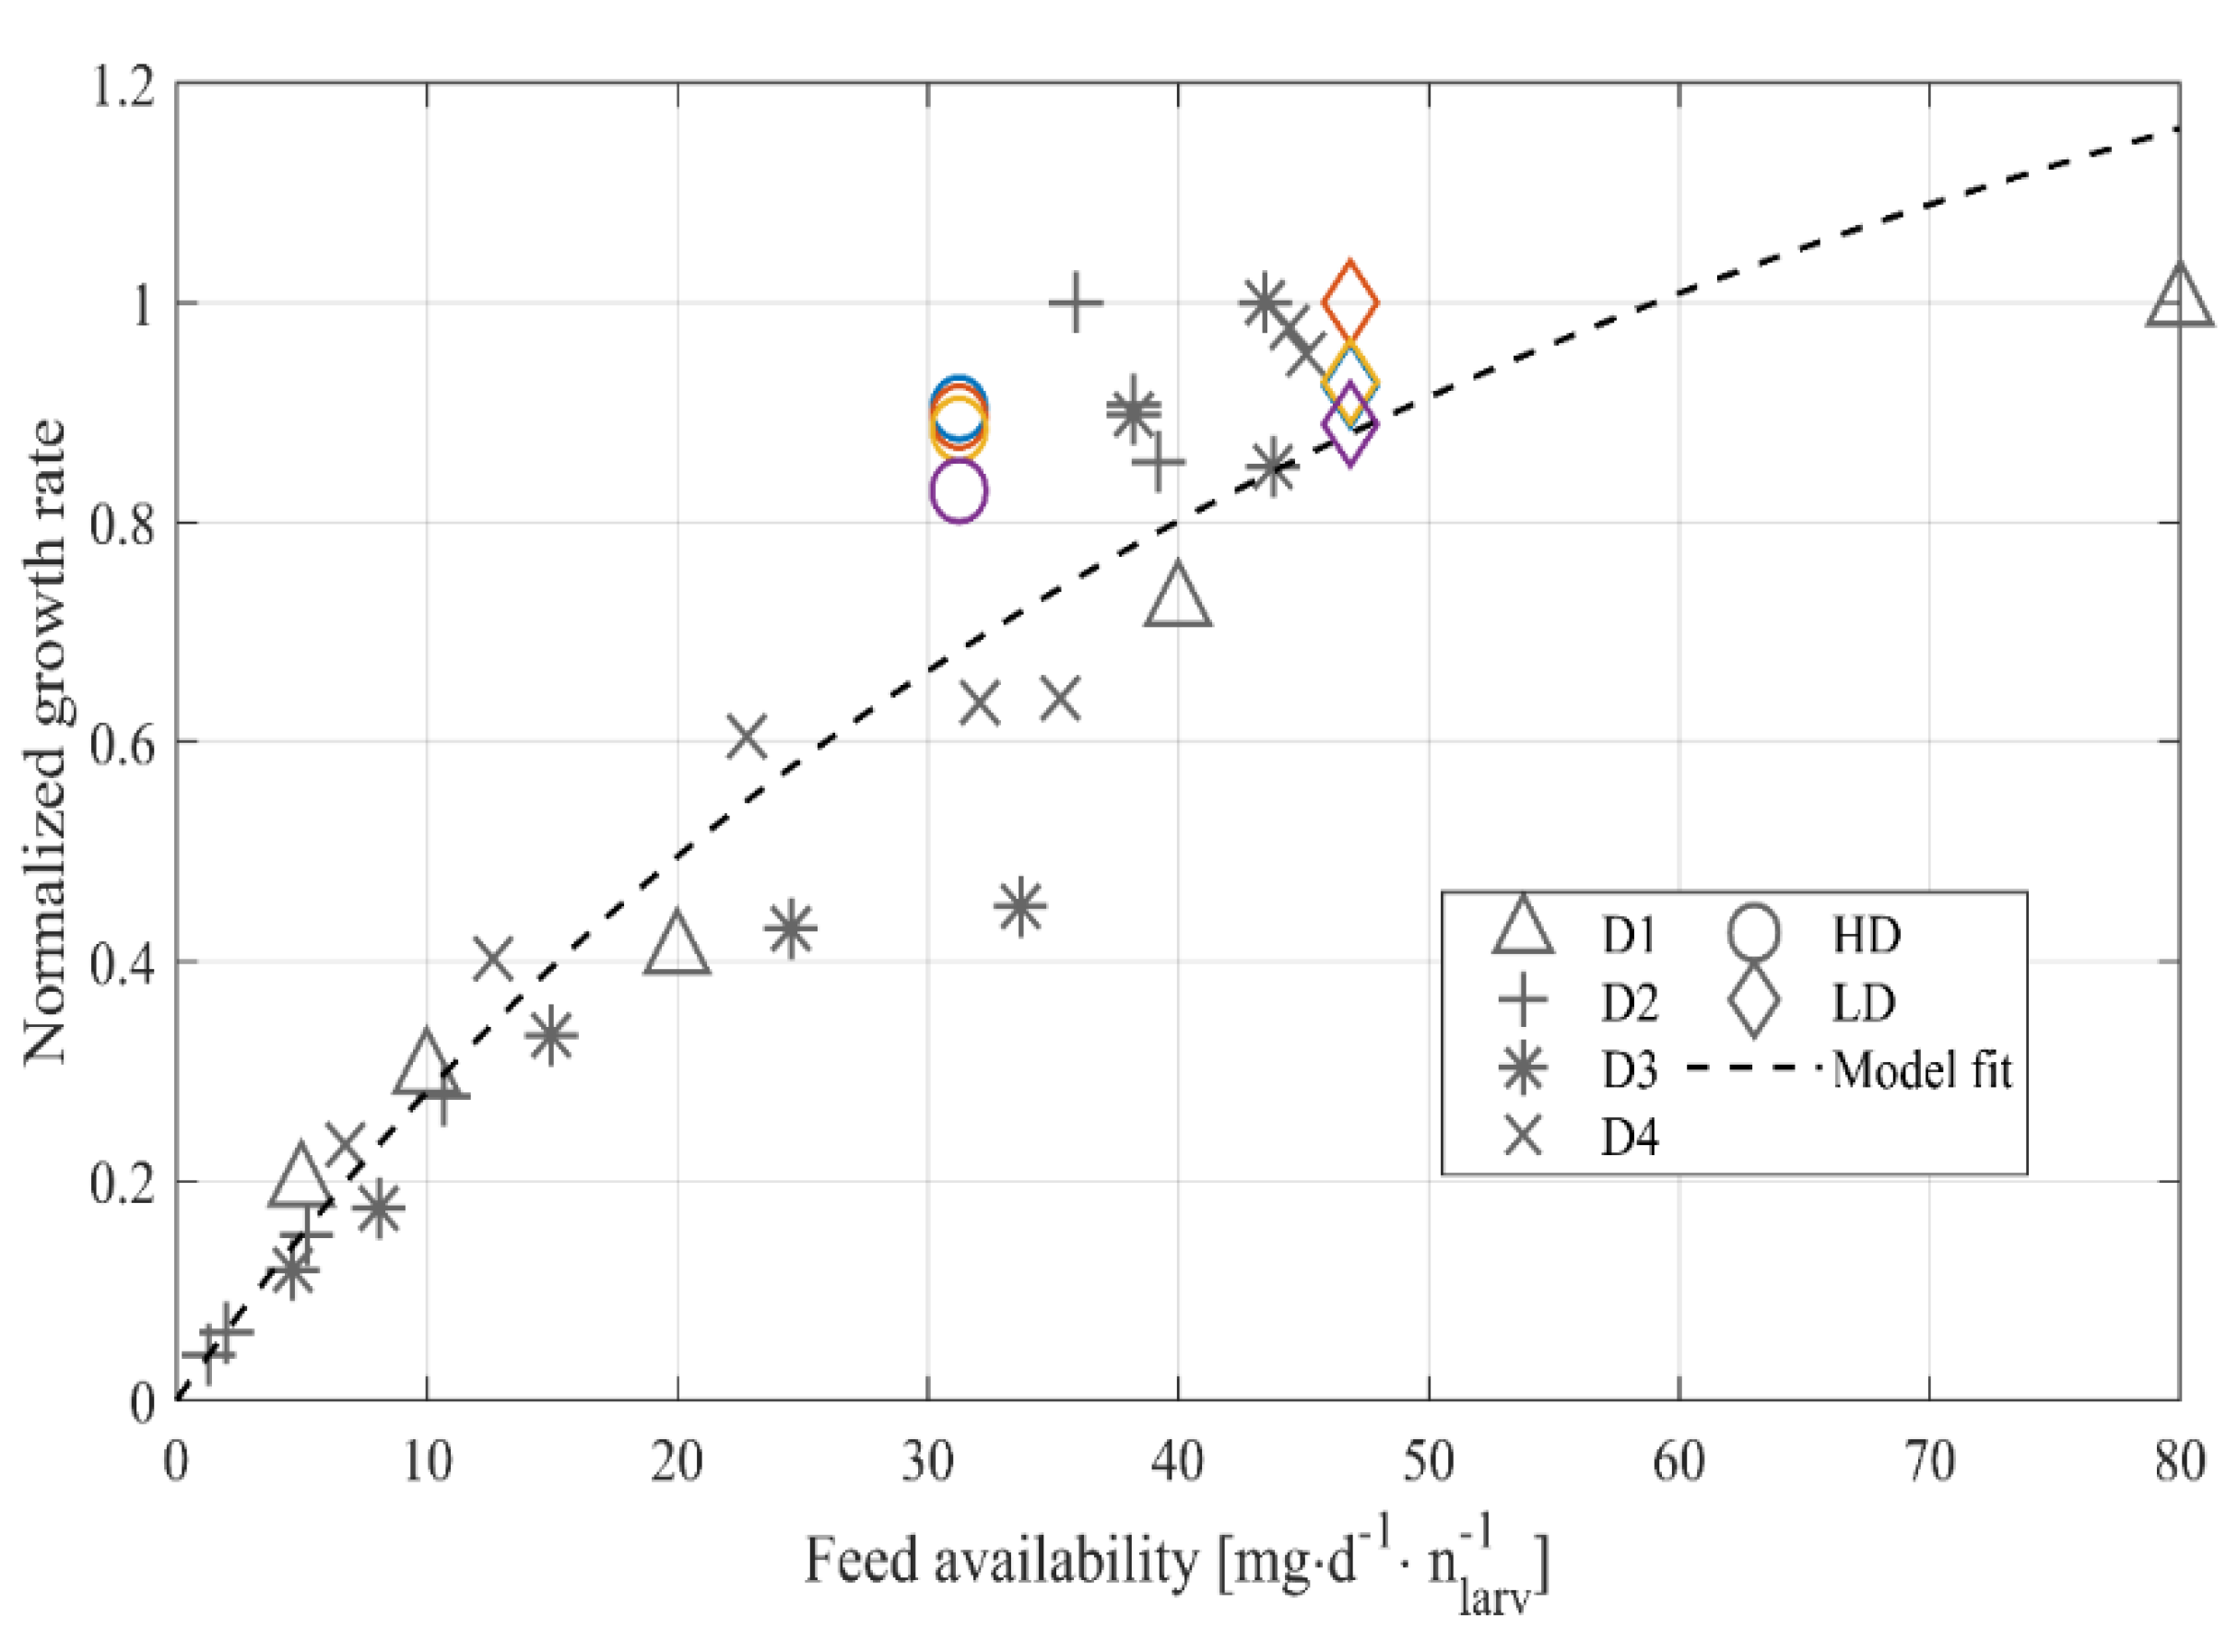
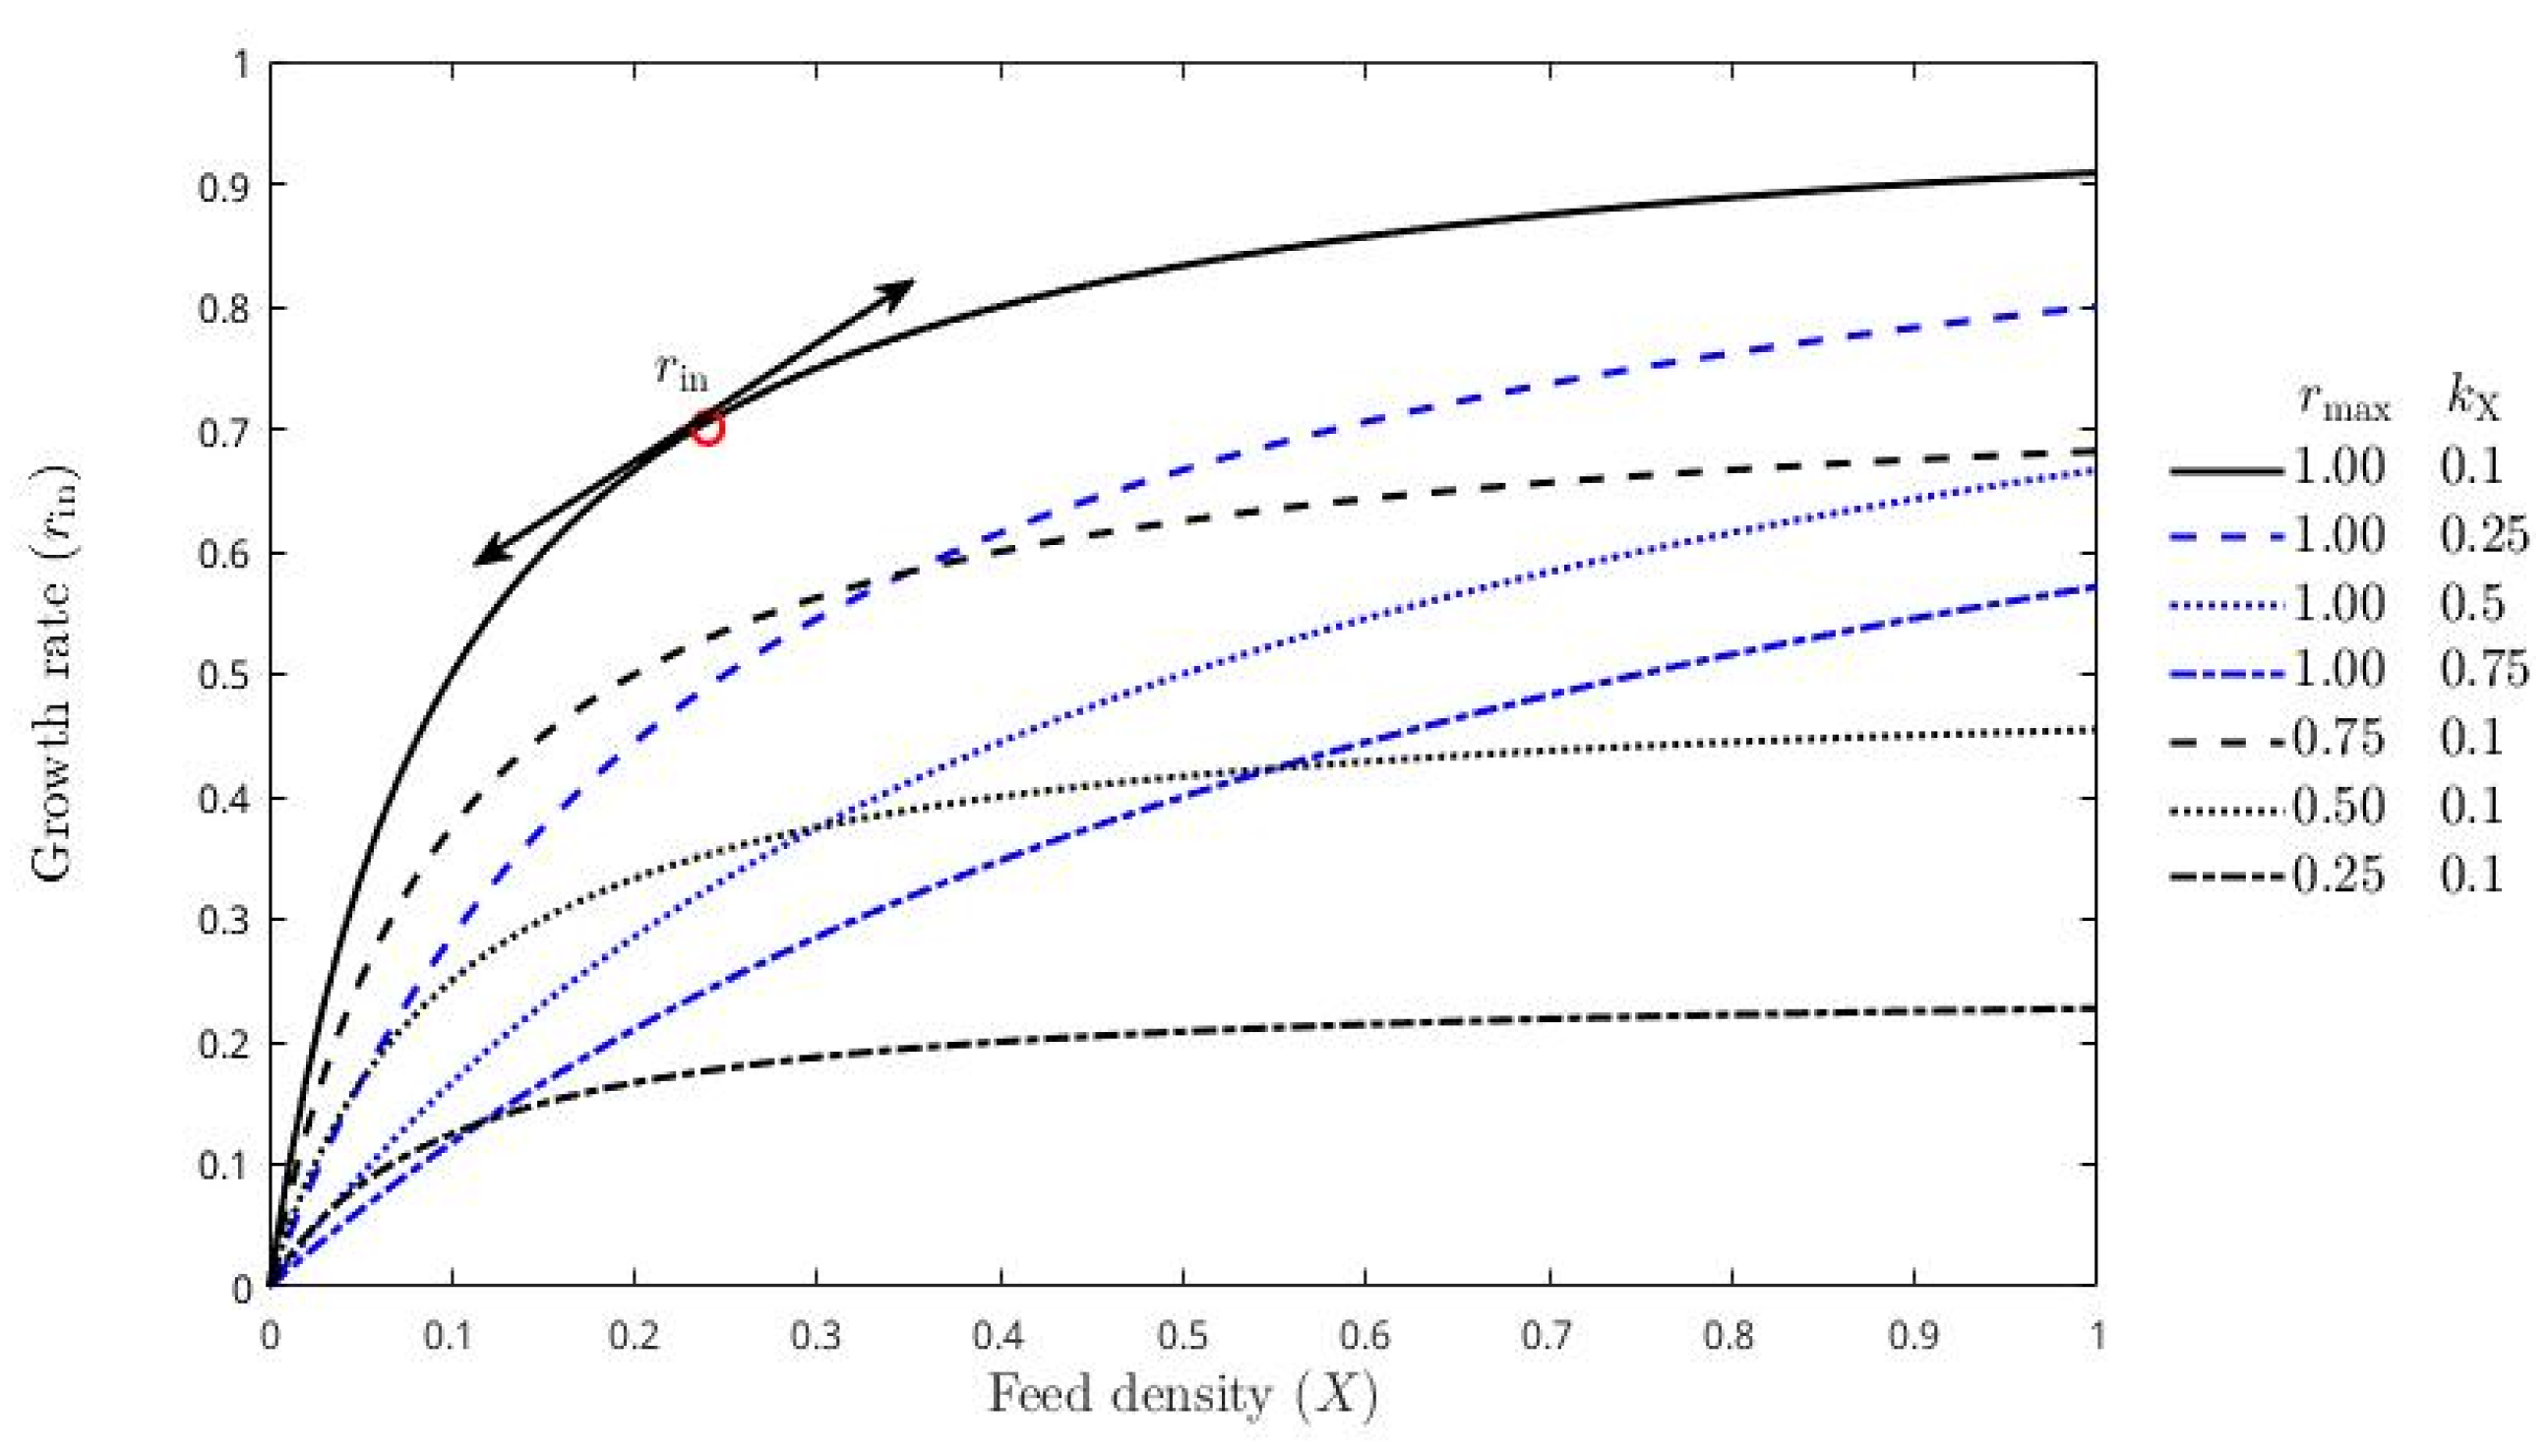
3.2. Model-Based Approach

Data generated in this study were compared to data from the literature in Figure 8. Diener et al. [40] (D1) used a daily feeding regime in their work. Barragan-Fonseca et al. [29] (D2, D3, D4) used both daily and batch feeding. Experiments D1, D2, D3 and D4 were performed using different feed treatments. For better comparability, the data were normalized to the maximal measured larval mean weight per treatment.
A difference in the growth between the two feed densities was observed (Figure 8). Furthermore, for both feed densities, the larvae in the small boxes performed the worst, while there is no clear tendency in the other box sizes. Using least square method, model parameters were estimated as rmax = 2.09 and kX = 64.5 with R2 = 0.87.

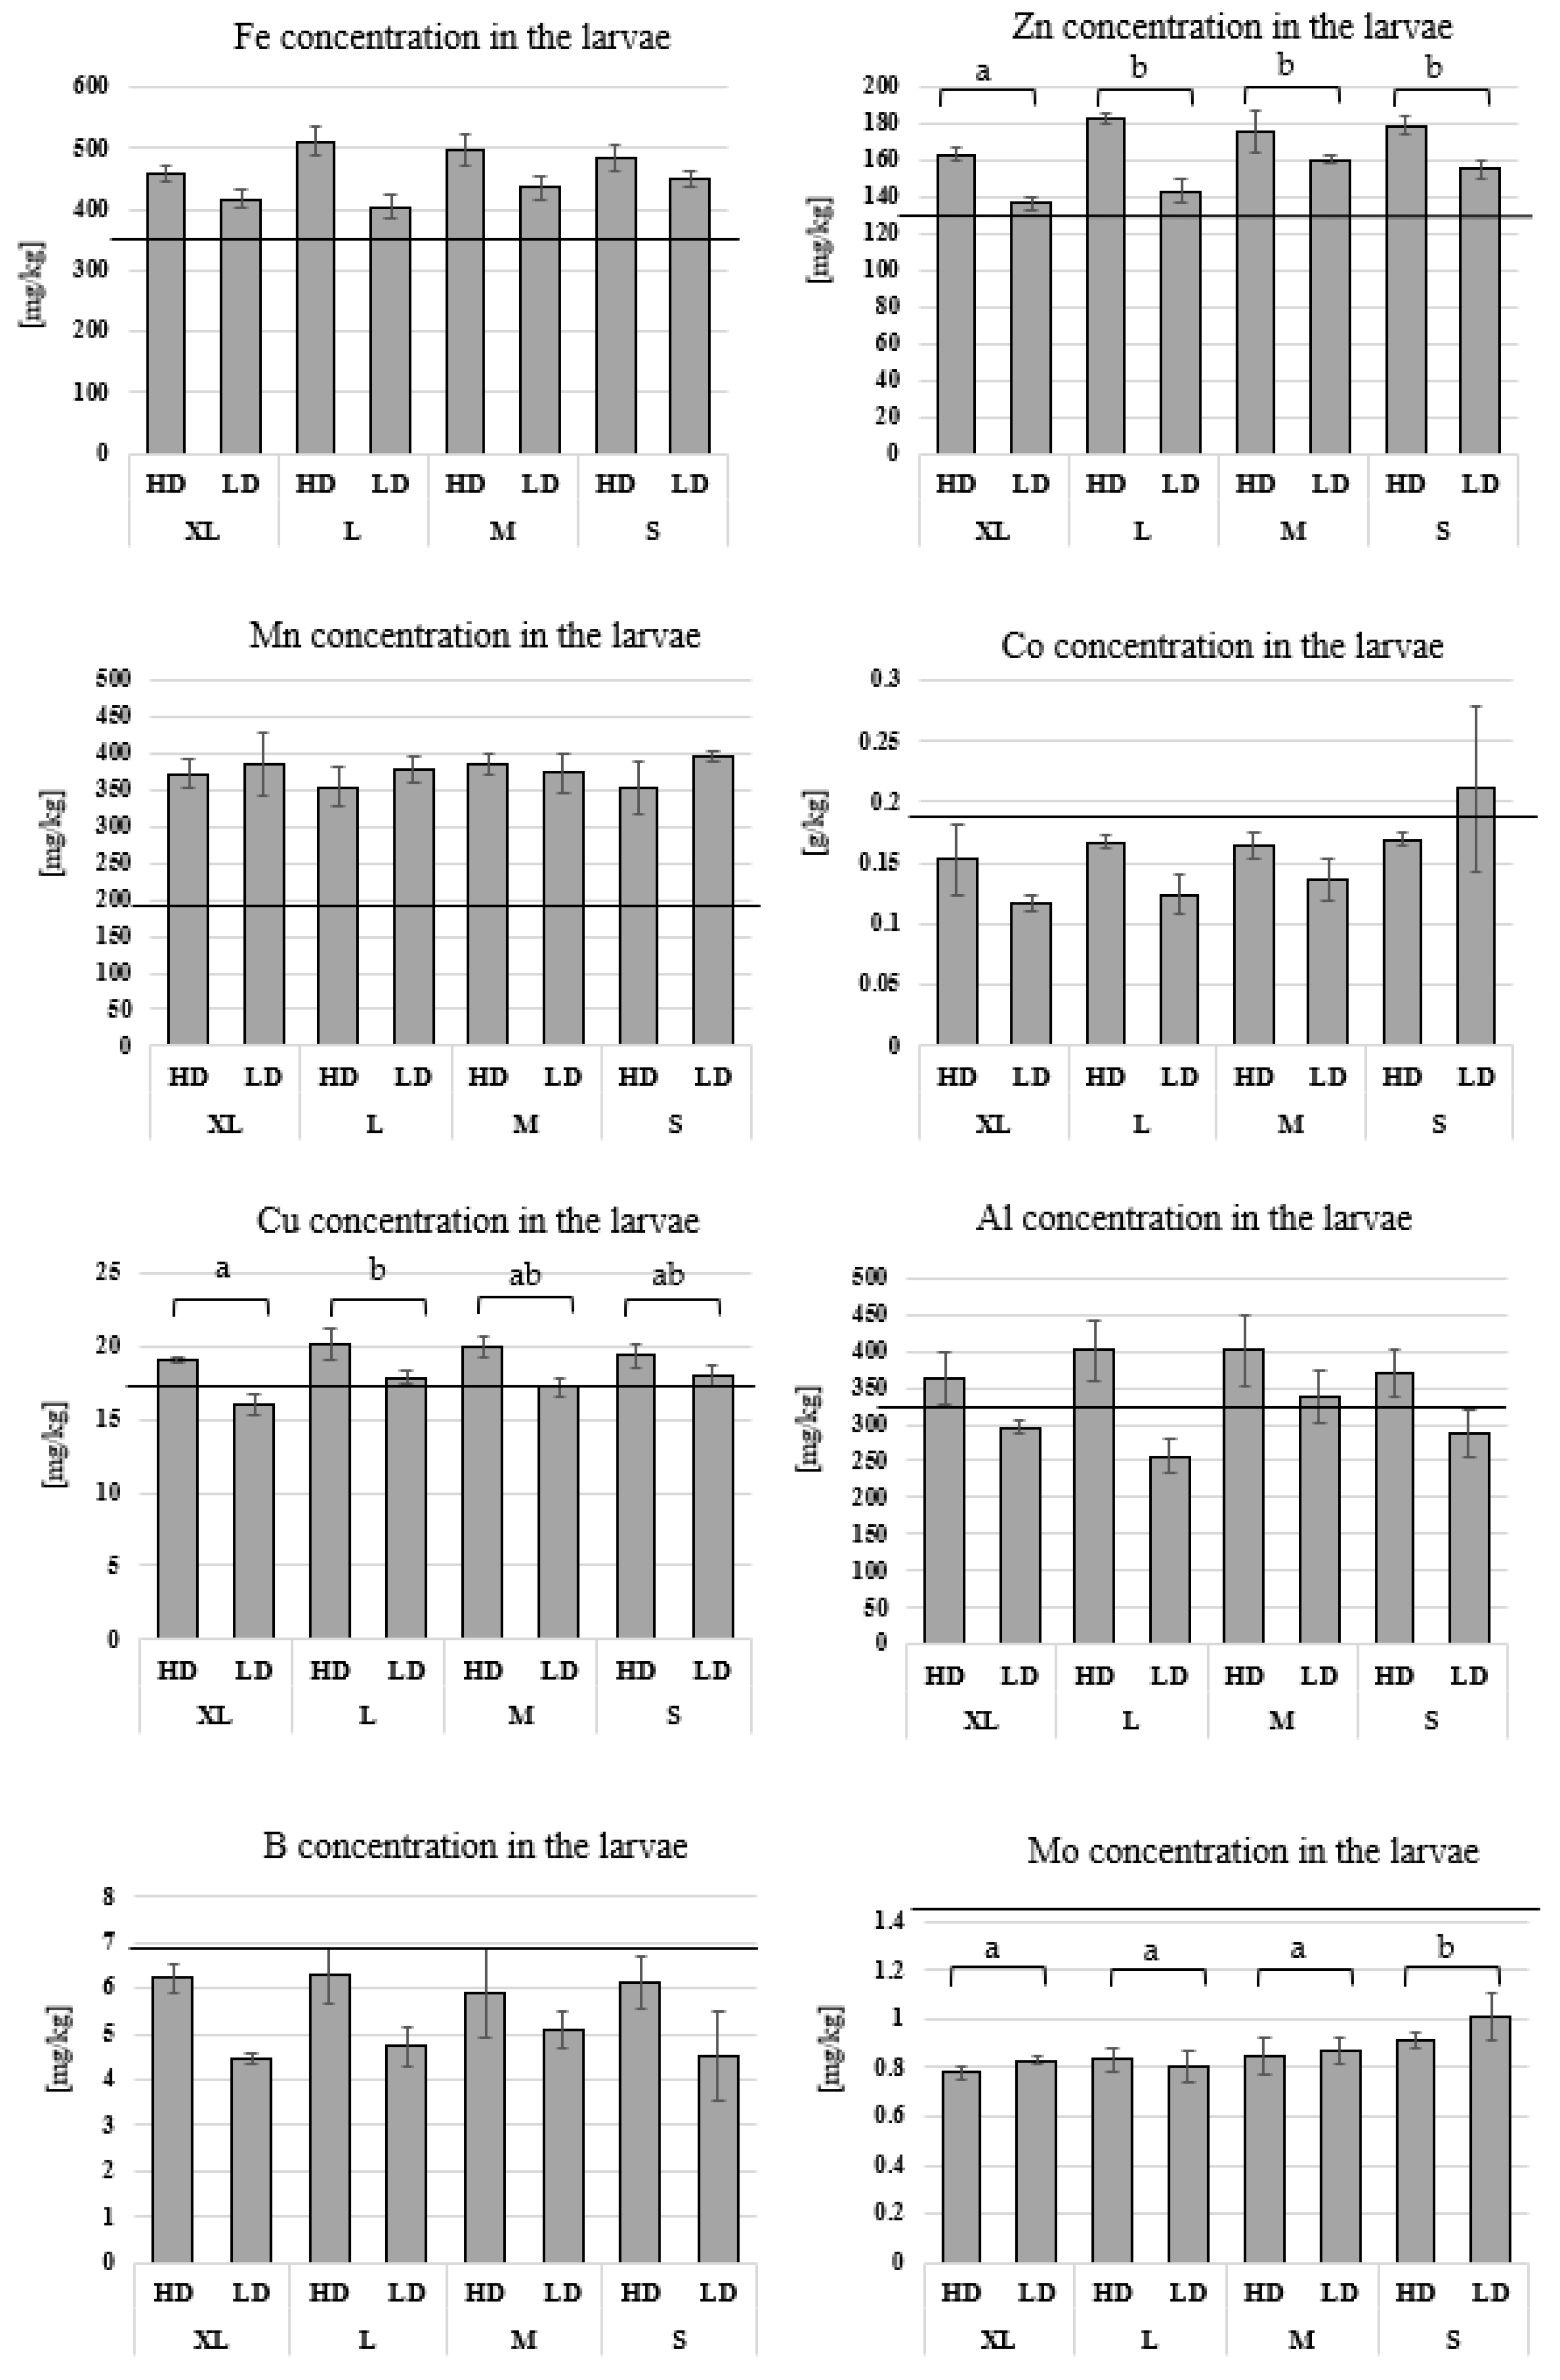
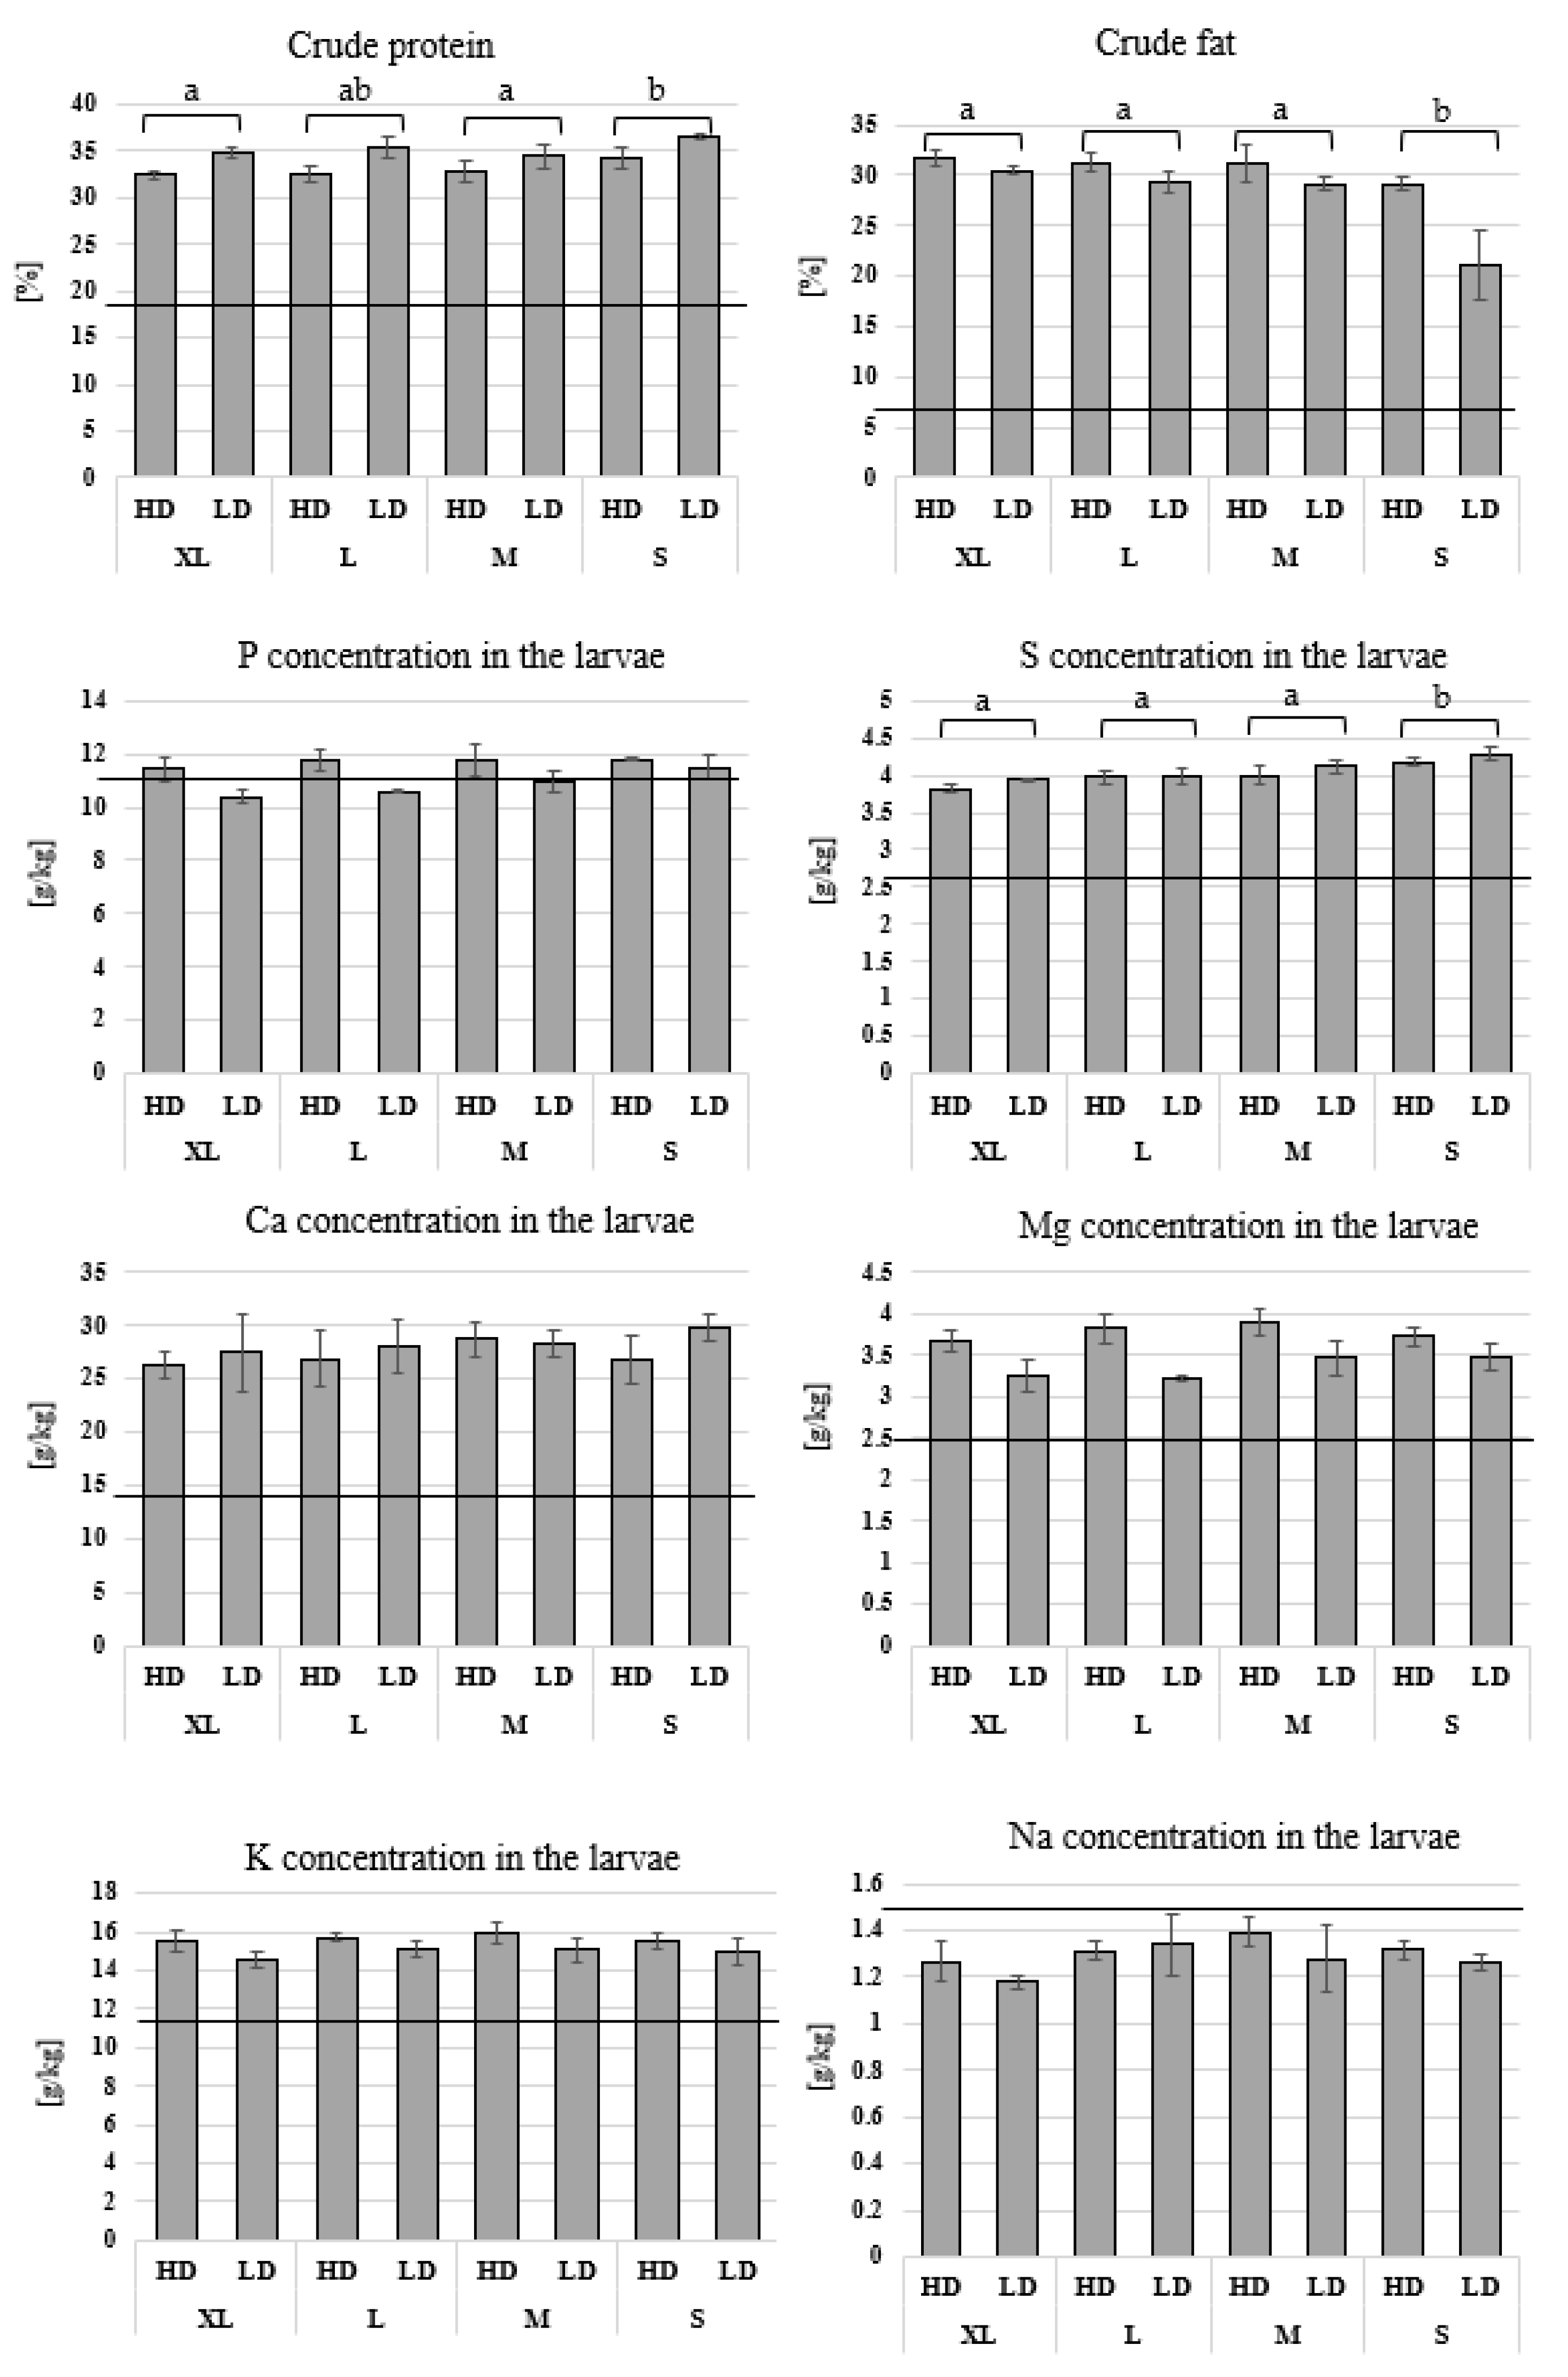
3.3. Chemical Analysis

Crude protein, crude fat, phosphorus (P), sulfur (S), calcium (Ca), magnesium (Mg), potassium (K), sodium (Na), iron (Fe), zinc (Zn), manganese (Mn), cobalt (Co), copper (Cu), aluminum (Al), boron (B), and molybdenum (Mo) were measured and compared between the treatments.
The concentration of crude protein, crude fat, S, Ca, Mg, K, Fe, Zn, and Mn were higher in the larvae in comparison to the start feed in all the treatments, while in the case of Cu and Al, the concentrations were slightly higher or lower depending on the treatment. The concentrations of Na, Co, B, Mo were lower in the larvae than in the start feed (Figure 9 and Figure 10).
Larval density had a significant impact on the concentration of crude fat, crude protein, P, Mg, K, as well as on the concentration of Fe, Zn, Cu, Al, and B (Figure 9 and Figure 10). The LD treatments had higher crude protein and S concentration but lower crude fat, P, Mg, K, in addition to lower heavy metal concentrations such as Fe, Zn, Cu, Al, Co and B. Additionally, the scale factor had a significant impact on crude fat, crude protein, S, Zn, Cu, and Mo. Crude protein concentration was significantly higher in the S scale treatment in comparison to M and XL, while only a trend was observed between S and L. Crude fat was significantly lower in the S treatment in comparison to all other scale treatments, while the concentration of the S and Mo element was the highest in the S treatment. In the case of Zn, the XL treatment had the lowest concentration. Cu only differed between L and XL but not the other treatments. Interaction between factors was found in crude fat and in Fe and Zn concentrations. The factors did not have any significant impact on the concentration of Ca, Mn, and Na.
The free amino acids (FAA) phosphoserine (PPS), taurine, phosphoethanolamine (TAU), aspartic acid (ASP), threonine (THR), serine (SER), asparagine (ASN), glutamic acid (GLU), glutamine (GLN), a-aminobutyric acid (AAA), proline (PRO), glycine (GLY), alanine (ALA), citrulline (CIT), cystine (CYS2), cystathionin (CYSTHA), methionine (MET), isoleucine (ILE), leucine (LEU), tyrosine (TYR), phenylalanine (PHE), homocysteine (HCY2), b-aminoisobutyric acid (BAIB), gamma -aminobutyric acid (GABA), histidine (HIS), 1-methyl-histidine (1MHIS), tryptophan (TRP), anserine (ANS), hydroxylysine (HLY), ornithine (ORN), lysine (LYS), and arginine (ARG) were analyzed, and the results are shown in Table 3. TAU, AAA, and HCY2 were below the detection level in most of the samples and were, therefore, excluded. The concentrations of all free amino acids were higher in the larvae than in the start feed except for CYSTHA and LYS, which were detected in a lower concentration in the larvae, and ASN and BAIB, which had higher or lower concentrations based on the treatment (Table 3). The larvae that grew in the high density (HD) treatments had higher concentrations of PPS, ALA, ANS and CIT (ANOVA, p < 0.05). Additionally, among the HD treatments, the bigger boxes (XL) had significantly lower concentrations of PPS (ANOVA, p < 0.05), leading to a significant difference between the XL and the S scales. All other free amino acids did not significantly differ between the treatment.

4. Discussion

Scaling-up of production units is a fundamental challenge for the industrialization of bioprocesses [41], and even in well-established biotechnological processes, most of the optimization or development would start with small-scale investigations that could be later scaled up [42]. This empirical approach allows the test of a high number of variables at low costs and provides better statistical power while keeping the door open for further optimization when the outcomes differ in big-scale production. Nevertheless, achieving efficiency in upscaling and in small-scale testing requires a fundamental understanding of the parameters that vary between scales.
With the industrialization and expansion of BSF production, many authors have questioned the scalability of small-scale results and whether different outcomes are to be expected when growing the BSFL in bigger batches [19,33,34,43]. For example, Miranda et al. [33] have spotted considerable differences in parameters, including prepupal weight and mortality, between their experiment (with 10,000 larvae feeding on 7 kg of manure per box) and other studies that had smaller scale and fairly similar conditions. The authors stressed the need for bigger scale experiments.
This investigation, therefore, aimed to provide insights into the differences in BSFL production-relevant parameters between scales, in addition to testing two different densities. Density is a factor that has, to the best of our knowledge, only been investigated on a small-scale. For example, Dzepe et al. [44] have compared the growth between different densities that ranged from 1 to 10 larvae /cm2 in small containers (Ø 11.30 × 5.53 cm) and showed that the weight of single larvae would increase at the lowest density due to higher availability of nutrients, and the development is faster at higher densities. Additionally, another small-scale experiment was done by Barragan-Fonseca et al. [29] and tested the influence of larvae densities (50, 100, 200, or 400 larvae in 15.5 × 10.5 cm containers) and observed nutrient limitations at high densities. Another study by Paz et al. [26] compared two densities and concluded that a density higher than 5 larvae/cm2 might not be optimal for larval growth, also due to competition over nutrients.
In the presented experiment, two densities were tested. The high density (HD) treatment had 50% more larvae than the low-density treatment (LD), and the tested scales were bigger than in the previous studies. The results show, as in the previous studies, that at the lower density (LD), the individuals obtained more weight, which can also be explained by the higher availability of nutrients in the LD treatment. This study, however, did not aim to compare a wide range of densities, and it can still be assumed that at lower densities than LD, the growth speed of larvae might be hindered, as shown by Dzepe et al. [44], due to the low conditioning of the substrate and the lower temperatures.
The larvae in the big scales gained more weight than in the small scales by the time of harvest (Figure 1), which is consistent with Yang and Tomberlin [3], who have compared the growth of BSF between a small scale and an industrial scale. This was also accompanied by the increased temperature in the L and XL boxes compared to the S and M boxes. Temperature is known to have a big impact on the growth and development of insects [45], and several studies have investigated the impact of temperature on BSFL by subjecting small-scale rearing boxes to different ambient temperatures [22,23,46,47]. These studies identified what was described as optimal rearing temperatures, which are lower than the temperature at which BSFL gut enzymes possessed the highest activity [48,49]. The current study showed that, during larval growth, the temperature of the substrate rises higher than the ambient temperature to the extent that it is scale and density-dependent (Figure 5), making ambient temperature non-representative for the temperature at which the larvae are feeding. Gold et al. [50] have also pointed out that differences in substrate temperature between scales could be expected as the substrate in their study did not reach the temperature observed by Bloukounon-Goubalan et al. [51].
The results confirm that on a larger scale, BSFL production substrates will reach higher temperatures than on smaller scales when using the same feed and larval density (feed per larvae). This points out the need for substrate temperature measurements when identifying the optimal temperatures for larval growth and development, especially in bigger scale experiments [19]. The higher temperature in big scales could also explain the lower water content of the substrates in the XL boxes at the time of harvest (Figure 4), and it is accompanied by the enhanced larval growth (Figure 1). Bloukounon-Goubalan et al. [51] have found that microbiota-facilitated temperature increase also depends on the substrate composition. The temperature observed by Bloukounon-Goubalan et al. [51] was higher than in this study, most likely due to the difference in the ambient temperatures and the substrate used.
BSF larvae feed in groups that aggregate to achieve a more efficient consumption of feed [52,53]. In other dipteran larvae such as Lucilia sericata, it has been shown that aggregation leads to a shorter development time due to heat production [24]. This aspect of larval growth was intensively investigated in forensic entomology, where the relationship between development time and temperature is used to calculate the age of sampled insects and, thus, estimate the minimum post mortem interval (PMImin) [54]. In BSF production processes, understanding this relationship which was shown to differ among scales and densities, could help optimize the larval growth condition making the larvae production and/or waste processing more time and energy-efficient.
A relationship between population size and heat generation is already known in dipteran larvae [24]. The presented experiment showed that in high densities, the substrate reached higher temperature (Figure 5), but this, however, did not lead to faster growth but lower larval weight upon harvest, most likely due to the earlier depletion of nutrients in the feed (Figure 1). This could also explain the drop in temperatures at the last day of growth in HD treatments (Figure 5). These results lead to the rejection of the hypothesis that in the HD treatments, the larvae would grow faster. Nevertheless, it can still be expected that under different setups and at lower densities than the LD treatment, insufficient substrate conditioning could hinder larval growth [27,28].
In BSF production processes, it is important to achieve the highest larval survival possible in order to reduce the demand for eggs and to achieve more efficiency in production. Previous small-scale studies have shown that BSFL mortality could depend on the substrate [55,56], temperature [21,23,57], and high water content in the substrate [58]. The mortality of BSFL was assessed in this study and was compared between the different scales and densities, which, as shown above, also influenced substrate temperature. The observed mortality values are relatively low in comparison to other studies. For example, Myers et al. [59] have grown the larvae on pig manure and observed more than 20% mortality, and Nguyen et al. [60] have observed mortality values ranging from 20% to 50% based on the feed used, while Oonincx et al. [3] also observed much higher values. In this study, a different BSF strain and a high-quality feed were used, which could explain the lower mortality values observed. The mortality differed in this experiment between scales but not between densities (Figure 6) and was the highest in the LD treatment of the smallest scale (9.6%), which also reflects on the yield-per-larvae measurement (Figure 3). Similar results have been found by Yang and Tomberlin [43], who have observed higher mortality (up to 28.2% difference), higher individual larval weight, and lower FCR in larvae grown on a small scale in comparison to a bigger scale. In their study, only two scales were compared, and the larvae were feeding on kitchen wastes. The sub-optimal population size described by Yang and Tomberlin [43] could explain the higher mortality in the S boxes, which was also more pronounced in the LD treatment of the S scale (Figure 6). This could indicate that the effect of larval density on mortality is scale-dependent. However, such interaction could not be statistically tested due to the non-homogeneous variance in the mortality data obtained, but is, in addition to the interaction between mortality and temperature, a topic for future research.
The FCR values in the presented study (3.1 to 4.2) were expectably low in comparison to studies that used lower quality substrates, such as manure or organic wastes, for which FCR values could exceed 10 [61,62]. FCR differed between densities but not between scales in the current study, even though a trend of higher FCR values was observed in the smallest scale. This is with accordance to the lower conversion efficiency also observed by Yang and Tomberlin [43].
Padmanabha et al. [30] have used data from Barragan-Fonseca et al. [29] and Diener et al. [40] to fit a Monod type function for a dynamical growth model of BSFL. Combining the results of Padmanabha et al. [30] and this work, Figure 8 shows how this work’s data also relate to the data of Barragan-Fonseca et al. [29] and Diener et al. [40]. The overall quality of fit seems good (R² = 0.87). Data from continuous feeding provide information on low and middle feed availability, while batch feeding gives insight into high feed availability. For batch feeding, feed availability reduces over time as feed is consumed. However, the analysis of the final yield suggests that the larvae did not fully consume the feed before the end of the experiment, otherwise the differences between HD and LD would have been more pronounced. From the model-based perspective, it can be expected that lower larval density is associated with a higher growth rate. This relationship is also supported by the experimental data since HD shows a slightly smaller final mean weight and growth rate compared to LD.
According to Figure A1, the batch feeding regime used in this work results in growth rates that lay in the saturated part of the function. This was supported by the data presented in this study, where only slightly different larvae yield with a lower larval average weight in HD compared to LD was observed. In addition, it is also seen that the scale results in slightly different larvae yield despite the densities being constant. These variations could be a result of thermodynamic processes such as heat conduction, storage and dissipation, and also evaporation that changes the properties of the feed and the growth conditions in the substrate.
The results of the chemical analysis revealed that the two tested factors have a strong impact on the nutritional quality of the produced larvae and on the accumulation of heavy metals. Crude protein was affected by the scale and the density. Higher protein concentration in the LD treatments could be explained by the higher availability of feed protein in comparison to the HD treatment, which could also explain the higher crude protein in the S scale, which had higher mortality leading to higher feed availability for the individuals. An increase in crude protein concentration in lower densities of BSFL has also been reported by Barragan-Fonseca et al. [29].
In addition to proteins, larvae crude fat was influenced by density and scale, in addition to an interaction between the two factors. Crude fat was shown to increase at higher larval density, which also supports the findings of Barragan-Fonseca et al. [29] and Fischer et al. [63], where BSFL grown in lower densities in small-scale experiments had lower crude fat. Based on the results presented in this study, it can be assumed that the availability of carbohydrates and fats in the substrate may not play a major role in fat accumulation in the larvae. Fischer et al. [63] have suggested that a trade-off between crude protein and crude fat might have occurred in their experiment, which was also the case in other studies [19]. This phenomenon can also be observed in a bigger scale experiment done by Scala et al. [34] and the present study, as the fat content was the lowest in treatments with higher crude protein, and it seems to be negatively correlated with protein availability for the larvae, and not dependent on substrate carbohydrate or fat availability. This can also explain the low crude fat in the S scale and the interaction between factors, where mortality (density reduction) and crude protein were the highest.
Several studies have measured the mineral composition of BSFL, which plays a role in insect physiology and enhances the nutritional value of the final product. To the best of our knowledge, this study is the first to test the effects of density and rearing scale on the concentration of minerals in the larvae of H. illucens. The hypothesis was that the scale, which affected larval growth (Figure 1) and the dry content matter of substrates (Figure 4), could also influence the accumulation of elements in the larvae. Additionally, the rearing density, which also affects the availability of nutrients, could influence the accumulation.
The results show that Ca, S, Mg, K, Mn, Fe, and Zn accumulated in the larvae as they were at higher concentrations than in the start feed (Figure 9 and Figure 10). The results slightly deviate from those observed by Chia et al. [20]. Even though the values of P, Ca, K, S, Na, K, and Zn are comparable, Mg values were generally lower, while Cu and Fe were higher, which could be a result of the different feed used. A study by Shumo et al. [32] that used different common wastes as substrates has reported generally much lower values of P, K, Ca, higher values of Na, Cu, Mn, Co, Zn, and comparable values of Mg, Fe with significant differences in mineral concentrations based on the substrate use. A recent study by Bohm et al. [64] has shown an accumulation of Cu and Al in larvae fed on biosolids that exceeded the values presented in this study.
In this study, the concentration of P, Mg, K, Fe, Zn, Co, Cu, Al, B, and Mo were higher in the HD treatment, which could mean that the accumulation of these elements depends on the concentration in the feed upon the time of harvest. The feed volume was lower in the HD treatment (Figure 4), which could mean that these elements had higher concentrations. Another explanation could be that the accumulation of elements differs based on the size/development of the larvae, which was shown to also differ between the scales. This may explain the higher Mo and B concentrations in the smaller scale where the larvae were significantly smaller. Nevertheless, the factors that influence the accumulation of micro and macro elements in the larvae is a topic for future research due to their importance for the production of larvae with a higher nutritional value and enhanced safety [65]. The differences observed in this study point out the need for developing industrial larvae harvesting methods that enable the separation of larvae before fully consuming or drying the substrate. This could lead to lower substrate utilization if the substrate composition is sub-optimal but would allow better control over the accumulation of heavy metals in addition to shortening the production cycles. For the use of BSFL as feed, it would be beneficial to enrich the larvae with mineral nutrients such as Ca, P, Mg, S, Na, Cl and K to avoid any deficiency in the animals [66,67]. On the other hand, the accumulation of heavy metals has to be avoided and should be monitored when growing the larvae on waste streams [64]. Nevertheless, and in the case of heavy metal accumulation, it is possible to mix the produced BSFL-based products with other feed components to achieve the desired values in the final feed.
Insect hemolymph is known to have a much higher concentration of free amino acids (FAA) in comparison to other animals’ blood [68]. This can add a high nutritional value to insects as animal feed since, in comparison to protein-bound amino acids, FAA can be absorbed and assimilated faster by young fish [69] and other animals [70]. In this work, the concentrations of FAA were determined and compared between treatments (Table 3). Larvae grown at higher densities had higher concentrations of free phosphoserine (PPS), alanine (ALA), citrulline (CIT) and anserine (ANS), which could be linked to the earlier depletion of diet proteins and the breakdown of larvae protein. Even though the larvae in the presented experiment did not reach a starvation (weight-loss) phase (Figure 1), the larvae of the HD treatments had lower weights and lower protein concentration (Figure 9), which could support this assumption. The essential amino acids (isoleucine, leucine, lysin, methionine, phenylalanine, threonine, tryptophan, and valine) did not vary between the different rearing conditions. However, they are comparable to other animal sources and above the amino acid levels of plants [71]. The increased levels of PPS, ALA, and CIT could be attributed to the high density, which could lead to less oxygen and stress for the insects. The amino acid ALA is known to be an indicator of temperature and oxygen stress [72].

5. Conclusions, Limitations, and Future Remarks

This study aimed to describe the differences in rearing BSFL in four different scales and in two densities. It was confirmed that big scale boxes allow faster larval growth and are less affected by ambient temperatures, and the two densities differed similarly throughout the scales in production-related parameters. The ability of the substrate to generate and maintain high temperatures in the big scales could explain the improved larval growth, but could also lead to overheating when ambient temperatures are also high. This should be taken into consideration in the design of BSFL production lines, where more ventilation should be applied to bigger rearing trays to avoid excessive heating and substrate drought before full consumption.
In this study, all boxes were harvested at day 8 in order to compare larval mortality without the influence of different rearing periods. In this case, the larvae of the LD treatments were most likely not able to fully consume the substrate, and FCR was calculated accordingly. Allowing the larvae to reach their maximum growth may provide further insight into the availability of feed in the different scales, which could differ also based on temperature when substrates are dried before being fully consumed.
Despite the significant role BSF technology can play in waste management and industrial symbiosis, the presented study used a high-value substrate to test the hypotheses while ensuring sufficient nutrition and avoiding potential antinutrients, contaminants, and/or high fiber content expected in a wide range of wastes. The effects of scale and density presented here can be expected when using other substrates that ensure larval growth. However, differences can be expected in how pronounced these effects are.
Another important aspect that was not in focus here is the relative humidity (RT) of the air. Air RT could also influence the water content of the substrate over time. At low RT, high ventilation rate, low larval density, and high substrate temperature, drying could take place before full consumption of the substrate (in batch feeding scenarios at least), leading to high feed conversion ratio (FCR) values and a less efficient process. Due to the interaction of a long list of factors influencing the BSF production process, it is not possible, from this point of view, to make a statement on the optimal conditions for rearing BSF, as none of these parameters can be taken out of the context. Describing and understanding complicated interactions between these involved parameters and their influences on the output of BSF production processes is a topic for future research and should involve more modelling in addition to the basic experimental biology.

Author Contributions

Conceptualization, W.Y., C.U.; Data curation, W.Y., S.S. (Simon Schulz); Formal analysis, W.Y., S.S. (Simon Schulz), M.P.; Funding acquisition, C.U.; Investigation, W.Y., C.U.; Methodology, W.Y., S.S. (Simon Schulz), V.M., I.M., A.-J.H., S.S. (Stefan Streif); Project administration, C.U.; Resources, C.U.; Supervision, W.Y., C.U.; Validation, W.Y., S.S. (Simon Schulz); Visualization, W.Y., M.P., A.K.; Writing—original draft, W.Y., S.S. (Simon Schulz), V.M., I.M., A.-J.H.; Writing—review & editing, W.Y., M.P., A.-J.H., A.K., S.S. (Stefan Streif), C.U. All authors have read and agreed to the published version of the manuscript.

Funding

This research was funded by the German Ministry for Education and Research (BMBF) in the frame of the CUBES project, grant number 031B0733A. The article processing charge was funded by the Deutsche Forschungsgemeinschaft (DFG, German Research Foundation)—491192747 and the Open Access Publication Fund of Humboldt-Universität zu Berlin.

Institutional Review Board Statement

Not applicable.

Informed Consent Statement

Not applicable.

Data Availability Statement

The data presented in this study are available on request from the corresponding author.

Conflicts of Interest

The authors declare no conflict of interest.

Appendix A

Figure A1. Growth rate vs feed density response using Monod model. The growth rate of the larvae in response to the feed density, feed nutrient quality, and growth conditions can be represented using the two parameters rmax and kX. Adjusting kX allows the change in growth rate in response to feed density, and rmax sets the maximum growth rate the larvae can reach feed density saturation. For any given feed, the nutrient density is fixed and, therefore, can result in a specific rmax for each feed type. This results in saturation of growth rates at lower maximum rates even at higher feed density. For a given feed type, when the other growth factors such as temperature etc., change, the growth rate moves along the respective lines as indicated by the arrows.
Sustainability 14 01772 g0a1

References

  1. Van Huis, A.; Dicke, M.; van Loon, J.J.A. Insects to feed the world. J. Insects Food Feed 2015, 1, 3–5. [Google Scholar] [CrossRef]
  2. Van Huis, A. Potential of insects as food and feed in assuring food security. Annu. Rev. Entomol. 2013, 58, 563–583. [Google Scholar] [CrossRef] [PubMed]
  3. Oonincx, D.G.; Van Broekhoven, S.; Van Huis, A.; van Loon, J.J. Feed conversion, survival and development, and composition of four insect species on diets composed of food by-products. PLoS ONE 2015, 10, e0144601. [Google Scholar] [CrossRef] [PubMed] [Green Version]
  4. Yi, L.; Lakemond, C.M.; Sagis, L.M.; Eisner-Schadler, V.; van Huis, A.; van Boekel, M.A. Extraction and characterisation of protein fractions from five insect species. Food Chem 2013, 141, 3341–3348. [Google Scholar] [CrossRef]
  5. Nguyen, T.T.; Tomberlin, J.K.; Vanlaerhoven, S. Ability of black soldier fly (Diptera: Stratiomyidae) larvae to recycle food waste. Environ. Entomol. 2015, 44, 406–410. [Google Scholar] [CrossRef]
  6. Oonincx, D.; Van Huis, A.; Van Loon, J. Nutrient utilisation by black soldier flies fed with chicken, pig, or cow manure. J. Insects Food Feed 2015, 1, 131–139. [Google Scholar] [CrossRef]
  7. Van Huis, A.; Itterbeeck, J.V.; Klunder, H.; Mertens, E.; Halloran, A.; Muir, G.; Vantomme, P. Edible Insects: Future Prospects for Food and Feed Security; FAO Forestry Paper; FAO: Rome, Italy, 2013. [Google Scholar]
  8. Ermolaev, E.; Lalander, C.; Vinnerås, B. Greenhouse gas emissions from small-scale fly larvae composting with Hermetia illucens. Waste Manag. 2019, 96, 65–74. [Google Scholar] [CrossRef]
  9. Pang, W.; Hou, D.; Chen, J.; Nowar, E.E.; Li, Z.; Hu, R.; Tomberlin, J.K.; Yu, Z.; Li, Q.; Wang, S. Reducing greenhouse gas emissions and enhancing carbon and nitrogen conversion in food wastes by the black soldier fly. J. Environ. Manag. 2020, 260, 110066. [Google Scholar] [CrossRef]
  10. Li, S.; Ji, H.; Zhang, B.; Tian, J.; Zhou, J.; Yu, H. Influence of black soldier fly (Hermetia illucens) larvae oil on growth performance, body composition, tissue fatty acid composition and lipid deposition in juvenile Jian carp (Cyprinus carpio var. Jian). Aquaculture 2016, 465, 43–52. [Google Scholar] [CrossRef]
  11. Li, Q.; Zheng, L.; Cai, H.; Garza, E.; Yu, Z.; Zhou, S. From organic waste to biodiesel: Black soldier fly, Hermetia illucens, makes it feasible. Fuel 2011, 90, 1545–1548. [Google Scholar] [CrossRef]
  12. Choi, S.; Hassanzadeh, N. BSFL Frass: A Novel Biofertilizer for Improving Plant Health While Minimizing Environmental Impact. Candian Sci. Fair J. 2019, 2, 41–46. [Google Scholar]
  13. Beesigamukama, D.; Mochoge, B.; Korir, N.K.; Fiaboe, K.K.; Nakimbugwe, D.; Khamis, F.M.; Subramanian, S.; Dubois, T.; Musyoka, M.W.; Ekesi, S. Exploring black soldier fly frass as novel fertilizer for improved growth, yield, and nitrogen use efficiency of maize under field conditions. Front. Plant Sci. 2020, 11, 1447. [Google Scholar] [CrossRef] [PubMed]
  14. Phl, C.P.V.; Walraven, M.; Bézagu, M.; Lefranc, M.; Ray, C. Industrial Symbiosis in Insect Production—A Sustainable Eco-Efficient and Circular Business Model. Sustainability 2020, 12, 10333. [Google Scholar]
  15. Walter, A.; Klammsteiner, T.; Gassner, M.; Heussler, C.D.; Kapelari, S.; Schermer, M.; Insam, H. Black Soldier Fly School Workshops as Means to Promote Circular Economy and Environmental Awareness. Sustainability 2020, 12, 9574. [Google Scholar] [CrossRef]
  16. Torgerson, K.; Meijering, J.; Sok, J.; Dicke, M.; Lansink, A.O. Towards circular agriculture–exploring insect waste streams as a crop and soil health promoter. J. Insects Food Feed 2021, 7, 357–368. [Google Scholar] [CrossRef]
  17. Ortiz, J.C.; Ruiz, A.T.; Morales-Ramos, J.; Thomas, M.; Rojas, M.; Tomberlin, J.; Yi, L.; Han, R.; Giroud, L.; Jullien, R. Insect mass production technologies. In Insects as Sustainable Food Ingredients; Elsevier: Amsterdam, The Netherlands, 2016; pp. 153–201. [Google Scholar]
  18. Nijhout, H. The control of body size in insects. Dev. Biol. 2003, 261, 1–9. [Google Scholar] [CrossRef] [Green Version]
  19. Meneguz, M.; Schiavone, A.; Gai, F.; Dama, A.; Lussiana, C.; Renna, M.; Gasco, L. Effect of rearing substrate on growth performance, waste reduction efficiency and chemical composition of black soldier fly (Hermetia illucens) larvae. J. Sci. Food Agric. 2018, 98, 5776–5784. [Google Scholar] [CrossRef]
  20. Chia, S.Y.; Tanga, C.M.; Osuga, I.M.; Cheseto, X.; Ekesi, S.; Dicke, M.; van Loon, J.J. Nutritional composition of black soldier fly larvae feeding on agro-industrial by-products. Entomol. Exp. Appl. 2020, 168, 472–481. [Google Scholar] [CrossRef]
  21. Tomberlin, J.K.; Adler, P.H.; Myers, H.M. Development of the black soldier fly (Diptera: Stratiomyidae) in relation to temperature. Environ. Entomol. 2009, 38, 930–934. [Google Scholar] [CrossRef]
  22. Harnden, L.M.; Tomberlin, J.K. Effects of temperature and diet on black soldier fly, Hermetia illucens (L.)(Diptera: Stratiomyidae), development. Forensic Sci. Int. 2016, 266, 109–116. [Google Scholar] [CrossRef]
  23. Chia, S.Y.; Tanga, C.M.; Khamis, F.M.; Mohamed, S.A.; Salifu, D.; Sevgan, S.; Fiaboe, K.K.; Niassy, S.; van Loon, J.J.; Dicke, M. Threshold temperatures and thermal requirements of black soldier fly Hermetia illucens: Implications for mass production. PLoS ONE 2018, 13, e0206097. [Google Scholar] [CrossRef] [Green Version]
  24. Charabidze, D.; Bourel, B.; Gosset, D. Larval-mass effect: Characterisation of heat emission by necrophageous blowflies (Diptera: Calliphoridae) larval aggregates. Forensic Sci. Int. 2011, 211, 61–66. [Google Scholar] [CrossRef] [PubMed]
  25. Slone, D.; Gruner, S.V. Thermoregulation in larval aggregations of carrion-feeding blow flies (Diptera: Calliphoridae). J. Med. Entomol. 2007, 44, 516–523. [Google Scholar] [CrossRef]
  26. Paz, A.S.P.; Carrejo, N.S.; Rodríguez, C.H.G. Effects of larval density and feeding rates on the bioconversion of vegetable waste using black soldier fly larvae Hermetia illucens (L.),(Diptera: Stratiomyidae). Waste Biomass Valorization 2015, 6, 1059–1065. [Google Scholar]
  27. Bryant, E.H.; Sokal, R.R. The fate of immature housefly populations at low and high densities. Popul. Ecol. 1967, 9, 19–44. [Google Scholar] [CrossRef]
  28. Zhao, Y.; Wang, W.; Zhu, F.; Wang, X.; Wang, X.; Lei, C. The gut microbiota in larvae of the housefly Musca domestica and their horizontal transfer through feeding. AMB Express 2017, 7, 147. [Google Scholar] [CrossRef] [Green Version]
  29. Barragan-Fonseca, K.B.; Dicke, M.; van Loon, J.J. Influence of larval density and dietary nutrient concentration on performance, body protein, and fat contents of black soldier fly larvae (Hermetia illucens). Entomol. Exp. Appl. 2018, 166, 761–770. [Google Scholar] [CrossRef] [Green Version]
  30. Padmanabha, M.; Kobelski, A.; Hempel, A.J.; Streif, S. A comprehensive dynamic growth and development model of Hermetia illucens larvae. PLoS ONE 2020, 15, e0239084. [Google Scholar] [CrossRef]
  31. Liland, N.S.; Biancarosa, I.; Araujo, P.; Biemans, D.; Bruckner, C.G.; Waagbø, R.; Torstensen, B.E.; Lock, E.-J. Modulation of nutrient composition of black soldier fly (Hermetia illucens) larvae by feeding seaweed-enriched media. PLoS ONE 2017, 12, e0183188. [Google Scholar] [CrossRef]
  32. Shumo, M.; Osuga, I.M.; Khamis, F.M.; Tanga, C.M.; Fiaboe, K.K.; Subramanian, S.; Ekesi, S.; van Huis, A.; Borgemeister, C. The nutritive value of black soldier fly larvae reared on common organic waste streams in Kenya. Sci. Rep. 2019, 9, 1–13. [Google Scholar] [CrossRef]
  33. Miranda, C.D.; Cammack, J.A.; Tomberlin, J.K. Mass production of the black soldier fly, Hermetia illucens (L.),(Diptera: Stratiomyidae) reared on three manure types. Animals 2020, 10, 1243. [Google Scholar] [CrossRef]
  34. Scala, A.; Cammack, J.A.; Salvia, R.; Scieuzo, C.; Franco, A.; Bufo, S.A.; Tomberlin, J.K.; Falabella, P. Rearing substrate impacts growth and macronutrient composition of Hermetia illucens (L.)(Diptera: Stratiomyidae) larvae produced at an industrial scale. Sci. Rep. 2020, 10, 1–8. [Google Scholar] [CrossRef]
  35. Sørensen, J.G.; Addison, M.F.; Terblanche, J.S. Mass-rearing of insects for pest management: Challenges, synergies and advances from evolutionary physiology. J. Crop Prot. 2012, 38, 87–94. [Google Scholar] [CrossRef]
  36. Sheppard, D.C.; Tomberlin, J.K.; Joyce, J.A.; Kiser, B.C.; Sumner, S.M. Rearing methods for the black soldier fly (Diptera: Stratiomyidae). J. Med. Entomol. 2002, 39, 695–698. [Google Scholar] [CrossRef] [Green Version]
  37. Janssen, R.H.; Vincken, J.-P.; van den Broek, L.A.; Fogliano, V.; Lakemond, C.M. Nitrogen-to-protein conversion factors for three edible insects: Tenebrio molitor, Alphitobius diaperinus, and Hermetia illucens. J. Agric. Food Chem. 2017, 65, 2275–2278. [Google Scholar] [CrossRef]
  38. Shek, D.T.; Ma, C. Longitudinal data analyses using linear mixed models in SPSS: Concepts, procedures and illustrations. Sci. World J. 2011, 11, 42–76. [Google Scholar] [CrossRef] [Green Version]
  39. Monod, J. The growth of bacterial cultures. Annu. Rev. Microbiol. 1949, 3, 371–394. [Google Scholar] [CrossRef] [Green Version]
  40. Diener, S.; Zurbrügg, C.; Tockner, K. Conversion of organic material by black soldier fly larvae: Establishing optimal feeding rates. Waste Manag. Res. 2009, 27, 603–610. [Google Scholar] [CrossRef]
  41. Kossen, N.W.F. Scale-up in Biotechnology. In Recent Advances in Biotechnology; Vardar-Sukan, F., Sukan, Ş.S., Eds.; Springer: Dordrecht, The Netherlands, 1992; pp. 147–182. [Google Scholar]
  42. Formenti, L.R.; Nørregaard, A.; Bolic, A.; Hernandez, D.Q.; Hagemann, T.; Heins, A.L.; Larsson, H.; Mears, L.; Mauricio-Iglesias, M.; Krühne, U. Challenges in industrial fermentation technology research. Biotechnol. J. 2014, 9, 727–738. [Google Scholar] [CrossRef]
  43. Yang, F.; Tomberlin, J.K. Comparing Selected Life-History Traits of Black Soldier Fly (Diptera: Stratiomyidae) Larvae Produced in Industrial and Bench-Top-Sized Containers. J. Insect Sci. 2020, 20, 25. [Google Scholar] [CrossRef]
  44. Dzepe, D.; Nana, P.; Fotso, A.; Tchuinkam, T.; Djouaka, R. Influence of larval density, substrate moisture content and feedstock ratio on life history traits of black soldier fly larvae. J. Insects Food Feed. 2020, 6, 133–140. [Google Scholar] [CrossRef]
  45. Ratte, H.T. Temperature and Insect Development. In Environmental Physiology and Biochemistry of Insects; Hoffmann, K.H., Ed.; Springer: Berlin/Heidelberg, Germany, 1985; pp. 33–66. [Google Scholar]
  46. Shumo, M.; Khamis, F.M.; Tanga, C.M.; Fiaboe, K.K.; Subramanian, S.; Ekesi, S.; Van Huis, A.; Borgemeister, C. Influence of temperature on selected life-history traits of black soldier fly (Hermetia illucens) reared on two common urban organic waste streams in Kenya. Animals 2019, 9, 79. [Google Scholar] [CrossRef] [Green Version]
  47. Gligorescu, A.; Toft, S.; Hauggaard-Nielsen, H.; Axelsen, J.A.; Nielsen, S.A. Development, metabolism and nutrient composition of black soldier fly larvae (Hermetia illucens; Diptera: Stratiomyidae) in relation to temperature and diet. J. Insects Food Feed. 2018, 4, 123–133. [Google Scholar] [CrossRef]
  48. Bonelli, M.; Bruno, D.; Caccia, S.; Sgambetterra, G.; Cappellozza, S.; Jucker, C.; Tettamanti, G.; Casartelli, M. Structural and functional characterization of Hermetia illucens larval midgut. Front. Physiol. 2019, 10, 204. [Google Scholar] [CrossRef] [PubMed]
  49. Kim, W.; Bae, S.; Park, K.; Lee, S.; Choi, Y.; Han, S.; Koh, Y. Biochemical characterization of digestive enzymes in the black soldier fly, Hermetia illucens (Diptera: Stratiomyidae). J. Asia Pac. Entomol. 2011, 14, 11–14. [Google Scholar] [CrossRef]
  50. Gold, M.; Von Allmen, F.; Zurbrügg, C.; Zhang, J.; Mathys, A. Identification of bacteria in two food waste black soldier fly larvae rearing residues. Front. Microbiol. 2020, 11, 2897. [Google Scholar] [CrossRef] [PubMed]
  51. Bloukounon-Goubalan, A.; Saïdou, A.; Chrysostome, C.; Kenis, M.; Amadji, G.; Igué, A.; Mensah, G. Physical and chemical properties of the agro-processing by-products decomposed by larvae of Musca domestica and Hermetia illucens. Waste Biomass Valoriz. 2020, 11, 2735–2743. [Google Scholar] [CrossRef]
  52. Shishkov, O.; Hu, M.; Johnson, C.; Hu, D.L. Black soldier fly larvae feed by forming a fountain around food. J. R. Soc. Interface 2019, 16, 20180735. [Google Scholar] [CrossRef] [PubMed]
  53. Shishkov, O.; Hu, D.L. Synchronizing pile formation of black soldier fly larvae. Eur. Phys. J. Spec. Top. 2020, 229, 2779–2789. [Google Scholar] [CrossRef]
  54. Zhang, Y.; Wang, Y.; Sun, J.; Hu, G.; Wang, M.; Amendt, J.; Wang, J. Temperature-dependent development of the blow fly Chrysomya pinguis and its significance in estimating postmortem interval. R. Soc. Open Sci. 2019, 6, 190003. [Google Scholar] [CrossRef] [Green Version]
  55. Villazana, J.; Alyokhin, A. Development of black soldier fly larvae (Diptera: Stratiomyidae) on seafood wastes. J. Insects Food Feed. 2019, 5, 313–319. [Google Scholar] [CrossRef]
  56. Cammack, J.A.; Tomberlin, J.K. The impact of diet protein and carbohydrate on select life-history traits of the black soldier fly Hermetia illucens (L.)(Diptera: Stratiomyidae). Insects 2017, 8, 56. [Google Scholar] [CrossRef] [PubMed] [Green Version]
  57. Villazana, J.; Alyokhin, A. Tolerance of immature black soldier flies (Diptera: Stratiomyidae) to cold temperatures above and below freezing point. J. Econ. Entomol. 2019, 112, 2632–2637. [Google Scholar] [CrossRef]
  58. Lalander, C.; Ermolaev, E.; Wiklicky, V.; Vinnerås, B. Process efficiency and ventilation requirement in black soldier fly larvae composting of substrates with high water content. Sci. Total Environ. 2020, 729, 138968. [Google Scholar] [CrossRef]
  59. Myers, H.M.; Tomberlin, J.K.; Lambert, B.D.; Kattes, D. Development of black soldier fly (Diptera: Stratiomyidae) larvae fed dairy manure. Environ. Entomol. 2014, 37, 11–15. [Google Scholar] [CrossRef]
  60. Nguyen, T.T.; Tomberlin, J.K.; Vanlaerhoven, S. Influence of resources on Hermetia illucens (Diptera: Stratiomyidae) larval development. J. Med. Entomol 2013, 50, 898–906. [Google Scholar] [CrossRef] [PubMed] [Green Version]
  61. Diener, S.; Solano, N.M.S.; Gutiérrez, F.R.; Zurbrügg, C.; Tockner, K. Biological treatment of municipal organic waste using black soldier fly larvae. Waste Biomass Valoriz. 2011, 2, 357–363. [Google Scholar] [CrossRef] [Green Version]
  62. Sheppard, D.C.; Newton, G.L.; Thompson, S.A.; Savage, S. A value added manure management system using the black soldier fly. Bioresour. Technol. 1994, 50, 275–279. [Google Scholar] [CrossRef]
  63. Fischer, H.; Romano, N.; Sinha, A.K. Conversion of spent coffee and donuts by black soldier fly (Hermetia illucens) larvae into potential resources for animal and plant farming. Insects 2021, 12, 332. [Google Scholar] [CrossRef]
  64. Bohm, K.; Hatley, G.A.; Robinson, B.H.; Gutiérrez-Ginés, M.J. Black Soldier Fly-based bioconversion of biosolids creates high-value products with low heavy metal concentrations. Resour. Conserv. Recycl. 2022, 180, 106149. [Google Scholar] [CrossRef]
  65. Bessa, L.W.; Pieterse, E.; Marais, J.; Dhanani, K.; Hoffman, L.C. Food Safety of Consuming Black Soldier Fly (Hermetia illucens) Larvae: Microbial, Heavy Metal and Cross-Reactive Allergen Risks. Foods 2021, 10, 1934. [Google Scholar] [CrossRef] [PubMed]
  66. Pinotti, L.; Manoni, M.; Ferrari, L.; Tretola, M.; Cazzola, R.; Givens, I. The Contribution of Dietary Magnesium in Farm Animals and Human Nutrition. Nutrients 2021, 13, 509. [Google Scholar] [CrossRef] [PubMed]
  67. Delezie, E.; Bierman, K.; Nollet, L.; Maertens, L. Impacts of calcium and phosphorus concentration, their ratio, and phytase supplementation level on growth performance, foot pad lesions, and hock burn of broiler chickens. J. Appl. Poult. Res. 2015, 24, 115–126. [Google Scholar] [CrossRef]
  68. Pratt, J.J., Jr. A qualitative analysis of the free amino acids in insect blood. Ann. Entomol. Soc. Am. 1950, 43, 573–580. [Google Scholar] [CrossRef]
  69. Rønnestad, I.; Conceição, L.E.; Aragão, C.; Dinis, M.T. Free amino acids are absorbed faster and assimilated more efficiently than protein in postlarval Senegal sole (Solea senegalensis). J. Nutr. 2000, 130, 2809–2812. [Google Scholar] [CrossRef] [Green Version]
  70. Rérat, A.A. Nutritional supply of proteins and absorption of their hydrolysis products: Consequences on metabolism. Proc. Nutr. Soc. 1993, 52, 335–344. [Google Scholar] [CrossRef] [PubMed] [Green Version]
  71. Ravindran, V.; Hew, L.; Ravindran, G.; Bryden, W. Apparent ileal digestibility of amino acids in dietary ingredients for broiler chickens. Anim. Sci. 2005, 81, 85–97. [Google Scholar] [CrossRef]
  72. León-Quinto, T.; Serna, A. Cryoprotective Response as Part of the Adaptive Strategy of the Red Palm Weevil, Rhynchophorus ferrugineus, against Low Temperatures. Insects 2022, 13, 134. [Google Scholar] [CrossRef]
Figure 1. The growth of black soldier fly (BSF) larvae in different densities and scales. One-week-old larvae with an initial weight of 3 mg were grown in high density (HD) or low density (LD) (b) and in 4 different scales (Box sizes: XL, L, M, and S) (a). The individual larval fresh weight was measured over time, and the daily mean is shown in the graphs with the standard deviations. A linear mixed model (p < 0.05) revealed that the growth of larvae is influenced by both the scale and the rearing density (a,b). Significant differences are represented by different letters beside the legends. Two-ways ANOVA followed by Tukey’s test (n= 4–5, p < 0.05) revealed a significant effect of both factors on the final individual larval fresh weight (c). Differences between the scale groups in the final individual larval fresh weight are represented by letters.
Sustainability 14 01772 g001
Figure 2. The total harvested yield. One-week-old larvae with an initial weight of 3 mg were grown in high density (HD) or low density (LD) and in 4 different scales (Box sizes: XL, L, M, and S). The larvae were harvested after 8 days, and total fresh (a) and dry (b) yields were measured. The yield means increase ratio (Mean HD/ Mean LD ∗ 100) between the different densities is shown above the columns.
Sustainability 14 01772 g002
Figure 3. The yield per larvae. One-week-old larvae with an initial weight of 3 mg were grown in high density (HD) or low density (LD) and in 4 different scales (Box sizes: XL, L, M, and S). The larvae were harvested, and the total biomass obtained was divided by the initial number of larvae added to the boxes. Kruskal–Wallis Test (n = 4–5, p < 0.05) revealed a significant effect of the scale on both the fresh (a) and dry (b) yield per larvae where the S scale had the lowest value. No influence of larval density was observed.
Sustainability 14 01772 g003
Figure 4. The dry weight (a) and dry matter content of rest substrate (b). One-week-old larvae with an initial weight of 3 mg were grown in high density (HD) or low density (LD) and in 4 different scales (Box sizes: XL, L, M, and S). The larvae were harvested after 8 days, and the total rest substrates were quantified and dried to calculate the dry matter content. Kruskal–Wallis Test (n = 4–5, p < 0.05) revealed a significant influence of the scale and density on the rest substrate amount (a). A two-ways ANOVA followed by Tukey’s test (n= 4–5, p < 0.05) revealed a significant effect of both factors on the dry matter content (b). Significant differences between the different scales are indicated by different letters above the columns.
Sustainability 14 01772 g004
Figure 5. The development of temperature during larval growth. One-week-old larvae were grown in high density (HD) or low density (LD) and in 4 different scales (Box sizes: XL, L, M, and S). The temperature was measured on days 2, 3, 4, 5, 7 and 8. Daily temperature is shown in the graph for each factor with standard deviations. A two-way repeated-measures ANOVA (p < 0.05, n = 3) with Huynh-Feldt correction revealed that temperature development is significantly influenced by the size of the box (b) but not by density (a) with an interaction between time and the tested factors was observed.
Sustainability 14 01772 g005
Figure 6. The mortality of larvae. One-week-old larvae were grown in high density (HD) or low density (LD) and in 4 different scales (Box sizes: XL, L, M, and S). The larvae were harvested after 8 days, and the total amount of larvae per box was estimated to calculate the mortality. Kruskal-Wallis Test (n = 4–5, p < 0.05) revealed a significant influence of box size on mortality. Significantly different groups are represented by different letters.
Sustainability 14 01772 g006
Figure 7. Feed conversion ratio (FCR). One-week-old larvae were grown in high density (HD) or low density (LD), and in 4 different scales (Box sizes: XL, L, M, and S). The larvae were harvested after 8 days, and the feed conversion ratio (FCR) was calculated. Kruskal–Wallis Test (n = 4−5, p < 0.05) revealed that only larvae density had a significant effect on the feed conversion ratio.
Sustainability 14 01772 g007
Figure 8. Data from Barragan-Fonseca et al. [29] (D2, D3, D4), and Diener et al. [40] (2009) (D1) and this work (HD and LD) was used to fit the model of equation (2) (Model fit). The Y−axis shows the final yield per larvae normalized by the maximum recorded yield per larvae and growth time per feed treatment. Model parameters are rmax = 2.09 and kX = 64.5, with R2 = 0.87. Blue, red, yellow and purple data are XL, L, M and S box sizes respectively.
Sustainability 14 01772 g008
Figure 9. Macronutrients and elements concentration in black soldier fly (BSF) larvae grown in different densities and scales. One-week-old larvae were grown in high density (HD) or low density (LD) and in 4 different scales (Box sizes: XL, L, M, and S). The larvae were harvested, lyophilized, grounded, and the concentrations of crude fat, crude protein, phosphorus (P), sulfur (S), calcium (Ca), magnesium (Mg), potassium (K) and sodium (Na) were measured. Shown are the means and standard deviations of the measured concentrations (Based on dry matter), and the line indicates the concentration in the start feed. Two-ways ANOVA followed by Tukey’s test (n = 3, p < 0.05) revealed a significant effect of larvae density on crude fat, crude protein, S, Mg, and K, and a significant effect of the scale on crude fat, crude protein, and S. An interaction between the factors was observed in the crude fat and crude protein. Kruskal–Wallis Test (n = 3, p < 0.05) revealed a significant effect of density on P concentration.
Sustainability 14 01772 g009
Figure 10. Micronutrients and heavy metals concentration in black soldier fly (BSF) larvae grown in different densities and scales. One-week-old larvae were grown in high density (HD) or in low density (LD) and in 4 different scales (Box sizes: XL, L, M, and S). The larvae were harvested, lyophilized, grounded, and the concentrations of iron (Fe), zinc (Zn), manganese (Mn), cobalt (Co), copper (Cu), aluminum (Al), boron (B), and molybdenum (Mo) were measured. Shown are the means and standard deviations. Two-way ANOVA followed by Tukey’s test (n = 3, p < 0.05) revealed a significant effect of larvae density on the concentration of Fe, Zn, Cu, Al, and B. The factor scale had a significant impact on Zn, Cu, and Mo. Kruskal–Wallis Test (n = 3, p < 0.05) revealed a significant effect of density on Co concentration. An interaction between factors was observed in the concentration of Fe and Zn. Differences between the scale groups are indicated by the different letters.
Sustainability 14 01772 g010
Table 1. The description of the treatments tested in the present study.
ScaleBox Area [cm2]LPB (HD)LPB (LD)FPB [g]
Box XL206013,000866610,000
Box L963.60607840514677
Box M465.80293919582260
Box S193.721222814940
LPB: Larvae per box where HD is the high-density treatment and LD is the low-density treatment (Factor 2).
Table 2. The chemical composition of the feeding substrate (on dry matter basis).
Protein[%]17.41
Fat[%]3.79
Fibers[%]26.06
Potassium [g/kg]13.68
Magnesium[g/kg]3.96
Manganese[mg/kg]155.56
Molybdenum[mg/kg]1.58
Sodium[g/kg]1.61
Phosphorus[g/kg]11.88
Aluminum[mg/kg]333.4
Boron[mg/kg]11.47
Calcium[g/kg]10.57
Cobalt[mg/kg]0.2
Copper[mg/kg]17.82
Iron[mg/kg]350.92
Sulfur[g/kg]2.89
Zinc[mg/kg]134.14
Table 3. The concentration (in nmol/mL) of free amino acids in the black soldier fly larvae reared at different scales and densities.
PPS *PEAASPTHRSERASNGLUGLNPROGLYALA *CIT *CYS2CYSTHAMETILELEUTYRPHEBAIBGABAHIS1MHISTRPANS *HLYORNLYSARG
XLHDMean343430,51566757911504512,03624,23338,97129,85621,38039,31871185092122318786440839586763402473010,51114,20518,912417627,39455,903,79713,92011,2054069
SD1364781202208171712676825974627851210,42113466467748334152339013251726367365984895427,398,66119542288223
LDMean349829,463957210,468644712,93119,72742,99135,82822,27237,53749513936165834796414900287573721936515,90714,40617,295450325,21346,419,41715,19913,8803956
SD967966159233061127795510,052757012,12686067383296322601328154954828243919296192948744275220482393523,589,743514417391283
LHDMean391636,259887294976536926918,27238,91029,43618,39250,22610,1814595109823195681788310,5304506412511,27217,73918,372472023,15657,144,04314,44712,2233320
SD23620676671145196124501643661448731698826036627561032571521160811861663476185238775304602823917,178,05110851367907
LDMean359432,21674407493608011,10321,36142,88529,60629,13129,83870374752119217246195815592993375413310,31013,48119,636444316,19937,313,19113,89910,3263431
SD20567584012241360808982764482467184812195061472203328150027973332759152570146359313,26515,763,243127375836
MHDMean409930,89210,27785625261669524,15836,82025,14225,56645,5909752491210792424759010,20811,20843234293906316,22222,499530926,61473,804,29012,27710,0523969
SD10620201502731369148359933882208310,26511,84623021032227396134117283397828573292222917711304973,935,43810961633178
LDMean343229,12172415886708719,82520,28536,95728,48912,82633,16125741083724191660258155719334373514716014,48117,649385715,11674,447,000874212,8084220
SD211162461611124989618116,87360501838558423,723298641124701193276094378078024981493190610927,228,822301417302278
SHDMean433133,52910,3809533576010,46025,24941,34424,67622,65657,64911,425461810332346815910,54411,15342174082967618,42421,886493540,74475,551,85213,29511,0574192
SD2101199105318616917896074575038119706141101030925327532413109983374932543732146134864814,897,8856151772110
LDMean366931,453802286765298880618,75042,34731,94323,05039,8347102470099316316667880310,8273466520510,08515,62620,238507826,19638,380,85415,60912,2043823
SD268135477651622858717282989187011,04913,130126048117216624638012341731585318411226633308219,813,8671191389226
Start feed31121032468377415703146588768412,03827145839688292716281296113919237991159466946734027383467327,12112,108,562518914,74085
* The high density had significantly higher concentration than the lower density.
Publisher’s Note: MDPI stays neutral with regard to jurisdictional claims in published maps and institutional affiliations.

