Article

Experimental Study on Optimization of Cementation Solution for Wind-Erosion Resistance Using the MICP Method

1
Department of Civil Engineering, Indian Institute of Technology Indore, Indore 453441, India
2
Guangdong Engineering Center for Structure Safety and Health Monitoring, Shantou University, Shantou 515063, China
*
Authors to whom correspondence should be addressed.
Sustainability 2022, 14(3), 1770; https://doi.org/10.3390/su14031770
Submission received: 10 January 2022 / Revised: 27 January 2022 / Accepted: 29 January 2022 / Published: 3 February 2022
(This article belongs to the Section Sustainable Engineering and Science)

Abstract

:
In the present study, an environmentally friendly microbial-induced calcium carbonate precipitation (MICP) technique was explored to reinforce the desert sand using the stopped-flow pouring method. A detailed experimental study has been conducted with Sporosarcina (S.) pasteurii urease-producing bacteria with a 0.5 M cementation solution. To optimize the cementation solution, three different pore volumes (PV), i.e., 0.4, 0.6, and 0.8, were considered. The cementation solution was provided every 24 h and considered as one treatment cycle. The cylindrical specimen in three replicas was biotreated for 7, 14, and 21 days in 1:1 and 1:2 (diameter: height) ratios for determina-tion of split-tensile strength (STS) and unconfined compressive strength (UCS), respectively. Micro-structure characterization of untreated and biotreated sand was also examined using a scanning electron microscope (SEM) and energy-dispersive X-ray analysis (EDX). Rocklike behavior was ob-served for biotreated-sand samples using the UPV test. Test results for 21 days with 0.8 PV were 1340 kPa, 241 kPa, and 1762 m/s for UCS, STS, and UPV, respectively, with an average calcite content of 16.2%. Overall, the 0.5 M cementation solution with a 24 h treatment cycle, 0.8 PV with 7 days, and 0.4 PV with 14 days gave optimum treatment solution, and showed heavily cemented and rock-type behavior of the biotreated-sand sample.

1. Introduction

Wind erosion is a serious glitch in arid and semiarid areas. The movement of sand is one of the frequently occurring phenomena in the desert that further affects ecology. Around 38% of the world’s population is distressed by this disaster [1]. India has extensive, hot, and arid land of almost 32 million hectares. Rajasthan province shares a maximum of 62% of part of the desert in India [2]. The province of Rajasthan in India has supremacy in terms of desert areas and is the 20th -largest desert in the world. Desertification introduces biological reduction, health issues, loss of fertile fields, land erosion, elimination of community, dust storms, and many other complications that cannot be avoided [3]. Desertification is a serious, unavoidable issue and a major threat to the environment that drops economic stability and development in arid and semiarid areas [4].
In recent years, the MICP method has gained popularity for its potential to reinforce soil particles [5,6,7] in comparison with other ground-improvement practices, which use industrial waste, ashes, agricultural waste, and fibers [8,9,10,11,12]. It is one of the environmentally friendly methods for soil improvement [13]. In the MICP method, Sporosarcina pasteurii and Bacillus megaterium are the most-active urease-producing bacteria, which induce carbonate precipitation as a final product to reinforce soil properties [14,15,16],. The biotreated samples are called “biocement”, which is one of the effective and sustainable methods for soil improvement. Calcium carbonate precipitates are deposited in the pores between soil particles and fill the pore space, which is produced by biological processes [17,18,19]. The MICP method is evolving as an operative strength-enhancement method, not only for sand but also for clay, with different treatment methodologies due to low permeability in clay.
Due to heavy-wind flow, wind erosion occurs mainly in the desert region. To resist wind erosion, few experimental studies have been performed to interpret the behavior of biocementation of sand [20,21,22]. These studies focused mainly on surface strength, while attention towards the investigation of other engineering properties, such as unconfined compressive strength (UCS) and split-tensile strength (STS), were rarely studied.
In the present study, laboratory experiments were conducted to enhance the engineering properties of sand with different pore volumes (PVs) to optimize the quantity of cementation solution. Pore volume represents porosity. The MICP stopped-flow pouring method was used to treat the sand samples. To enhance the strength of sand, S. pasteurii bacteria with 0.5 M concentration of urea and calcium chloride dihydrate was used in different pore volumes, i.e., 0.4, 0.6, and 0.8 PV. The different treatment durations, i.e., 7, 14, and 21 days, were used to optimize treatment cost for field application. After the treatment of soil samples, UCS, STS, UPV, calcite content, and micro characterization tests were performed. The next section discusses sample collection and properties of sand followed by cultivation process of bacteria for cementation process. It also included different experimental test setups for carrying shear and tensile strengths on biotreated specimens. In Section 3 “Result and Discussion”, effect of different pore volume and treatment duration on test results have been discussed. Also percentage calcite content and micro characterization have been discussed.

2. Material and Methods

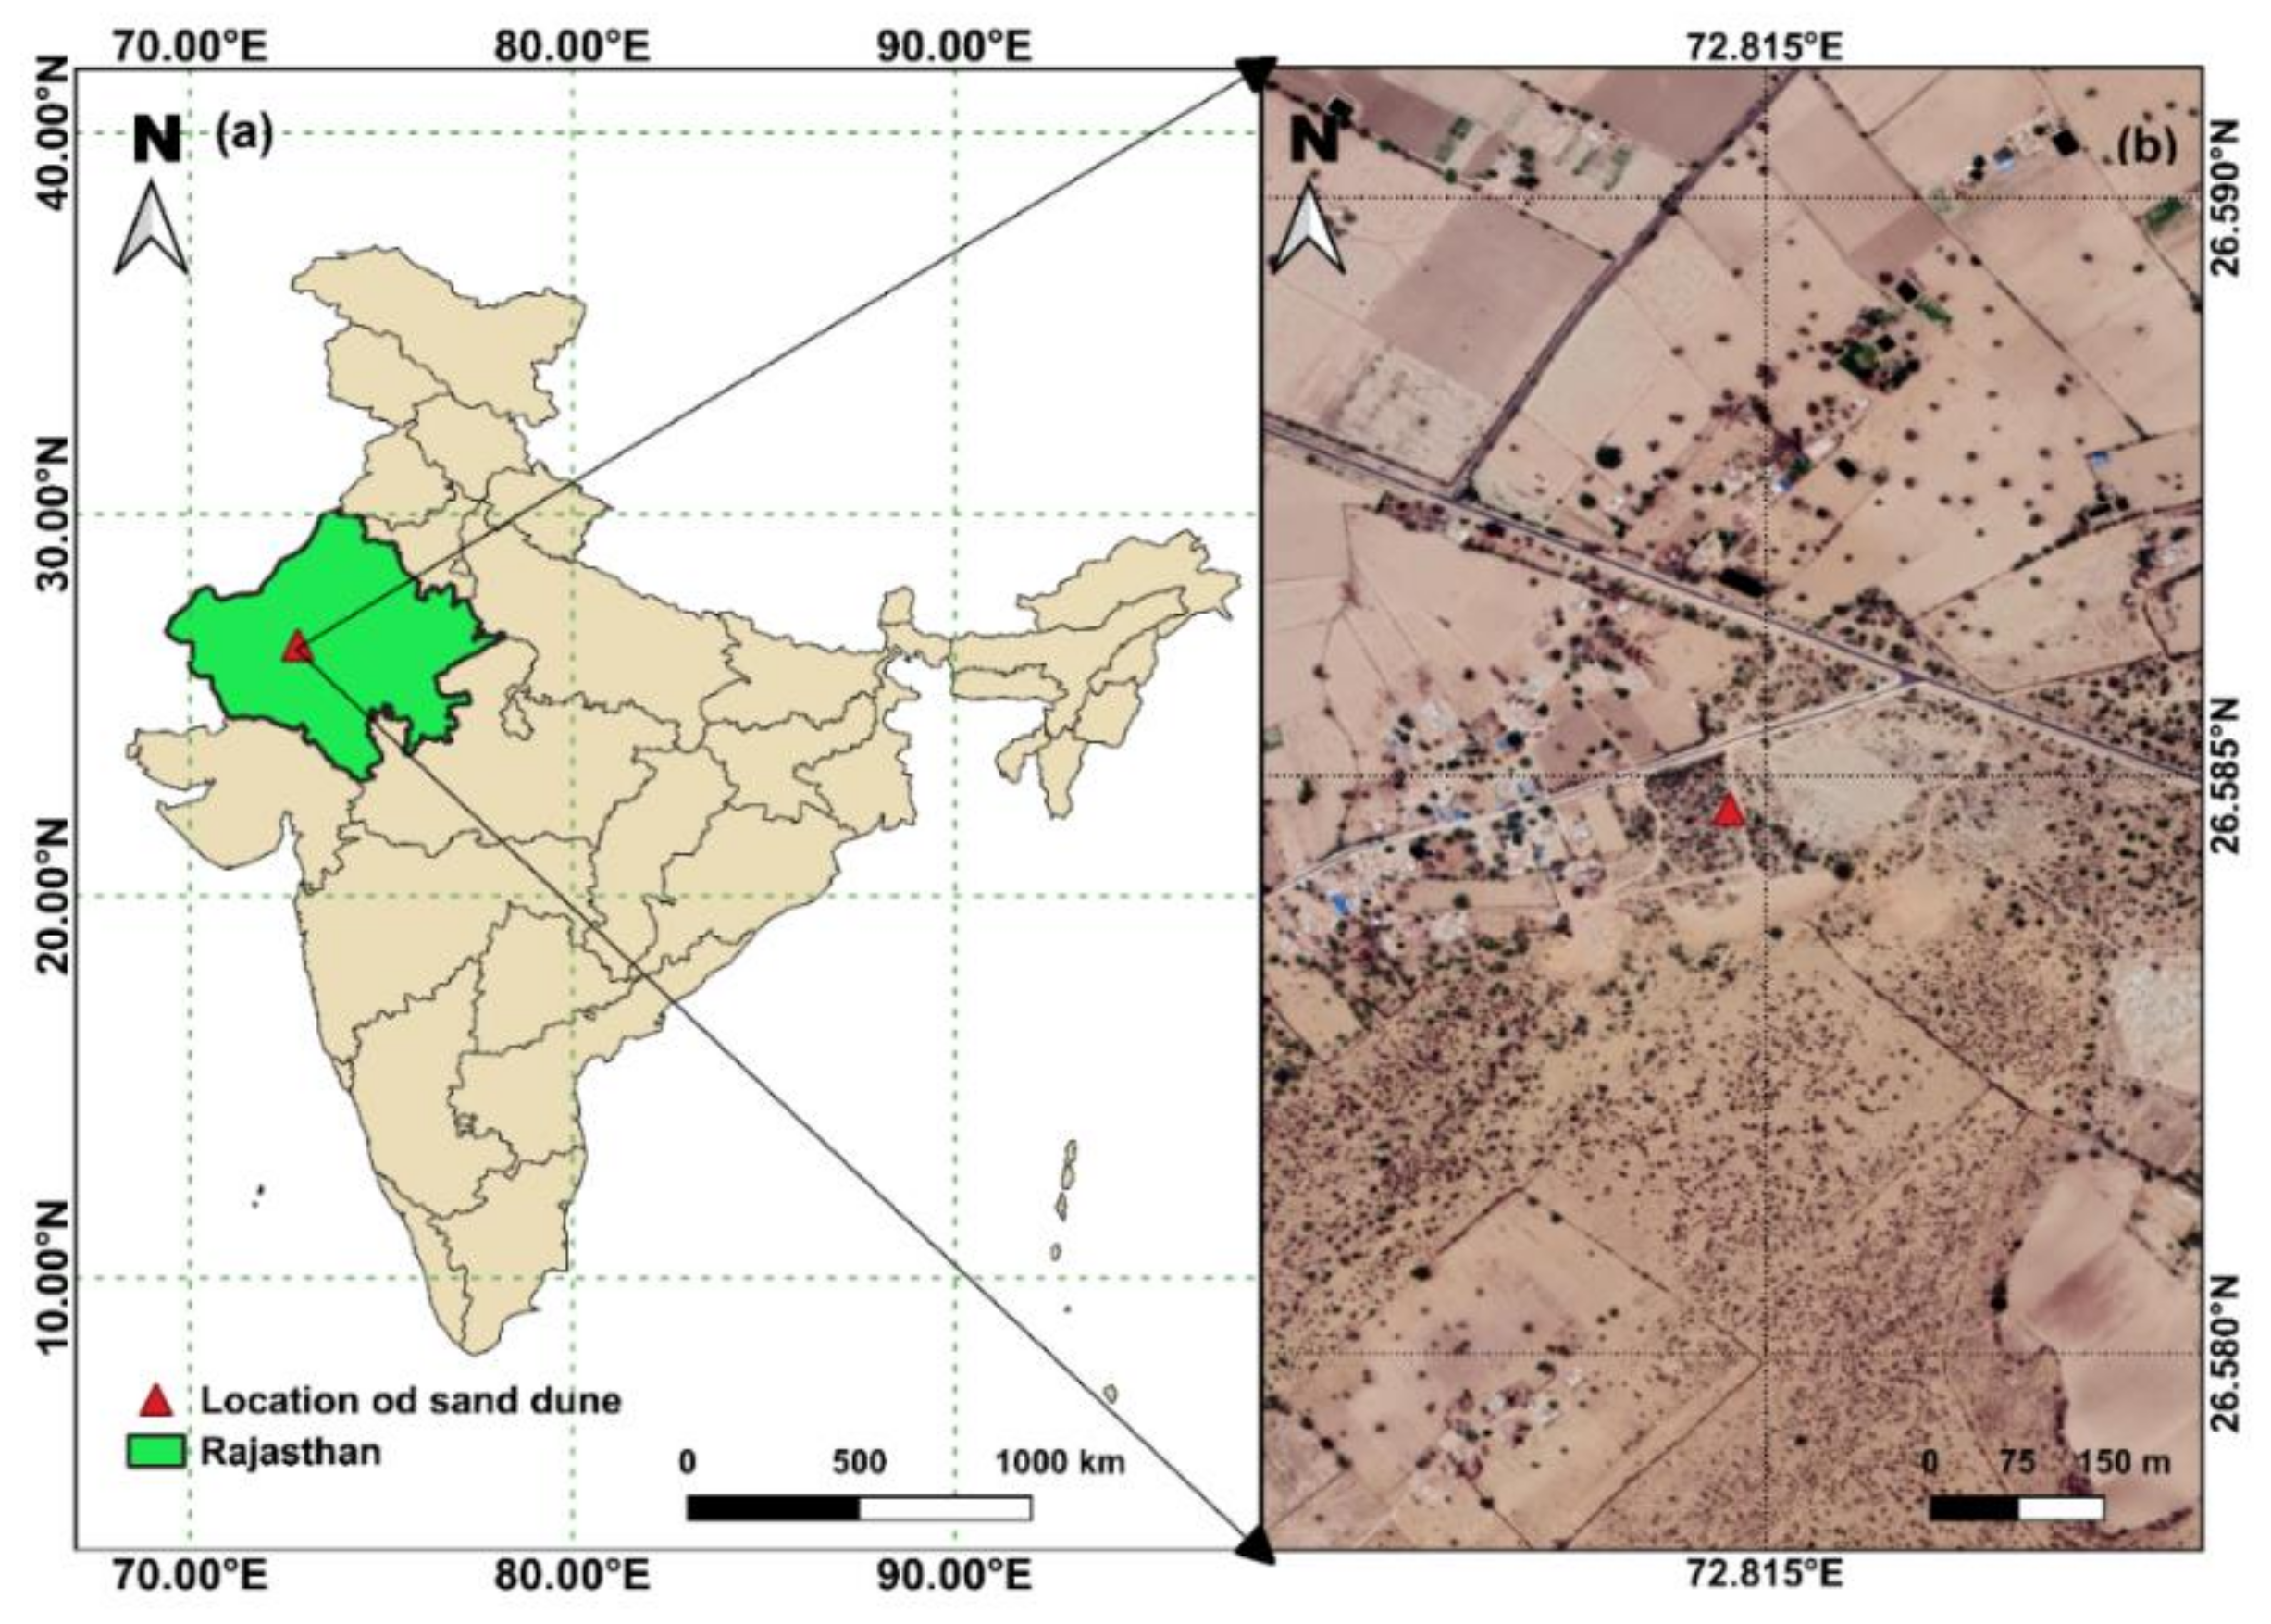
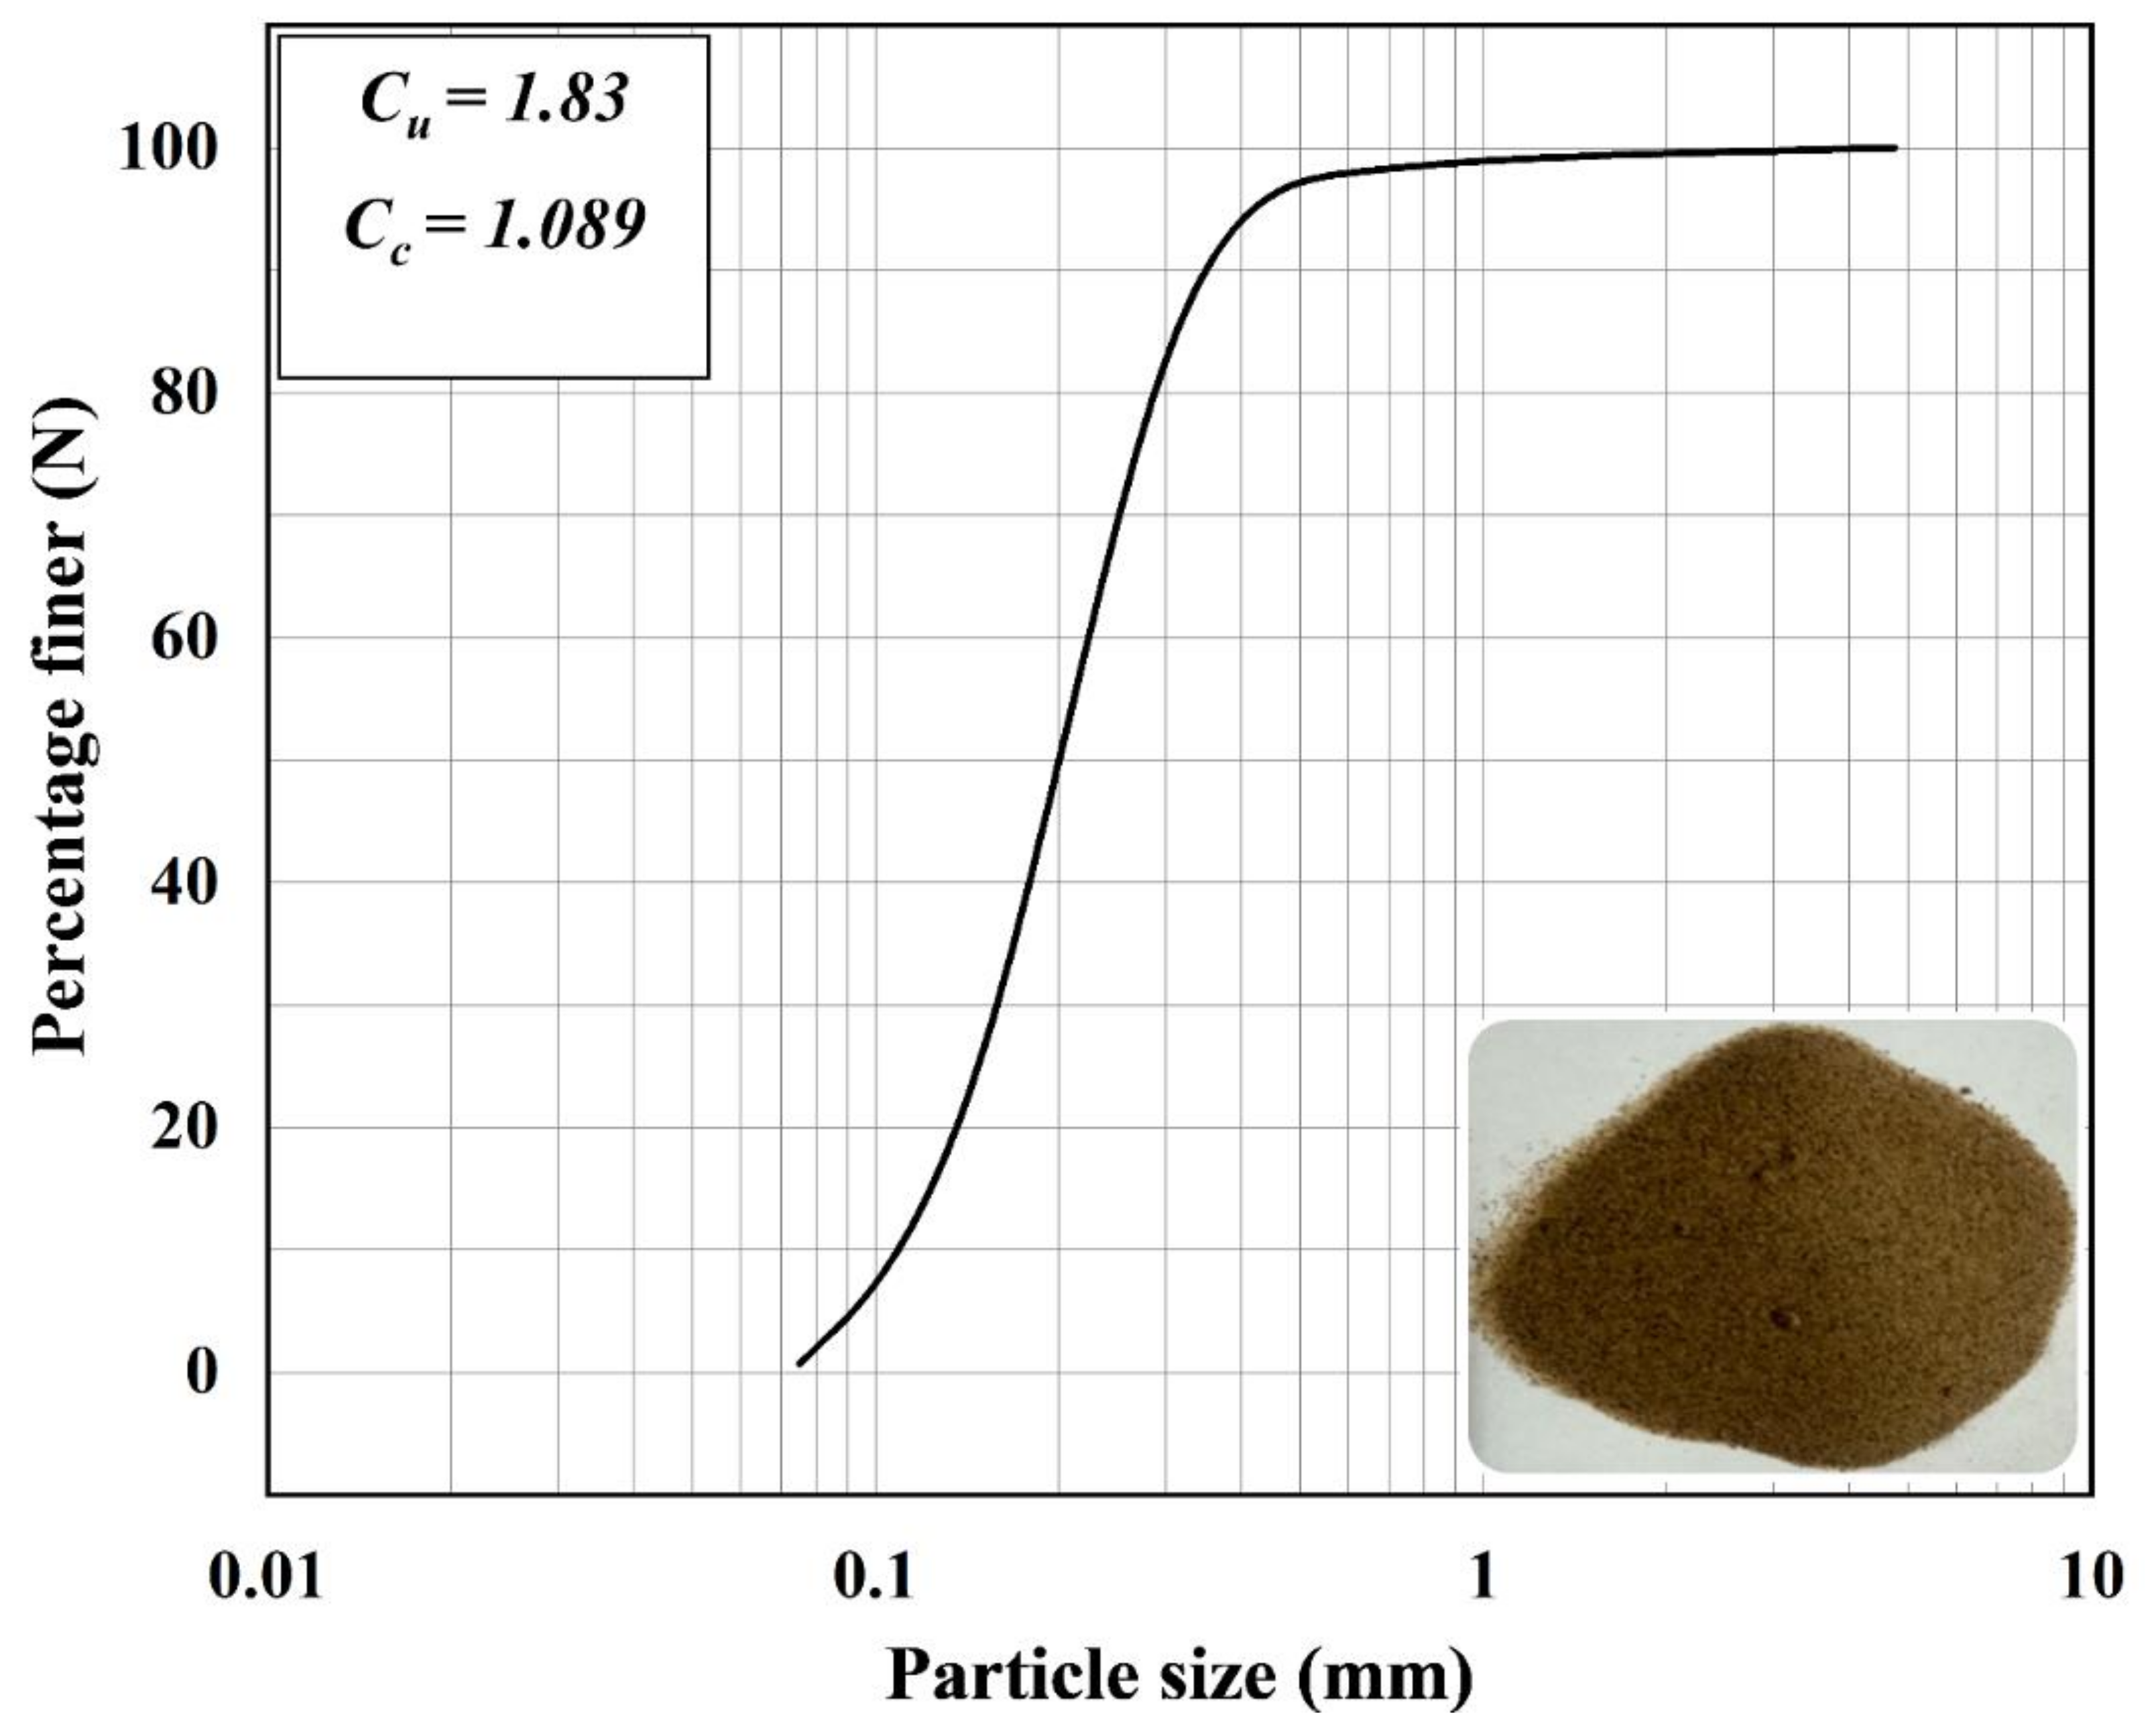
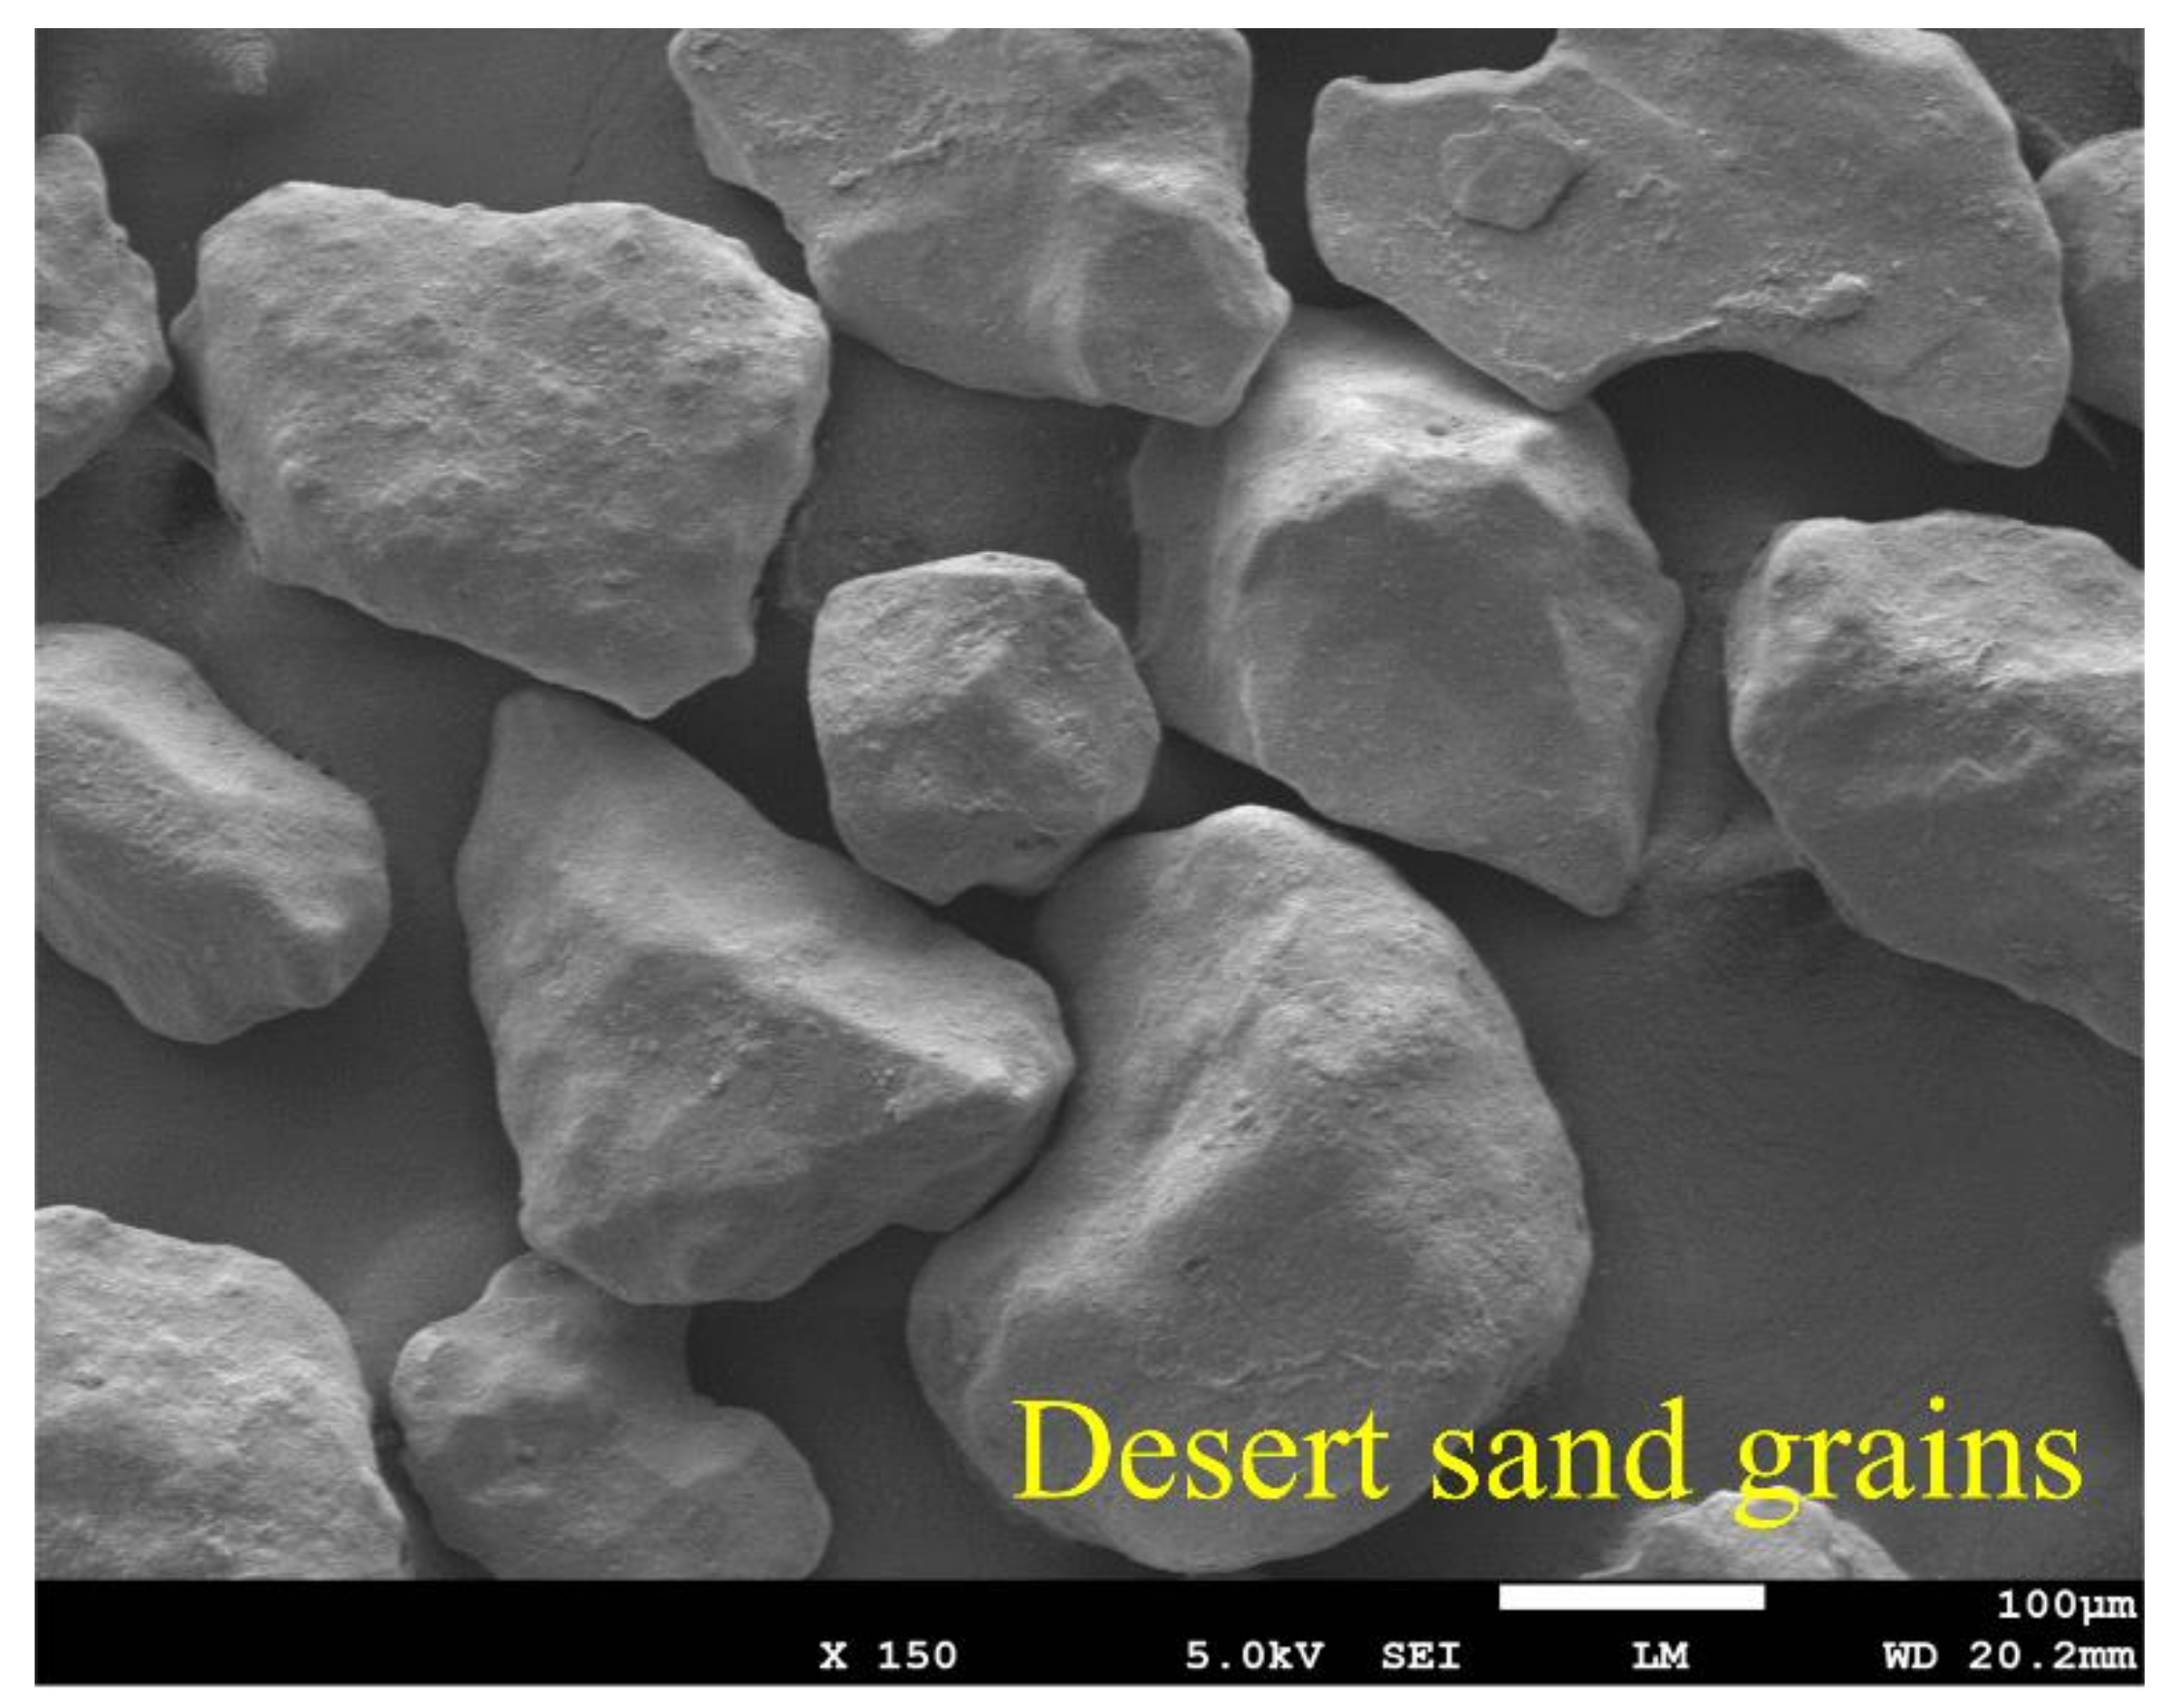
2.1. Sand Properties

The soil used in this study was collected from a sand dune located (Figure 1) near Jodhpur city in the Rajasthan province of India (26.584715° N and 72.814687° E). As per the Indian standard classification system (IS:1498–1970, IS:1498-1970 2002), the desert sand (as shown in Figure 2) can be classified as poorly graded sand. Table 1 summarizes the geotechnical properties of the collected desert sand. The coefficient of uniformity (Cu), coefficient of curvature (Cc), and mean grain size (D50) were deduced from the grading curve (Figure 2). Other properties, such as optimum moisture content (OMC), max dry density (MDD), specific gravity (G), silt content, max void ratio (emax), min void ratio (emin), and permeability, were also tabulated.

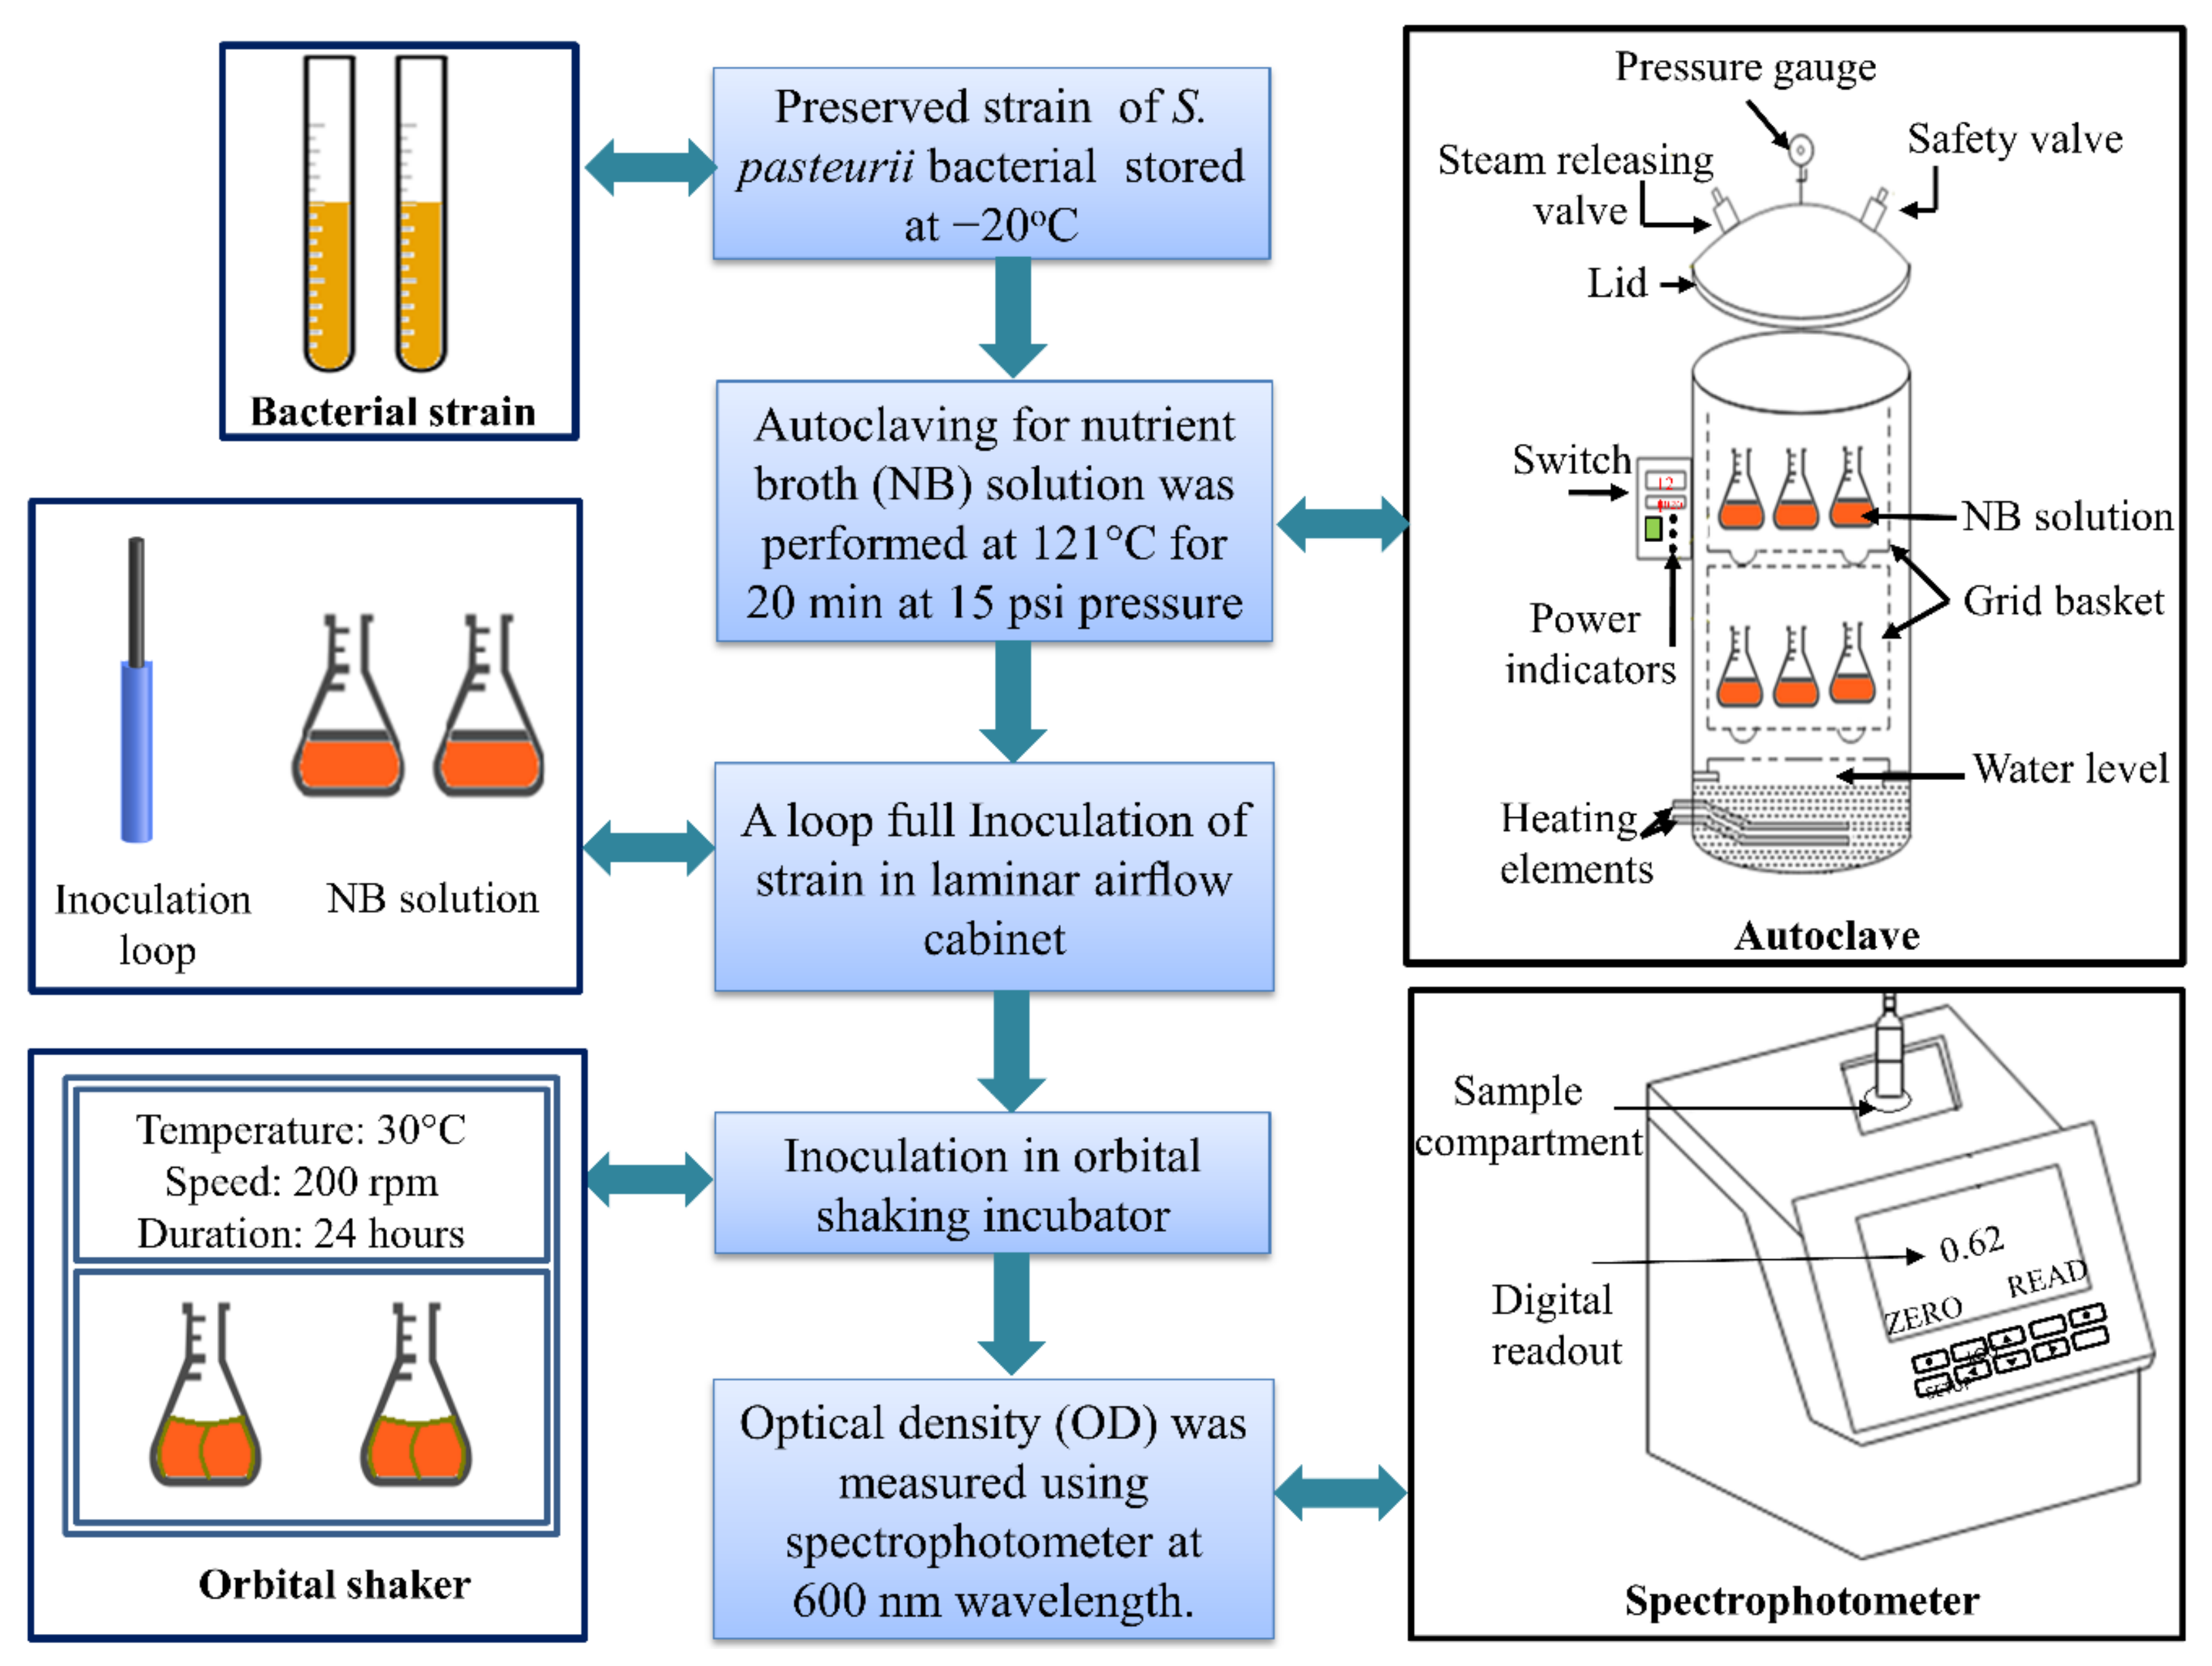
2.2. Cultivation of S. pasteurii Bacteria

S. pasteurii bacteria were stored at −20 °C. They were selected as urease-secreting microorganisms. Nutrient broth (NB) of 25 gm/L was used as a growth medium for S. pasteurii. The growth medium was autoclaved at 121 °C with 15 psi pressure for 20 min [7]. The autoclaved solution was cooled down to room temperature, and then inoculation of S. pasteurii was performed in a laminar-airflow cabinet. After inoculation, the growth medium was kept in an orbital shaker for 24 h at 30 °C temperature and 200 rpm rotating speed for initiating the growth of bacteria. To maintain aerobic condition in the orbital shaker, cotton plugs were used as a cap to cover the solution jar. The growth of bacteria, i.e., optical density (OD), was measured using a spectrophotometer at 600 nm wavelength. The measured OD value was 1.240 [7,23]. The detailed cultivation process is explained in Figure 3.

2.3. Cementation Media

The formation of calcite crystals in pore spaces of the soil samples depends on several factors, including the concentration of cementation media. It was found that the formation of calcite was higher and uniform under equimolar concentration (0.5 M) of urea and calcium chloride dihydrate. In the MICP process for bacterial growth, urea acts as a nitrogen source, and CaCl2 is a source of calcium. By maintaining the ratio of urea to calcium chloride dihydrate equal to one, by-product production can be reduced and calcium carbonate precipitation rate can be improved [24]. In the present study, 0.5 M of urea and calcium chloride dihydrate with ammonium chloride (10 gm/L), sodium bicarbonate (2.12 gm/L; buffer), and nutrient broth (3 gm/L) were used [23] in preparing cementation media.

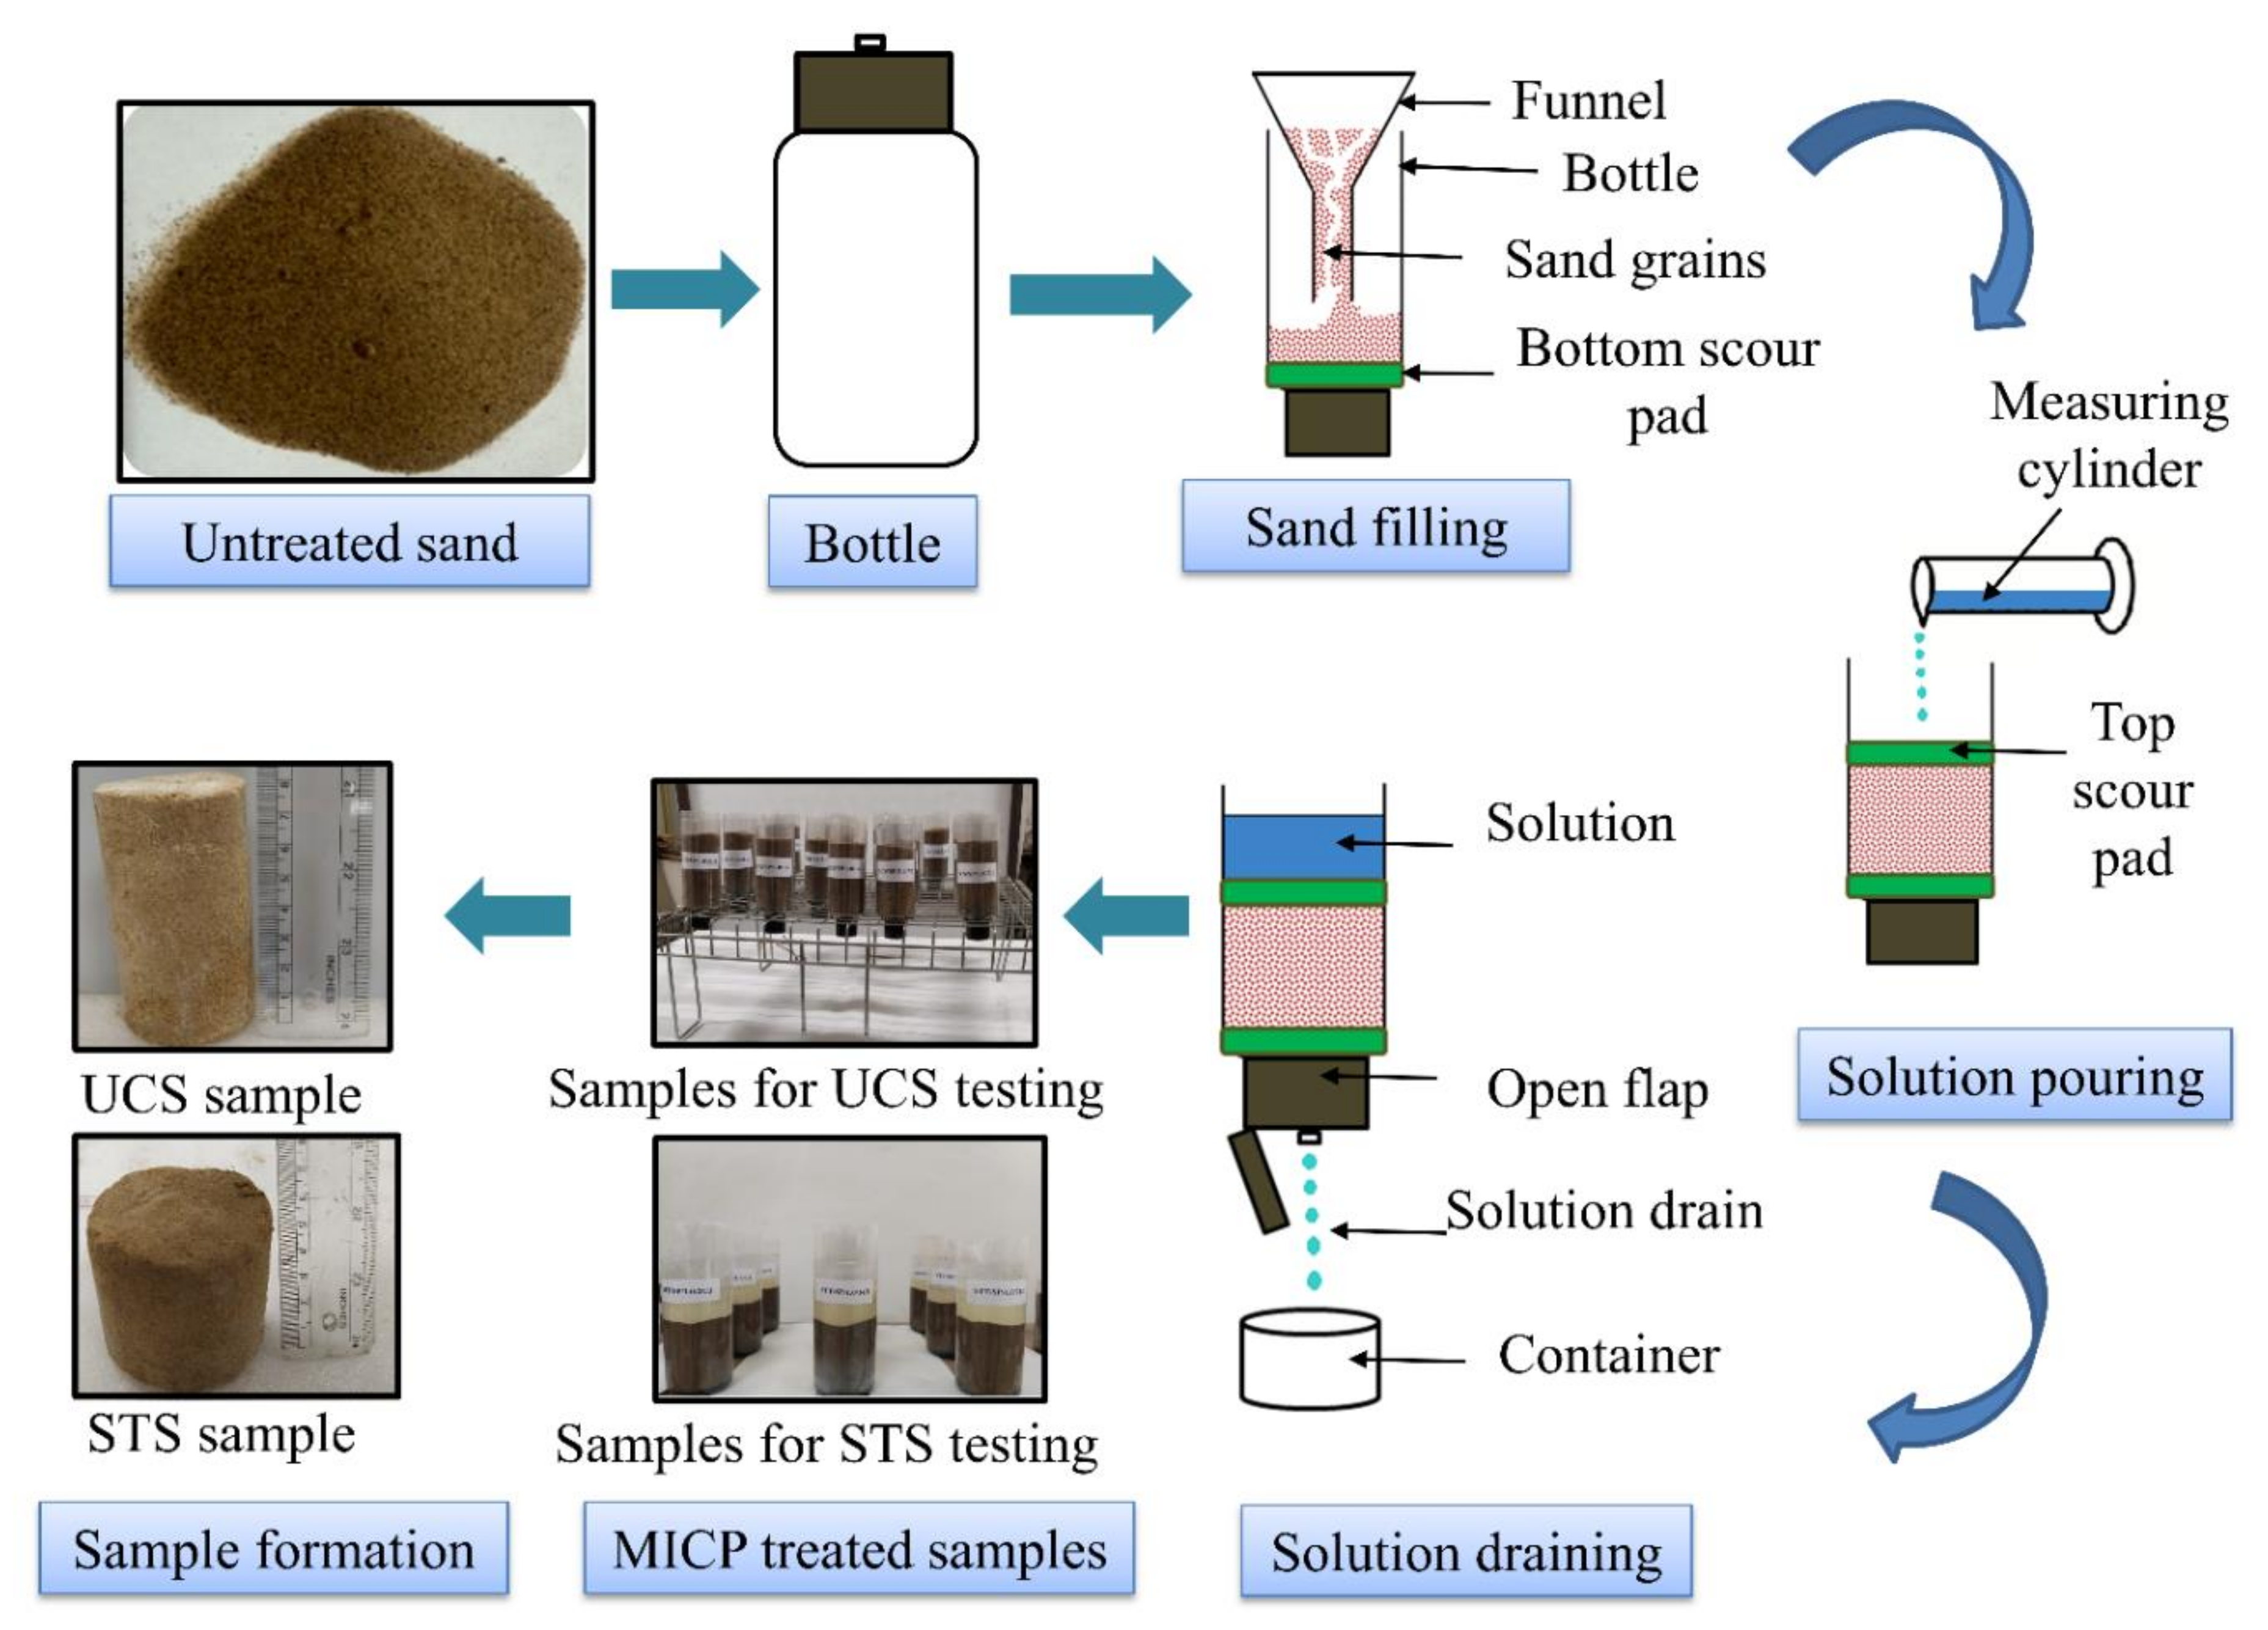
2.4. Sample Preparation for Biotreatment

To reinforce the untreated desert sand, biotreatment was performed using the MICP technique. Plastic bottles were used as molds for the preparation of cylindrical samples. Each plastic bottle consisted of PET plastic, and its flap lid consisted of polypropylene plastic. Each bottle was cut from the bottom and kept upside down to make an opening for sand filling, and a flap cap was used as a discharge nozzle. The inner diameters of the bottles used for the UCS and STS samples were 40 and 60 mm, respectively. The diameter for the STS sample was kept higher to understand the failure mechanism better, where a 1:1 aspect ratio was maintained. Before filling sand in each mold, a scouring pad was kept at the bottom that operated as a filter medium. Polyethylene was placed inside each mold so that the sample could be removed easily after treatment. To maintain the aspect ratios of 2:1 and 1:1, sand weighing 390 gm and 235 gm was filled in the molds for UCS and STS test samples, respectively. A relative density of 50% was maintained in the molds. After the filling of sand, a scouring pad was kept at top of each sample too. Samples were prepared with three replicas for different treatment combinations to carry out UCS and STS testing (as shown in Figure 4).

2.5. MICP-Treatment Procedure

Bacterial solution equal to 1 PV quantity was poured slowly into each cylindrical specimen for both UCS and STS testing and left for 16 h for bacterial attachment. Bacterial solution was not drained after attachment time, and cementation solution equal to 0.4, 0.6, and 0.8 PV was poured without calcium chloride dihydrate for urea hydrolysis to form carbonate ions for the simulation period. The simulation time for the reaction was 16 h. After the attachment and simulation periods, regular cementation solution, i.e., solution including calcium chloride dihydrate, was poured using the stopped-flow pouring method. The reaction between carbonate ions and calcium ions started, and precipitation of calcite crystals occurred. Sharma et al. (2021) [6] suggested that the stopped-flow pouring method was more effective for enhancing uniformity in calcite formation from top to bottom than the continuous-flow pouring method. After every 24 h, the cementation solution was drained out using a discharge nozzle (a bottle flap cap), and a freshly prepared cementation solution was provided after closing all flaps of the bottles. This process continued for 7, 14, and 21 days. After completion of the MICP treatment, samples were kept in the oven at 60 °C temperature for 6 h. This was done to ensure that the samples could be extracted from the molds without any damage. Molds were cut, and polyethylene was removed. Samples were kept in the oven again for 24 h at 105 °C for complete drying. Oven-dried samples were smoothened at the top and bottom to ensure that uniform loading could be applied during UCS, STS, and UPV testing.

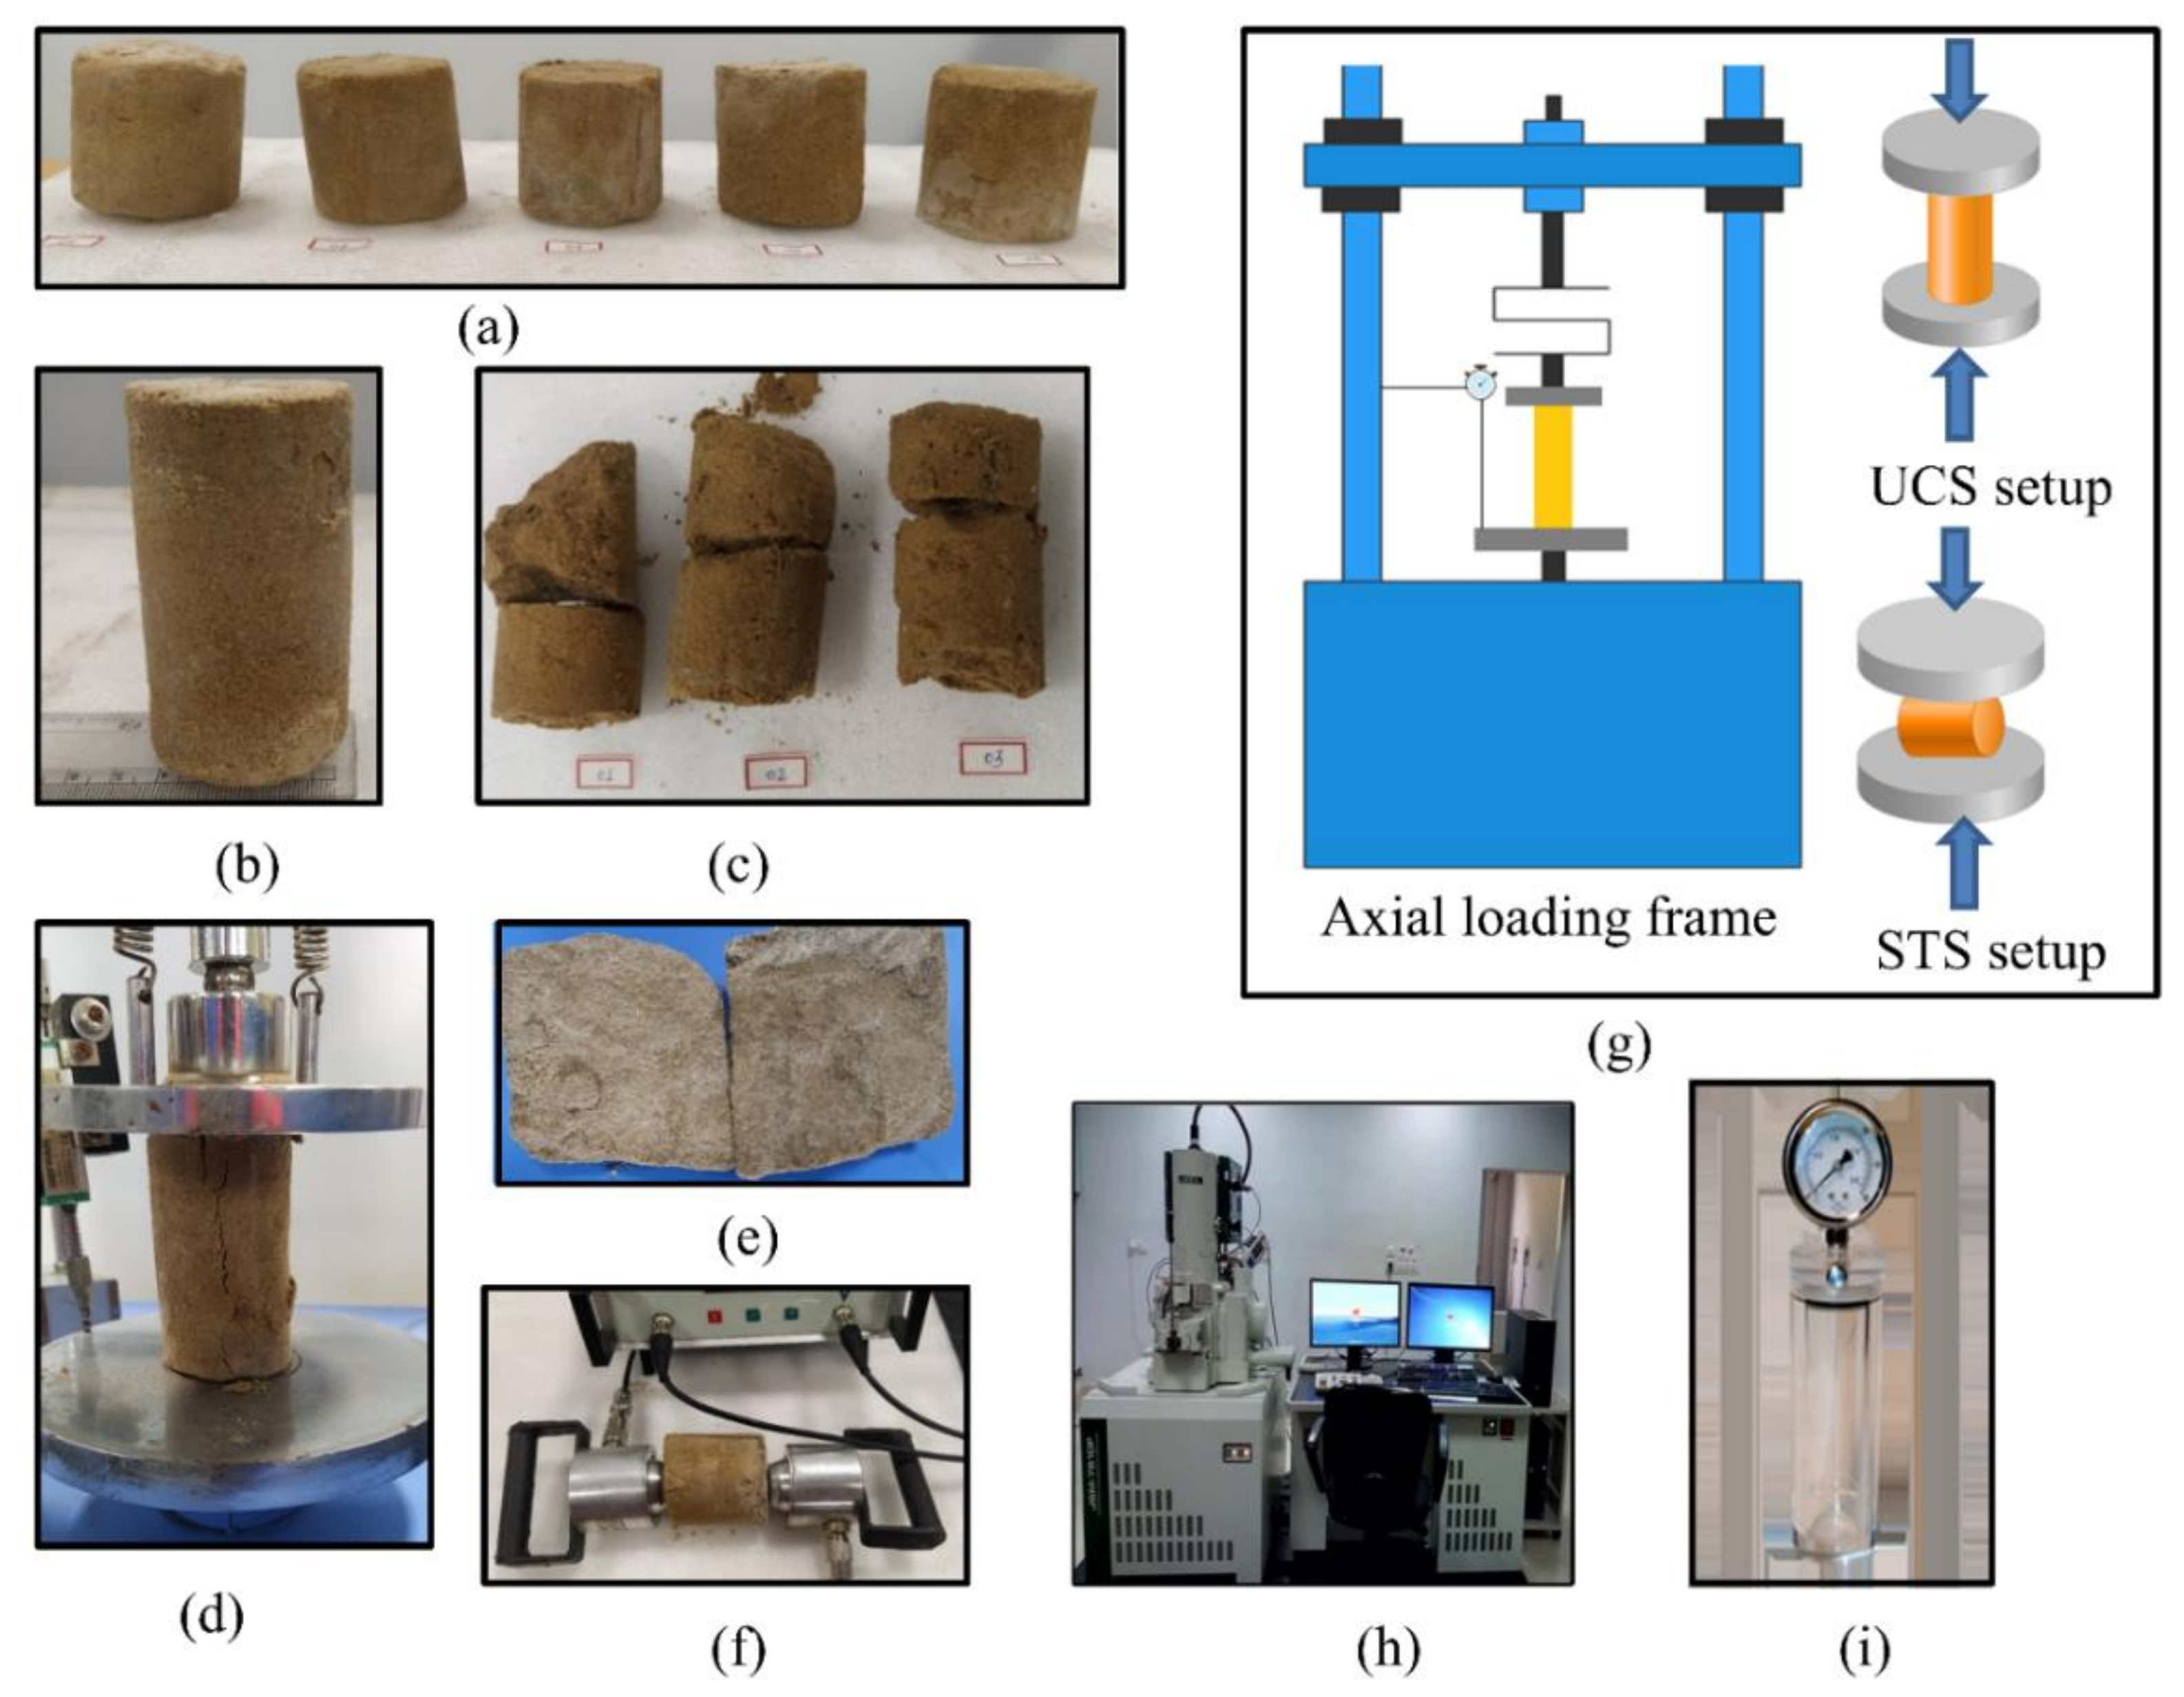
2.6. Experimental Setup for UCS and STS Tests

The reaction of bacteria with different pore-volume cementation solutions was assessed in terms of formation of calcite content and stabilization of biotreated-sand specimens after performing various mechanical, chemical, and microstructure tests. UCS and STS tests were performed to assess the shear and tensile strengths of the biocemented-desert-sand specimens. Shear-wave velocity was measured using the UPV test for verifying rocklike behavior. Calcite content was measured using a calcimeter for interpretation of calcite formation in voids. Micro characterization using SEM and EDX was performed for understanding the bonding of sand particles. A concrete cutter was used for the smoothening of biotreated-sand samples' surfaces so that uniform loading could be applied on samples during testing.
Unconfined-compressive-strength (UCS) testing was performed as per procedures prescribed in IS: 2720 (Part 10) (1991). A fully automatic-mechanical-load frame at a 1.25 mm/min strain rate was used for UCS testing to observe the stress–strain behavior of biotreated-sand samples. An S-type load cell of 2.5 KN capacity and LVDT of 25 mm were used to measure deformation and vertical displacement, as shown in Figure 5g.
The IS 10082:1981 procedure was followed to perform the split-tensile strength (STS) test. A strain rate of 1.25 mm/min was applied during STS testing. Specimens with an aspect ratio of 1:1 were tested on lateral dimension using a UCS testing machine (STS setup; Figure 5g).
Shear-wave velocity was measured on biocemented-sand samples. UCS and STS samples were tested for nondestructive UPV testing as per procedures prescribed in IS: 13311 (Part 1) 1992. Before starting the test, lubricating gel was applied at receiving and transmitting transducers and also on both sides of the cylindrical sample to fill the gap between the biotreated-sand samples (Figure 5f).
Calcite content (%) is one of the very important parameters to measure the effectiveness of the MICP treatment. After UCS and STS testing, the sample was collected from the tested specimen at three places, i.e., top, bottom, and middle, to know uniformity in calcite content in the biotreated sample. A calcimeter was used to measure CO2 gas, assisted by a pressure gauge, which was generated from the reaction between biotreated sand and HCl in a closed reaction cell. Measured CO2 gas pressure was used to deduce calcite percentage in biotreated samples, as shown in Figure 5i.

2.7. Microscale-Identification Analysis

Oven-dried, biotreated samples were collected from the top–center of the tested specimen at different pore volumes and treatment durations. Samples were grinded into a fine powder using an agate mortar and pestle for microscale-identification analysis. To conduct SEM analysis, the gold-sputter-coated sample was used at 15 KV beam intensity with different magnifications, as shown in Figure 5h. Through SEM images, the size and formation of calcite crystals on untreated and biotreated samples were observed. For chemical characterization of untreated and biotreated samples, the EDX-analysis method was used. In EDX-analysis output, the peak of the scrutinized sample was obtained from the spectrum.

3. Results and Discussion

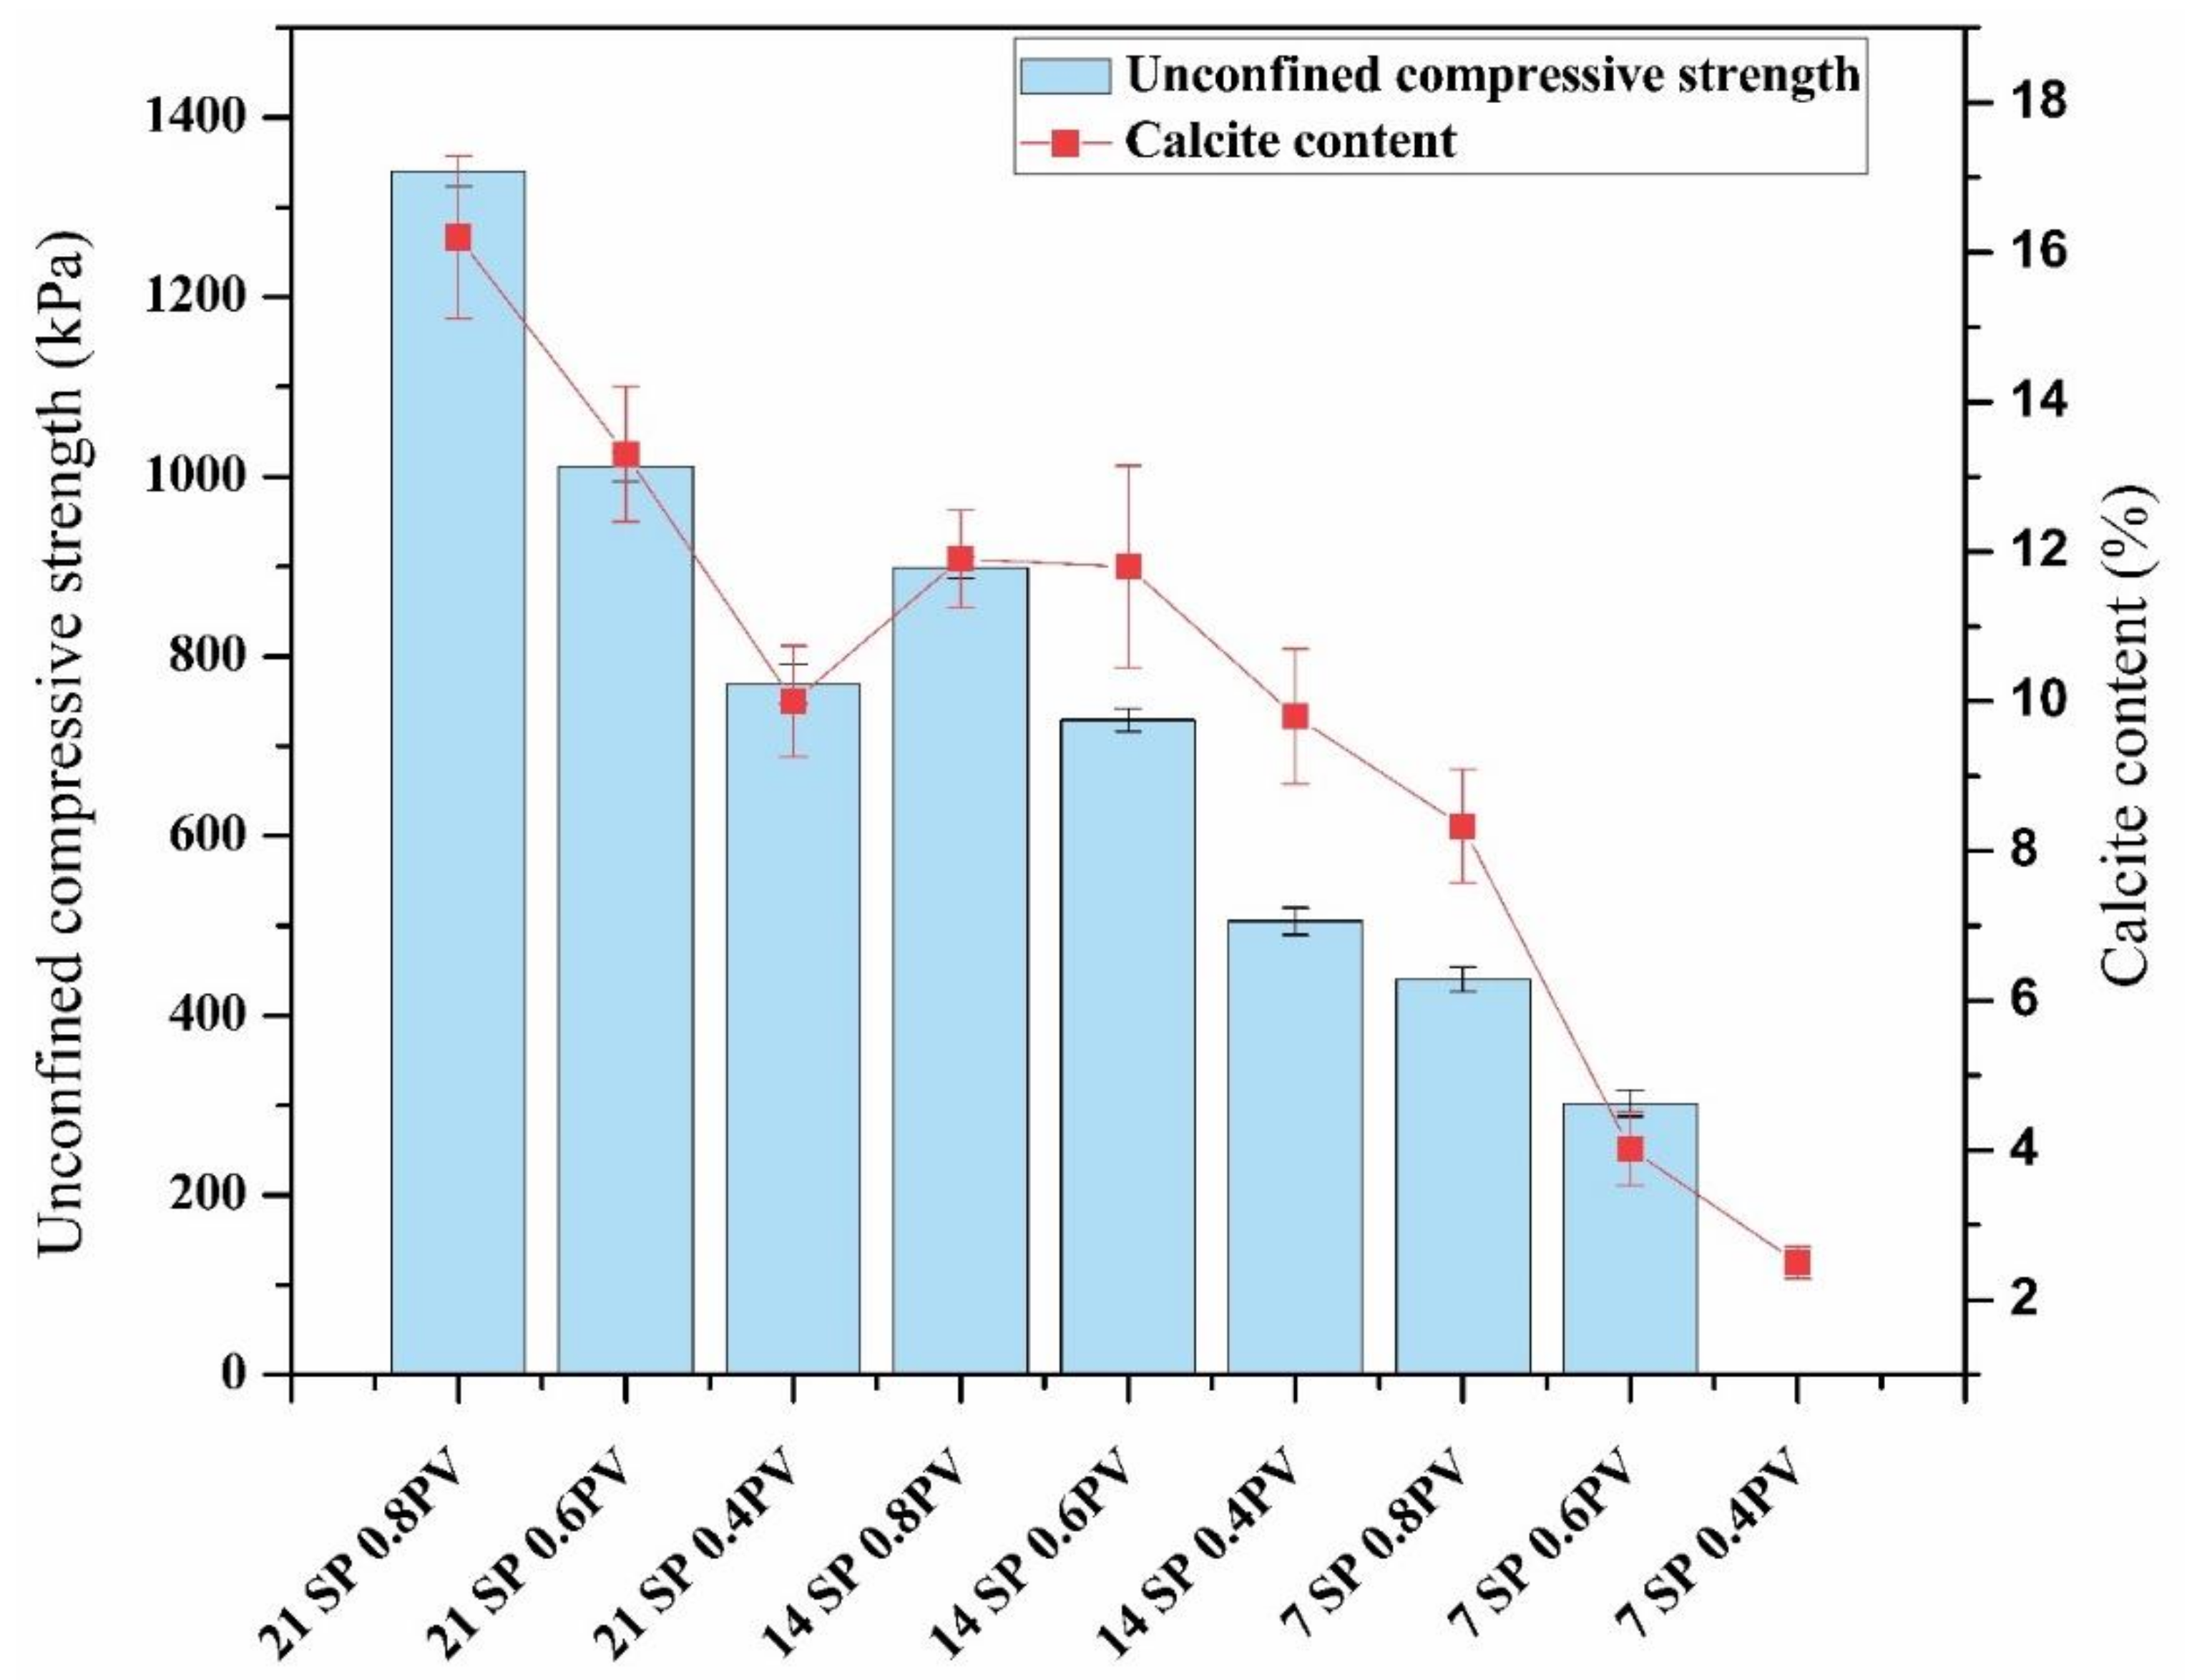
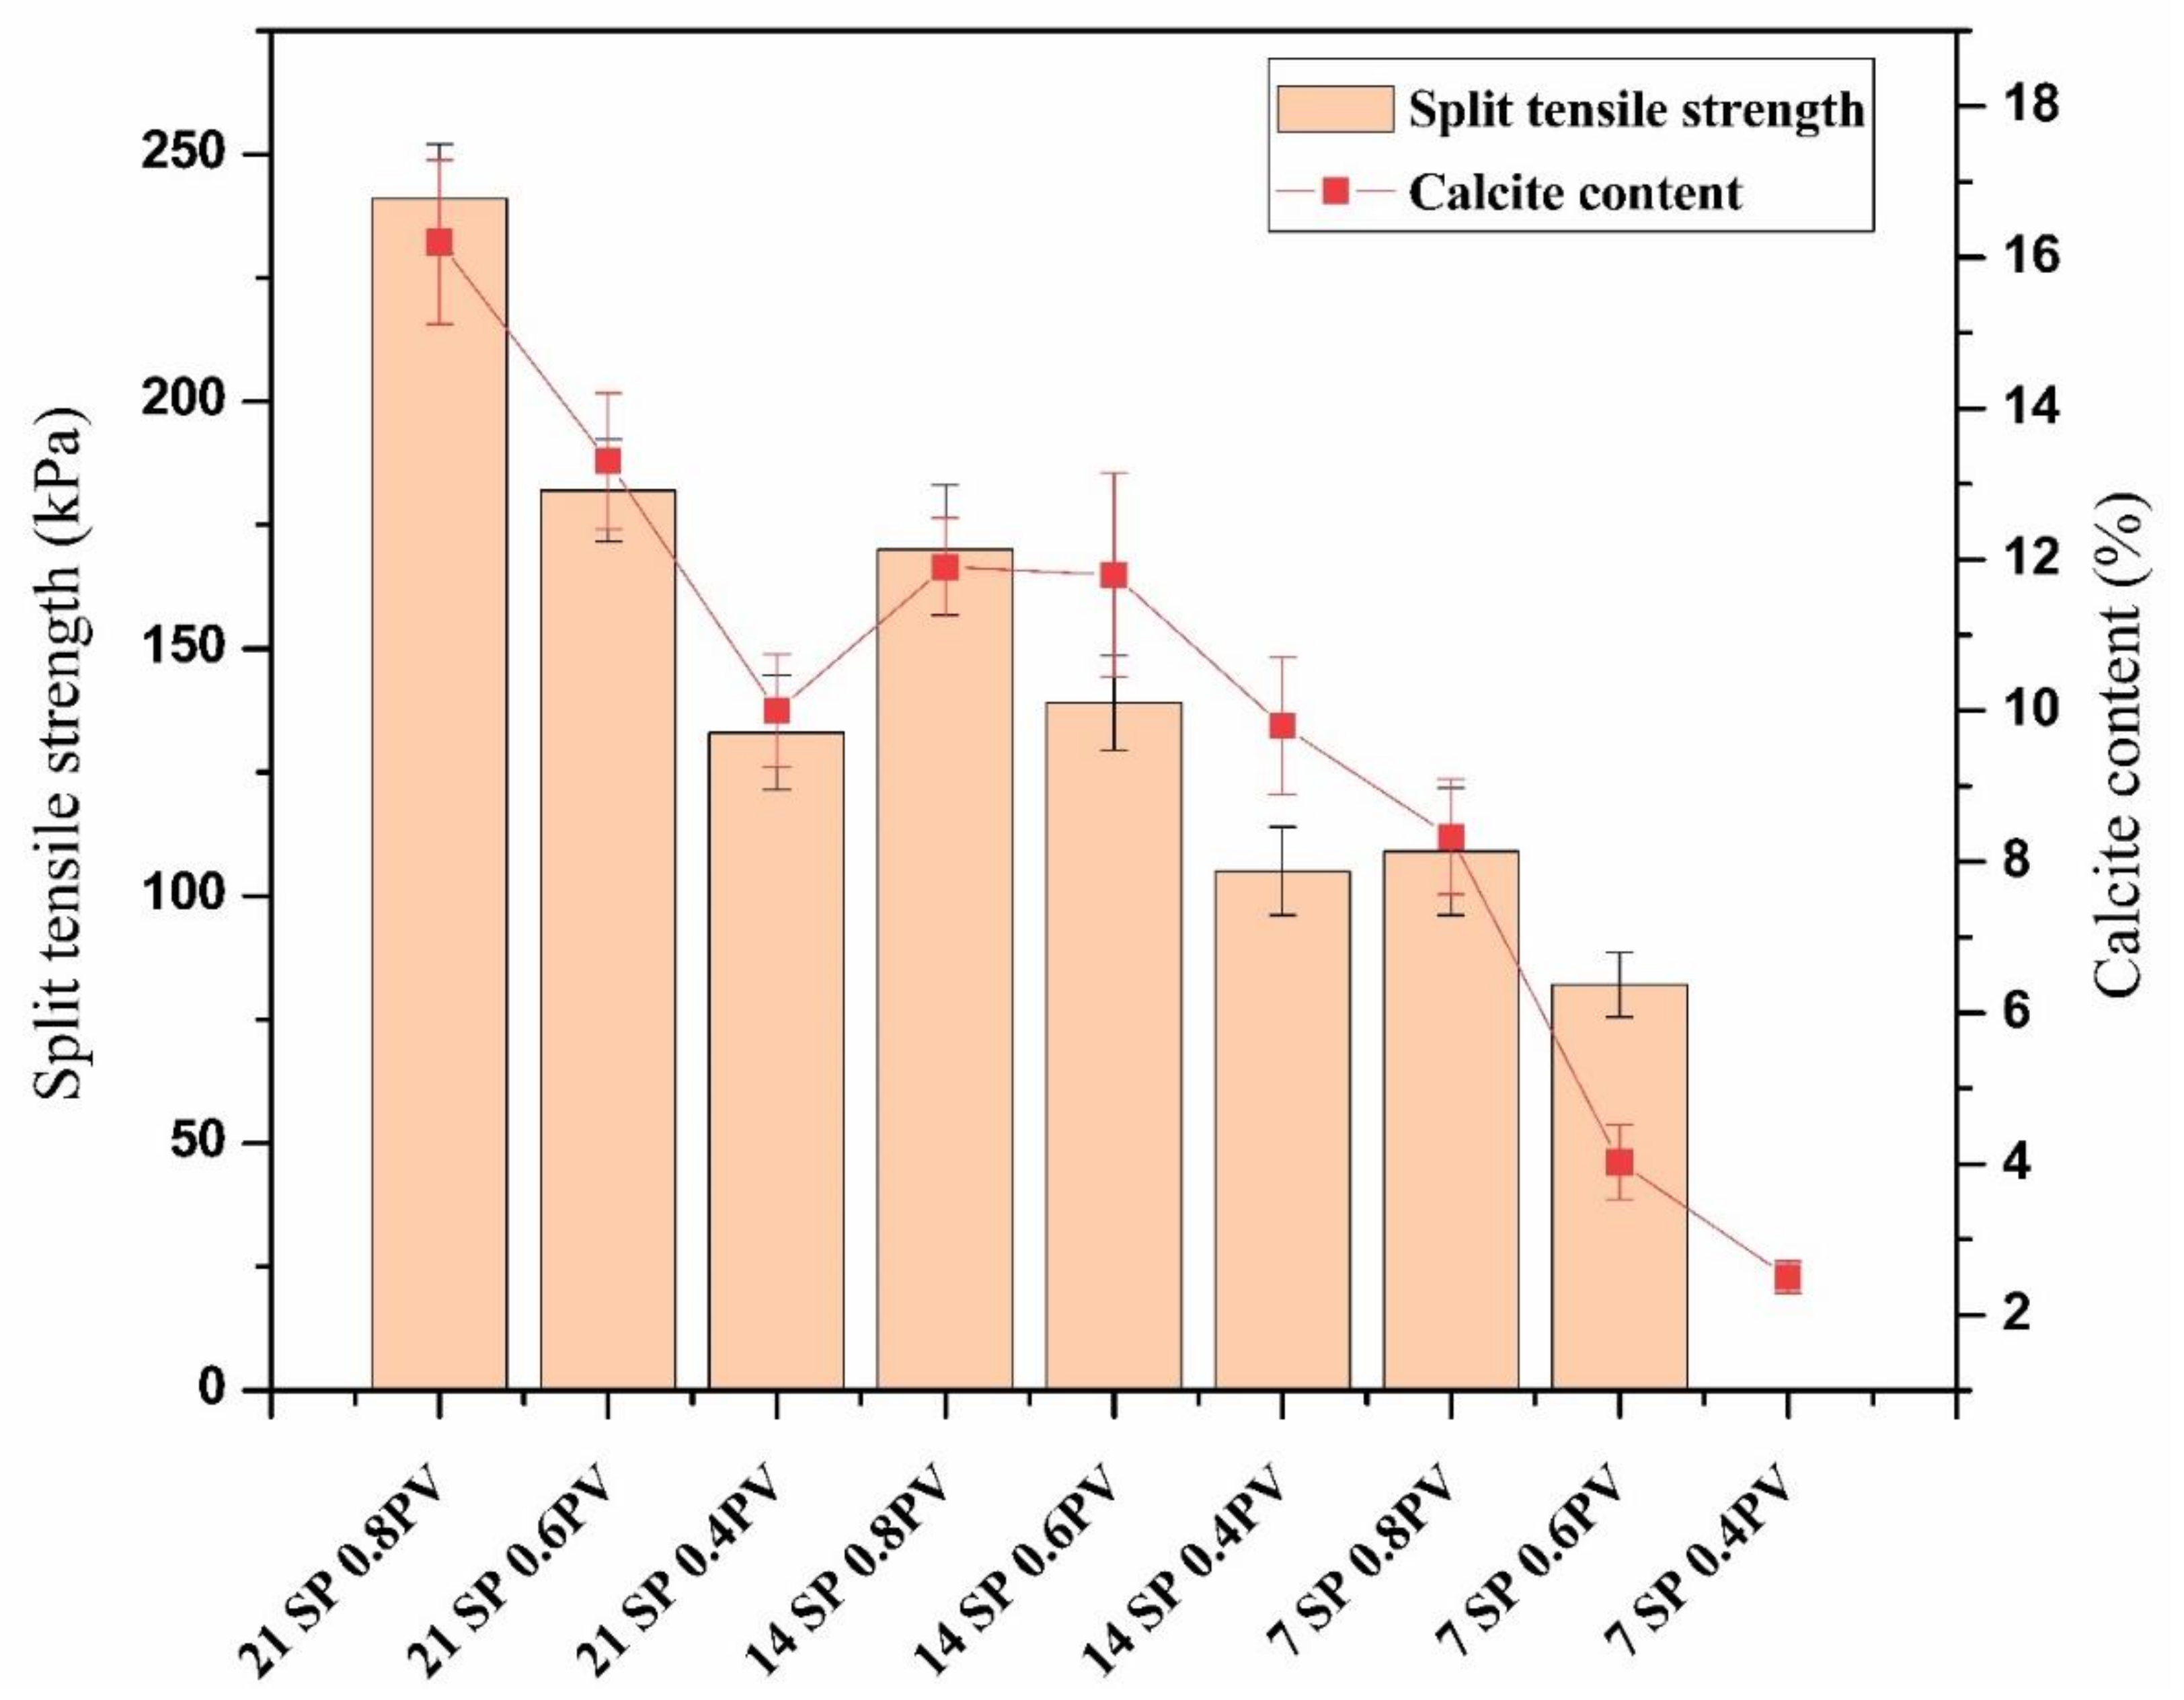
3.1. Effects of Different Pore Volume and Treatment Duration on UCS and STS

Figure 5a,b show an overview of STS and UCS samples, respectively. Samples treated for a 7day duration with 0.4 PV were not formed and were found broken during removal from their molds, as shown in Figure 5c. For each combination, three replicas of samples were prepared and tested. Shear failure was noticed for UCS testing, as shown in Figure 5d. Tensile failure was noticed for STS testing, as shown in Figure 5e. The samples were collected from the top layer of the tested specimens for calcite-content and microcharacterization testing. Middle- and bottom-layer samples were only collected for calcite-content testing to evaluate the uniformity of calcite-precipitation formation during the biotreatment process.
The UCS-test results with the highest calcite content are displayed for different sample combinations, as shown in Figure 6. Sample designation 21 SP 0.8PV had the maximum UCS value of 1340.35 kPa with an average calcite content of 16.2%. Sample designations 21 SP 0.6PV and 21 SP 0.4PV had the strengths of 1011 kPa and 769 kPa with an average calcite percentages of 13.3% and 10%, respectively. The STS-test results with top calcite content are displayed for different sample combinations, as shown in Figure 7. Sample designation 21 SP 0.8PV had the maximum STS value of 241 kPa with an average calcite content of 16.2%. Sample designations 21 SP 0.6PV and 21 SP 0.4PV had the strengths of 182 kPa and 133 kPa with average calcite percentages of 13.3% and 10%, respectively. Figure 6 shows that increasing treatment days with a higher pore volume resulted in significant improvement in strength and calcite content. This experimental study was conducted in April 2021 with a day temperature of 37.6 °C and a night temperature of 21.4 °C.

3.2. Analysis of Biocemented Sand Based on UPV

To evaluate the strength of biotreated-sand samples, UPV tests were performed. The untreated desert sand cannot be converted into an unsupported cylindrical sample, and hence the UPV test was not performed. The shear-wave-velocity range for untreated, poorly graded sand with confining pressures ranging from 50 to 900 kPa is between 149 m/s and 303 m/s [25]. Figure 8 shows the variation of shear-wave velocity of biocemented samples under different treatment conditions. Sample designation 21 SP 0.8PV had the maximum UPV value of 1762 m/s with an average calcite content of 16.2%. Sample designations 21 SP 0.6PV and 21 SP 0.4PV had UPV values of 1406 m/s and 1010 m/s with average calcite percentages of 13.3% and 10%, respectively. Sample designation 7 SP 0.6PV had the minimum UPV value of 650 m/s with an average calcite content of 4.02%.
Table 2 shows the UPV value and its comparison with NEHRP (2003) to understand the soil behavior before and after the MICP treatment. It was found that all MICP-treated samples, except 7 SP 0.6PV and 7 SP 0.4PV, behaved like sandstone.

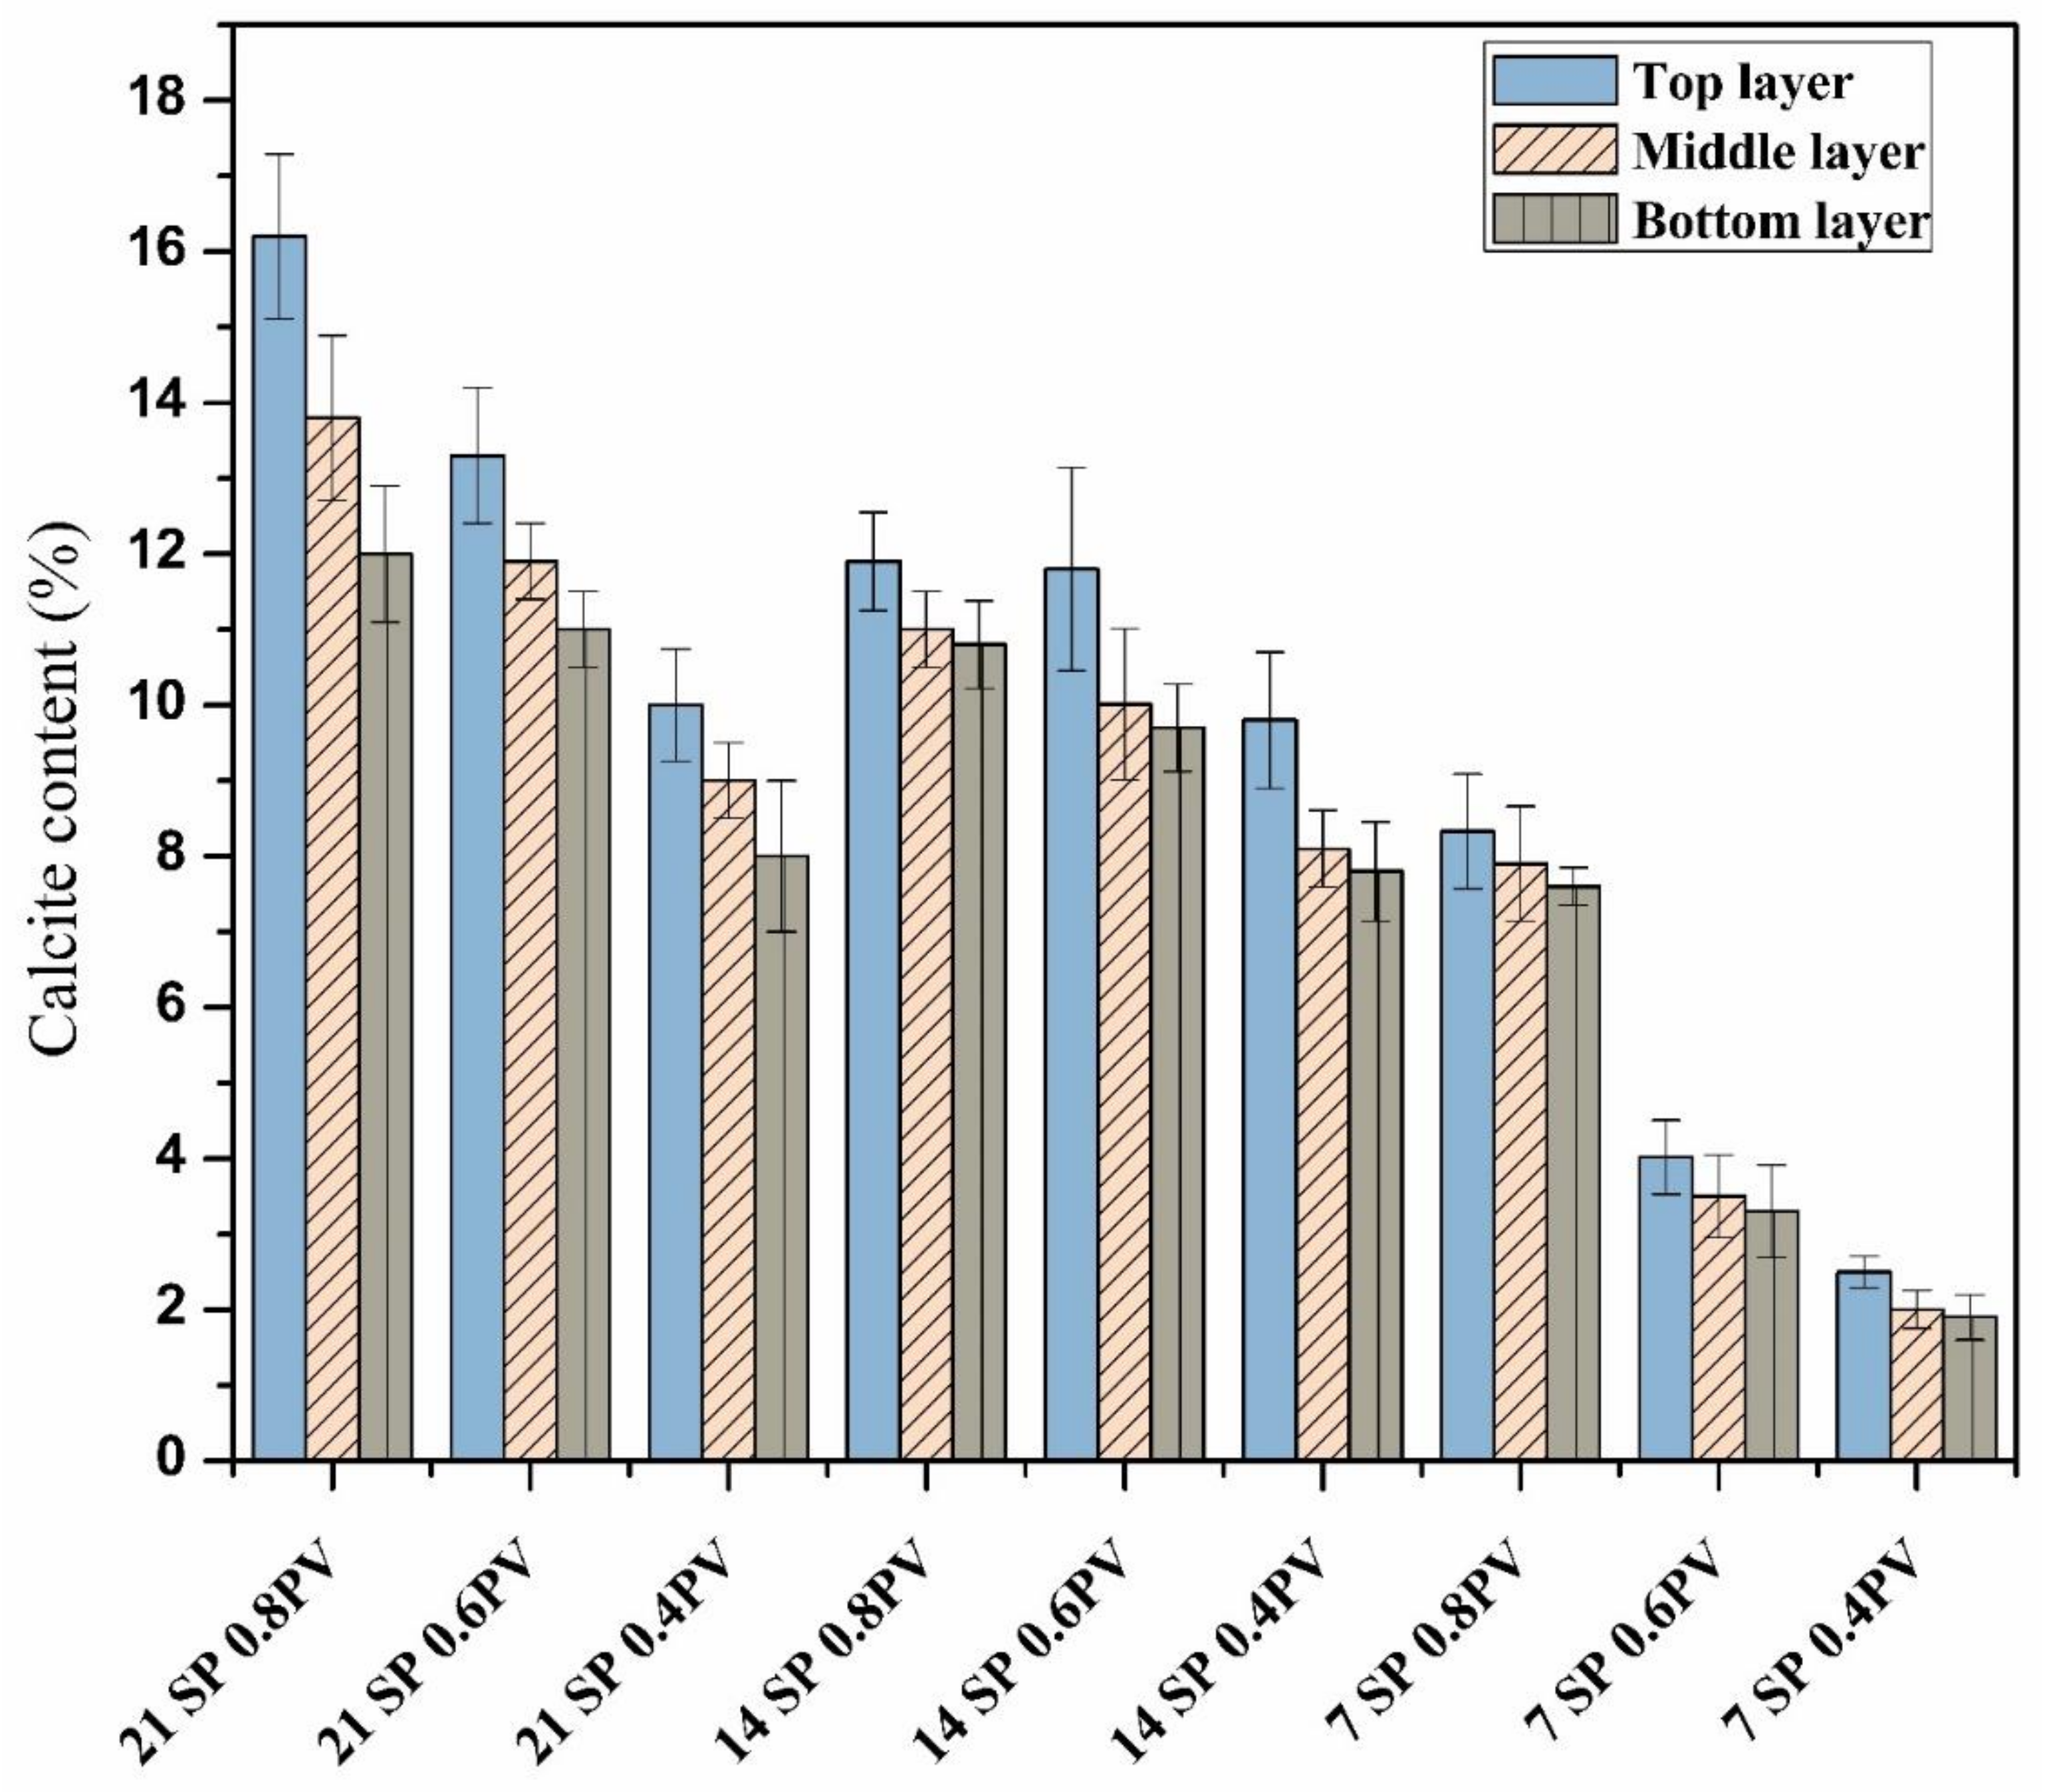
3.3. CaCO3 Precipitation

Calcite content was measured for different combinations of treatment conditions, along with sample depth to ensure uniformity of treatment. For each combination, the sample was collected from the top, middle, and bottom layers of the biotreated sample. The collected sample was tested using a calcimeter. Calcite-content values were drawn for all layers and treatment combinations (Figure 9). Three replicas of each sample were prepared and testing was carried out. The coefficient of variation was less than 19 for all layers and combinations, which was acceptable as calcite-content formation depends on many factors, such as type of bacteria, bacterial density, crystal formation, temperature, and pH value. Various studies [6] have found that the coefficient of variation of more than 21 was within the acceptable limits. Figure 9 shows the percentage of calcite content for different treatment combinations for all three layers. It can be seen that there were minimal variations in calcite percentage in all layers, which shows uniformity in calcite precipitation. In the present study, the maximum pore volume was 16.8 and the minimum was 2.8. It can be seen that the strength values increased with the treatment days. At the same time, results are on the lower side with the same pore volume and fewer treatment days, which may have been due to the reaction time of the solution with bacteria. The calcite-content results are found to be similar to previous studies [26].

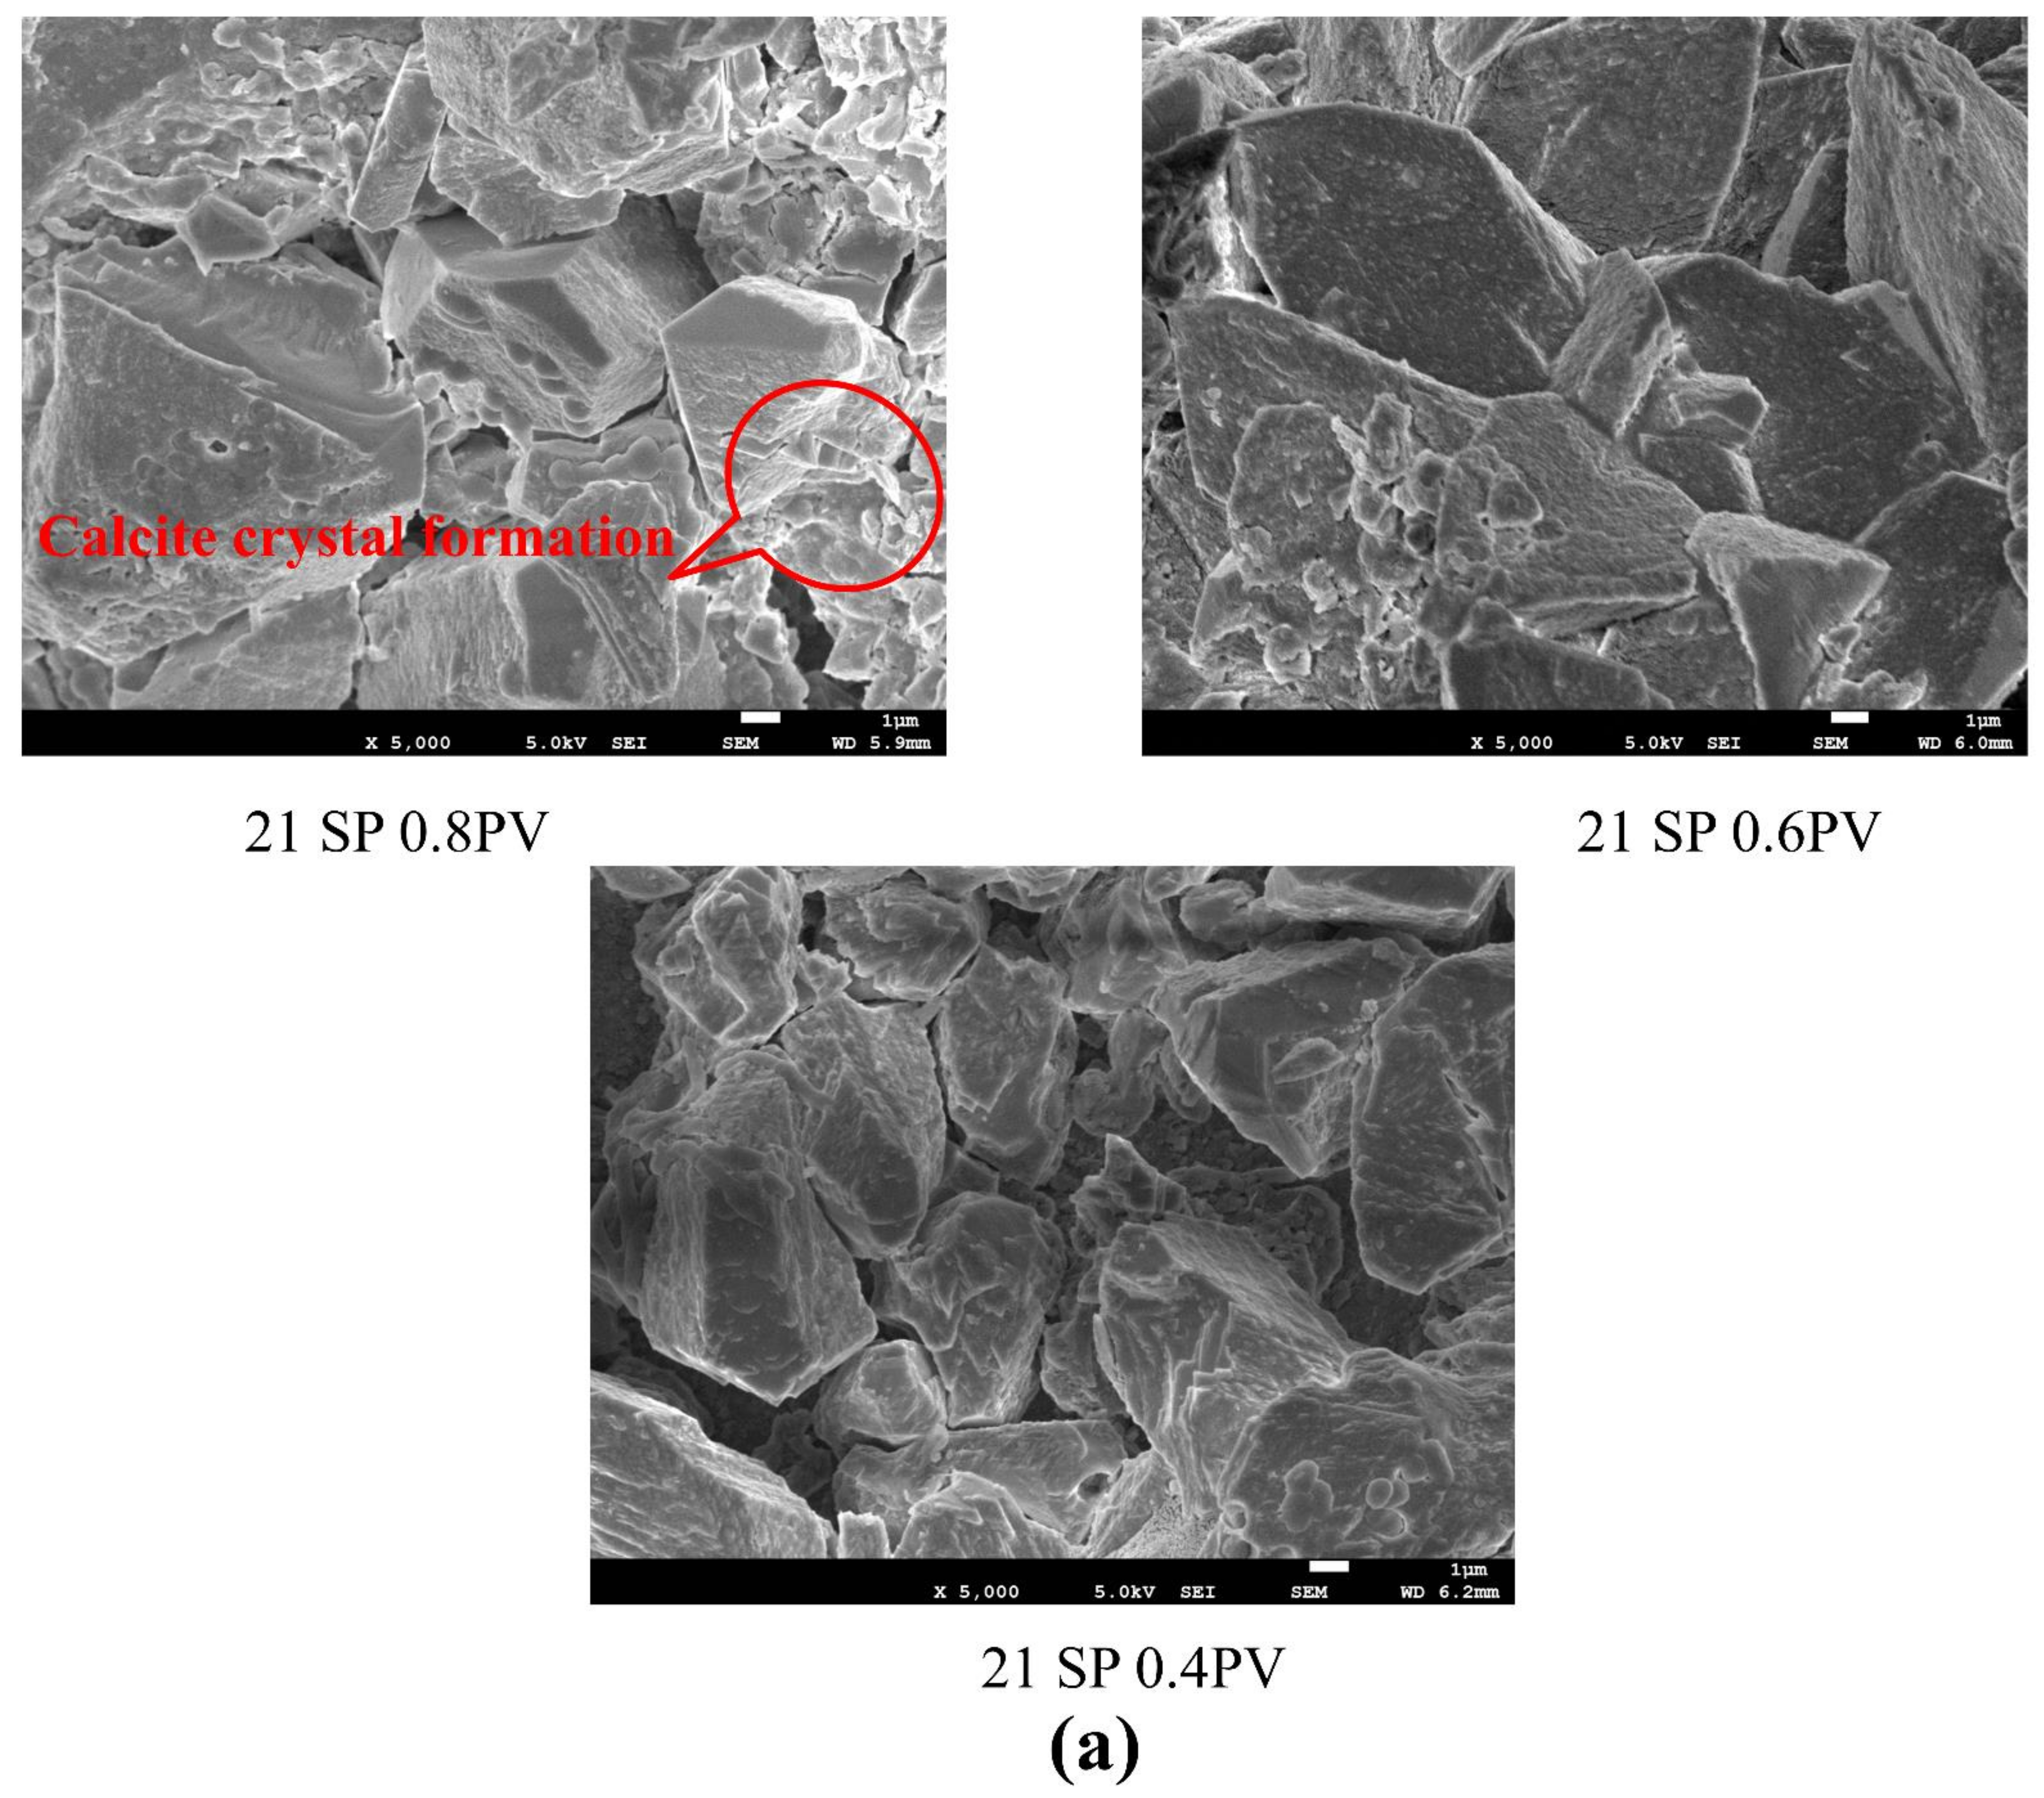
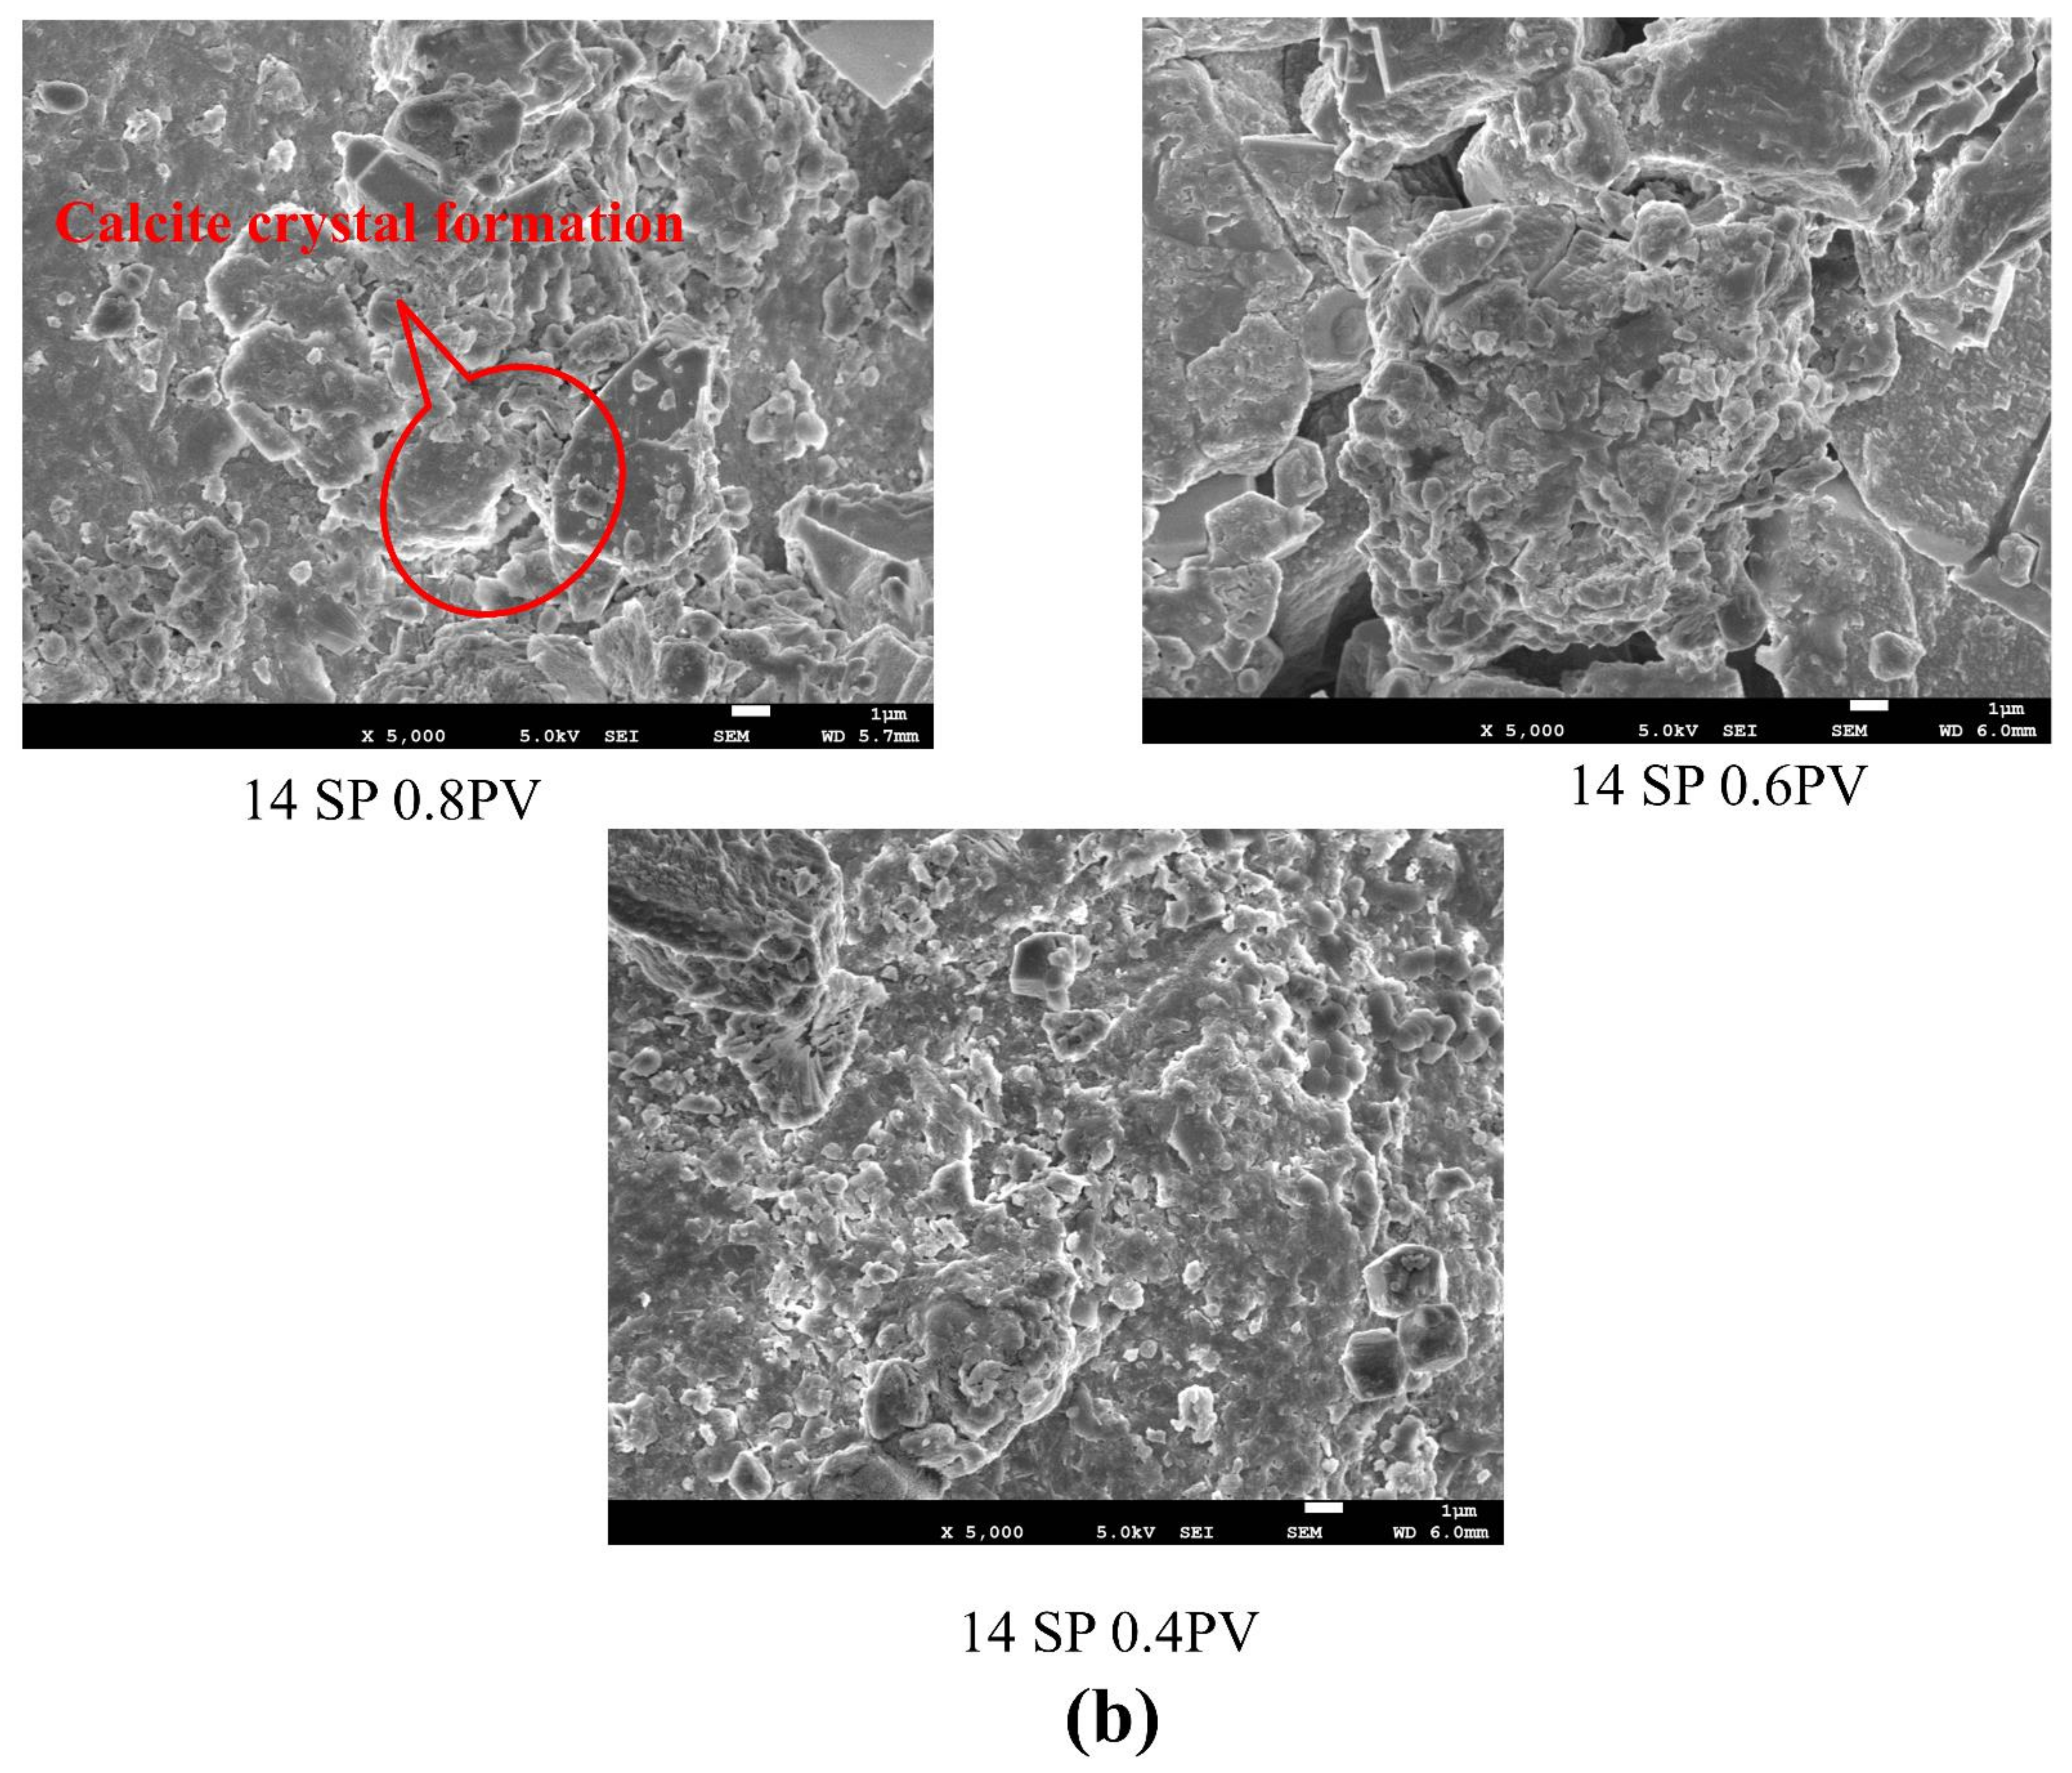
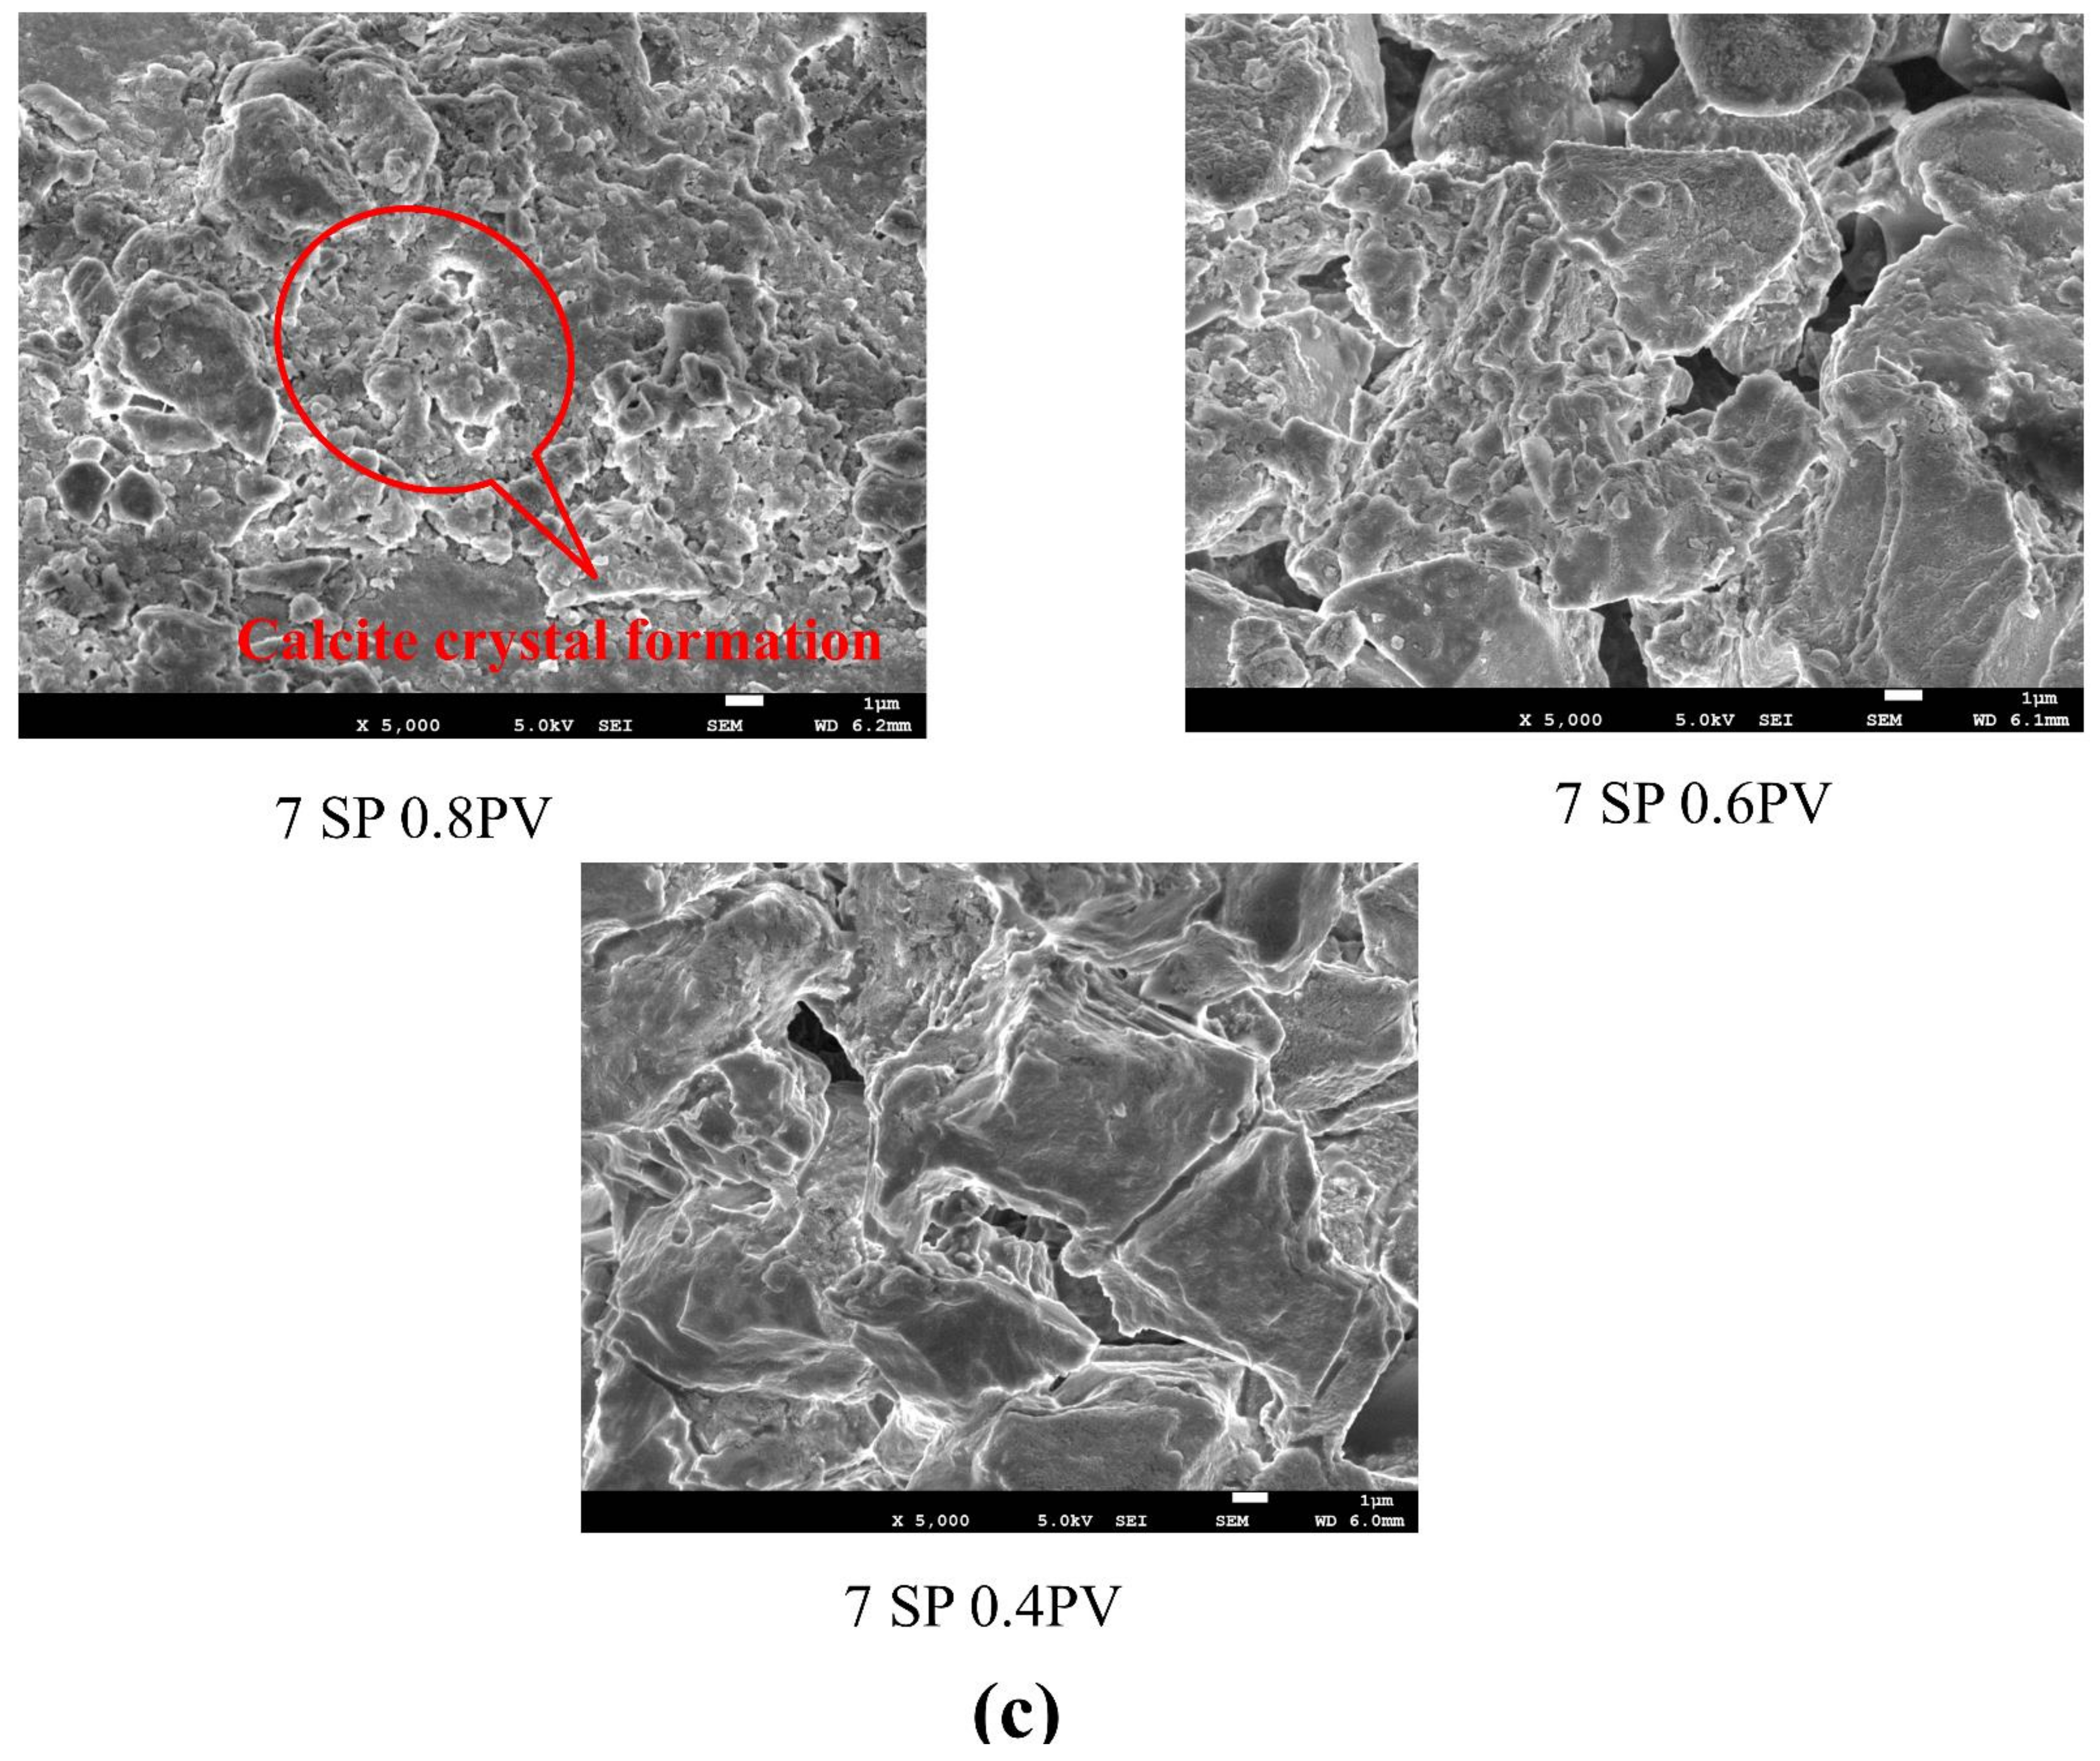
3.4. Effects of Pore Volume and Treatment Duration on the Microstructure of Sand

SEM images were taken for untreated and biotreated sand to witness calcite formation and bonding of particles. Figure 10 shows an SEM image of untreated sand which was taken at 150× magnification and 100 µm scale and shows no bonding between particles. Figure 11 shows SEM images of biotreated sand with different pore volumes, taken at 5000× magnification and 1 µm scale. Based on the SEM images, it is clear that crystal growth changes as pore volume changes. More pore volume reduces pore space between particles and also forms bonding between particles due to the formation of calcite precipitation.
Figure 12 shows EDX analysis of untreated- and biotreated-sand samples. EDX analysis was performed for the chemical characterization of materials and peaks of investigated samples. Untreated sand was calcareous sand, as the presence of calcium is observed in EDX spectra. Additionally, biotreated-sand samples show the highest peak of calcium.

4. Conclusions

The present study has been conducted to optimize cementation solutions for solidifying desert sand for mitigating wind erosion in parts of Rajasthan province of India. The microbial-induced calcium carbonate precipitation (MICP) method was used with S. pasteurii urease-producing bacteria and 0.5 M of cementation solution. The cementation solution of three different pore volumes, i.e., 0.4, 0.6, and 0.8, was applied after every 24 h as one treatment cycle with a stopped-flow pouring technique. The cylindrical specimen in three replicas was biotreated for split-tensile strength (STS) and unconfined compressive strength (UCS) for 7, 14, and 21 days, respectively. The biotreated specimen was tested for split-tensile strength (STS), unconfined compressive strength (UCS), ultrasonic-pulse velocity (UPV), and calcite content. Analysis of rocklike behavior was performed using UPV testing. Calcite content was measured for three layers, i.e., the top, middle, and bottom layers of the sample, to check the uniformity of the treatment process. Additionally, microstructure characterization of untreated and biotreated sand was examined with a scanning electron microscope (SEM) and energy-dispersive X-ray analysis (EDX). The following conclusions are obtained from the present study.
  • Strength enhancement is observed with an increase in pore volume (from 0.4 to 0.8) and also treatment duration (7 to 21 days). The MICP interconnected sand particles in a very firm manner and hence resulted in strength enhancement.
  • Shear failure in UCS sample testing and a tensile failure in STS sample testing was observed. Ultrasonic-shear-wave-velocity results were exerted to ensure rocklike behavior. It is found that almost all samples treated for 14 and 21 days and also 7 days with 0.8 PV correspond to the heavily cemented category.
  • After analysis of the test results, 0.4 PV cementation solution with 14 days of treatment or 0.8 PV with 7 days of treatment produced almost the same results and can be recommended for large-scale testing to achieve the economically suitable solution for wind erosion.
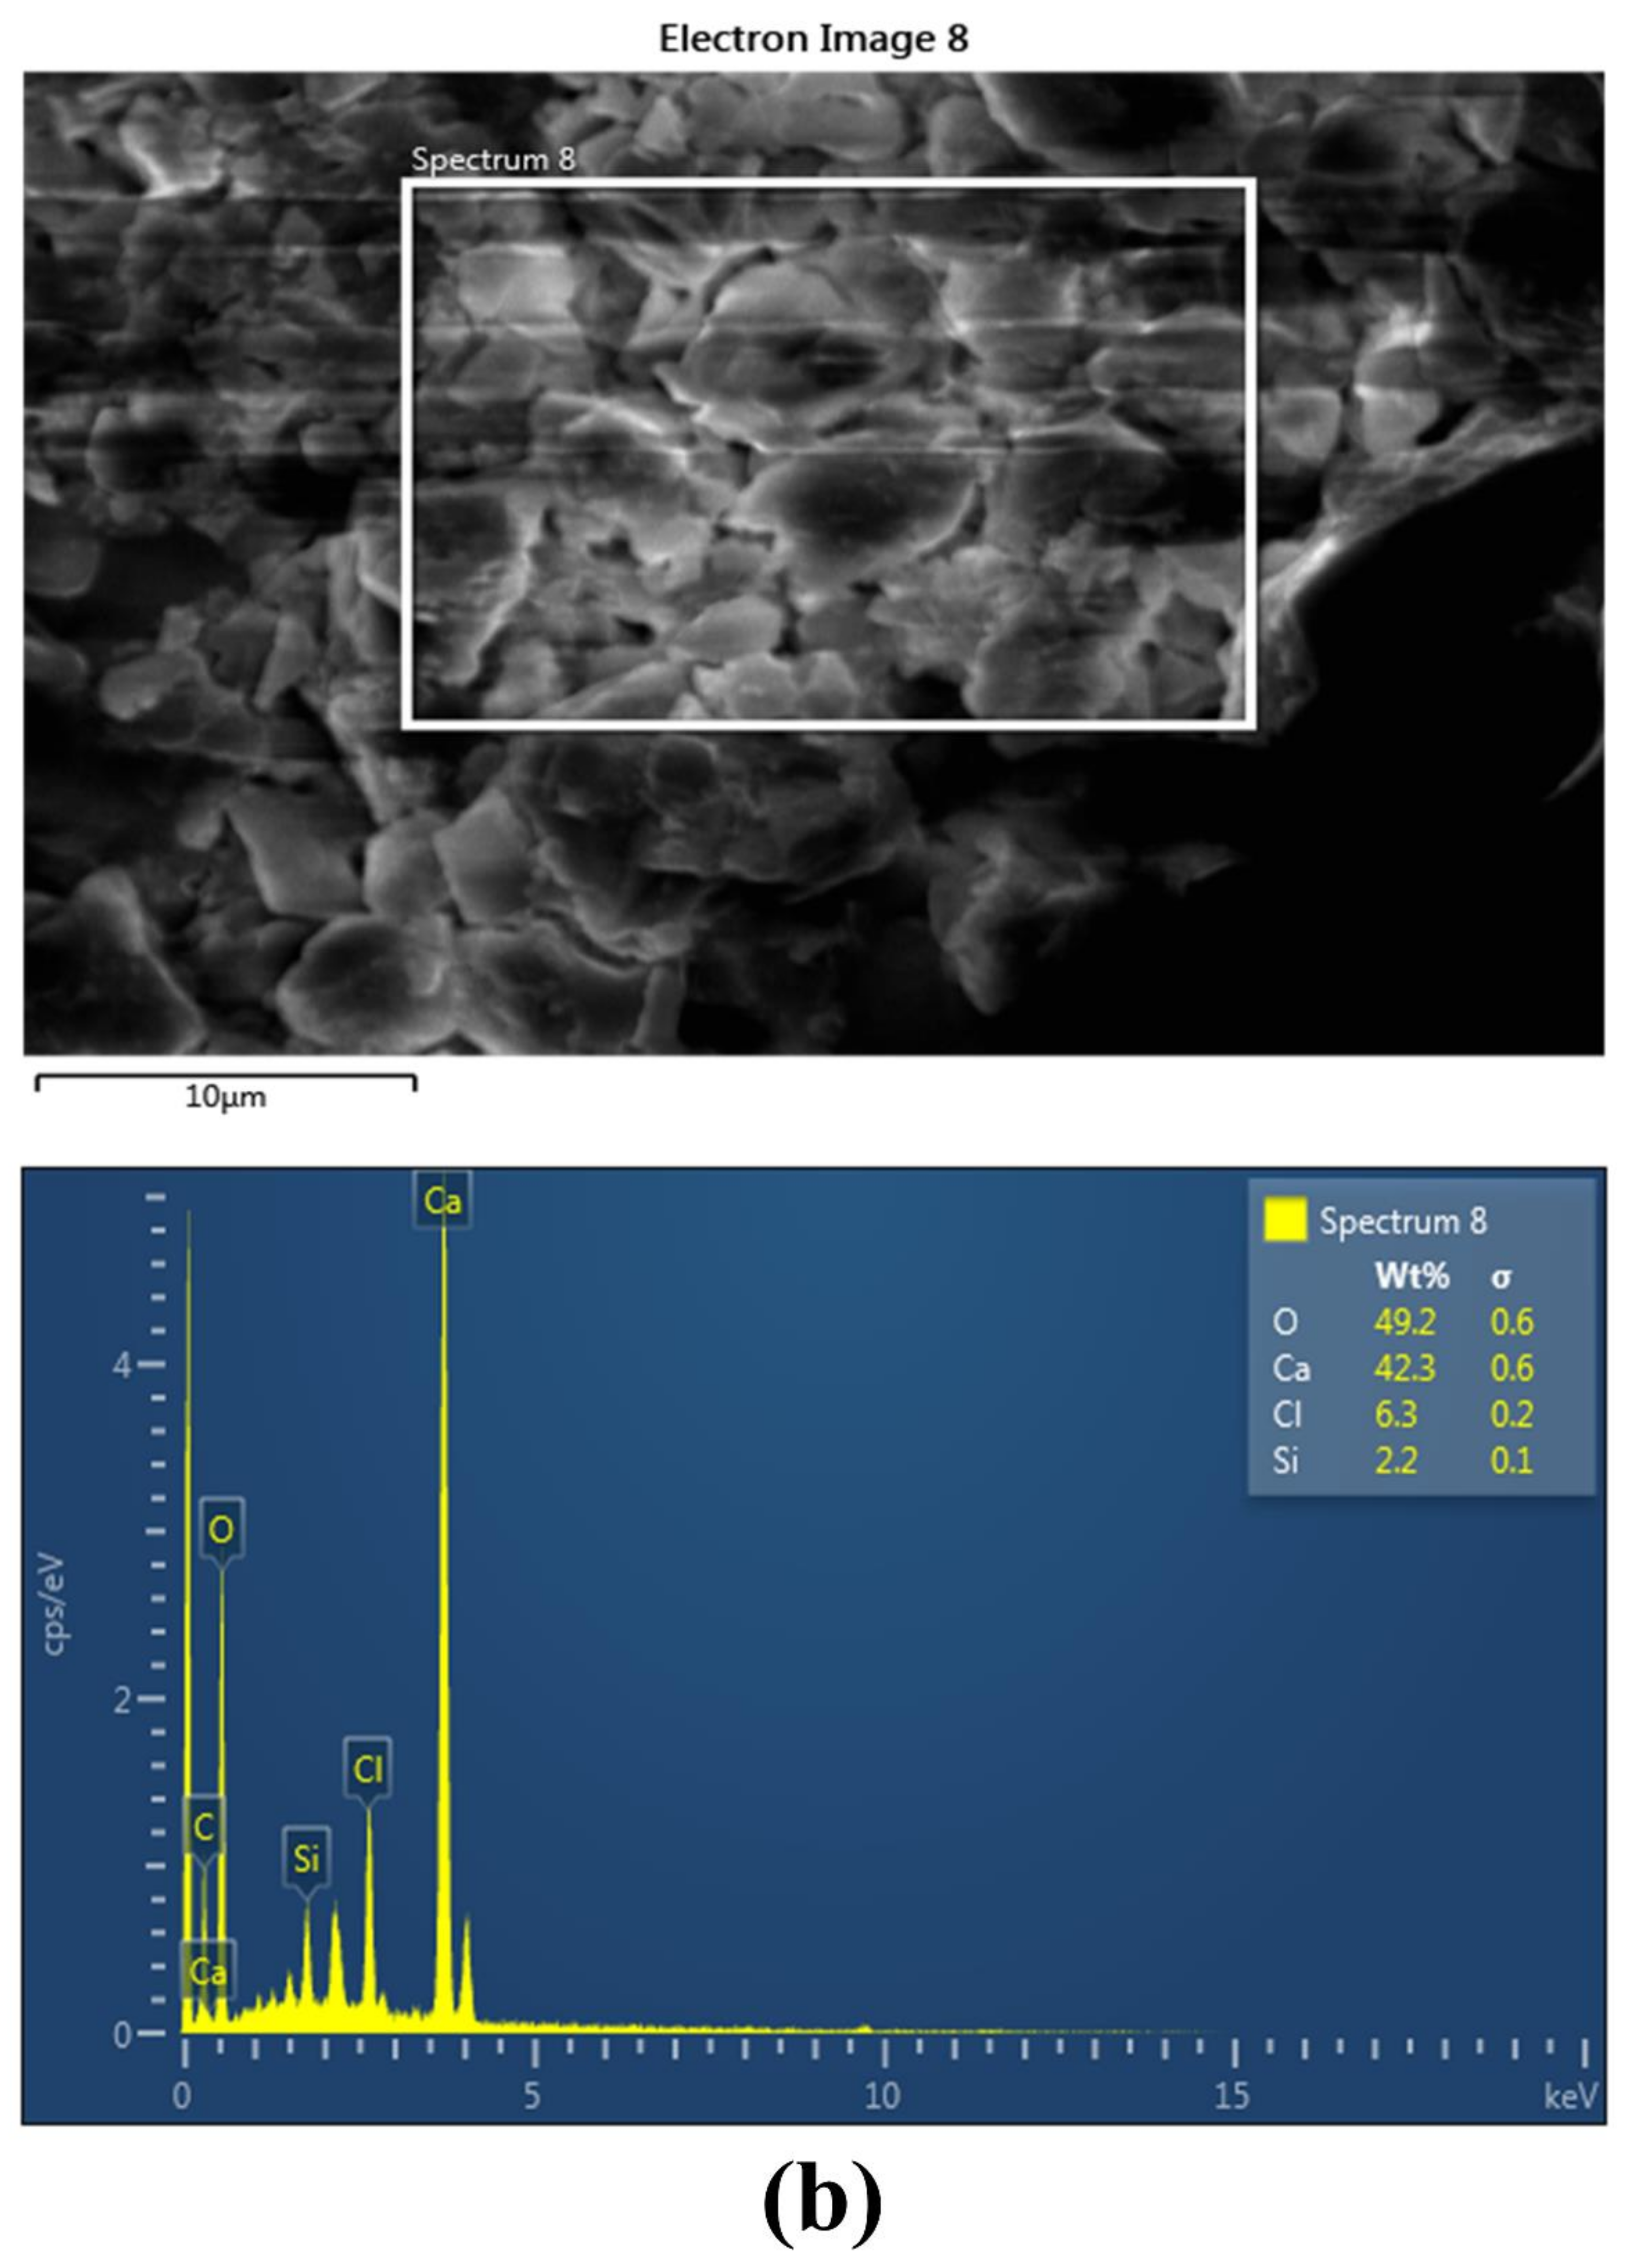
  • Micro-characterization of untreated and biotreated samples was performed to verify present-treatment effectiveness. Crystal-formation growth between voids is observed from SEM-image analysis and calcium peaks are observed from EDX analysis.
The conclusions are based on the present study, in which temperature has not been maintained as per field conditions. Overall, studies show the optimization of cementation solution with different pore volumes for strength enhancement of desert sand. Before applying the present experimental condition in the field, study of temperature effects will be performed and large-scale testing is recommended to mitigate wind erosion. Table 3 summarizes the list of abbreviations.

Author Contributions

M.D. contributed to designing the experiments and writing the original draft. N.S. provided the funding support for conducting experiments at IIT Indore. N.S. and A.G. contributed equally to analyzing the data and completing the revisions and editing. All authors have read and agreed to the published version of the manuscript.

Funding

This research received no external funding.

Institutional Review Board Statement

Not applicable.

Informed Consent Statement

Not applicable.

Data Availability Statement

Data can be made available upon reasonable request.

Acknowledgments

The first author is grateful to Prestige Institute of Engineering, Management, and Research, Indore, for its support throughout the research work. Second and Third authors are also grateful to the Guangdong Department of Science and Technology, China for “Overseas Famous Teacher Project” (Grant No. 2020A1414010268), that is intended to develop cooperation.

Conflicts of Interest

The authors declare no conflict of interest.

References

  1. Miao, L.; Wu, L.; Sun, X. Enzyme-catalysed mineralisation experiment study to solidify desert sands. Sci. Rep. 2020, 10, 1–12. [Google Scholar] [CrossRef] [PubMed]
  2. Moharana, P.C.; Santra, P.; Singh, D.V.; Kumar, S.; Goyal, R.K.; Machiwal, D.; Yadav, O.P. ICAR-Central Arid Zone Research Institute, Jodhpur: Erosion Processes and Desertification in the Thar Desert of India. Proc. Indian Natl. Sci. Acad. 2016, 82, 1117–1140. [Google Scholar] [CrossRef]
  3. Wang, Z.; Zhang, N.; Ding, J.; Lu, C.; Jin, Y. Experimental Study on Wind Erosion Resistance and Strength of Sands Treated with Microbial-Induced Calcium Carbonate Precipitation. Adv. Mater. Sci. Eng. 2018, 2018, 3463298. [Google Scholar] [CrossRef] [Green Version]
  4. Le Houérou, H.N. Biogeography of the arid steppeland north of the Sahara. J. Arid Environ. 2001, 48, 103–128. [Google Scholar] [CrossRef]
  5. Chou, C.-W.; Seagren, E.A.; Aydilek, A.H.; Lai, M. Biocalcification of Sand through Ureolysis. J. Geotech. Geoenviron. Eng. 2011, 137, 1179–1189. [Google Scholar] [CrossRef] [Green Version]
  6. Sharma, M.; Satyam, N.; Reddy, K.R. Hybrid bacteria mediated cemented sand: Microcharacterization, permeability, strength, shear wave velocity, stress-strain, and durability. Int. J. Damage Mech. 2021, 30, 618–645. [Google Scholar] [CrossRef]
  7. Dagliya, M.; Satyam, N.; Sharma, M.; Garg, A. Experimental study on mitigating wind erosion of calcareous desert sand using spray method for microbially induced calcium carbonate precipitation. J. Rock Mech. Geotech. Eng. 2022. [Google Scholar] [CrossRef]
  8. Spencer, C.A.; Van Paassen, L.; Sass, H. Effect of Jute Fibres on the Process of MICP and Properties of Biocemented Sand. Materials 2020, 13, 5429. [Google Scholar] [CrossRef]
  9. Tiwari, N.; Satyam, N.; Puppala, A.J. Strength and durability assessment of expansive soil stabilized with recycled ash and natural fibers. Transp. Geotech. 2021, 29, 100556. [Google Scholar] [CrossRef]
  10. Tiwari, N.; Satyam, N.; Singh, K. Effect of Curing on Micro-Physical Performance of Polypropylene Fiber Reinforced and Silica Fume stabilized Expansive Soil Under Freezing Thawing Cycles. Sci. Rep. 2020, 10, 1–16. [Google Scholar] [CrossRef]
  11. Tiwari, N.; Satyam, N. Coupling effect of pond ash and polypropylene fiber on strength and durability of expansive soil subgrades: An integrated experimental and machine learning approach. J. Rock Mech. Geotech. Eng. 2021, 13, 1101–1112. [Google Scholar] [CrossRef]
  12. Sharma, M.; Satyam, N. Strength and durability of biocemented sands: Wetting-drying cycles, ageing effects, and liquefaction resistance. Geoderma 2021, 402, 115359. [Google Scholar] [CrossRef]
  13. Deng, X.; Li, Y.; Liu, H.; Zhao, Y.; Yang, Y.; Xu, X.; Cheng, X.; Wit, B.D. Examining Energy Consumption and Carbon Emissions of Microbial Induced Carbonate Precipitation Using the Life Cycle Assessment Method. Sustainability 2021, 13, 4856. [Google Scholar] [CrossRef]
  14. Sharma, M.; Satyam, N.; Reddy, K.R. Comparison of improved shear strength of biotreated sand using different ureolytic strains and sterile conditions. Soil Use Manag. 2020, 38, 771–789. [Google Scholar] [CrossRef]
  15. Wu, Y.; Ajo-Franklin, J.B.; Spycher, N.; Hubbard, S.S.; Zhang, G.; Williams, K.H.; Taylor, J.; Fujita, Y.; Smith, R. Geophysical monitoring and reactive transport modeling of ureolytically-driven calcium carbonate precipitation. Geochem. Trans. 2011, 12, 7. [Google Scholar] [CrossRef] [Green Version]
  16. Sharma, M.; Satyam, N.; Tiwari, N.; Sahu, S.; Reddy, K.R. Simplified biogeochemical numerical model to predict pore fluid chemistry and calcite precipitation during biocementation of soil. Arab. J. Geosci. 2021, 14, 1–16. [Google Scholar] [CrossRef]
  17. Liu, X.; Pan, C.; Yu, J.; Fan, J. Study on Micro-Characteristics of Microbe-Induced Calcium Carbonate Solidified Loess. Crystal 2021, 11, 1492. [Google Scholar] [CrossRef]
  18. Lee, C.; Lee, H.; Bin Kim, O. Biocement Fabrication and Design Application for a Sustainable Urban Area. Sustainability 2018, 10, 4079. [Google Scholar] [CrossRef]
  19. Cheng, L.; Afur, N.; A Shahin, M. Bio-Cementation for Improving Soil Thermal Conductivity. Sustainability 2021, 13, 10238. [Google Scholar] [CrossRef]
  20. Fattahi, S.M.; Soroush, A.; Huang, N. Biocementation Control of Sand against Wind Erosion. J. Geotech. Geoenviron. Eng. 2020, 146, 04020045. [Google Scholar] [CrossRef]
  21. Tian, K.; Wu, Y.; Zhang, H.; Li, D.; Nie, K.; Zhang, S. Increasing wind erosion resistance of aeolian sandy soil by microbially induced calcium carbonate precipitation. Land Degrad. Dev. 2018, 29, 4271–4281. [Google Scholar] [CrossRef]
  22. Maleki, M.; Ebrahimi, S.M.; Asadzadeh, F.; Tabrizi, M.E. Performance of microbial-induced carbonate precipitation on wind erosion control of sandy soil. Int. J. Environ. Sci. Technol. 2016, 13, 937–944. [Google Scholar] [CrossRef]
  23. Bu, C.; Wen, K.; Liu, S.; Ogbonnaya, U.; Li, L. Development of bio-cemented constructional materials through microbial induced calcite precipitation. Mater. Struct. 2018, 51, 30. [Google Scholar] [CrossRef]
  24. Peng, J.; Liu, Z. Influence of temperature on microbially induced calcium carbonate precipitation for soil treatment. PLoS ONE 2019, 14, e0218396. [Google Scholar] [CrossRef]
  25. Riveros, G.A.; Sadrekarimi, A. Effect of microbially induced cementation on the instability and critical state behaviours of Fraser River sand. Can. Geotech. J. 2020, 57, 1870–1880. [Google Scholar] [CrossRef]
  26. Mahawish, A.; Bouazza, A.; Gates, W.P. Improvement of Coarse Sand Engineering Properties by Microbially Induced Calcite Precipitation. Geomicrobiol. J. 2018, 35, 887–897. [Google Scholar] [CrossRef]
Figure 1. Location of a sand dune in the Rajasthan province of India.
Sustainability 14 01770 g001
Figure 2. Grain-size-distribution curve of desert sand used in the present study.
Sustainability 14 01770 g002
Figure 3. S.pasteurii bacterial cultivation and growth media.
Sustainability 14 01770 g003
Figure 4. Biotreatment process for the untreated desert-sand samples.
Sustainability 14 01770 g004
Figure 5. Biotreated samples with the different test setups: (a) biotreated STS sample, (b) biotreated UCS sample, (c) failed sample, (d) shear failure of UCS sample, (e) tensile failure of STS sample, (f) UPV-testing setup, (g) test setup for UCS and STS samples, (h) SEM- and EDX-testing setup, and (i) calcimeter.
Sustainability 14 01770 g005
Figure 6. UCS value and average calcite content for different MICP-treated desert-sand samples.
Sustainability 14 01770 g006
Figure 7. STS value and average calcite content for different MICP-treated desert-sand samples.
Sustainability 14 01770 g007
Figure 8. UPV value and average calcite content of different MICP-treated desert-sand samples.
Sustainability 14 01770 g008
Figure 9. Percentage of calcite content at all three solution depths for different treatment conditions.
Sustainability 14 01770 g009
Figure 10. SEM image for untreated sand at 150× magnification and 100 µm scale.
Sustainability 14 01770 g010
Figure 11. SEM images of different biotreated sand under different treatment conditions at 5000× magnification and 1 µm scale. (a) Showing 21 days SEM images with different PV, (b) Showing 14 days SEM images with different PV, (c) Showing 7 days SEM images with different PV.
Sustainability 14 01770 g011aSustainability 14 01770 g011bSustainability 14 01770 g011c
Figure 12. EDX analysis showing chemical peaks for sand (a) untreated desert sand (b) biotreated desert sand.
Sustainability 14 01770 g012aSustainability 14 01770 g012b
Table 1. Properties of desert sand.
PropertiesValueUnitIndian Standard (IS) Code
Cu1.83 IS:1498–1970, IS:1498-1970 2002
Cc1.09
D100.13mm
D300.18mm
D600.23mm
D500.21mm
OMC12.70%IS 2720-8 (1983): Part 8
MDD1.65g/cc
Permeability6.06∙10−6m/sIS 2720 (PART 17): 1986
Specific Gravity2.57 (IS-2720-PART-3-1980)
Silt Content10.23%IS 2386.2.1963
emax0.90 IS-2720-Part-15
emin0.62
Table 2. Comparison of present-study average UPV values with NEHRP (2003) in terms of shear-wave velocity (Vs m/s) and state of cementation.
Sample DesignationAverage UPV Value (m/s)Vs (m/s)State of CementationType of Sample
21 SP 0.8PV1762Vs > 1500Heavily cementedHard rock
21 SP 0.6PV1406760 < Vs < 1500Heavily cementedRock
21 SP 0.4PV1010760 < Vs < 1500Heavily cementedRock
14 SP 0.8PV1280760 < Vs < 1500Heavily cementedRock
14 SP 0.6PV1110760 < Vs < 1500Heavily cementedRock
14 SP 0.4PV770760 < Vs < 1500Heavily cementedRock
7 SP 0.8PV820760 < Vs < 1500Heavily cementedRock
7 SP 0.6PV650360 < Vs < 760Moderately cementedVery dense soil or soft rock
7 SP 0.4PV0---
Untreated sand 180No cementationLoose or young, untreated sand
Table 3. List of abbreviations.
AbbreviationDescription
MICPMicrobial-induced calcium carbonate precipitation
S. pasteuriiSporosarcina pasteurii
PVPore volume
STSSplit-tensile strength
UCSUnconfined compressive strength
SEMScanning electron microscope
EDXEnergy-dispersive X-ray analysis
UPVUltrasonic-pulse velocity
CuCoefficient of uniformity
CcCoefficient of curvature
D50Mean grain size
OMCOptimum moisture content
MDDMax dry density
GSpecific gravity
emaxMax void ratio
eminMin void ratio
NB Nutrient broth
ODOptical density
Publisher’s Note: MDPI stays neutral with regard to jurisdictional claims in published maps and institutional affiliations.

