1. Introduction
Last-mile delivery plays an essential role in the distribution of goods to people, providing the last phase of the supply chain. Therefore, it is crucial to design, plan, and manage it properly [
1]. This is even more important in urban areas, which are the “engine” of a territory’s economic growth, employment, and development. In urban areas, in fact, the demand for freight transport has increased considerably due to urbanization, population growth, e-commerce, and new technologies [
2]. Moreover, it is estimated that about 85% of the EU Gross Domestic Product is generated in European cities. In 2010, about 73% of European citizens lived in urban areas, and this percentage is expected to increase to more than 80% by 2050 [
3]. Due to the high level of commercial activities in urban areas, several European cities have been facing issues generated by transport systems, such as traffic congestion, safety, and air and noise pollution.
In terms of environmental impact and CO
2 emissions, the transport sector is second only to the production of electricity and heating, as it produces about 25% of total carbon dioxide emissions. It is estimated that carbon dioxide emissions generated by road, air, and sea transport represent 74%, 12% and 12%, respectively. These emissions have more than doubled in the last 45 years, with catastrophic implications for the planet and human life. Therefore, decarbonisation policies applied to the transport sector are essential to drastically reduce the climate and environmental impact while also ensuring economic and social sustainability of transport [
4,
5].
In June 2019, the European Commission estimated that the social and environmental impacts caused by transport in the European Union (EU) (i.e., greenhouse gas emissions, local air pollution, noise, energy production, damage to habitats, congestion, and accidents) is around €1 trillion per year. It is believed that about 50% of these costs relate to the urban environment. Road transport causes more than 80% of these costs, of which around €620 billion are due to passenger transport and around €200 billion to goods [
6].
The attention of politics and society towards the environment has increased in recent decades. The European Council has set the important objective for the EU to become climate neutral by 2050 by reducing greenhouse gas emissions by at least 55% by 2030 [
7,
8]. Increasing the share of collective transport, walking and cycling, automated, connected, and multimodal mobility will significantly contribute to reducing pollution and congestion caused by the transport sector, especially in cities. This in turn will improve health and well-being. Since cities play an essential role, they should remain at the forefront of the transition towards greater sustainability for the transport of both people and goods. The European Commission is evaluating the opportunity to develop plans and programs in the context of Climate Neutral and Intelligent Cities as a strategic priority for joint action to achieve decarbonisation in many European cities by 2030 [
9]. National and local measures to reduce air pollution have increased over the past decade, defining and adopting regulatory policies in the transport, energy, and economic development sectors [
10].
Recent studies have analysed the impacts and methods for economically quantifying the effects associated with different transportation systems [
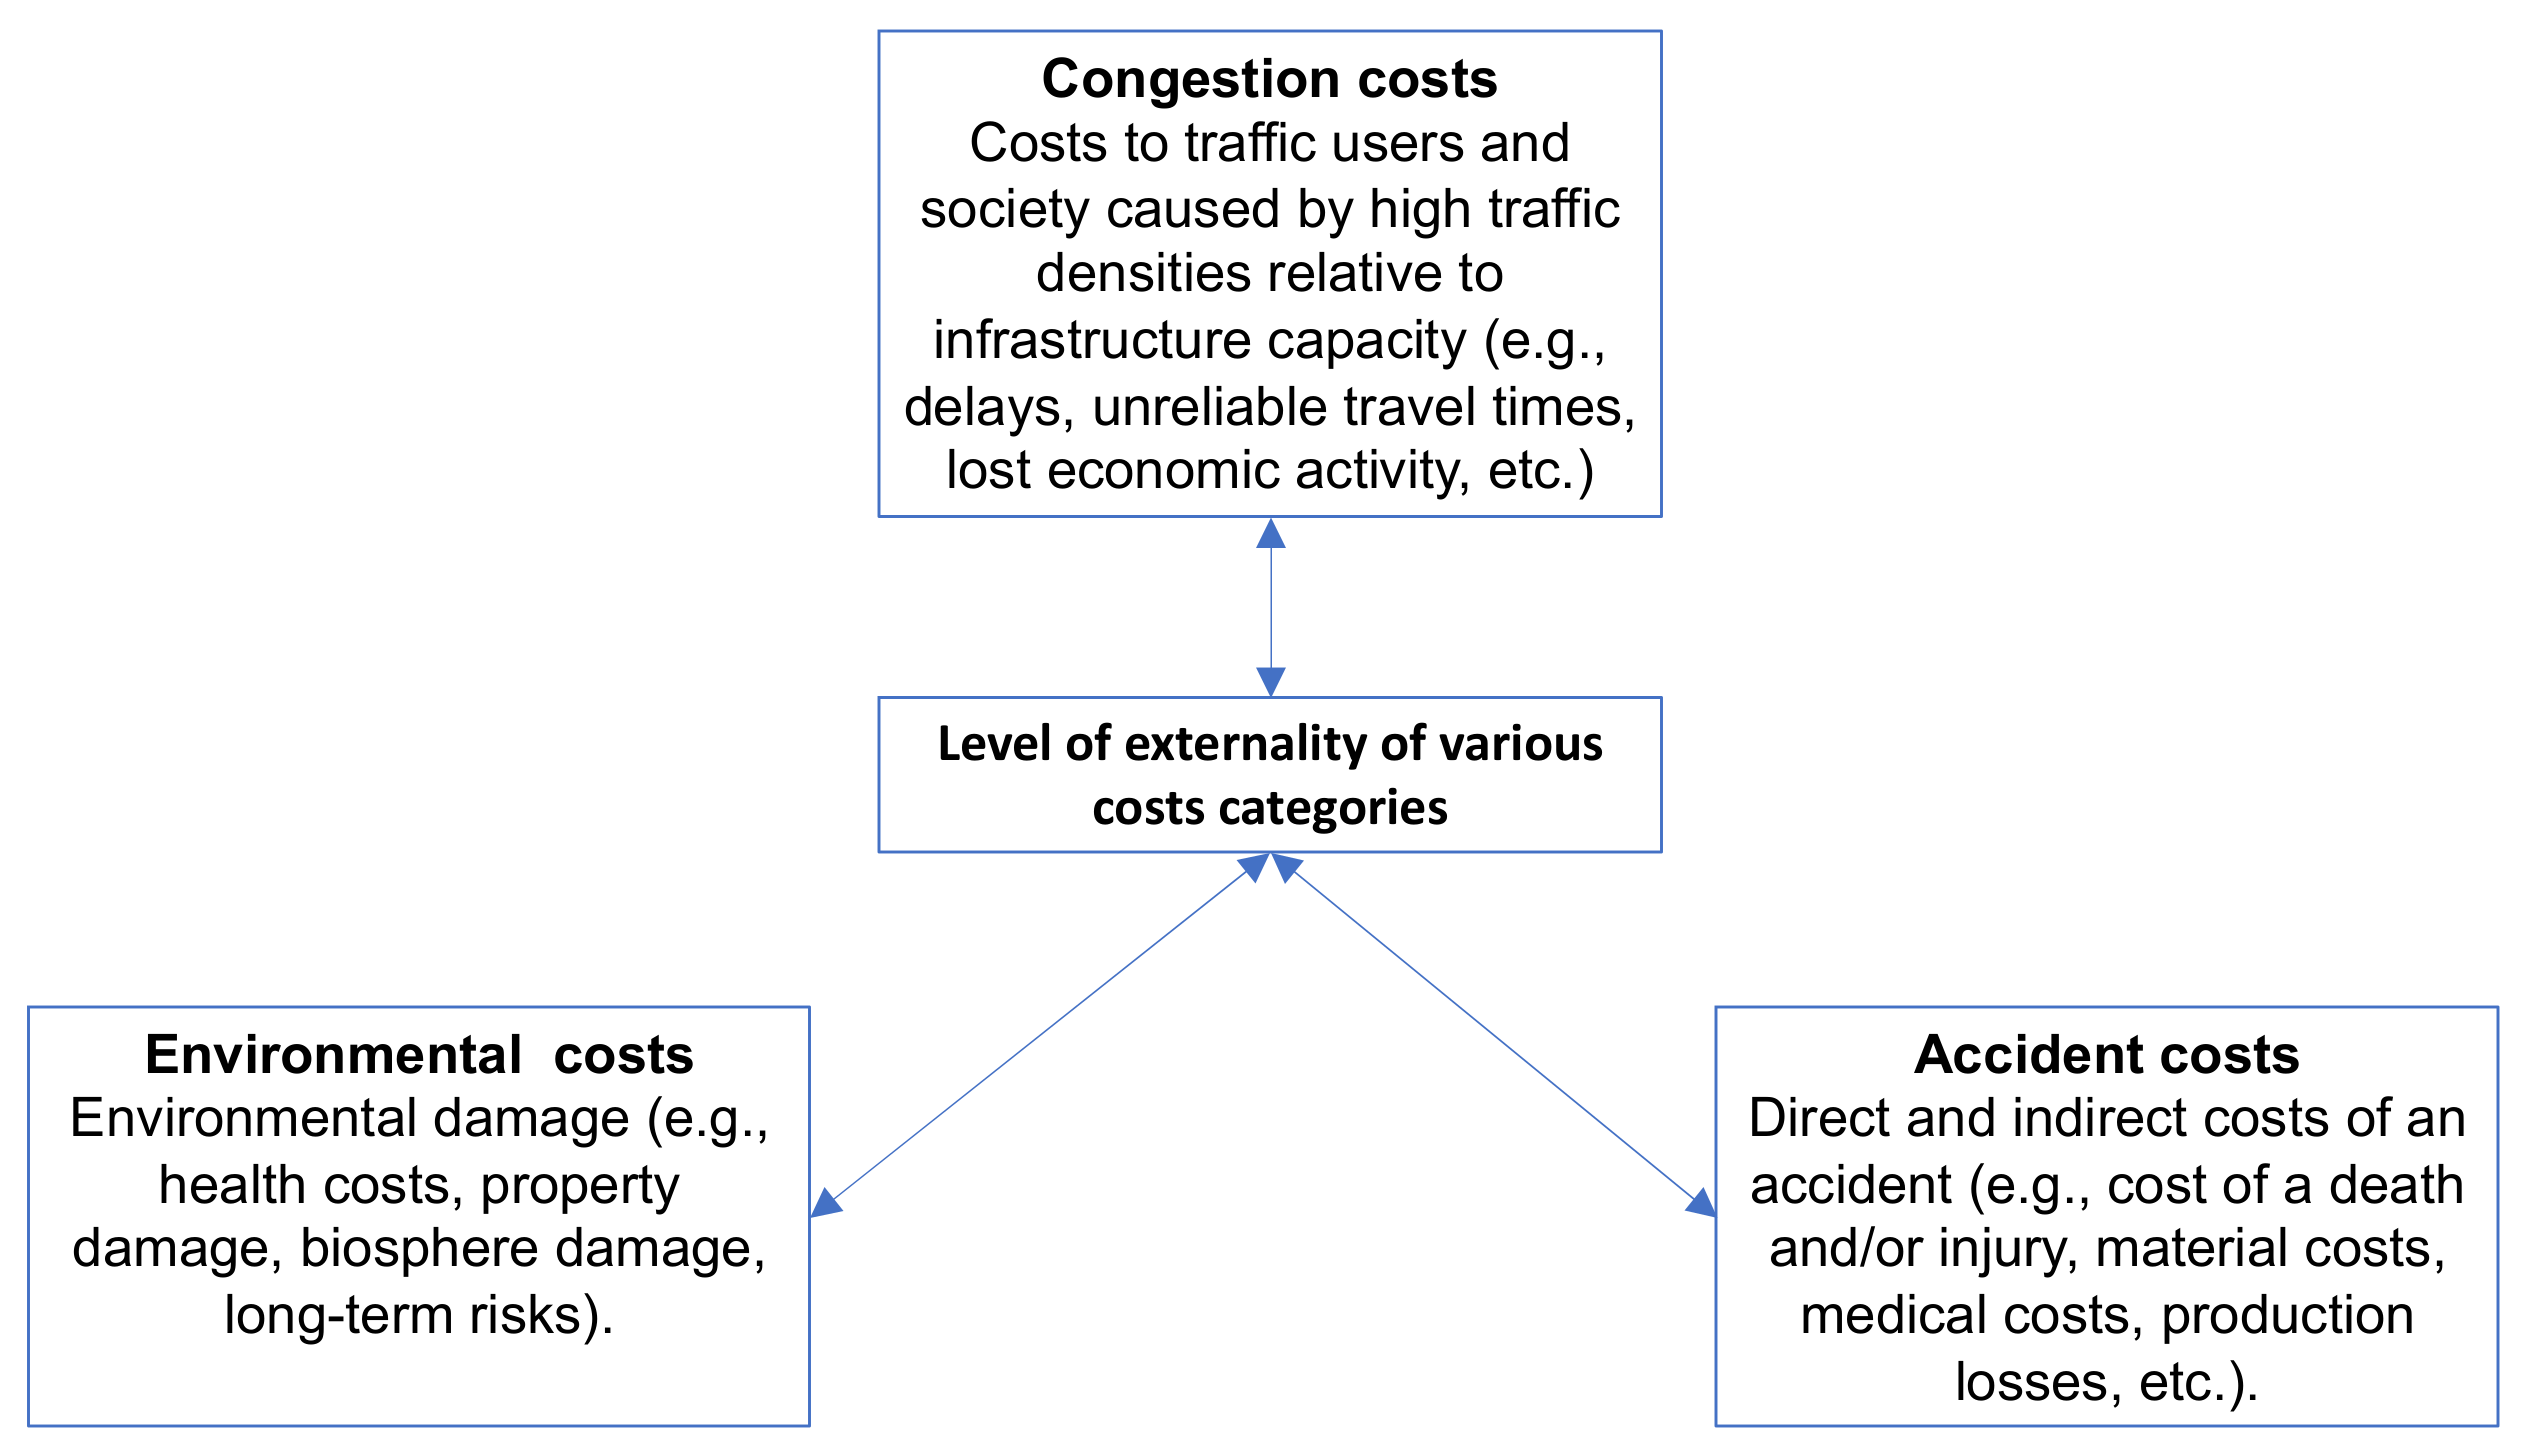
11]. External costs within transportation systems occur when: (i) the societal or economic activities of one group of people causes an impact on another group of people (e.g., the community) and (ii) this impact is not considered or compensated for by the first group of people. In general, the external costs of transportation are not paid by transportation users and therefore are not considered when decisions are made regarding different mobility solutions/alternatives. For example, the use of vehicles that produce pollutants can cause damage to human health over time, thus imposing external costs on the community. The impact on those who suffer health damage is not considered by the vehicle user when making the choice.
Figure 1. shows the different levels of externality caused by transport systems [
12].
The increase in e-commerce certainly has an impact on the supply chain, especially in urban areas, where the use of road vehicles produces traffic and congestion that reduce the efficiency of the transport system in terms of loss of time and money. Several studies have focused on reducing the externalities generated in last-mile delivery considering issues such as stations or proximity points, collaborative and cooperative urban logistics, and the use of electric and/or autonomous vehicles. Current solutions have a systemic approach, setting up depots spread throughout neighbourhoods where distribution is carried out using electric vehicles [
13,
14].
Other studies have addressed the issue of city logistics with the objectives of improving and optimizing the distribution of goods and increasing safety while reducing negative impacts such as pollution and traffic [
15]. City logistics must be addressed in a multidisciplinary way, addressing organizational, safety, economic, environmental, and engineering aspects. Furthermore, the different relationships between the stakeholders involved (e.g., shippers, suppliers, retailers, consumers, and local authorities) need to be adequately addressed in order to implement sustainable city logistics [
16].
Patella et al. (2020) showed that interest in using green vehicles in urban logistics has increased significantly as documented by the growing number of publications on this topic in recent years. In the study, three main categories are identified with respect to the various perspectives of papers dealing with urban logistics: (i) Optimization and Planning (O), (ii) Policy (P), and (iii) Sustainability (S) [
17].
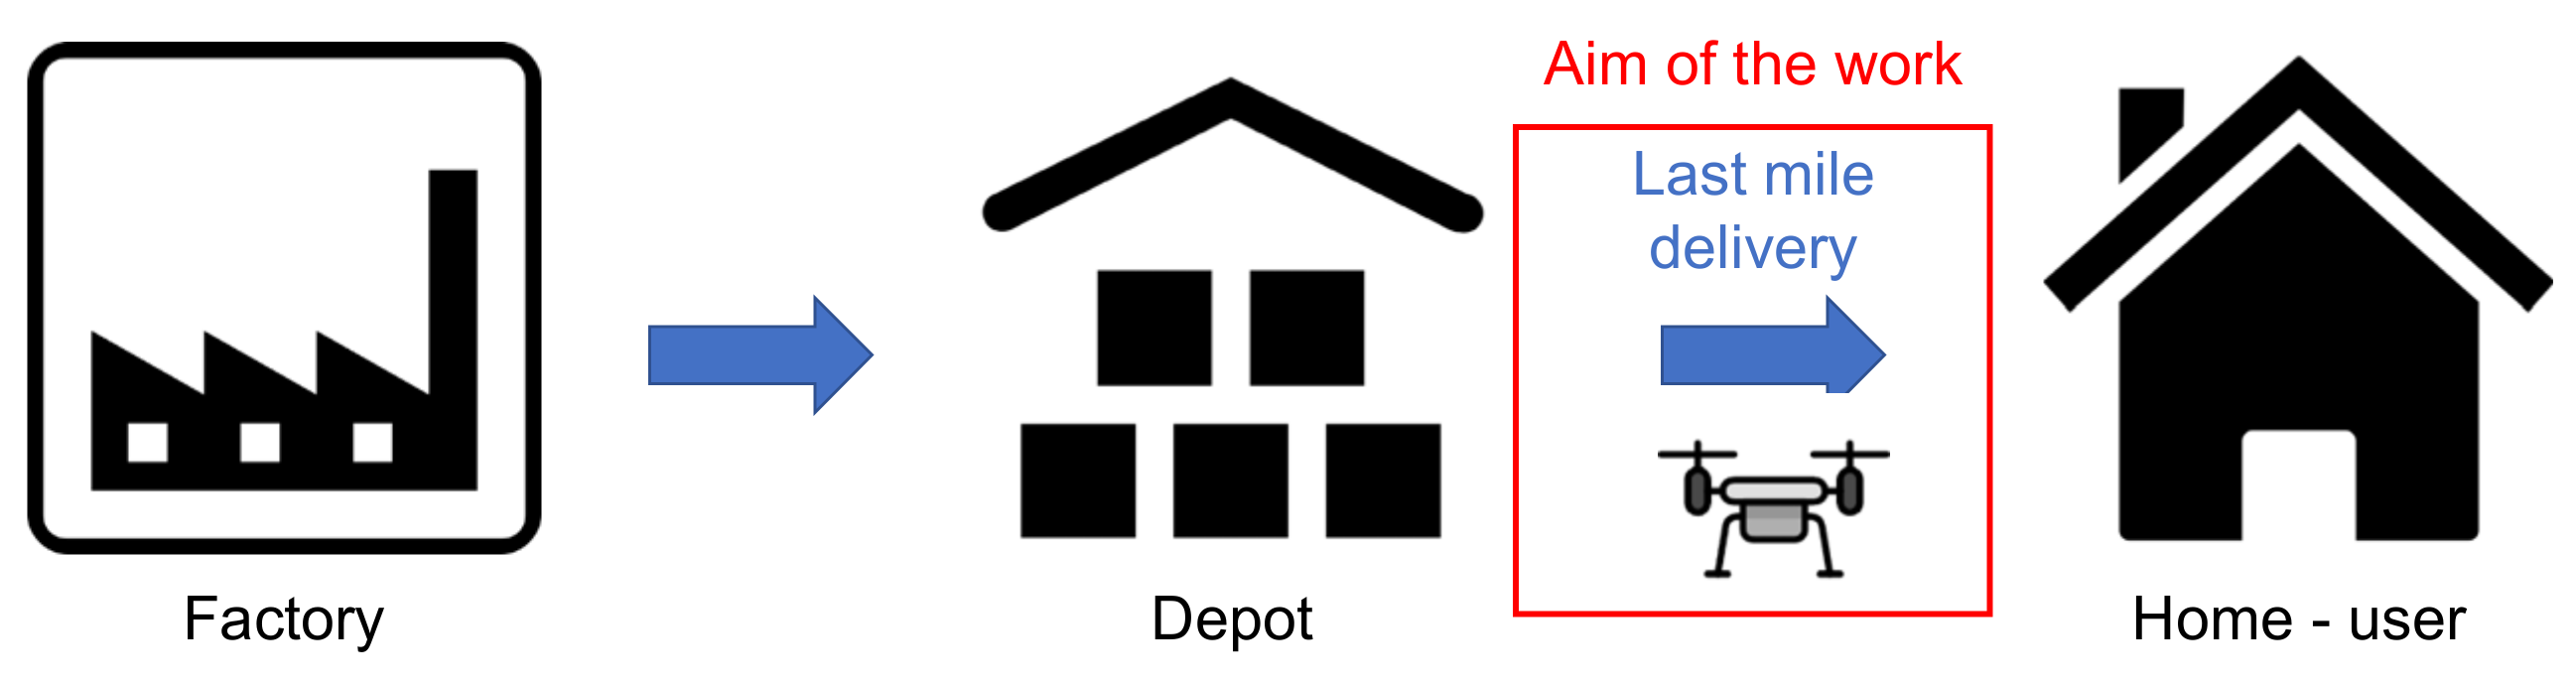
The goal of this study is to analyse the feasibility of a last-mile delivery service with a fleet of drones for a numerical case study concerning the city of Milan (Italy) as shown in
Figure 2.
A survey to analyse the propensity of customers to use such a service has been designed and carried out. Using the survey results, a transport service proposal was designed for the city of Milan by drones, and a financial analysis was carried out to assess the service’s financial sustainability. The main contribution of this study lies in a preliminary feasibility study of a last-mile delivery service by using drones for a numerical case study. Another aspect of this research regards the use of a Stated Preference (SP) survey to assess the propensity of end consumers towards the use of drones as delivery transport system.
The paper is organized as follows. In
Section 2, a literature review on last-mile logistics via drones is provided. In
Section 3, the proposed methodology is presented with respect to (i) SP analysis regarding potential customers of a drone delivery service, (ii) financial feasibility analysis. In
Section 4, the numerical case study of a last-mile delivery service for the city of Milan is described. Finally, in
Section 5, some conclusions and possible future developments are proposed.
2. Literature Review
Last-mile delivery consists in the distribution of goods to customers. This phase is one of the most critical for supply chains as it represents the last stage, where the contact with the final customer takes place. Moreover, this phase is often performed in urban areas, where issues related to environmental pollution, parking, and travel times are particularly critical.
The process of transporting goods does not encounter any criticality until the packages have to be sorted for delivery to the recipients: the closer a product gets to its final destination, the more the unit cost of transport increases, reaching its peak in the last mile. The last mile, in fact, represents the most expensive and complex phase of the entire delivery process since the delivery costs are no longer shared with other packages (or only in a limited way) and the delivery of each package becomes single [
18]. This phase represents the so-called “last-mile challenge” faced by many scholars and logistics practitioners. This is even more crucial in rural areas where population density is lower, and packages are more dispersed across the territory: this leads to a more miles travelled in a non-clustered fashion.
In recent years, the formidable development of e-commerce has imposed new challenges. The number of deliveries has increased significantly as has the demand for faster delivery. In many cases, this has led to an increase in urban traffic congestion, which has often prompted city administrations to adopt strict regulation of motorized mobility in urban centres. With this in mind, urban planners and policymakers must perform analyses and assessments of future scenarios considering: (i) technological changes, (ii) business model evolutions/innovations, and (iii) the spatiotemporal changes that these innovations will produce [
19]. The need for speed, coupled with notions related to environmental and social issues, paves the way for this use of drones.
Drones, also called Unmanned Aerial Vehicles (UAVs), are aircrafts whose flight functions are entrusted to the on-board computer or are performed remotely. These vehicles do not include a pilot or passengers on board. Drones would enable for quick deliveries as they are not subject to traffic on roads and, at the same time, environmentally friendly as their motors are electric. However, adverse weather conditions, complex urban scenarios, and end-customer identification issues are some of the aspects that need to be analysed when designing a last-mile delivery service with drones.
Jung and Kim’s research considers the possibility of using drones to deliver small packages to remote islands in various logistical dead zones [
20]. The cost reduction compared to traditional ground-based delivery means, combined with CO
2 reduction, is analysed by [
21] with a mixed-integer (0–1 linear) green routing model. The benefits of using drones for last-mile deliveries in Europe are also investigated in [
18]. Their analysis indicates that in the most technologically realistic scenario, up to 7% of European citizens could have access to last-mile delivery services with drones; a percentage that would increase to 30% in scenarios with high technological improvement. In Italy, drone delivery coverage could be 20% of the population.
End users choose drone deliveries mainly based on the increase in product value and the urgency of delivery [
22].
Thanks to artificial intelligence, drones can fly autonomously and make decisions without necessarily the aid of a pilot on the ground. In [
23] it is shown that drones can achieve an increasingly targeted response, for example to sudden wind gusts, based on previous experience. Drones also need to be able to send communications to the warehouse, for example in case of an emergency. Therefore, they require a constant connection to a cellular antenna and, depending on the signal strength, may need to change the connection antenna [
24]. Adverse weather conditions can be a major limitation of drone delivery; therefore, to ensure delivery, parallel use of ground vehicles must be provided when drones cannot fly [
25].
Today there are two possible alternatives for drone delivery of goods: (i) autonomous, i.e., the drone departs from the depot, delivers, and returns to the starting point, (ii) coupled with a van that acts as a depot and charging station for the drone. The latter solution involves the transition from the Traveling Salesman Problem (TSP) to the Clustered General Traveling Salesman Problem (CGTSP). The TSP requires the ground vehicle (i.e., the van) to reach each customer point by taking the shortest distance route, while the CGTSP requires the van to touch only one point per cluster into which the served area is divided, and each node contained in the cluster is met by the drones. The CGTSP is defined as finding the shortest path that satisfies two requirements: the path visits exactly one node per sub-cluster; within each cluster each node is visited. Consequently, the van has to reach reaching only one node of each sub-cluster and then it is up to the drones to visit all nodes contained within it [
26].
The partitioning of delivery points within a cluster has been studied, for example by [
27] where they evaluated how to perform an efficient partitioning considering two cases: (i) a single node within the cluster, which is then served by the ground vehicle, (ii) multiple delivery points within a cluster, which assumes the parallel use of drones. A new routing model is also proposed by [
28] in which van-drone synchronization is considered; multiple drones fly from a van to reach end customers and then return to the van to recharge or retrieve other packages to be delivered. The number of drones carried by the van and the delivery time are inversely proportional, as demonstrated using a heuristic approach by [
29]: as the number of drones increases, there is a drastic drop-in delivery time as more tasks can be performed simultaneously.
The type of delivery using drones in autonomous flight from an urban distribution centre to end customers is analysed in [
30] with a review of existing literature dedicated to drone path optimization problems. The main limitation is the dependence of the route on time, since each drone has a maximum flight range to be respected. The flight time of the drone is also a function of the weight of the load (i.e., of the packages): as the weight increases, the time decreases [
31]. In [
32], the authors optimize the drone route according to energy constraints, trying to locate urban distribution centres along the city perimeter. The problem of drone autonomy can be addressed with a series of charging stations to be placed in the city, as suggested by [
33]. Obviously, this solution has a significant impact on the urban environment.
Furthermore, in the work of [
34] the aim was to size the fleet and battery charging of drones in urban areas considering the issues of range and energy consumption. Two optimization solutions were proposed within the work: (i) the first one consisted in planning missions by reducing the distance; (ii) the second one identified a compromise between the distance and the number of drones [
34]. Still with reference to the range issue, the work of Pinto and Lagorio addressed the issue of extending the range of drones: the possibility of recharging drones during the journey to their final destinations using appropriately placed recharging stations were considered [
35].
A further literature review was conducted by [
36], in which operational research contributions on drone-aided routing problems were evaluated considering the time horizon 2015–2020 [
36].
The final phase of delivery to the customer is probably the most challenging especially for the identification of the landing area. This area must be of adequate size for safety purposes, such as rooftops [
37] or balconies of private houses [
38], private gardens and courtyards or lockers arranged in the city. Proper identification and recognition of the end customer is another aspect to be investigated as proposed by [
39].
In recent years, some companies have started to develop and design drones for package delivery in different sectors such as e-commerce and medicine. Amazon, UPS, DHL, and others are evaluating solutions to deliver packages safely and efficiently by performing real-world tests. Furthermore, in the medical sector, several researchers are studying the use of drones in mountainous territories where response times can be longer. In this case, the use of drones equipped with Automatic External Defibrillators (AED) capable of intervening in case of sudden cardiac arrest is being evaluated [
40,
41,
42].
Since last-mile delivery by drones is still an experimental solution, not yet widespread and established, studying people’s propensity towards this mode of transport is a necessary step towards greater drone adoption. In [
43], the authors assessed the perceived risks of the American population mainly associated with accidents or terrorist actions. The fear that drones may intentionally hit people or private homes also emerged from the study of [
44], which considers the American population. In contrast, according to the study proposed by [
45], the German population seems to be very inclined to use drones for final delivery. In the study of Osakwe et al., the need to investigate the willingness of consumers to accept the use of drones is highlighted. Specifically, the study aims to investigate consumers’ interest in using drones for last-mile delivery by applying social cognitive theory and the goal-directed behaviour model [
46].
To summarize, the review of the scientific and technical literature shows that many scholars are analysing the application of drones for urban delivery of goods. Therefore, it is possible to group the different works into four macro categories, which in fact represent the main challenges and lines of research. The aspects addressed by the scholars are: (i) the drone routing problem; (ii) the drone assignment problem; (iii) the charging process and the location of charging stations; and (iv) the fleet sizing [
47].
In addition to these issues, the topics of safety and reliability but also environmental impacts are analysed. Focusing on fleet sizing, this study investigates two additional issues: (i) the interest of users to choose drones for goods delivery, (ii) a financial evaluation of the service. Regarding (i), SP surveys are used to estimate the probability of choosing a drone by a potential user over the traditional delivery system (van, scooter, bicycle). Regarding (ii), in this study the viewpoint of a company that could manage the delivery service of goods by using drones is analysed. Thus, this study represents a starting point of research in which the goal is to provide a useful tool for researchers, policy makers, technicians, and practitioners in this field to analyse and evaluate how recent innovations and technologies could affect the externalities generated by urban freight transportation by improving efficiency in last-mile delivery.
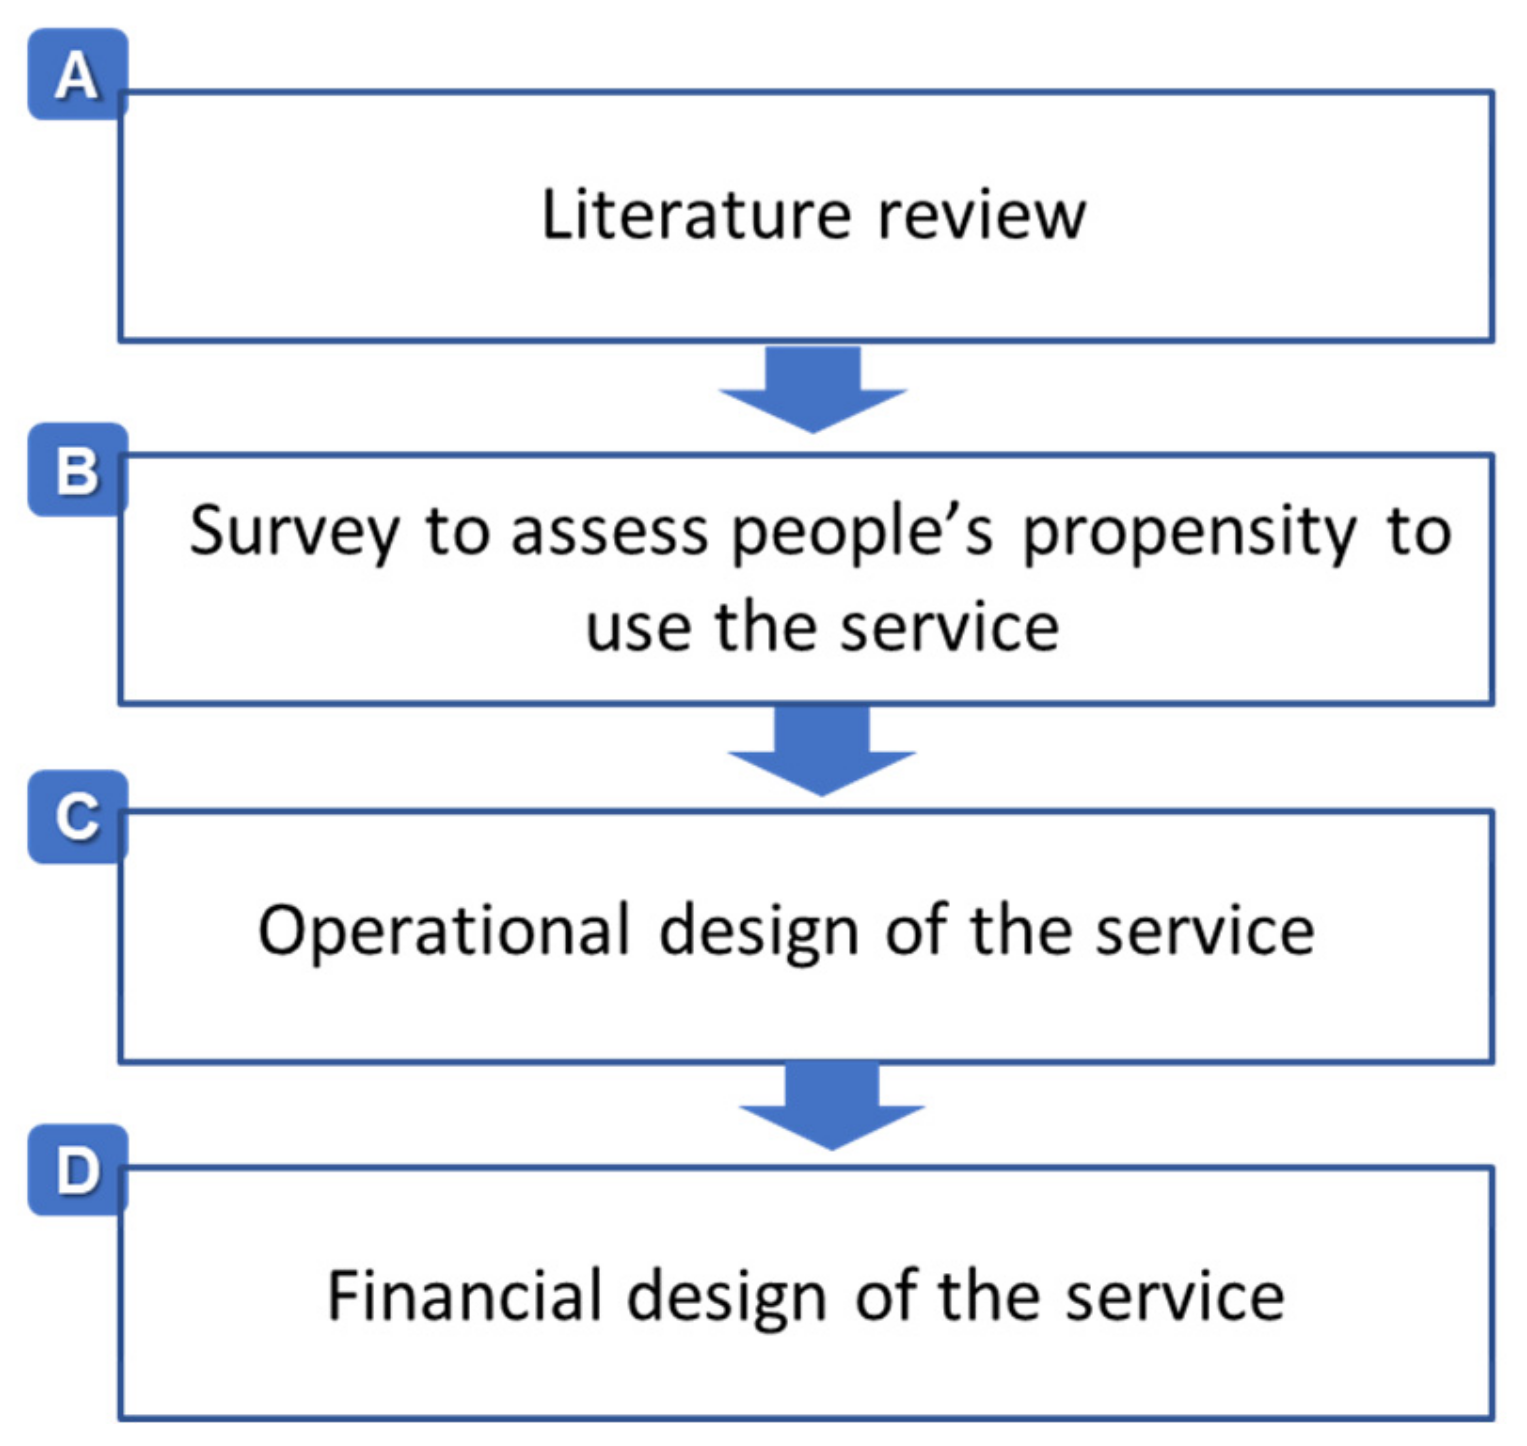
3. Methodology
The methodology adopted in this research is presented in
Figure 3.
Once the literature related to last-mile delivery and the use of drones was analysed (A), an SP survey was conducted to assess people’s propensity to use drones as a last-mile mode of transportation instead of other traditional modes (i.e., van, bicycle, scooter) (B). Once the response acquisition phase was completed, the multinomial Logit model was applied to estimate the probability with which people choose an alternative, based on the importance that each attribute gained after the calibration phase. More specifically, with the calibration process the most relevant parameter is obtained for each attribute and, according to the value assumed from such parameter, it is possible to estimate which are the disutilities most perceived (being analysed costs and times, the parameters take on a negative value), as detailed in
Section 3.1. Next, the sizing of such a service using drones in a city is proposed (C), along with a financial feasibility analysis for a company providing such a type of transport (D), as better explained in
Section 3.2.
3.1. Stated Preference Analysis
A demand analysis is needed to evaluate the probability of users to adopt the drone modality for freight delivery service over other alternatives. This task can be accomplished by investigating the utility that a rational decision maker attributes to each alternative using probabilistic models that reproduce the behaviour of the user. The fundamental hypothesis underlying these models consists of a rational decision maker, or a subject, making choices based on maximizing the perceived utility. Thus, one must formulate, calibrate, and validate models that aim to estimate demand by simulating the user’s decision-making mechanism. These models do not dwell on the psychological mechanism that leads to a certain choice but stop at the outcome of this process.
Nevertheless, a specific survey should be conducted before establishing the models. This can be accomplished by using SP surveys. These are questionnaires that aim to collect data on the stated behaviour of users towards hypothetical available contexts. More precisely, they are tools to estimate the demand function or define the conditions for which users choose one vehicle over another to meet their transportation needs. SP surveys have some disadvantages such as possible bias due to the divergence between stated and observed behaviours. However, they also have many advantages, e.g., introduction of alternatives and attributes not currently available in the actual choice context, more information at the same cost as each interviewee is subjected to multiple choice contexts. These advantages make SP surveys to be adopted for many transportation purposes. SP surveys need to define: (i) choice alternatives; (ii) attributes for each alternative; (iii) range variation for each attribute. A combination of alternatives and attributes results in a scenario, so it is important to (iv) define the choice criterion (i.e., in this case, the subject indicates which delivery method would prefer for each scenario).
When the SP surveys have been completed, a model should be fitted to the collected data. In this study, multinomial logit models are adopted. They are characterized by the Weibull-Gumbel law according to which random residuals are identically and independently distributed: the first condition indicates the equality of the variances of the residuals; the second condition means that the covariance is null.
For modelling purpose, let us denote with:
J, the set of alternative and j J an alternative;
Q, the set of decision makers and qQ a decision maker;
, the Weibull-Gumbel variable;
X, the set of attributes and x X an attribute;
, the systematic utility function, i.e., the function for alternative jJ, which is believed to be actually perceived by decision maker qQ, according to a pool of attributes x X;
Β, the coefficients of the maximum likelihood function to be estimated.
If a decision maker
q Q choices alternative
j J, then the probability that decision maker
q Q chooses alternative
j J, denoted by
is computed as follows:
In order to estimate the model, the Maximum Likelihood Criterion (MLC) is adopted. This criterion returns the values of the unknown coefficients by maximising the probability of the choices made by decision maker
q Q. The MLC, which is denoted by
L, is computed as follows:
The function expressed by (2) defines the probability of examining the set of choices of decision makers as the product of the probabilities that q Q chooses the alternative j J. This solution is selected by the decision maker q Q, provided that the scenarios are independent. Therefore, this fact presupposes that the choice of q Q must not be conditional on that of the other decision makers.
Once
is specified, its estimation must be performed to calibrate the coefficients. Because L may be tricky to estimate using the form returned by Equation (2), a manipulation of
can help maximise it more easily than the original form. Therefore, the logarithm of L is sought, and L is formulated as a log-linear model, as follows:
The values returned by Equation (3) are independent of the coefficients to be estimated, but depend on the ratio between
and
for each
x X. Therefore, the following parameters should be estimated:
3.2. Financial Design of the Service
The financial design methodology for a last-mile delivery service via drone is presented below. The perspective is that of a company offering this type of service.
For modelling purposes, let us denote with:
P, the number of packages to be delivered per year;
, the number of packages to be delivered per year by a drone;
, the number of packages daily delivered by each drone;
D, the number of drones used to deliver the service;
, the purchase cost of a drone [€/drone];
, the useful life of a drone [years];
, the daily consumption of a drone [KW];
, the unitary energy cost [€/KW];
, the number of days per week;
, the number of weeks per year;
, the total cost for each drone used to operate the service;
, the annual amortization charge for the purchase of a drone;
, the costs of purchasing software to operate a drone and its maintenance service;
, the energy cost for each drone;
, the cost of renting a van;
, the cost for the driver of a van;
, the cost of fuel;
, the amount of packages delivered by a van per year;
, the cost of delivering a package by drone [€/package];
, the cost of delivering a package by drone in case of bad weather [€/package];
, the number of packages delivered daily by drone in case of bad weather;
, the number of packages delivered daily by van in case of bad weather;
, the number of bad weather days [day/year];
, the cost for a package delivered by van [€/delivery];
, the total cost incurred by the logistics operator to provide the entire service;
CDRO, the total cost related to all drones;
CDEP, the cost of renting all depots;
W, the number of depots;
q, the cost of renting the depot [€/sqm];
a, the area of a depot [sqm];
, the cost for the equipment of all depots, which takes into account the positioning of the conveyor and all systems for sorting the packages;
c, the cost of the conveyor per meter [€/m];
l, the length of the conveyor [m];
, the cost of energy to recharge the drone batteries and to operate the depot;
e, the unit cost of energy [€/kW];
δ, the average energy consumption of a depot [kW/year];
r, the daily revenue of the logistic company;
R, the total annual revenue of the logistic company;
f, the user fare;
U, the average number of potential daily users.
The cost
incurred by the logistic company for each drone used to operate the service is provided by Equation (5) [
48], as the sum of the terms
(Equation (6)),
, and
(Equation (7)).
The number of packages
to be delivered daily by a single drone is calculated as the minimum number of deliveries that a drone can perform in a particular city considering its flight and recharging times. Therefore, the number of packages
to be delivered annually by a drone is defined by Equation (8).
Once
is computed, D can be calculated, which is the number of drones required to meet the total annual demand for
P packages, as shown by Equation (9):
Dividing the total drone cost
by the number of annual deliveries
, the unitary daily delivery cost
by using drones is obtained by applying Equation (10).
Since drones cannot fly in all possible weather conditions, the unit daily delivery cost is higher (i.e.,
), when considering the case where a fleet of vans, hybrid and rented, is used during bad weather days. This cost is expressed by Equation (11):
where
,
and
are given by Equations (12)–(14), respectively.
The total cost
incurred by the logistics operator for providing the entire service per year, i.e., involving the use of the entire drone fleet, is provided by Equation (15). This cost is composed of the following terms: the cost to operate the fleet of drones (Equation (16)), the costs to lease (Equations (17)) and equip the depot (Equations (18)), and the energy cost (Equation (19)).
The daily revenue
r of the logistic company is given by (20):
The yearly revenue
r of the logistic company is, therefore, given by Equation (21).
4. Numerical Case Study: Description and Results
The methodology explained in
Section 3 was applied to a numerical case study in Milan, Italy.
4.1. Drones Characteristics
Drones are assumed to operate in an autonomous flight regime. In the flight preparation phase, this regime is planned by a computer that provides the flight control system with the route to be followed and the position of fixed obstacles to be avoided during the journey. The supporting structure of the drone is the frame and can be made of different materials, the choice of which is a decisive factor for the strength of the drone, its weight and, thus, its flight range. The size of the frame also influences the aerial performance of a drone: the larger the diameter, the greater the flight stability; vice versa, the greater the weight of the drone, the greater the energy expenditure. The load limit value is calculated as a compromise between the transportable weight and the flight range. For this reason, light-weight small load drones with good flight range are preferred for last-mile deliveries.
In this case study, an octocopter drone (with eight engines and eight propellers) with the characteristics shown in
Table 1. was considered. The flight autonomy of the drone, which is related to the recharge time of the accumulators, is assumed to be constant regardless of the payload carried which, as a precaution, is always considered at its maximum value.
4.2. Stated Preferences Survey
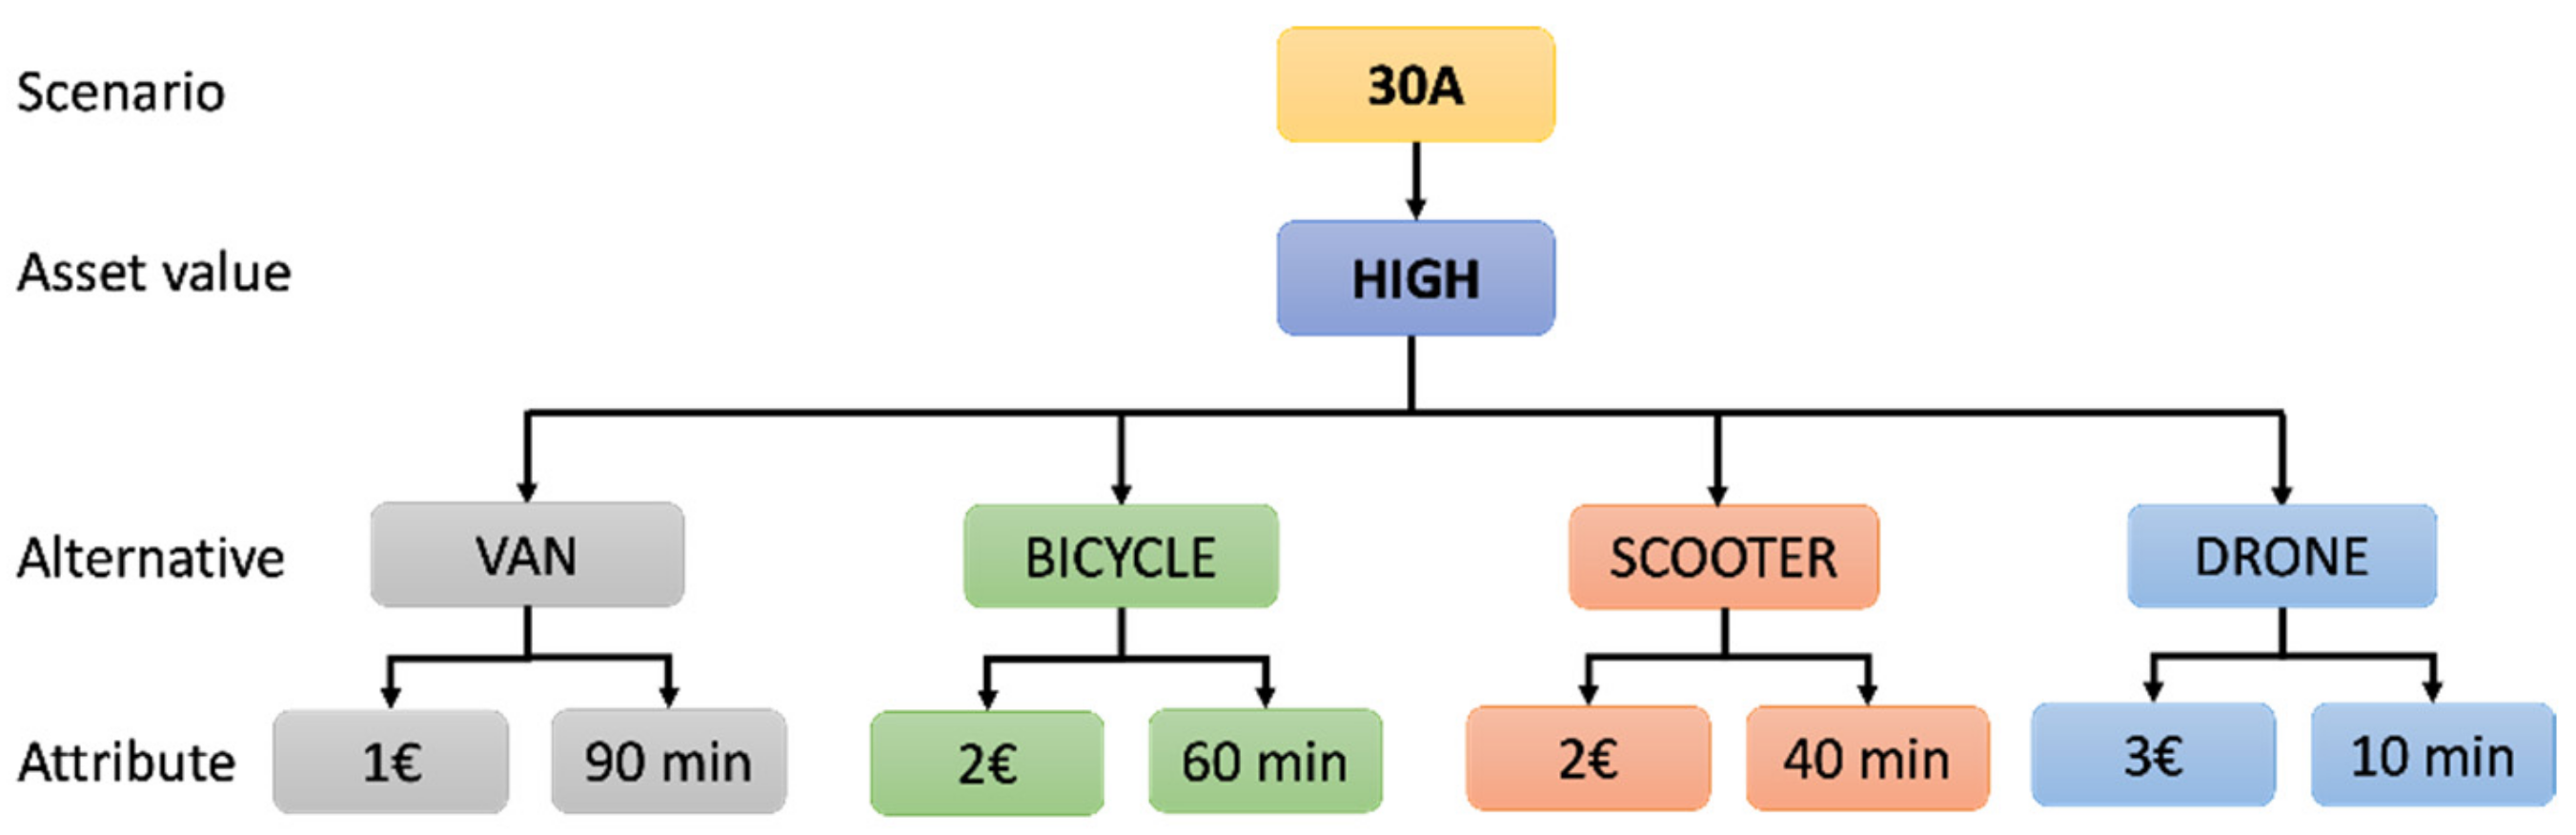
SP surveys were conducted through the online Google Form tool and distributed primarily through social channels, such as Instagram and WhatsApp. The total number of respondents were 100. The survey was planned on four delivery alternatives: (i) van; (ii) bicycle; (iii) scooter; and (iv) drone. Three attributes were considered the most relevant: (i) delivery fare; (ii) time, and (iii) value of the asset as represented in
Table 2. The four analysed alternatives can be grouped in pairs so that they have some aspects in common and some in contrast. In particular, van and scooter both represent two means of transport with internal combustion, therefore characterized by atmospheric emissions; on the other hand, they respectively reproduce the “slow” and “fast” solution.
Bicycle and drone are two sustainable vehicles; the former works through muscle power and the latter is electrically powered. Again, these are two opposite vehicles in terms of delivery speed: the bicycle can be considered a “slow” vehicle while the drone is a “fast” vehicle.
The attributes related to the cost and time of delivery were chosen because they can be considered characteristic elements of the service. Furthermore, the value of the asset was considered in order to evaluate how this attribute can influence the choice of the vehicle. For each of the four alternatives, two levels of variation of the attributes have been defined: this choice represents a good compromise between quality of the expected result and computational burden. In fact, the Complete Factorial Plan is composed of 256 scenarios; 32 blocks containing eight scenarios were defined using the block breakdown technique.
With reference to
Table 2, three attributes were considered with two levels of variation with the exception of the delivery cost per van characterized by a single level of variation.
As an example,
Figure 4. shows the structure of a scenario from the SP survey (30A) of scenarios.
Model Calibration and Sensitivity Analysis
The calibration of the multinomial logit model involved the calculation of the likelihood function for each scenario, assuming the values of the alpha parameter. Next, the log-likelihood function of each scenario was calculated. The sum of all individual values yielded the function to be maximized.
Using the Excel solver tool, it was possible to maximize the function by setting the following constraints:
The results of the SP survey show that when the product to be delivered has a high economic value, the delivery time is the determining factor in the user’s decision-making process. In the case of a good of low economic value, it is generally the delivery fare that takes on a greater weight in the choice of the means of transport.
With the results collected from the SP survey, the multinomial Logit model was calibrated, using the maximum likelihood criterion. Analysing the values of the coefficients obtained as the output of the calibration, it emerges that the van and bicycle fare are the attributes with the greatest weight in the decision-making process, i.e., they are evaluated as the elements of greatest disutility for the end customer.
After the model calibration, a sensitivity analysis was conducted to assess the trend in the probability of choosing a vehicle based on the value of an attribute once the others were fixed. The analysis revealed that the probability of choosing the drone is always high, compared to other vehicles. This preference is surely due to the speed of delivery time, which was almost always a determining factor in the choice. The exception is the case of low-value goods for which the vehicle fare was also a significant factor.
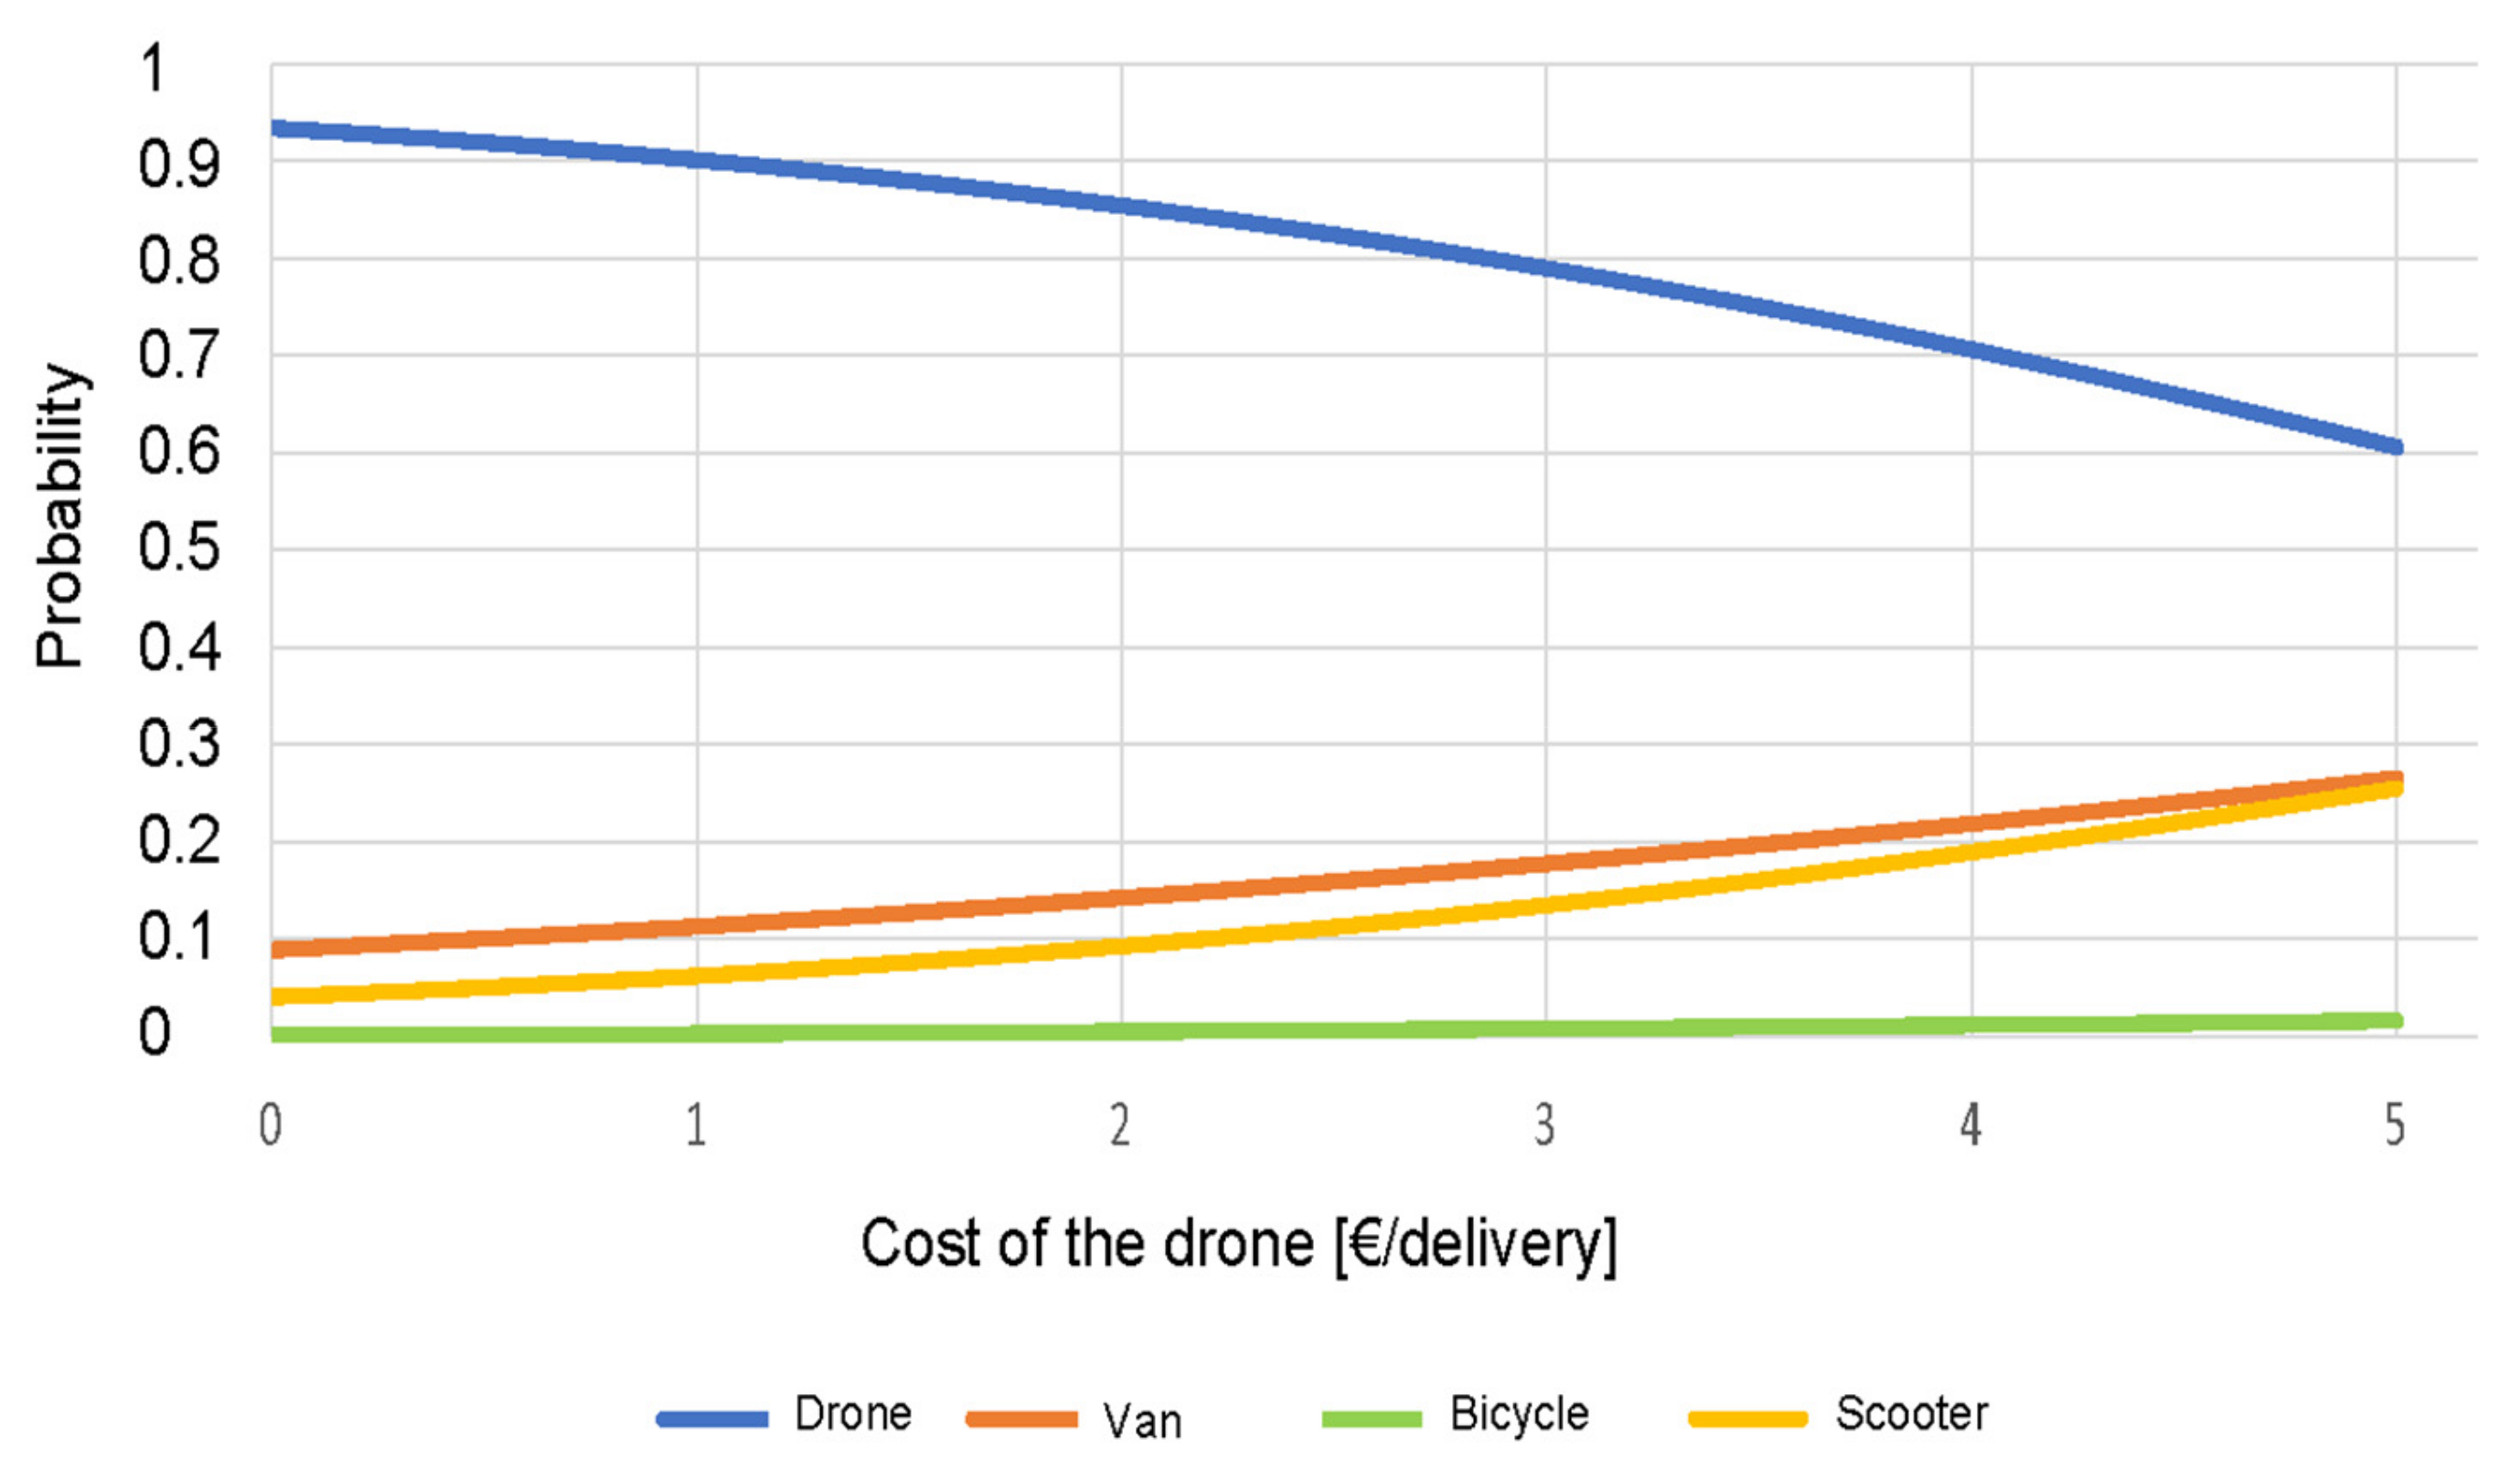
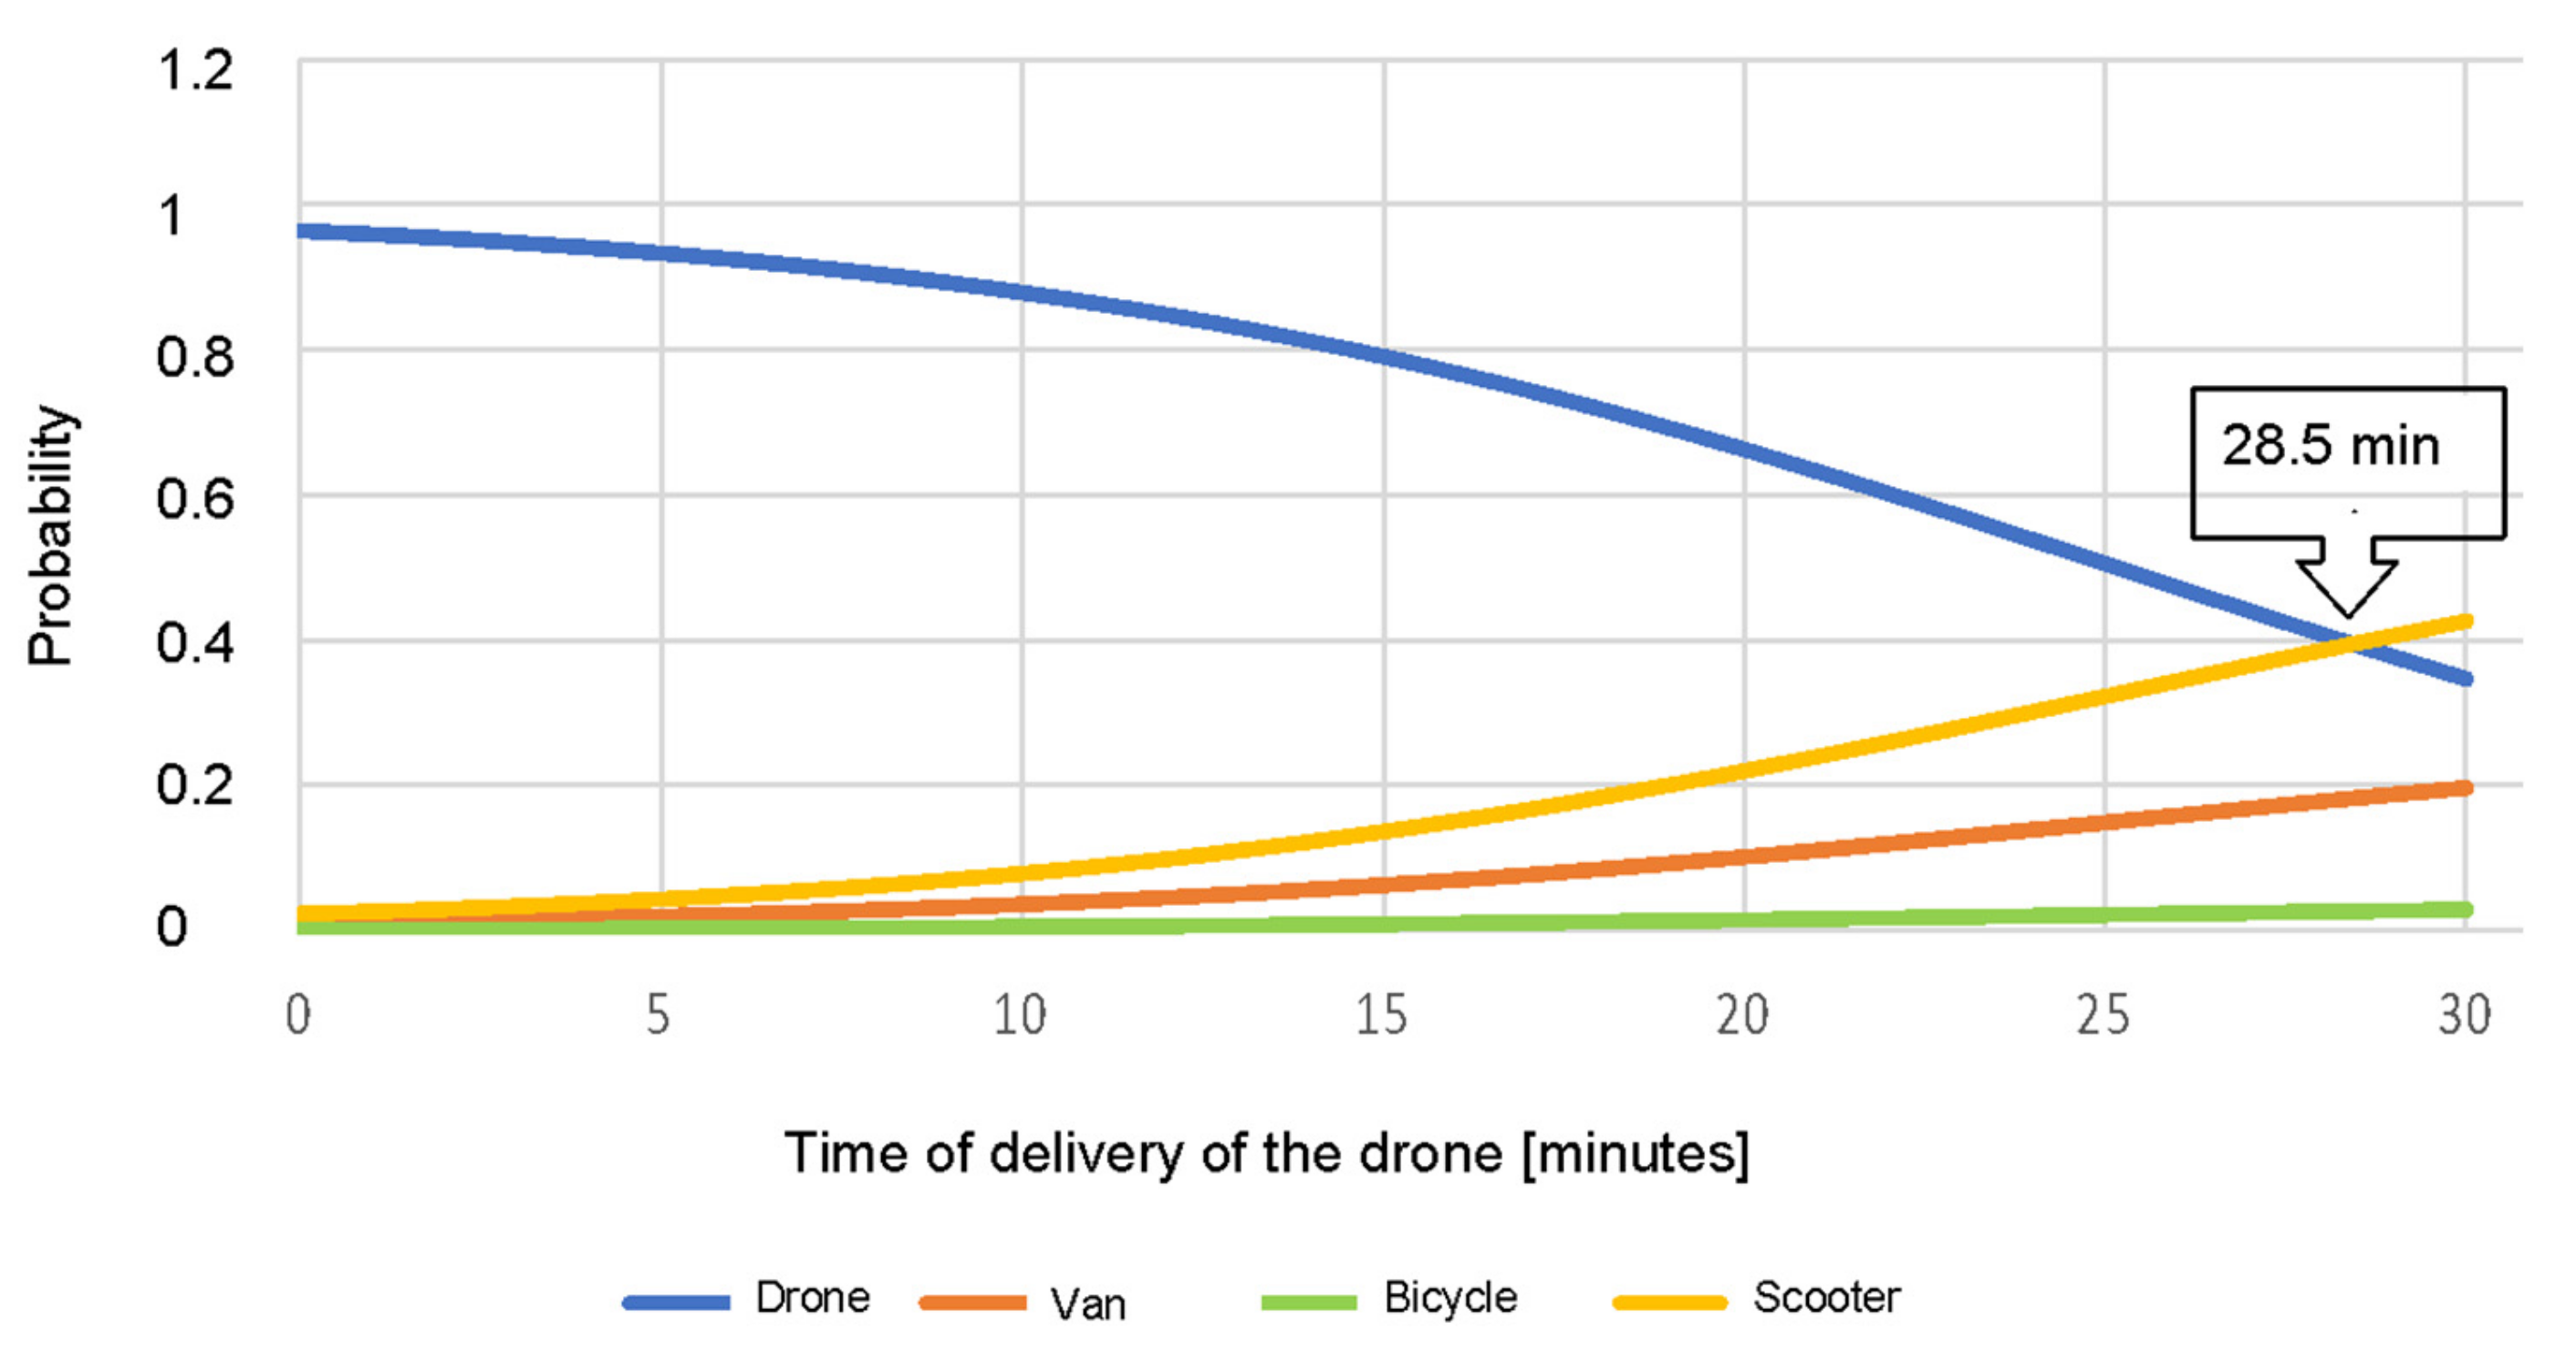
As results of the SP survey,
Figure 5 and
Figure 6 show the likelihood of choosing one of the possible transportation services (i.e., drone, van, bicycle, or scooter) relative to the cost and timing of the drone. More specifically, when the user’s fare is included in a range between 1 and 5 €/delivery, the drone is always the best choice, mainly due to its faster speed of delivery. However, its convenience decreases in favour of the van and scooter choice. Analogously, for small delivery times, the drone is considered the best choice, but when this time increases, other modes become more convenient. In particular, when the delivery time is higher than 28.5 min, the scooter becomes the preferred vehicle for the service.
4.3. Operational Sizing of Last-Mile Delivery Services with Drones in the City of Milan
Designing a last-mile logistics service using only drones assumes their use in autonomous flight from urban freight depots to end customers. This delivery method requires a change in the current structure of depots to make it suitable for the effective use of drones. More specifically, depots must be located to consider the flight needs of drones-in terms of flight range, allowing them to reach every point of the urban area. Moreover, depots must have a “beehive” structure, characterized by a considerable development in height with the presence of a large number of sectional doors to allow drone take-off and landing operations, unlike the current situation in which a flat structure is preferable.
Taking into account the flight radius of the type of drone considered (15 km), the number of depots needed to cover deliveries in the city of Milan was estimated. The Observatory of the Politecnico di Milano estimates the number of daily deliveries in the city of Milan at about 350,000. About 5% of these deliveries have the characteristics to be delivered by drones.
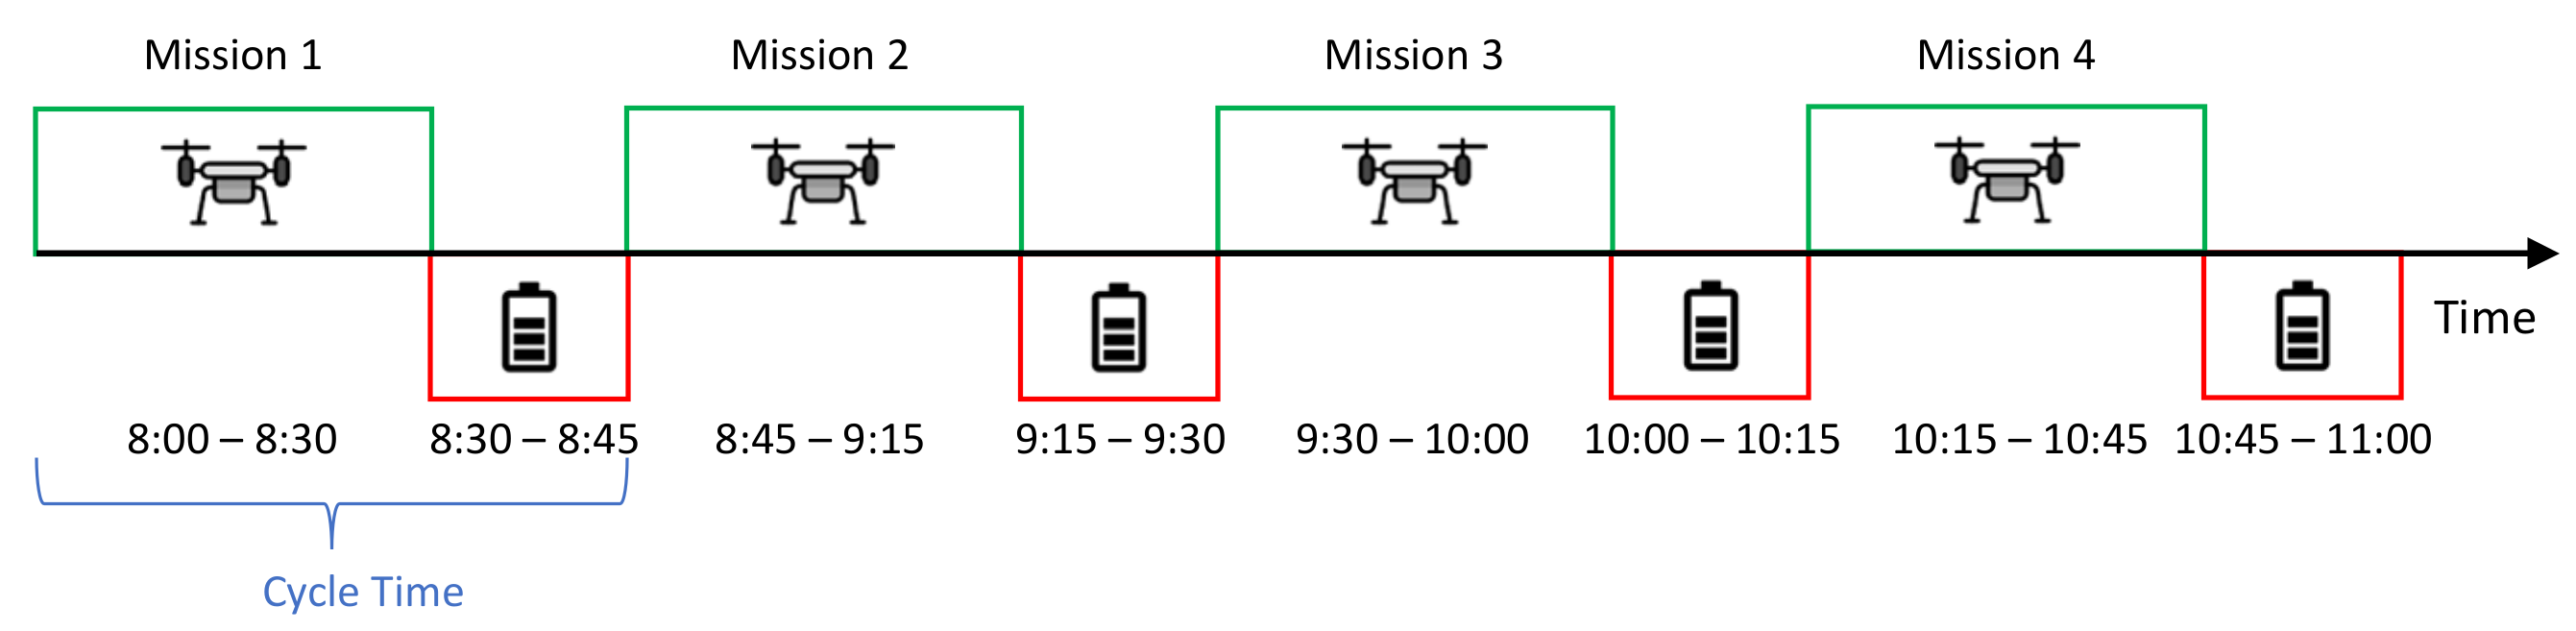
The cycle time of each drone has been assumed to be 45 min, a value resulting from the sum of the mission completion time and the operating time in the depot (based on the flight autonomy and considering 15 min for the battery change in the depot). Considering a daily working time starting at 8:00 a.m. and ending at 9:15 p.m., each drone can perform a minimum of 18 missions as shown in
Figure 7.
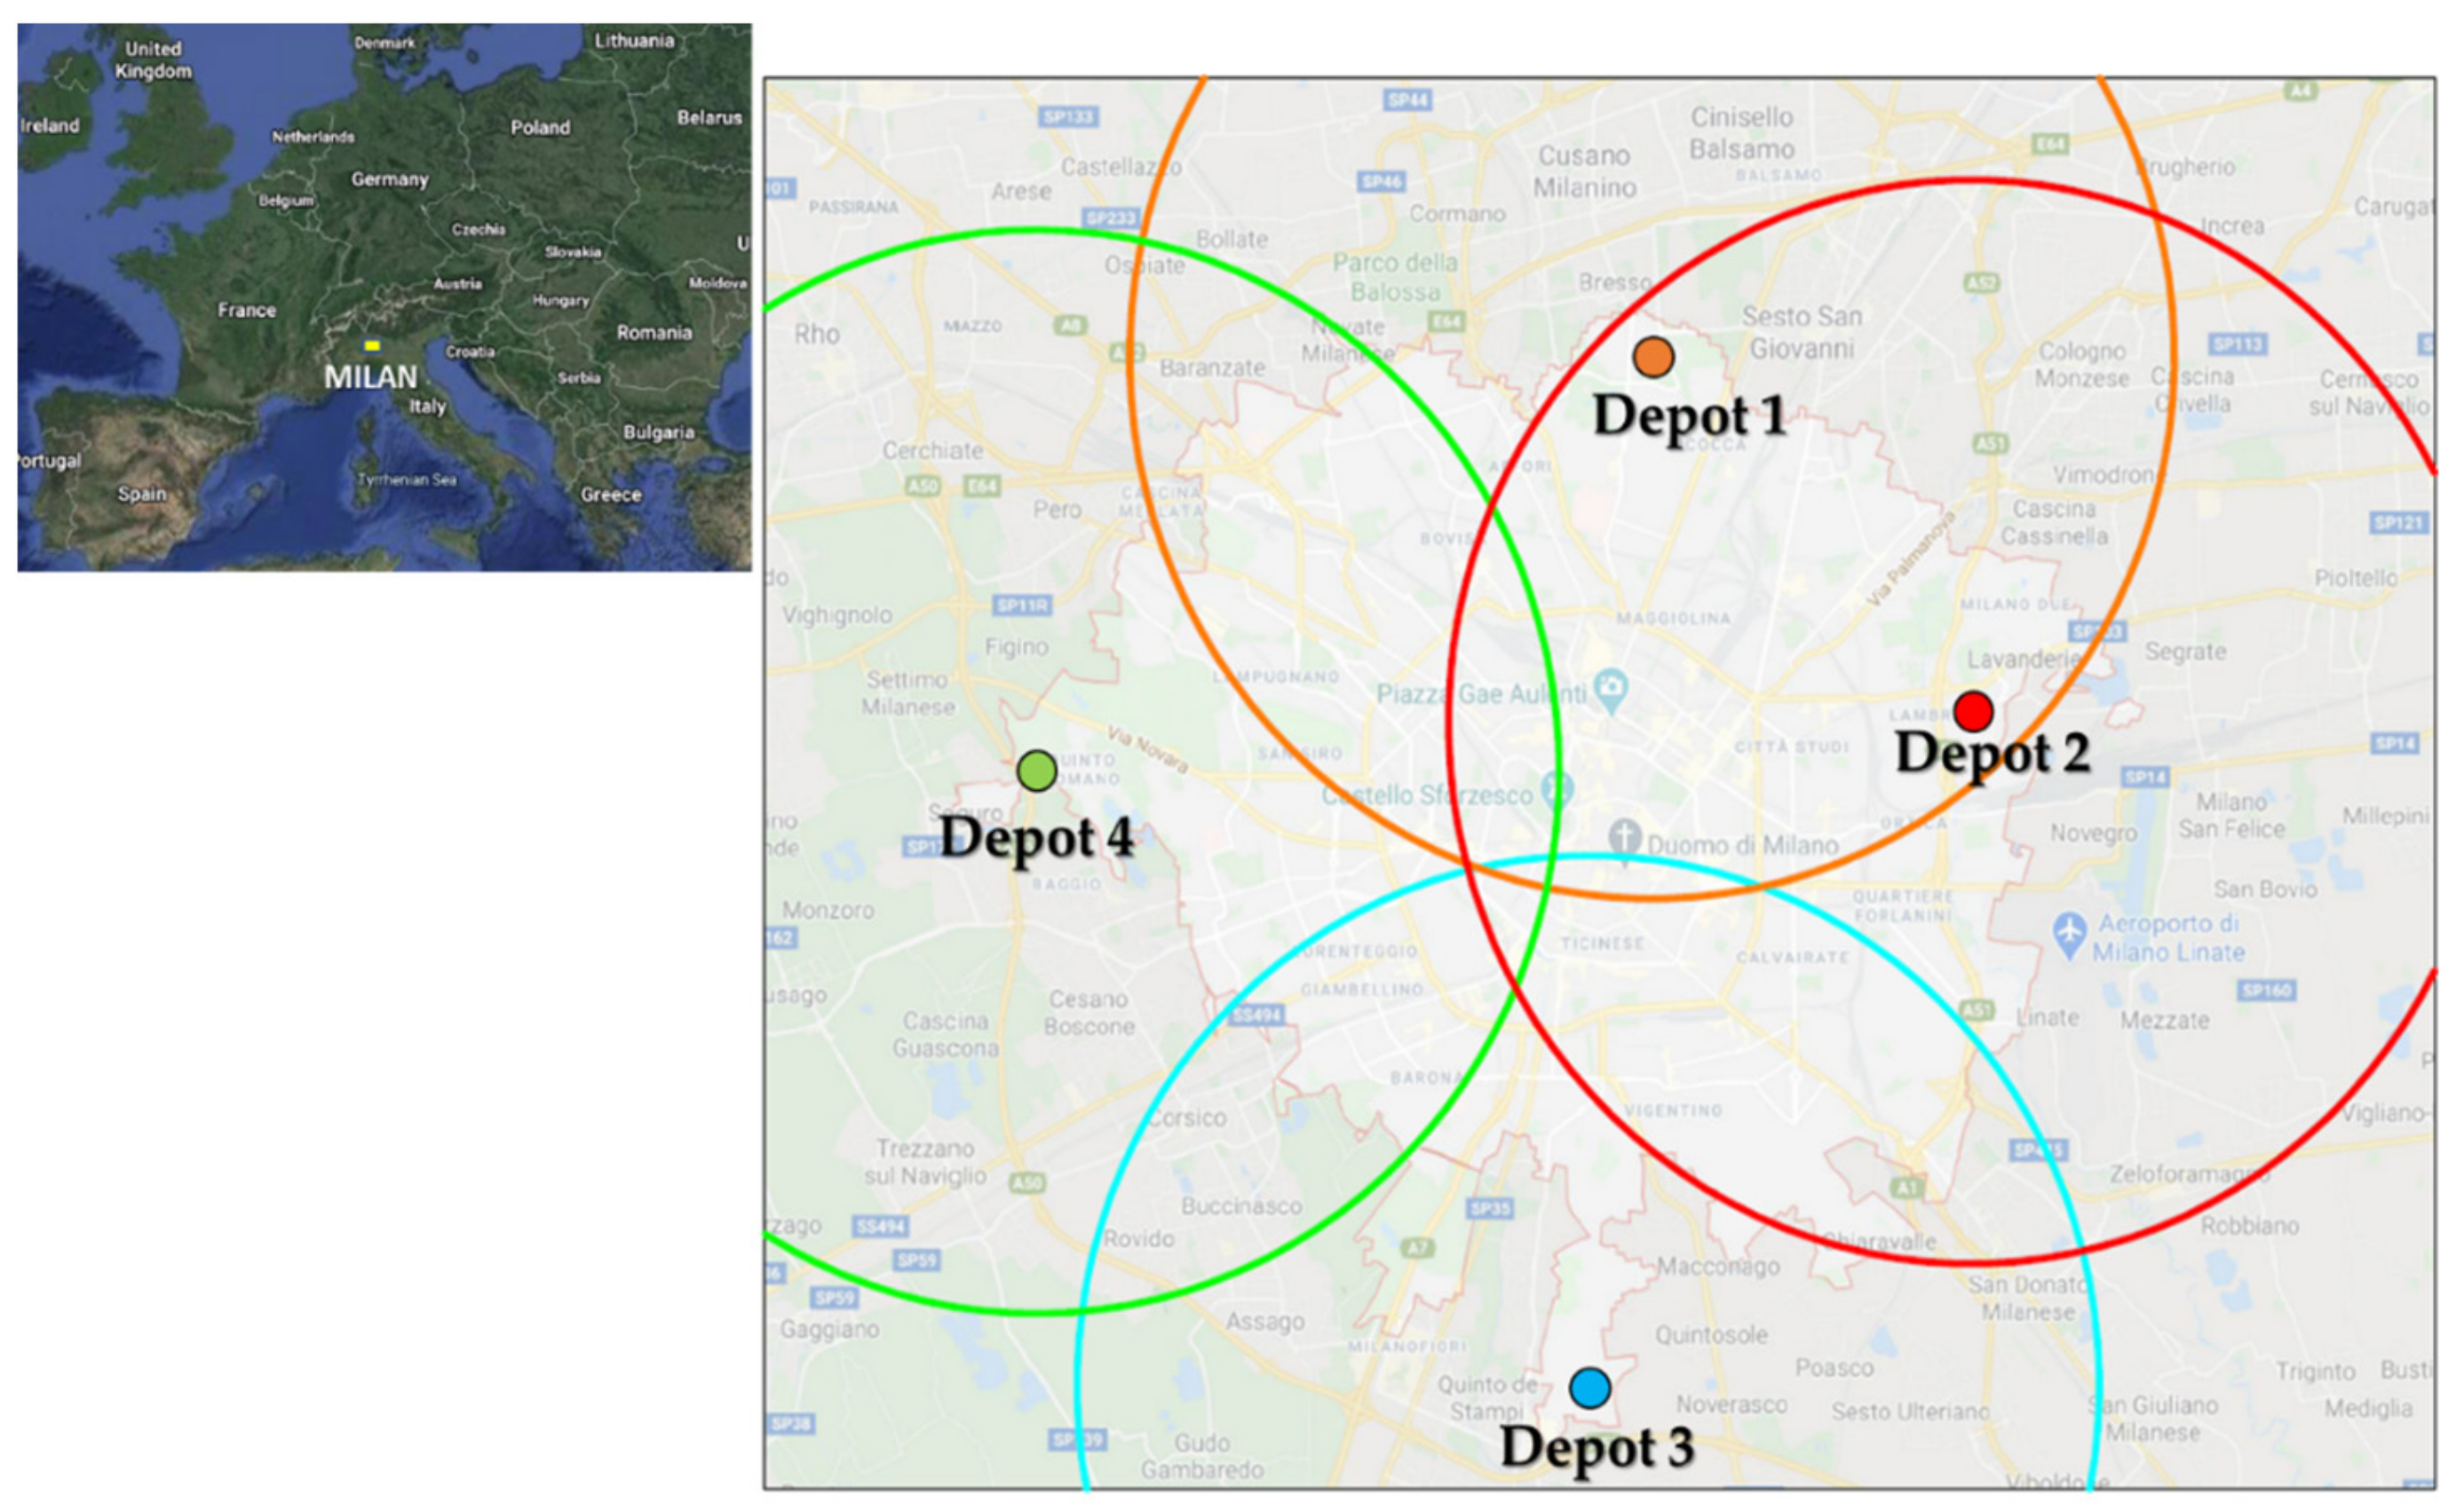
Assuming that each depot can accommodate 240 drones and that each drone is able to make no less than 18 daily deliveries, the construction of four urban depots is necessary to meet the demand of the city of Milan as shown in
Figure 8.
This number is calculated considering the total number of packages to be delivered in the city of Milan, the relative time to perform such deliveries and the number of available drones. The four depots should be located in strategic points near the main roads to facilitate the arrival of the articulated trucks. Each depot, in addition to serving its own area, partially covers the area of the other depots to be of help to another depot in case the other depots cannot fulfil part of their demand (for various reasons: delivery demand higher than expected, a drone is broken, etc.).
The final phase of drone delivery includes recognizing the customer, identifying landing areas and resolving any issues such as the customer not being present. This phase can be very critical. For the identification of the landing area, two solutions can be adopted: placing a QR code in the landing area or activating the “follow-me” function of the drone, i.e., associating the customer’s phone and the drone during the landing phase.
4.4. Financial Feasibility Analysis for a Last-Mile Delivery Service Using Drones in the City of Milan
In this section, a financial feasibility analysis was performed for a last-mile delivery service using drones in the city of Milan.
Table 4 shows the input values, whereas
Table 5 contains the values obtained applying the equations given in
Section 3.2.
As noted above, drones cannot fly in all weather conditions. Therefore, the financial analysis must consider the additional costs related to bad weather days. In this case study, the data collected by Climate Data-Org (
https://it.climate-data.org (accessed on 15 March 2021)) were considered to estimate the number of bad weather days that would prevent drones from flying. For the year 2019, the number of days characterized by moderate rain is 20. The estimate is obtained by evaluating the rainfall for each month and dividing it by 6 mm/h for 11 working hours. The value of 6 mm/h represents the lower limit to be considered in case of moderate rain, a condition for which the drone cannot fly. The worst situation is the one in which the drone cannot operate for the whole day. Considering the 20-day suspension of drone use (
), about 350,000 packages cannot delivered every year in Milan i Distributing this value to all drone workdays, it is obtained that 1144 daily deliveries cannot be made using drones. This means that these packages must be transported to the end customers by van, resulting in a higher cost for delivering a package by drone in case of bad weather
.
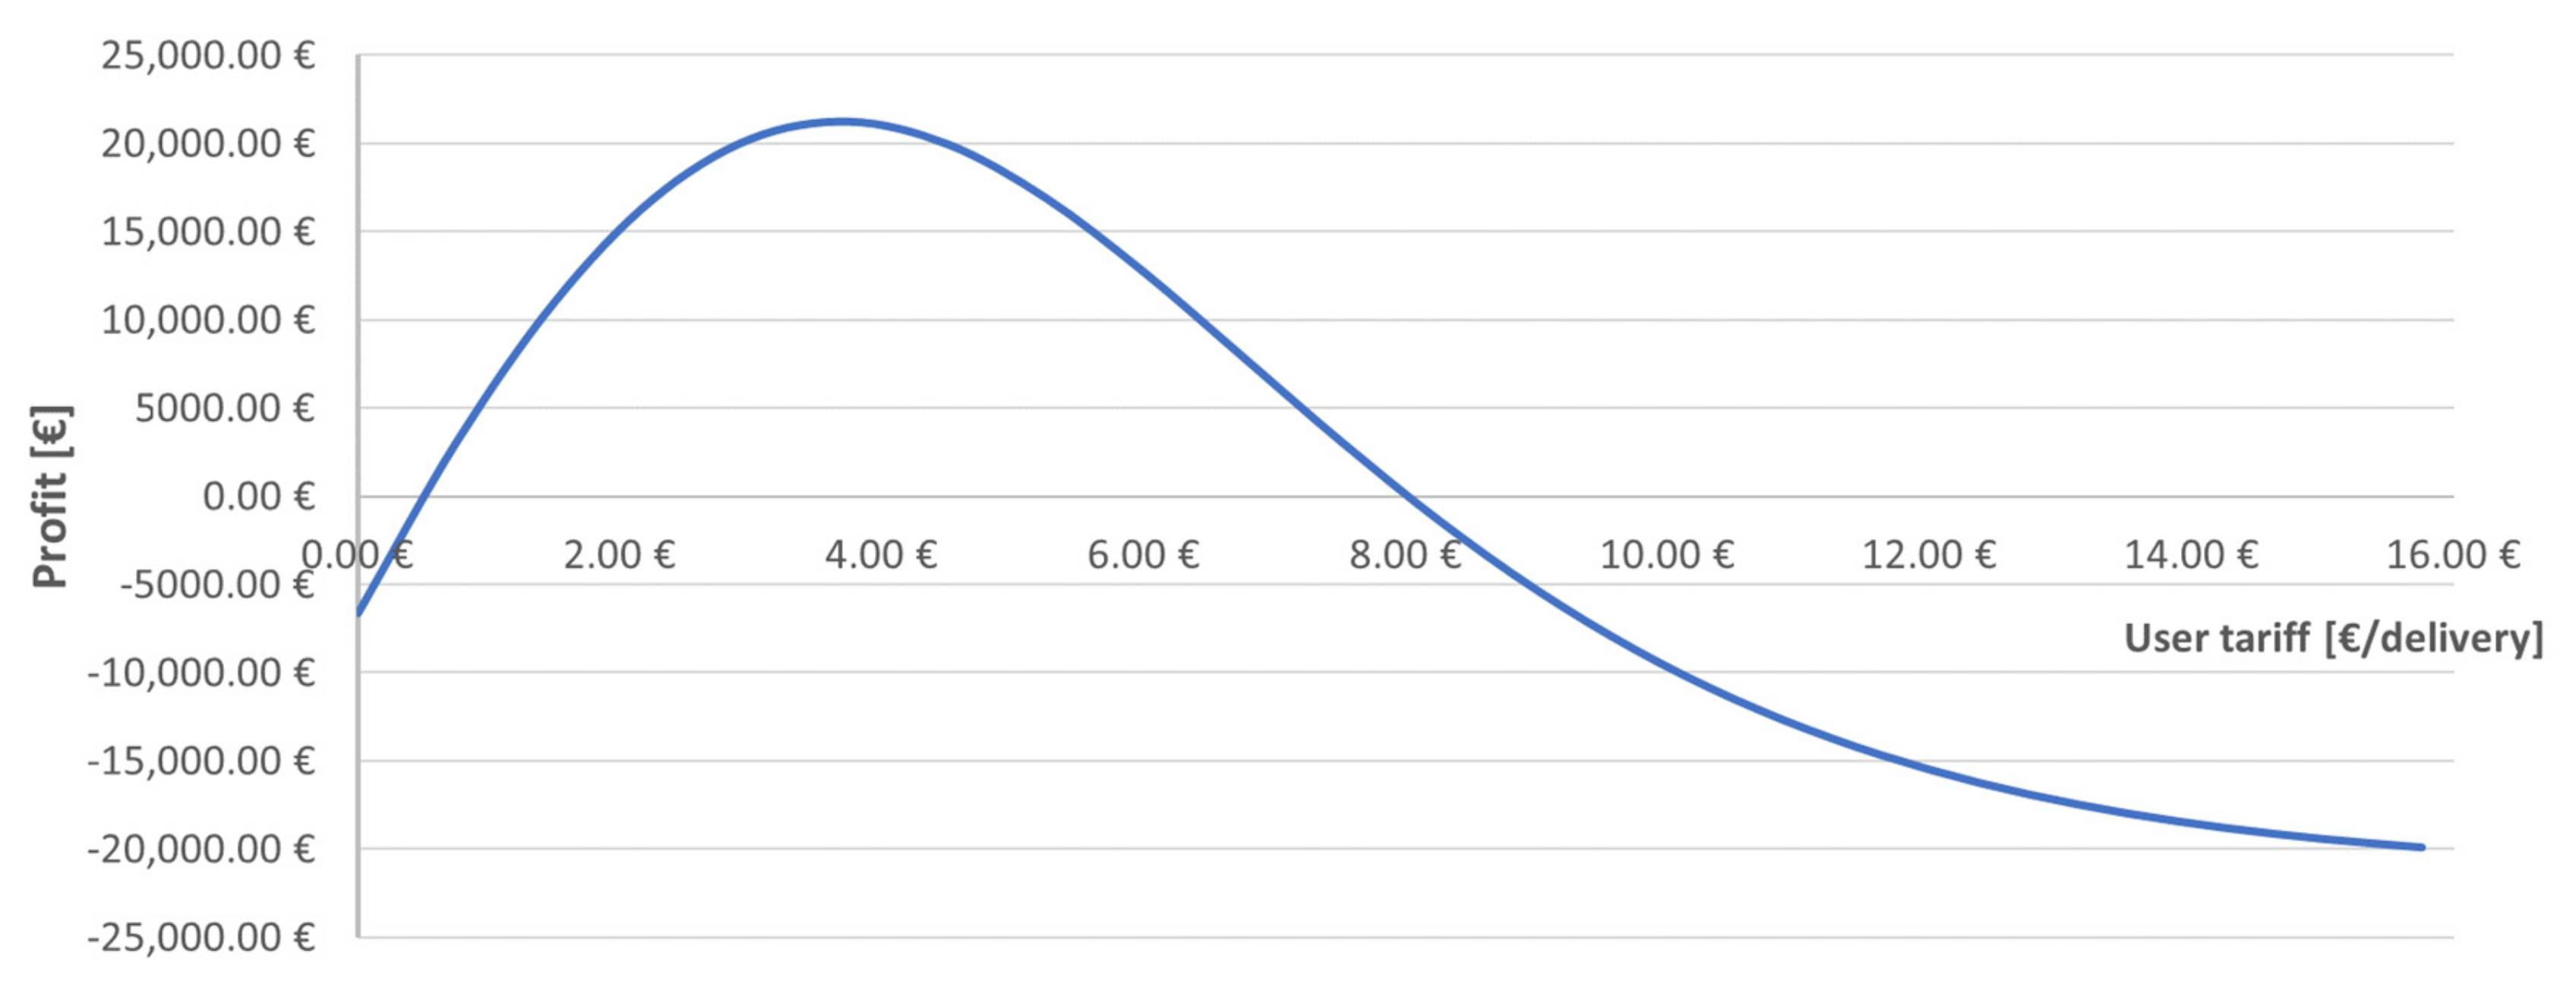
Figure 9 shows the trend of the profit obtained by the logistics company as the user rate varies. The profit, which is obtained by determining the difference between costs and revenues, considers a cost per delivery equal to €0.29/delivery (
and a number of drone deliveries equal to 17,500. The maximum profit would be achieved when the user tariff is about €3.75. Above this threshold, the profit drops to negative. This is because the overall costs incurred by the company providing the service are no longer covered by the revenues. This is due to the reduction in the number of users who choose the service via drone, due to its cost being too high.
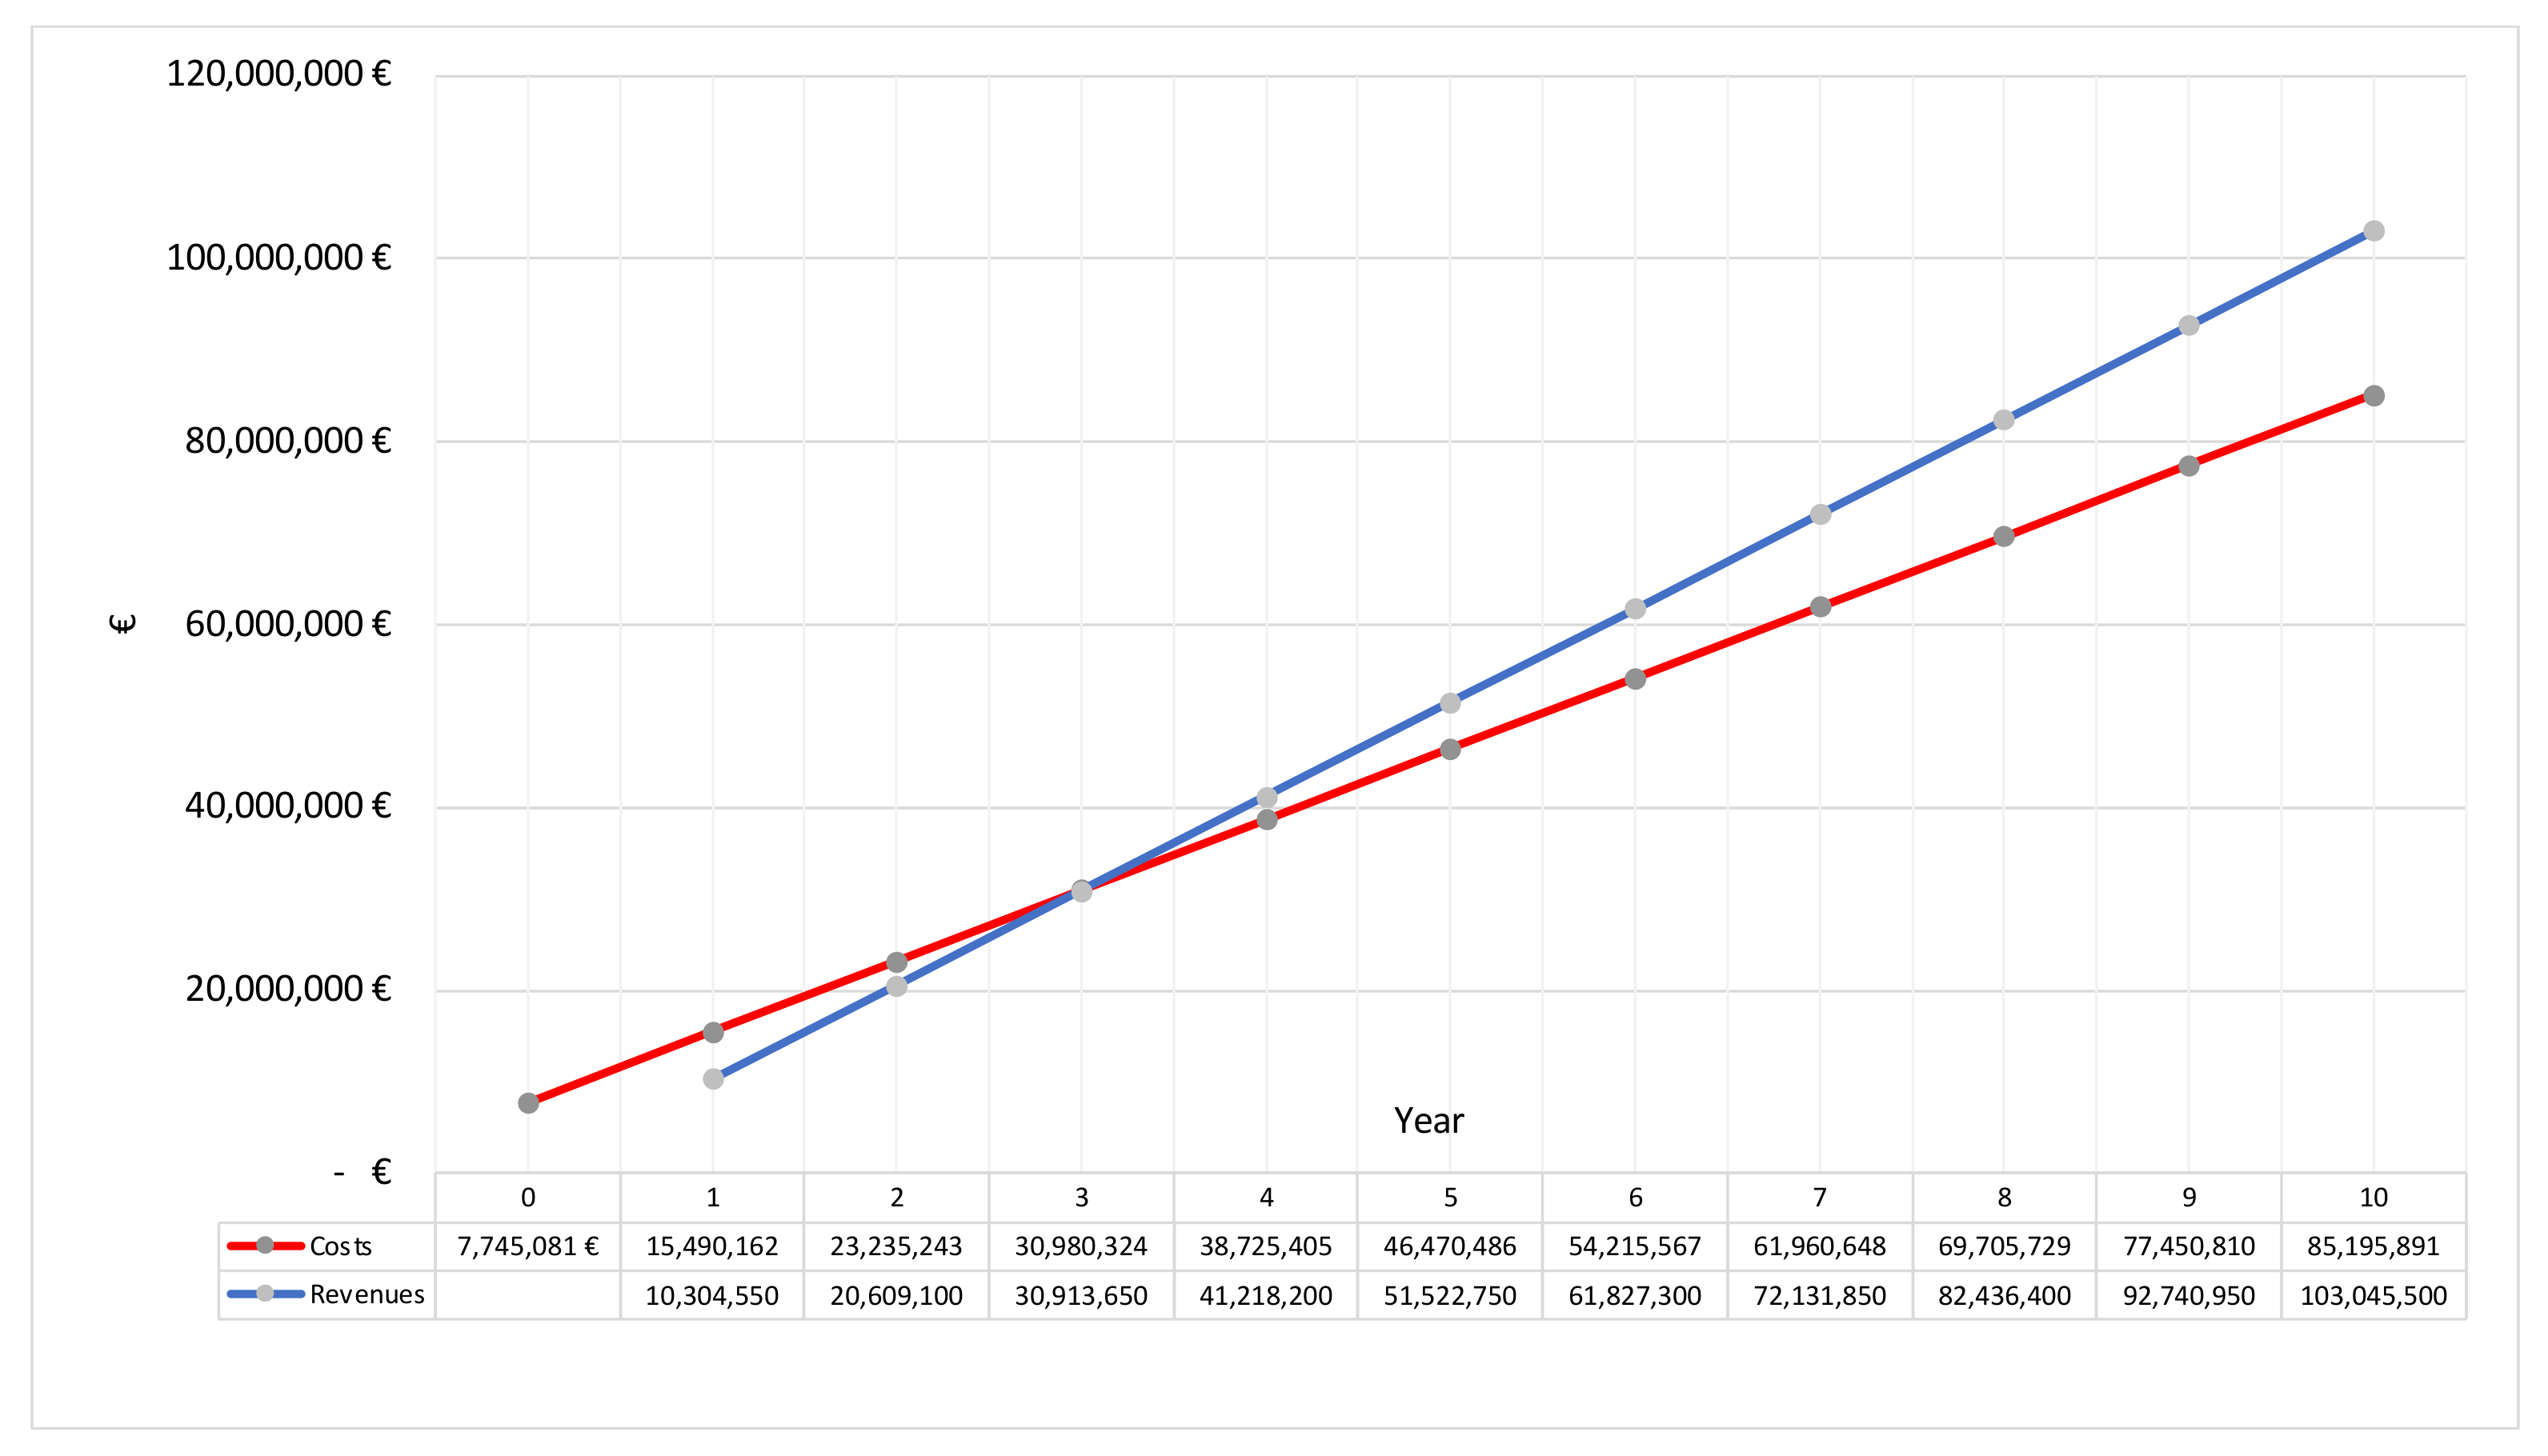
Figure 10 shows the trend in cumulative cost and cumulative revenue for a logistics operator providing a last-mile service via drones, using data from the case study considered. Revenues were estimated by considering the previously derived user tariff of 3.75 euro and an average number of potential users of 8980 Equation (21). The latter value is obtained as the product of the probability of drone choice at the selected tariff and the number of potential users. Then, Equation (15) and the data shown in
Table 5 have been considered to assess cost trends. It can be noted that, in correspondence with the third year of service, the break-even point between revenues and costs is reached and, from the fourth year on, the service becomes truly profitable. In other words, it takes three years of service operation for the costs incurred in implementing the service to be covered by the revenues generated by service delivery. Only after the third year does the service become profitable.
5. Conclusions
Last-mile logistics plays an important role for the distribution of goods to end customers. Efficient and effective last-mile logistics is crucial not only for reducing the related time and costs, but also to respect sustainability issues mainly connected to environment and road congestion. Last-mile delivery of goods is often carried out by vans, most of which have internal combustion engines. Drones may represent a helpful and innovative transport system to decrease environmental and noise pollution and congestion.
This study contributes to the literature by evaluating the viability of a possible last-mile logistics service by using drones. More precisely: (i) a Stated Preferences analysis was carried out to assess the propensity of users to use drones; (ii) a financial feasibility analysis was performed to evaluate costs and revenues for a logistics operator in charge of this kind of service.
The proposed methodology was applied to a real case study in the city of Milan, Italy. Results showed a high propensity by end users to use drones for the delivery of goods and that this solution generates profit for the logistics operator after a few years of operation.
Relevant implications are as follows.
The community could benefit from the use of drones for deliveries as they would reduce the number of vans circulating in the city, with a consequent decrease in traffic congestion and polluting emissions. Another aspect concerns the current SARS-CoV-2 pandemic period: the use of drones would make it possible to avoid, at least for some deliveries, the interaction between the courier and the end customer, thus reducing the possibility to have close contacts between people.
This research presents the following limitations: (i) Regulatory issues: especially in densely populated area, the use of drones in urban areas is subject to specific limitations and regulations. In some cases, this could limit the flight of drones (e.g., in areas close to airports), forcing the use of other vehicles for deliveries; (ii) Delivery area issue: the final phase of delivery could represent a critical aspect due to many close and tall buildings in a city. This facet could affect the performance drones considering the number of packages to be delivered. Possible innovations and strategies should be investigated (e.g., delivery on sidewalks, in condominium areas or dedicated delivery areas); (iii) Vehicle issue: the battery (capacity), its life cycle, and the type of charging (normal, fast, ultra-fast) could affect the drone performance. Therefore, new studies should investigate the state of charge to evaluate the decrease in battery performance considering issues such as temperature and package type.
In addition to the previous limitations, further research will be devoted to better investigate the aspects of end-user recognition and identifications of the best areas to land or recover a broken drone. Furthermore, the environmental impact of a drone service could be studied using multi-criteria techniques. Finally, it would be interesting to study the feasibility of intermediate solutions, such as van plus drone, before the complete transaction to a drone-only solution.


 ,
, 


