Abstract
For effective management practices and decision-making, the uncertainty associated with Regional Climate Models (RCMs) and their scenarios need to be assessed in the context of climate change. The present study analyzes the various uncertainties in the precipitation and temperature datasets of NASA Earth Exchange Global Daily Downscaled Projections (NEX-GDDP) under Representative Concentrative Pathways (RCPs) 4.5 and 8.5 over the Munneru river basin, in India, using the Reliable Ensemble Averaging (REA) method. From the available 21 RCMs, the top five ranked are ensembled and bias-corrected at each grid using the non-parametric quantile mapping method for the precipitation and temperature datasets. The spatio-temporal variations in precipitation and temperature data for the future periods, i.e., 2021–2039 (near future), 2040–2069 (mid future) and 2070–2099 (far future) are analyzed. For the period 2021–2099, annual average precipitation increases by 233 mm and 287 mm, respectively, the in RCP 4.5 and RCP 8.5 scenarios when compared to the observed period (1951–2005). In both the RCP 4.5 and RCP 8.5 scenarios, the annual average maximum temperature rises by 1.8 °C and 1.9 °C, respectively. Similarly, the annual average minimum temperature rises by 1.8 °C and 2.5 °C for the RCP 4.5 and RCP 8.5 scenarios, respectively. The spatio-temporal climatic variations for future periods obtained from high-resolution climate model data aid in the preparation of water resource planning and management options in the study basin under the changing climate. The methodology developed in this study can be applied to any other basin to analyze the climatic variables suitable for climate change impact studies that require a finer scale, but the biases present in the historical simulations can be attributed to uncertainties in the estimation of climatic variable projections. The findings of the study indicate that NEX-GDDP datasets are in good agreement with IMD datasets on monthly scales but not on daily scales over the observed period, implying that these data should be scrutinized more closely on daily scales, especially when utilized in impact studies.
1. Introduction
Future changes in precipitation and temperature will have an impact on the economy, society and ecosystems. The consequences of such changes across many regions are highlighted in several studies [1,2,3,4,5]. There is some uncertainty in estimating the impacts at finer scales using the available climate models and scenarios [6,7,8,9]. The complex nature of the climate system and local scale hydrological processes including soil moisture and evapotranspiration are poorly understood and inadequately modeled due to the presence of large uncertainties at regional scales [10,11]. It is obvious that weather and climate events in the future will cause massive changes all over the world [12]. Each of the climate model outputs has its own set of limitations and outputs, that vary depending on the climatic scenario. Furthermore, the ambiguity of the various climate model outputs is exacerbated by the fact that different models employ different parameterization schemes, model structures and responses to atmospheric forcings [13,14]. As a result, multiple models representing different scenarios should be used to achieve a diverse climate change impact on meteorological variables [15]. Different methods, such as dynamical and statistical downscaling, have been developed to provide reliable projections of climate change at finer scales. In comparison to dynamical downscaling, statistical downscaling requires fewer computational resources and is easily transferable to any region [16]. A high-resolution dataset for long-term projections has been released by NASA to the Earth science community in June 2015 [17]. Similar datasets were used to assess short- and long-term changes in precipitation and temperature across the Asian region [18,19,20,21].
Model complexity is caused by measurement error, randomness and systematic error in multiple climate models [22]. Because the boundary conditions of various models differ, an ensemble of climate models is required for future projections of meteorological variables, even though they can be related to the same experiment groups [23]. The uncertainty begins with the selection of appropriate Regional Climate Models (RCM). To reduce uncertainty, various researchers proposed that an ensemble of relevant models was the best solution, which increases confidence when projecting climate data into the future. Reliability Ensemble Averaging (REA) can be an appropriate technique for modeling the uncertainty of multiple hydro-climatic models and their inputs [6,24]. REA measures the multimodel uncertainty in the form of model performance, while projecting variables in the future periods.
Several previous studies investigated performance indices, weight computing techniques, multi criteria decision making techniques and group decision making in order to select the best suitable GCMs [23,25,26,27,28,29,30,31] When compared to observed datasets, simulated precipitation and temperature outputs from regional climate models (RCMs) exhibit huge systematic biases [32] Bias correction methods are used to correct precipitation data from GCMs and satellite-based products [14,33,34]. Linear scaling, power transformation, precipitation local intensity scaling and distribution mapping are the methods used to correct biases in precipitation data using the CMHyd) tool [35]. Other bias correction methods include Linear Scaling (LS), Quantile Mapping (QM), Distribution Fitting (DF), Optimal Interpolation (OI) and Geographically Weighted Regression (GWR). For the error correction of multisource weighted ensemble precipitation over the Lancang-Mekong river basin, the QM and LS methods were used [36]. When climate model data and observed gauge data have the same spatial resolution, quantile mapping can also be frequently used [37]. In the context of climate change impact studies, the quantile mapping bias correction method was found to be a better bias correction technique, as it corrects only the mean or mean and the variance of the precipitation series and relies on nonparametric quantile estimates [34,38,39,40,41].
The objective of the present study is to rank the available 21 RCMs at each grid point over the study area and ensemble the best five models for future projections using REA methodology for precipitation and maximum and minimum temperature data over the Munneru sub-basin in India’s Lower Krishna River Basin. The non-parametric quantile mapping method is used to correct the bias in the Multi Model Ensemble (MME) precipitation datasets. In addition, meteorological datasets for the three future periods are examined. The extreme precipitation and temperature indices for major urban areas in the future periods were examined.
2. Study Area
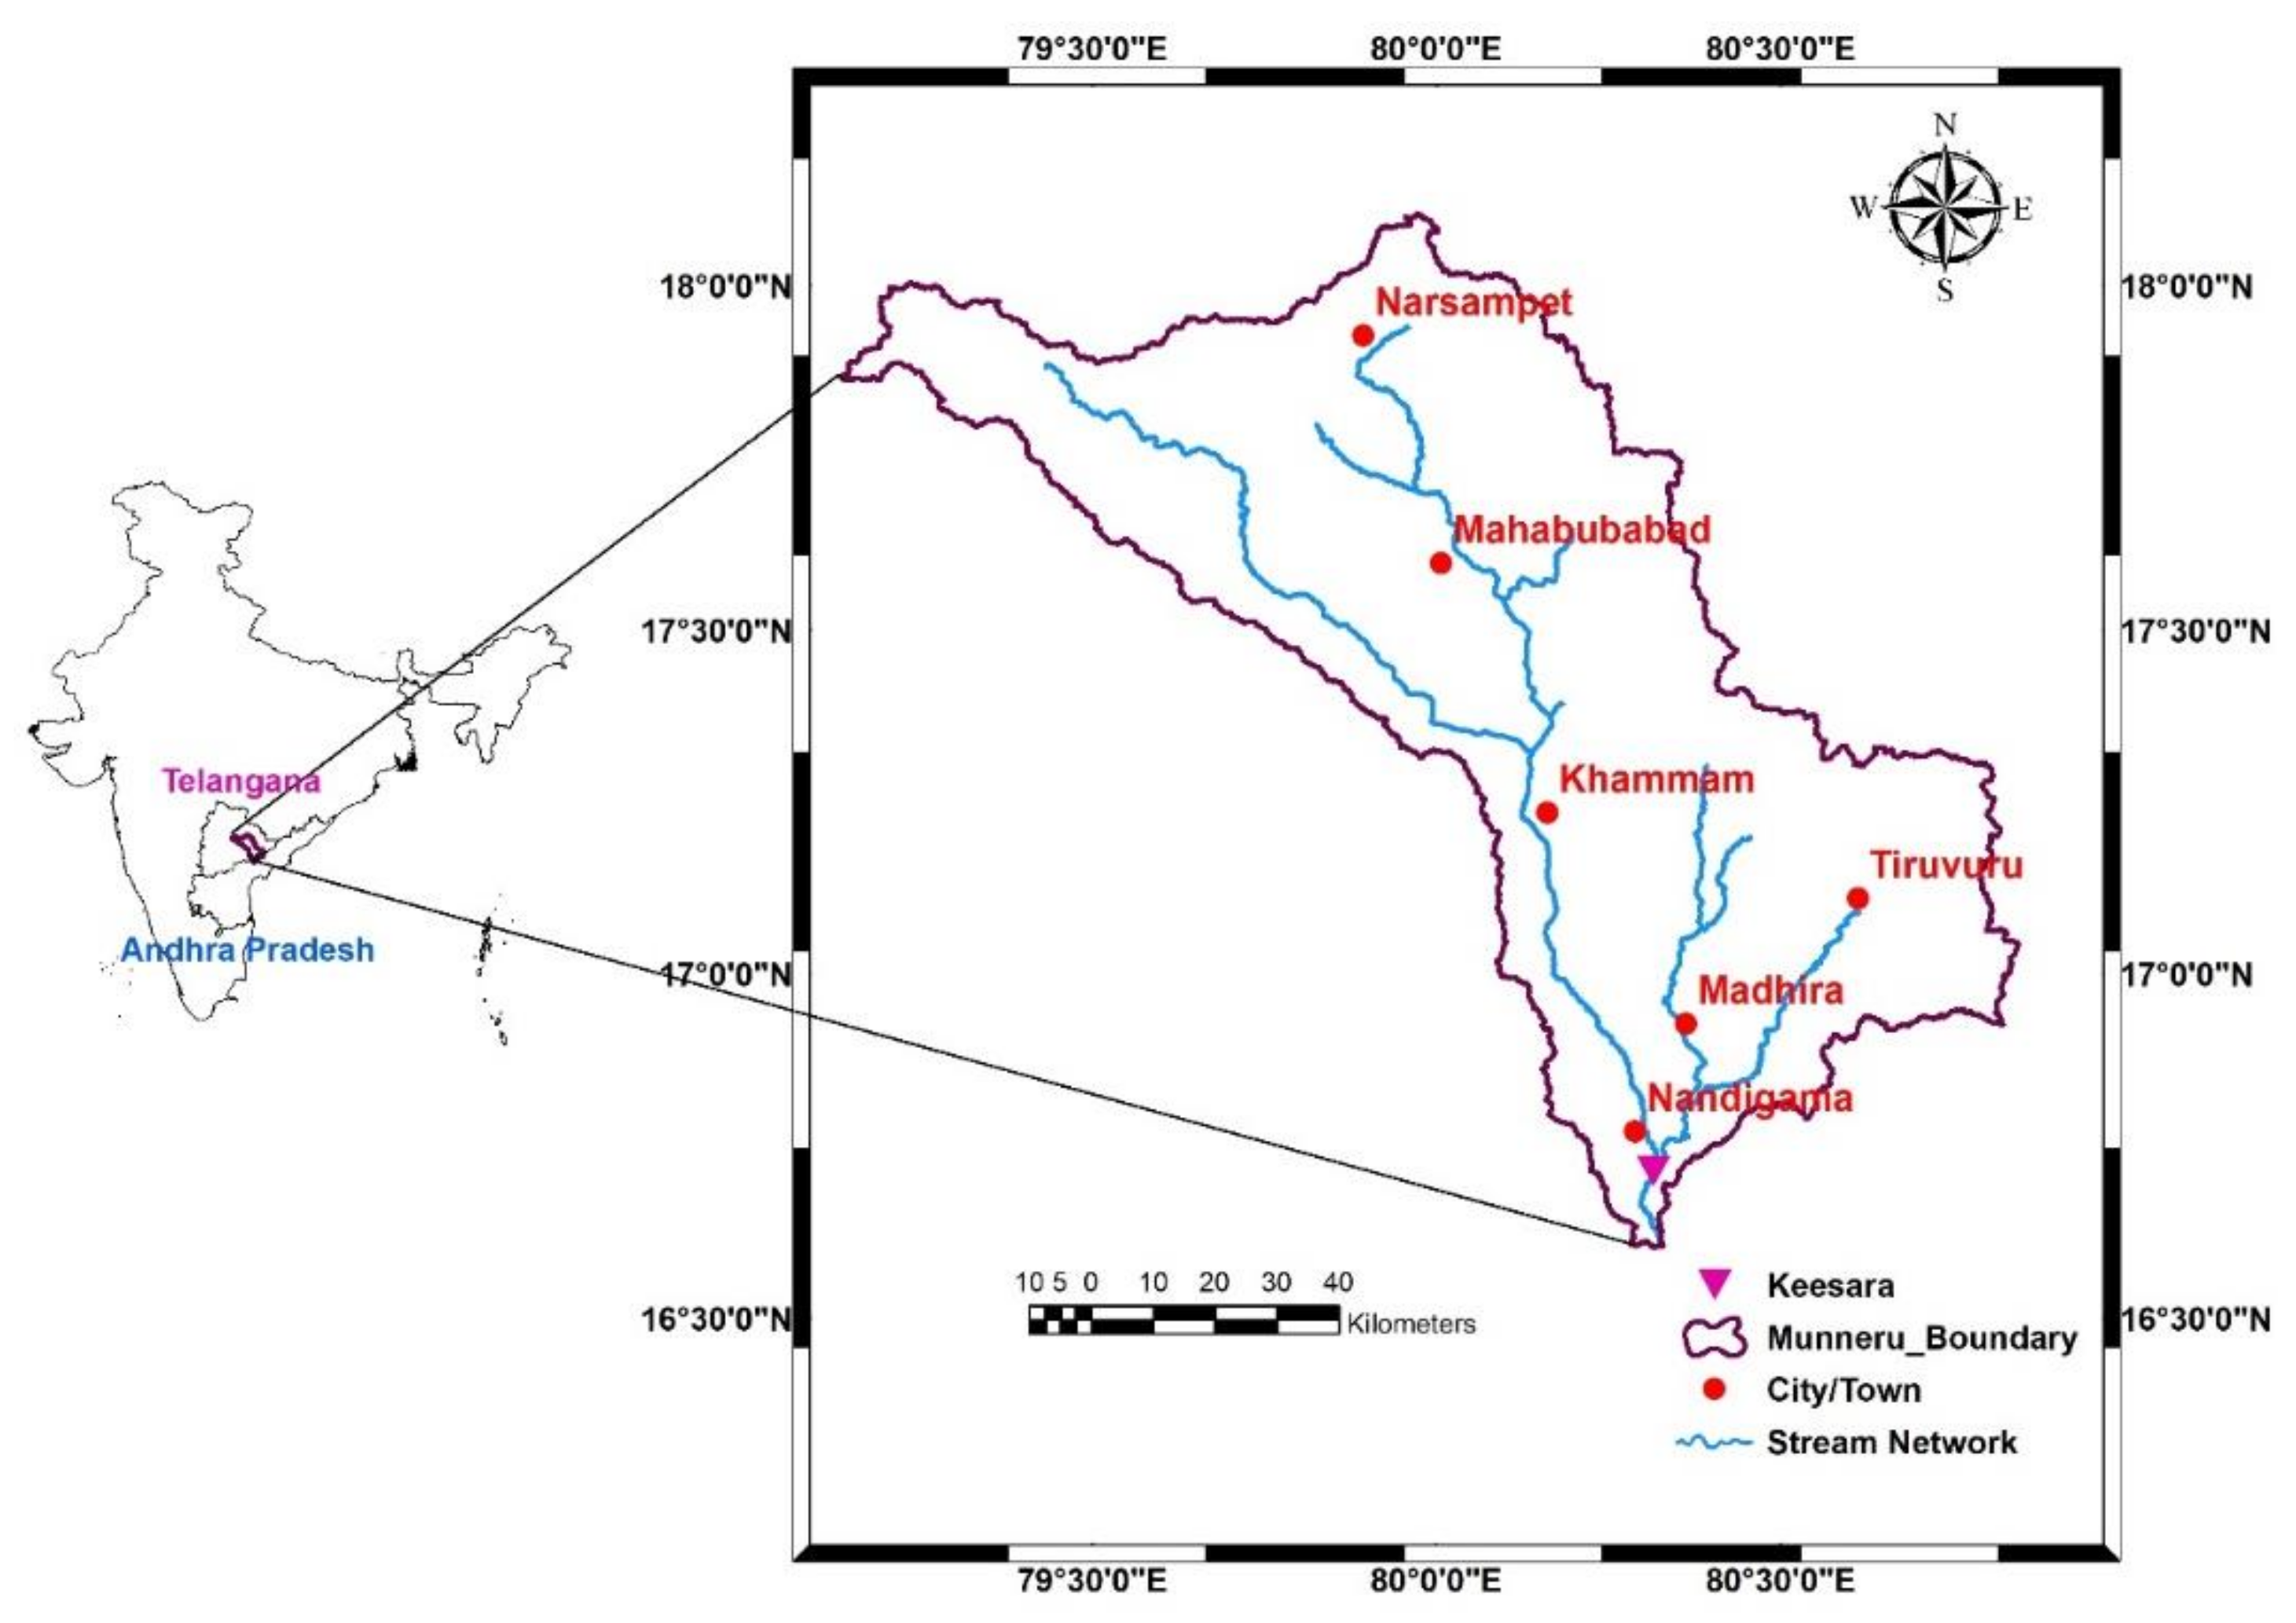
The Munneru River is a vital and vulnerable tributary of the Krishna River. Its drainage area encompasses the districts of Khammam, Warangal (Telangana State) and Krishna (Andhra Pradesh State). The Munneru basin is bounded by latitudes ranging from 16.6° N to 18.1° N and longitudes ranging from 79.2° E to 80.8° E. The basin contains five major towns and one city. This basin’s dominant soils are red soils, followed by black soils. Paddy, cotton and maize are the dominant crops in this basin. The basin’s total drainage area is 9854 Km2. The Central Water Commission (CWC) maintains two gauge stations in Keesara and Madhira villages to measure gauge, discharge, sedimentation and qualitative aspects of the water [42]. Figure 1 depicts a map of the Munneru basin, including the stream network and major towns. The Munneru basin is divided into four sub-basins: sub-basin 1 (S1), sub-basin 2 (S2), sub-basin 3 (S3) and sub-basin 4 (S4). Figure S1 depicts the RCM grid points and sub-basins in the study area. This basin has been chosen as the study area as part of the ongoing research project IWMM-BIS, titled “Integrated Water Management Model for Brazil, India and South Africa under climate change scenarios” [43].
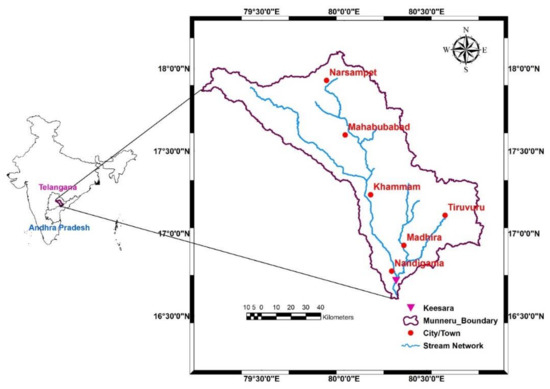
Figure 1.
Location map of Munneru river basin, India.
3. Data Used
Daily precipitation data (1901–2020) and the minimum and maximum temperatures (1951–2020) were obtained from the Indian Meteorological Department (IMD), Pune, India [44]. Historic climate data are available in 0.25° × 0.25° grids for precipitation and a 1° × 1° grid for temperature. The bias-corrected, spatial disaggregated (BCSD) NEX-GDDP dataset includes downscaled projections for the RCP 4.5 and RCP 8.5 daily scenarios and is produced and distributed for 21 models as part of the Coupled Model Intercomparison Project Phase 5 (CMIP5). These datasets are available for the entire South Asian region on the website of the Indian Institute of Tropical Meteorology in Pune, India [45]. The CMIP5 GCM runs were created in support of the Intergovernmental Panel on Climate Change’s Fifth Assessment Report (IPCC AR5). Each of the climate projections includes daily precipitation, maximum temperature and minimum temperatures, and a spatial resolution of 0.25 degrees for the period 1950–2099. Table S1 contains Supplementary Material for each model driving the Atmosphere-Ocean General Circulation Model (AOGCM) and contributing modeling centers.
4. Methodology
4.1. Performance Indicators
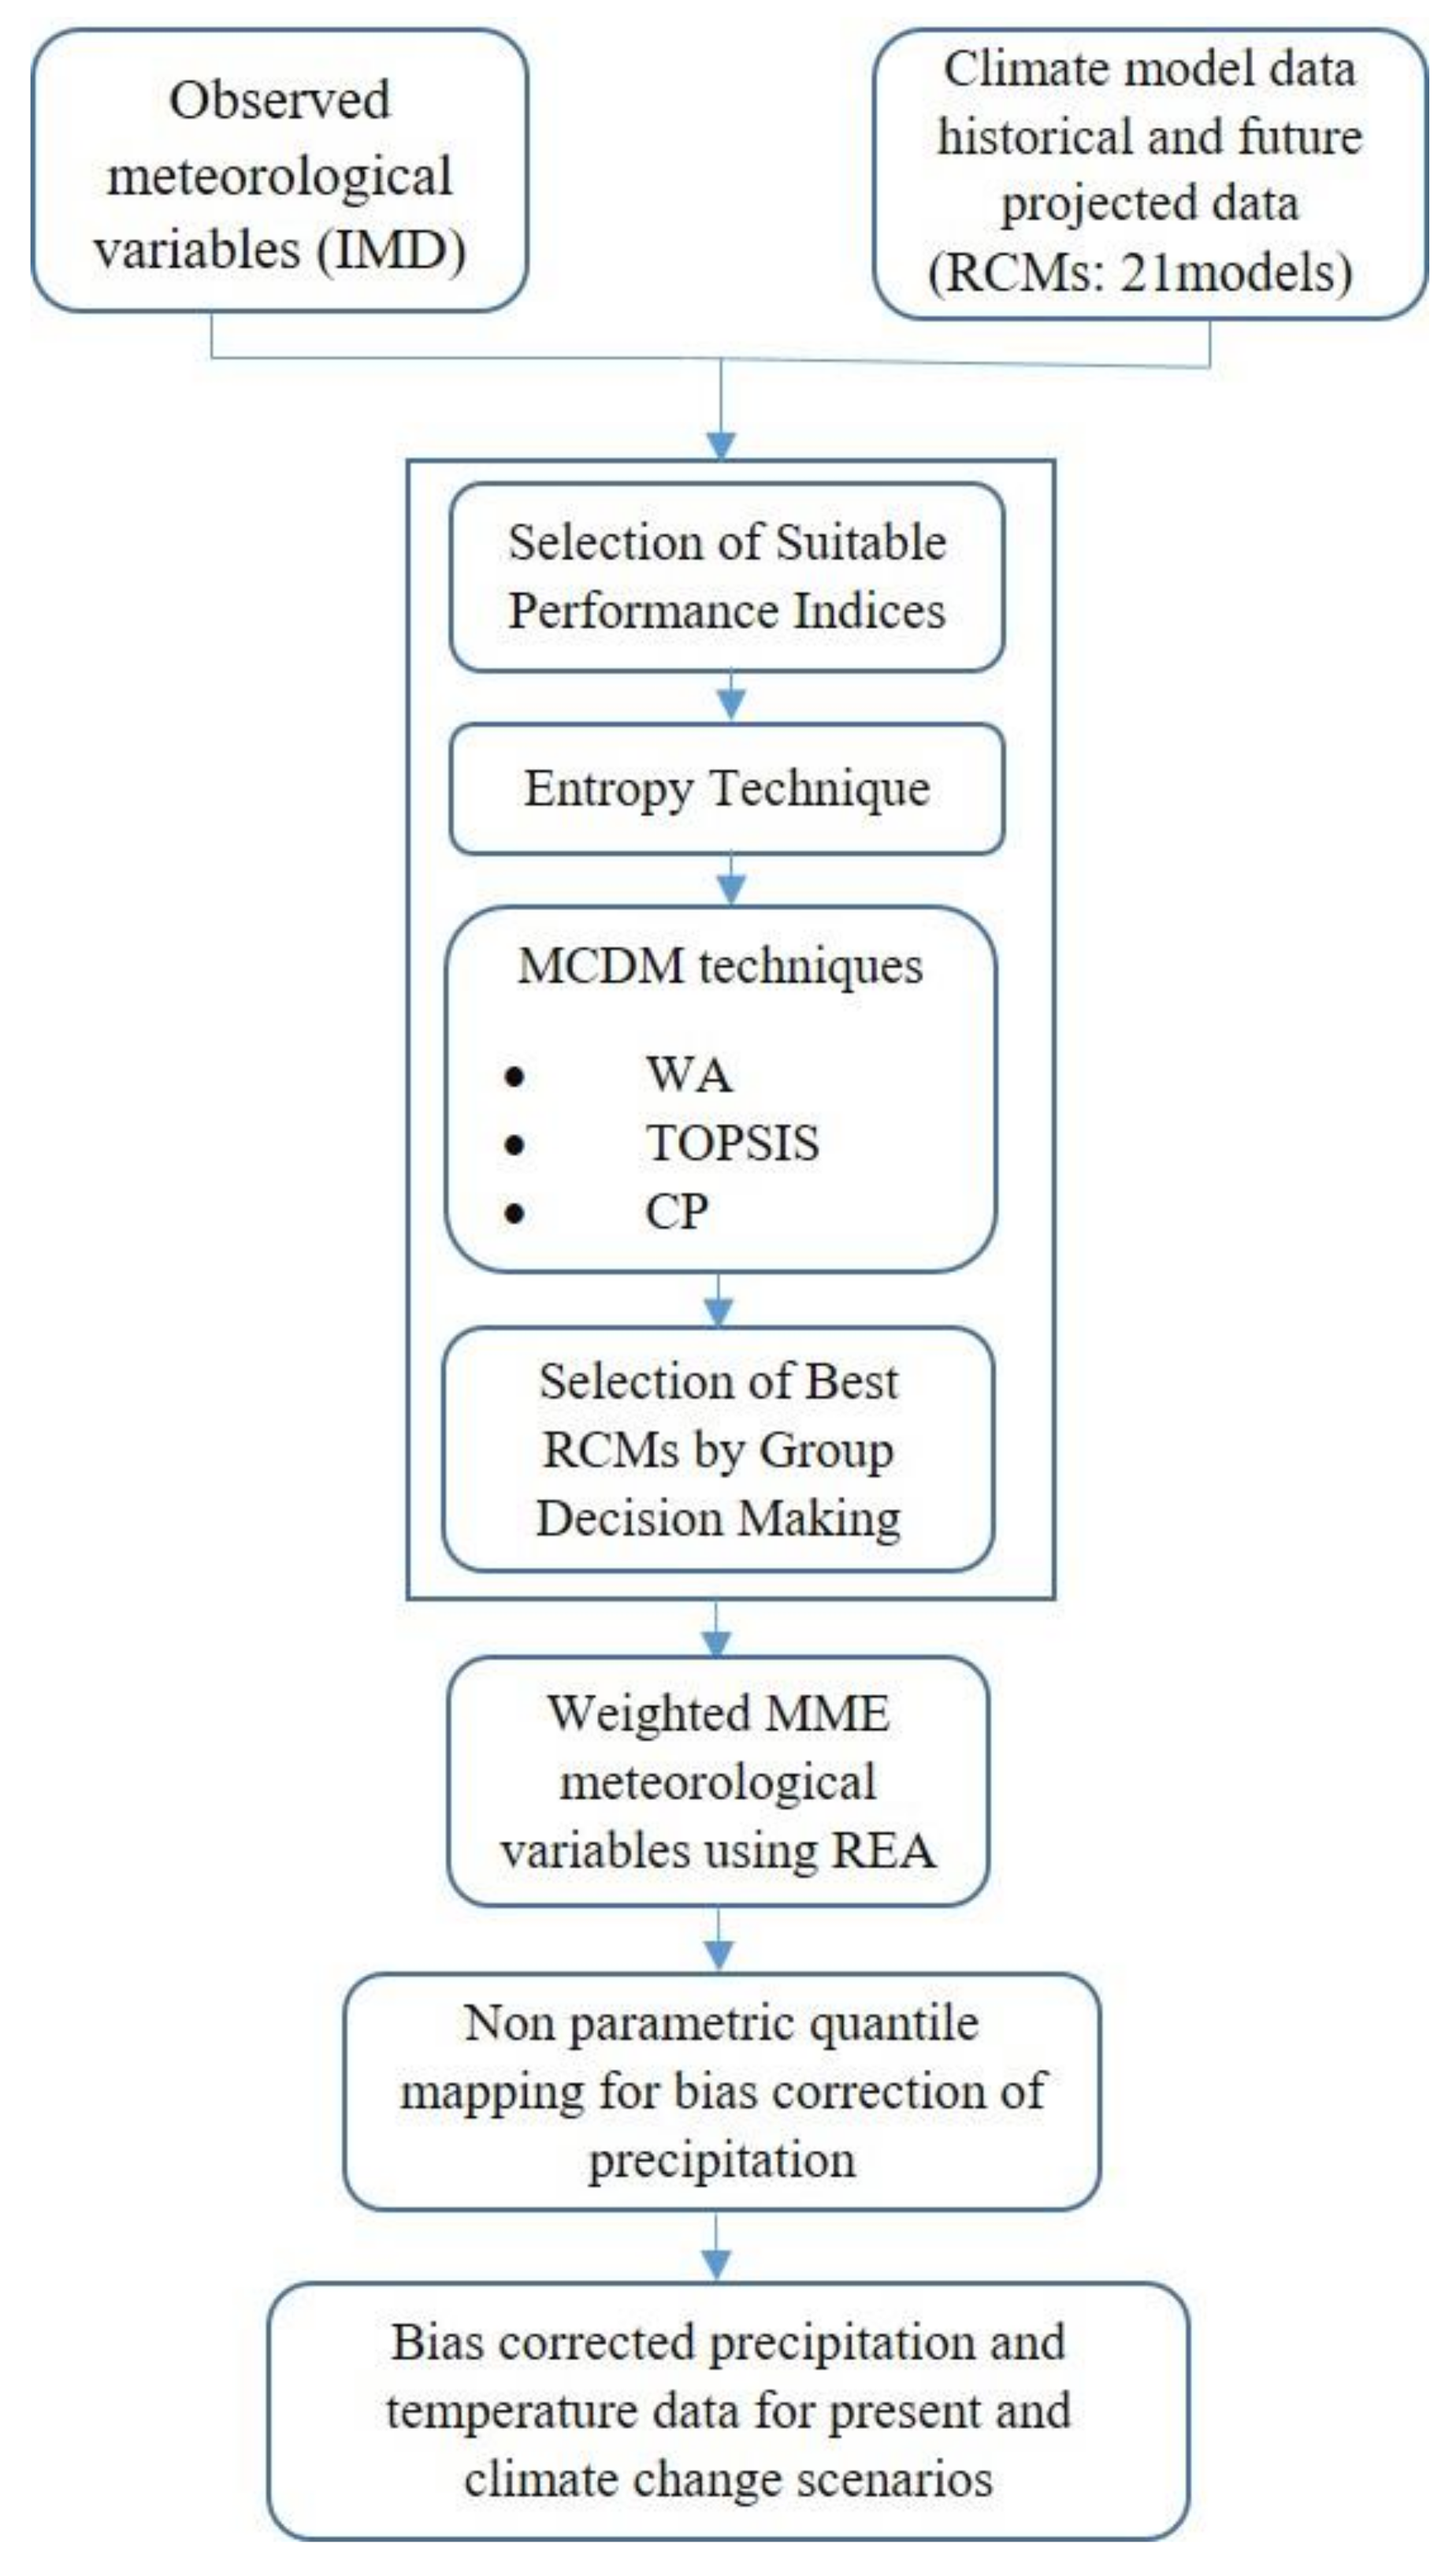
Several approaches are used to evaluate and rank RCMs’ ability to match the actual climate. The RCMs are ranked using different sets of performance indicators. Based on the literature review mentioned in the introduction, the performance indicators in the current study were root mean square deviation (RMSD), normalized root mean square deviation (NRMSD), absolute normalized mean bias deviation (ANMBD), Pearson correlation coefficient (CC), Nash–Sutcliffe efficiency (NSE) and skill score (SS). For the calculation of performance indices, average monthly precipitation and temperature data sets of observed (IMD) and simulated (RCM) values are used for the period 1951–2005. Table 1 shows the mathematical equations for each indicator as well as their ideal values. The observed and simulated values of the respective datasets are xi and . The mean of observed and simulated values are denoted by and . The number of datasets is denoted by . The standard deviations of observed and simulated values are denoted by and , respectively. The number of bins utilized in the PDF calculation for the given set of values is shown as . The frequency values in the respective bin from the chosen RCM and of the observed values are denoted by and . Methodology flowchart is shown in Figure 2.

Table 1.
The mathematical equations and ideal values of performance metrics.
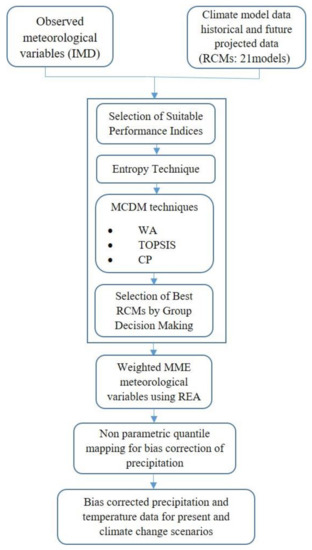
Figure 2.
Methodology flowchart for the preparation of bias-corrected and ensemble data for historic and future scenarios.
4.2. Normalization Technique
Normalization helps the conversion of different proportionate indicators into the same space. The mathematical representation for normalization is shown in Equation (1) [28]
where is the value of indicator for RCM ; represents the total number of RCMs.
4.3. Weight Computing Technique (Entropy Technique)
The entropy technique is used to determine the weightage of each performance indicator used in the study [28,46]. The entropy for each indicator is calculated by using Equation (2).
For is the total number of the indicators and stands for total number of RCMs. Lower values of entropy correspond to a higher weightage for that particular indicator. The Degree of diversification () and Normalized weight of each indicator () are represented in Equations (3) and (4), respectively.
Ddj = 1 − Enj
4.4. Multicriterion Decision-Making Techniques (MCDM) in a Deterministic Scenario
The three MCDM techniques used to rank the RCMs in this study are weighted average (WA), compromise programming (CP) and the technique for order preference by similarity to an ideal solution (TOPSIS) [29].
4.4.1. Weighted Average Technique
In this method, the utility of RCM (Va) is calculated by Equation (5).
Here, represents the value of indicator for RCM, and denotes the weight assigned to indicator. A higher indicates a suitable RCM.
4.4.2. Compromise Programming
It is based on the distance measure metric, which is used for RCM ranking. A lower Lp indicates the best suitable RCM. Equation (6) represents the expression for the metric [46].
Here, indicates the ideal value for each indicator among the available RCMs, indicates the value of indicator for RCM , is the weight assigned to the indicator , and denotes the parameter
4.4.3. Technique for Order Preference by Similarity to an Ideal Solution (TOPSIS)
The TOPSIS technique is established using the distance measure between ideal and anti-ideal values. The expressions for RCM’s separation from the ideal value measure of RCM, from the anti- ideal value () and from relative closeness () are as follows:
where, , are ideal and anti-ideal values, respectively, , and is the total number of indicators. is the weight assigned to the indicator and indicates the value of indicator for RCM The highest value of indicates the best suitable RCM.
4.5. Group Decision-Making
Group Decision-Making (GDM) is a method that integrates the ranking pattern with reference to individual ranking methods and assigns final ranks to each model. The following equations express the strength (), weakness () and net strengths () of each RCM [23].
The rankings are divided into upper and lower sections in descending order. for an even number of RCMs and for an odd number of RCMs and , where T is the number of the RCMs. The upper section is made up of RCMs with rankings ranging from to . In Equation (10), if, RCM is in the position for the ranking technique and it is otherwise, and corresponds to the RCMs in the upper section. In Equation (11), if RCM is in the position for the MCDM technique and otherwise, and a corresponds to the RCMs in the lower section. represents a ranking technique (). A higher indicates a top-ranked RCM.
4.6. Bias Correction
The simulated precipitation from RCMs should be treated with caution because it contains large biases. They cannot be used to estimate regional climate change impacts without bias correction. IMD precipitation datasets were re-sampled using a bi-linear interpolation technique. To correct the biases in this study, Linear Scaling (LS), Power Transformation (PT), Local Intensity Scaling (LIS), Distribution Mapping (DM), Non-Parametric Quantile Mapping (NPQM) and Non-Parametric Robust Quantile Mapping (NPRQM) were used. Quantile mapping uses distribution-derived transformations to adjust the distribution of a modeled variable () such that it matches the distribution of an observed variable (). The distribution-derived transfer function is defined in Equation (13).
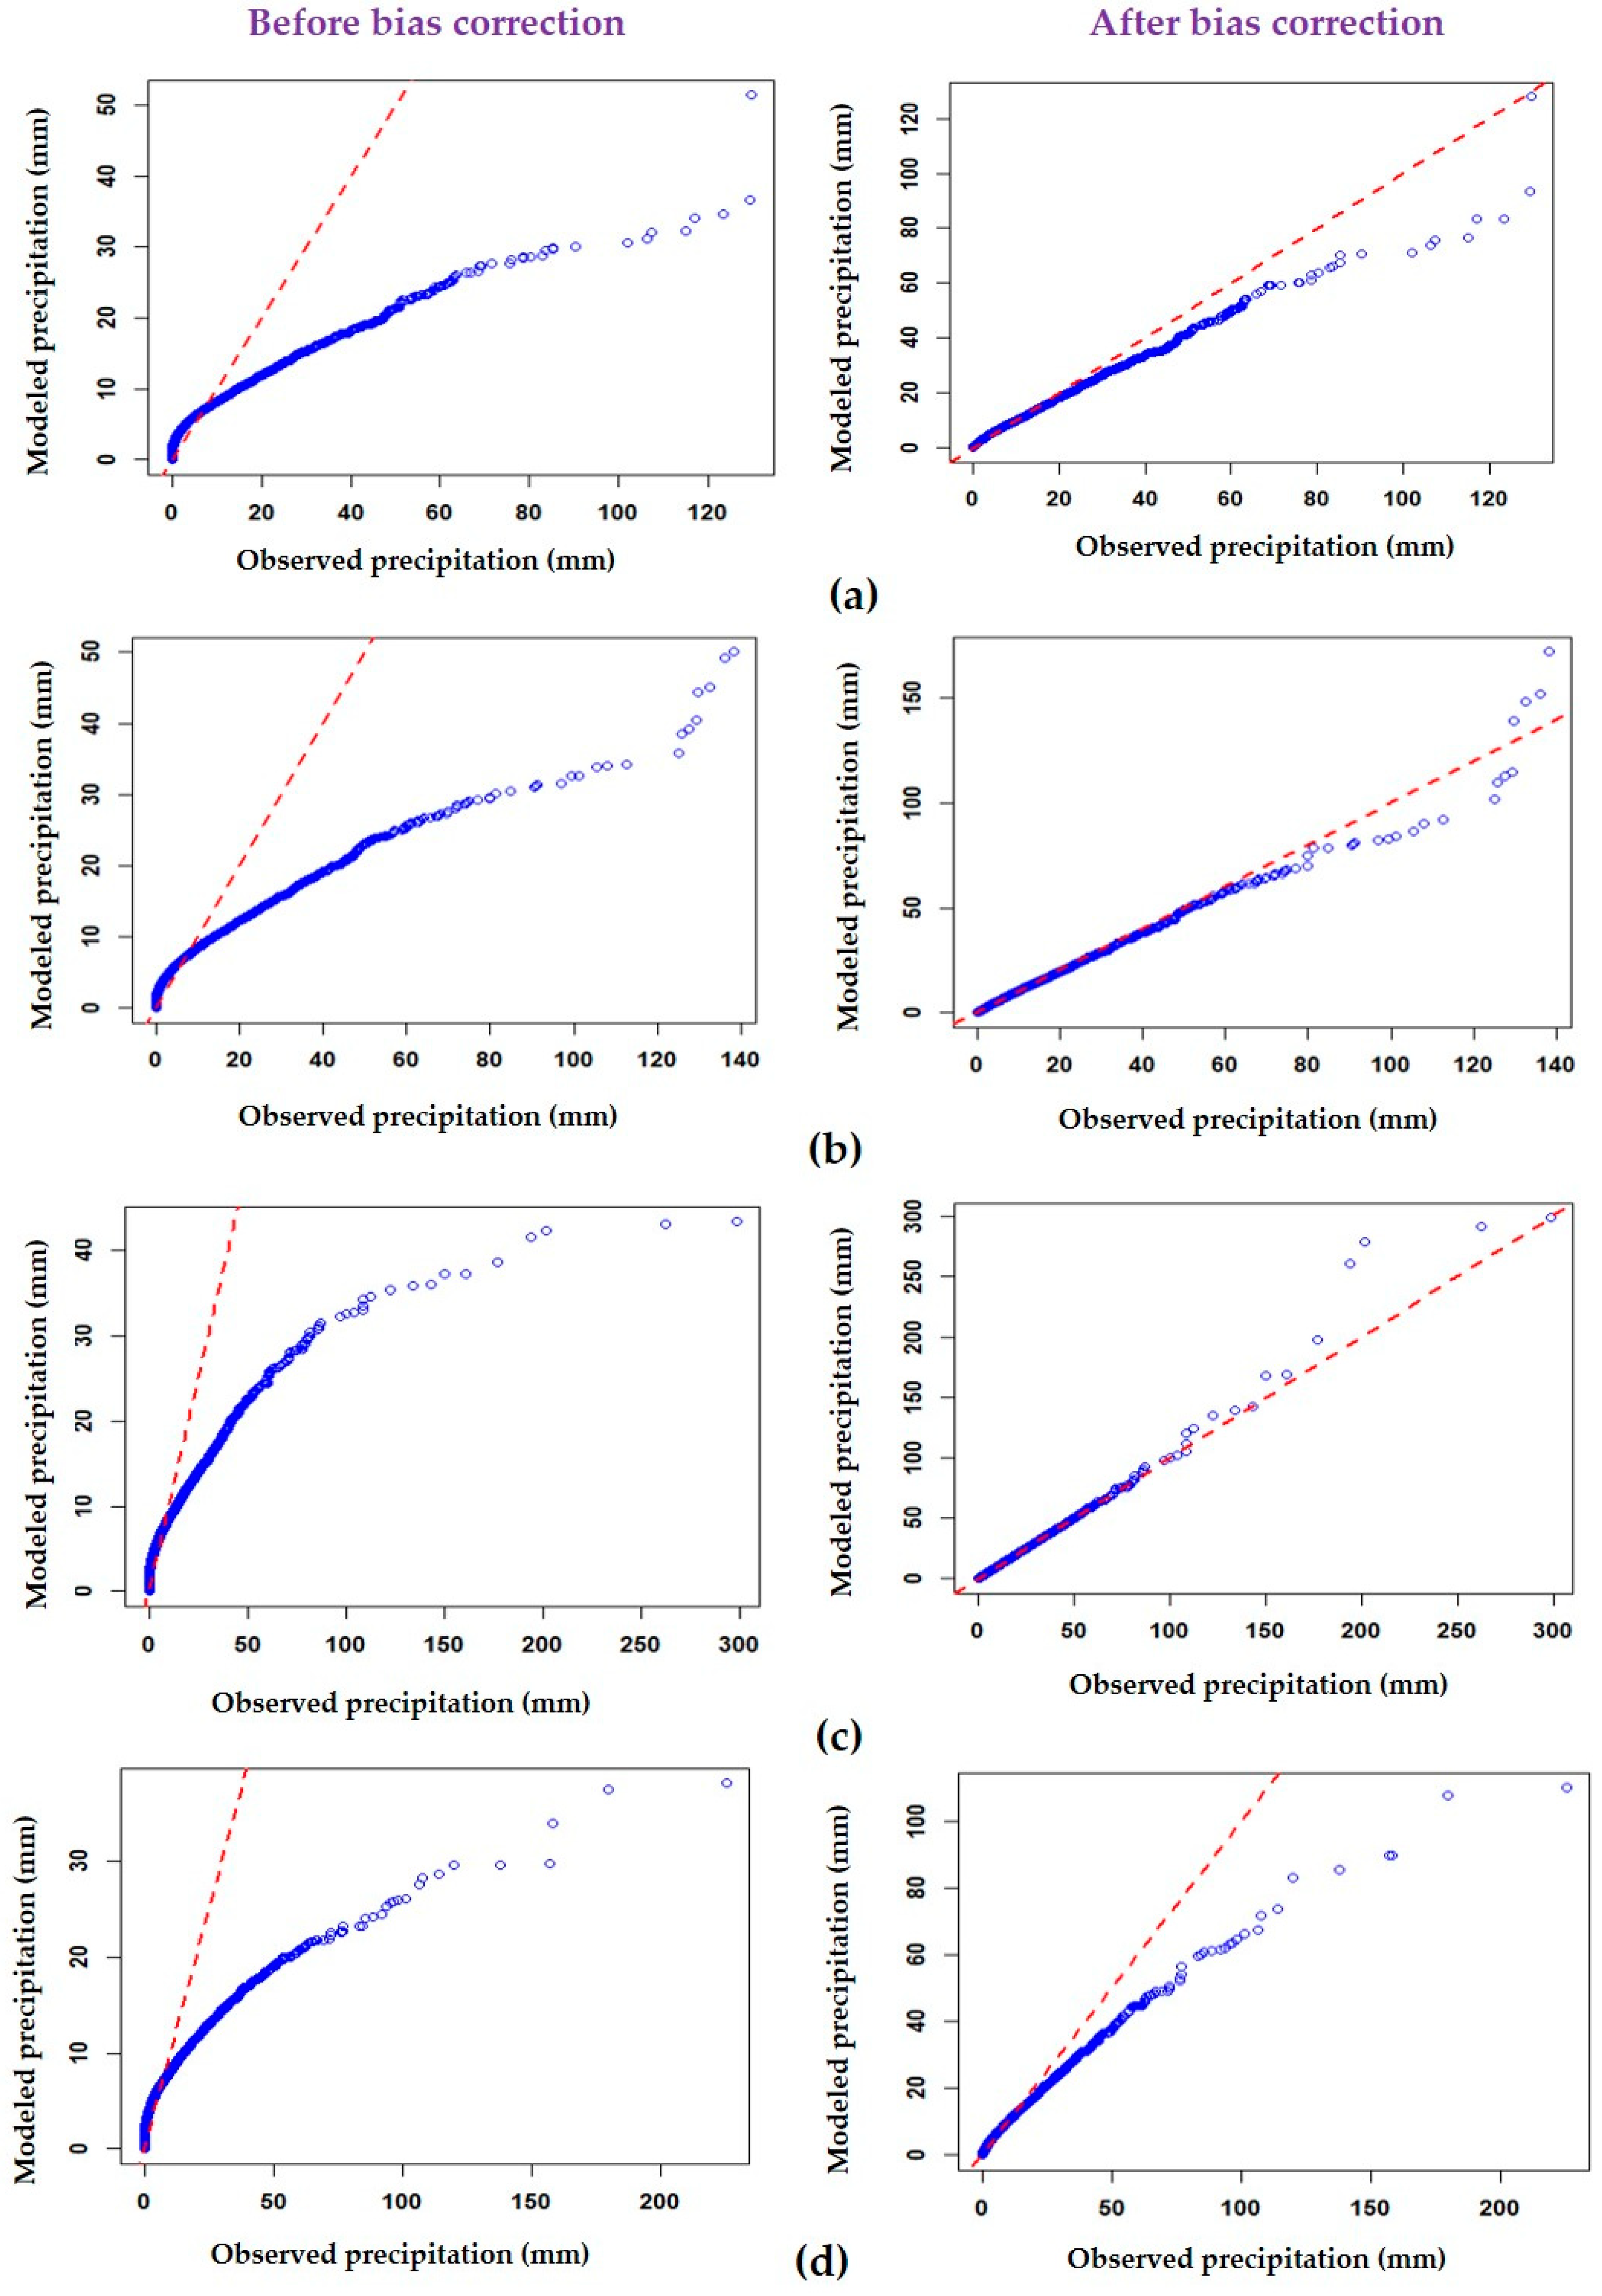
where is a cumulative distribution function (CDF), and is the corresponding quantile function (inverse CDF). The subscripts and indicate the parameters of the distribution that correspond to observed and simulated data, respectively. Non-parametric quantile mapping was applied using a correction table of the two CDFs (observed and simulated), and a linear interpolation was applied between the two percentiles. The sub-basin average daily precipitation before and after bias correction is shown in Figure 3. It is observed from the Figure 3 that the modeled precipitation values were shifted towards observed precipitation values, before and after bias correction, using the non-parametric quantile mapping technique.
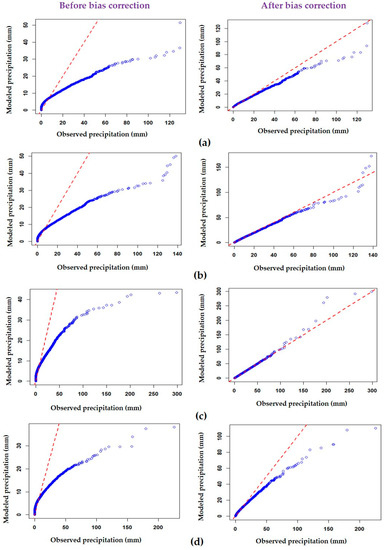
Figure 3.
Sub-basin wise average daily precipitation before and after bias correction (a) S1 (b) S2 (c) S3 (d) S4.
4.7. Extreme Climate Indices
The current study takes into account two precipitation and two temperature extreme indices. The number of heavy precipitation days (RX10MM) denotes a daily precipitation of more than 10 mm, while the number of very heavy precipitation days (RX20MM) denotes a daily precipitation of more than 20 mm. For analysis, the monthly maximum value of daily maximum temperature in summer (TXX) and the monthly minimum value of daily minimum temperature in winter (TNN) are used. RClimDex, developed by Zhang and Yang (2004) [47], is used to calculate extreme climatic indices for identifying precipitation and temperature anomalies for future periods.
4.8. Bilinear Interpolation and IDW
The temperature data obtained from IMD have a resolution 1° × 1°. Temperature data are subjected to bilinear interpolation in order to achieve the same resolution as the 0.25° RCM datasets for both the precipitation and temperature datasets.
5. Results and Discussion
The methodology followed in this study, as shown in Figure 2, was demonstrated at a climate model grid point of 17.375° × 80.125°, and the same procedure was followed for the remaining grid points. At each grid point, the net strength of each RCM was evaluated using suitable performance indicators for precipitation and temperature data.
5.1. Selection of RCMs
Out of nine performance indices: NRMSD, ANMBD, CC and SS were used for precipitation data and ANMBD, NSE, CC and SS for temperature data. The precipitation and temperature indices values for 21 RCMs are shown in Table 2. The weights assigned to each indicator were determined by the entropy method, which influences the ranking of RCMs. Sreelatha et al. (2019) [48] also applied the entropy technique to analyze the entire Telangana region in India. Table 3 shows the weights assigned to each indicator for precipitation and temperature data. The entropy technique assigned the highest weights of 0.697, 0.977 and 0.969 to ANMBD for precipitation and maximum and minimum temperature data. Three different MCDM techniques, CP, WA and TOPSIS, were used to rank the RCMs. Table 4 shows metric, and values for precipitation data, and Table S2 shows the same for temperature data.

Table 2.
The performance index values of precipitation and temperature data for 21RCMs.

Table 3.
Weights assigned to each indicator using the entropy technique for precipitation and temperature.

Table 4.
Metric values of each multicriterion decision-making technique of precipitation data for 21 RCMS.
For each RCM, the strength, weakness and net strengths were calculated based on individual ranking techniques and were integrated to form a single ranking pattern using GDM, the same methodology applied by Morais and Almeida (2012) [49] on water resources based on an individual ranking analysis. The top five precipitation models were BNU-ESM, MIROCHEM, MIROCESM, CanESM2 and MPI-ESMLR. MIROCHEM, IPSL-CM5A-LR, BCC-CSM1, CSIRO-MK3 and MIROCESM were the most suitable RCMs for maximum temperature. The top five suitable RCMs for minimum temperature were BCC-CSM1, MIROCESM, MIROCHEM, BNU-ESM and IPSL-CM5A-LR. Table 5 represents the net strengths and final rankings of each RCM by GDM for the precipitation and temperature data represented in Table S3.

Table 5.
Net strengths and final ranks of each RCM by Group Decision Making for precipitation data.
Weights were assigned to the top five RCMs using an weighted average method considering the net strengths. The top five ranked RCMs for the precipitation and temperature datasets at each grid point were ensembled by assigning weights to reduce uncertainty. The weights assigned to MME are shown in Table 6 and Tables S4 and S5 for precipitation, maximum temperature and minimum temperature data, respectively.

Table 6.
Weights assigned for MME at each grid for precipitation data.
5.2. Bias Correction
The correlation coefficient obtained from all bias correction methods for precipitation data from 1951–2005 are shown in Table 7. The results show that the non-parametric quantile mapping method outperformed the other methods, with a correlation coefficient of 0.81 for MME data with observed precipitation. Similar results were reported by other studies [34,41,42], in the case of the non-parametric quantile mapping method. The bias correction was applied at all grid points for precipitation data, both in historic and future periods, using the non-parametric quantile mapping method. Figure 3 depicts the plots of average daily precipitation for observed and historic MME before and after bias correction.

Table 7.
Correlation Coefficient obtained from all the bias-correction methods for precipitation data.
5.3. Analysis of Precipitation
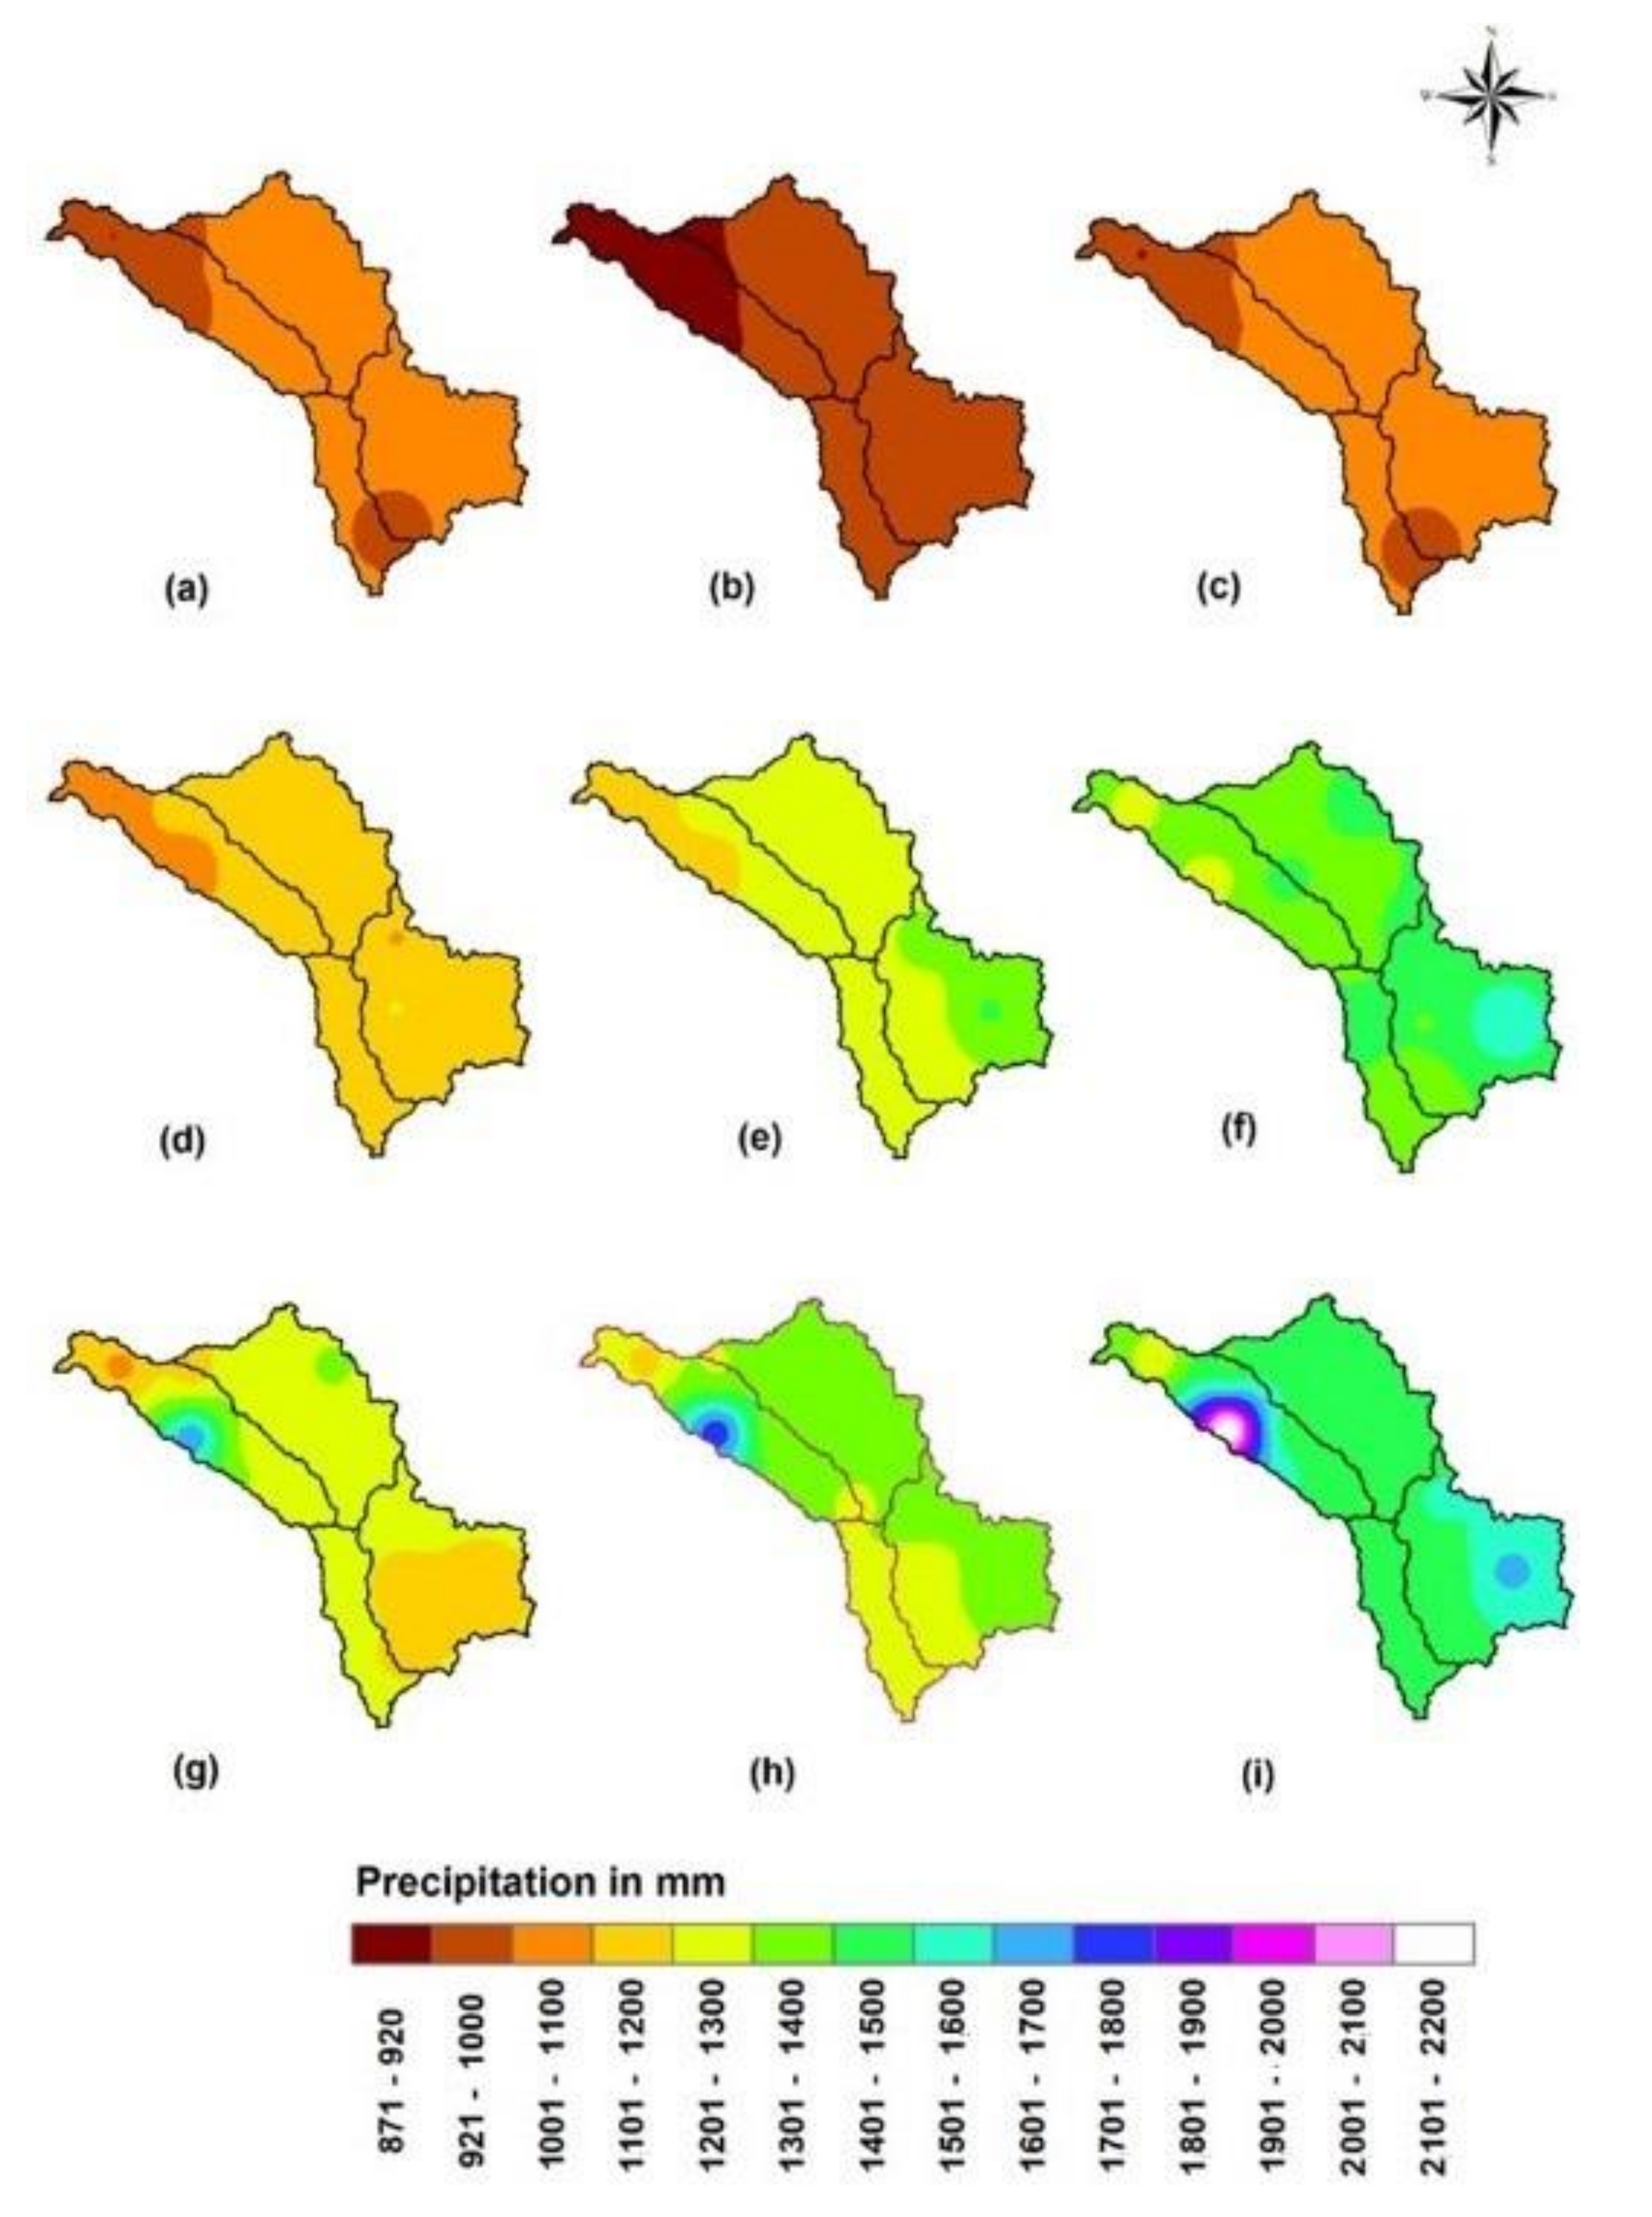
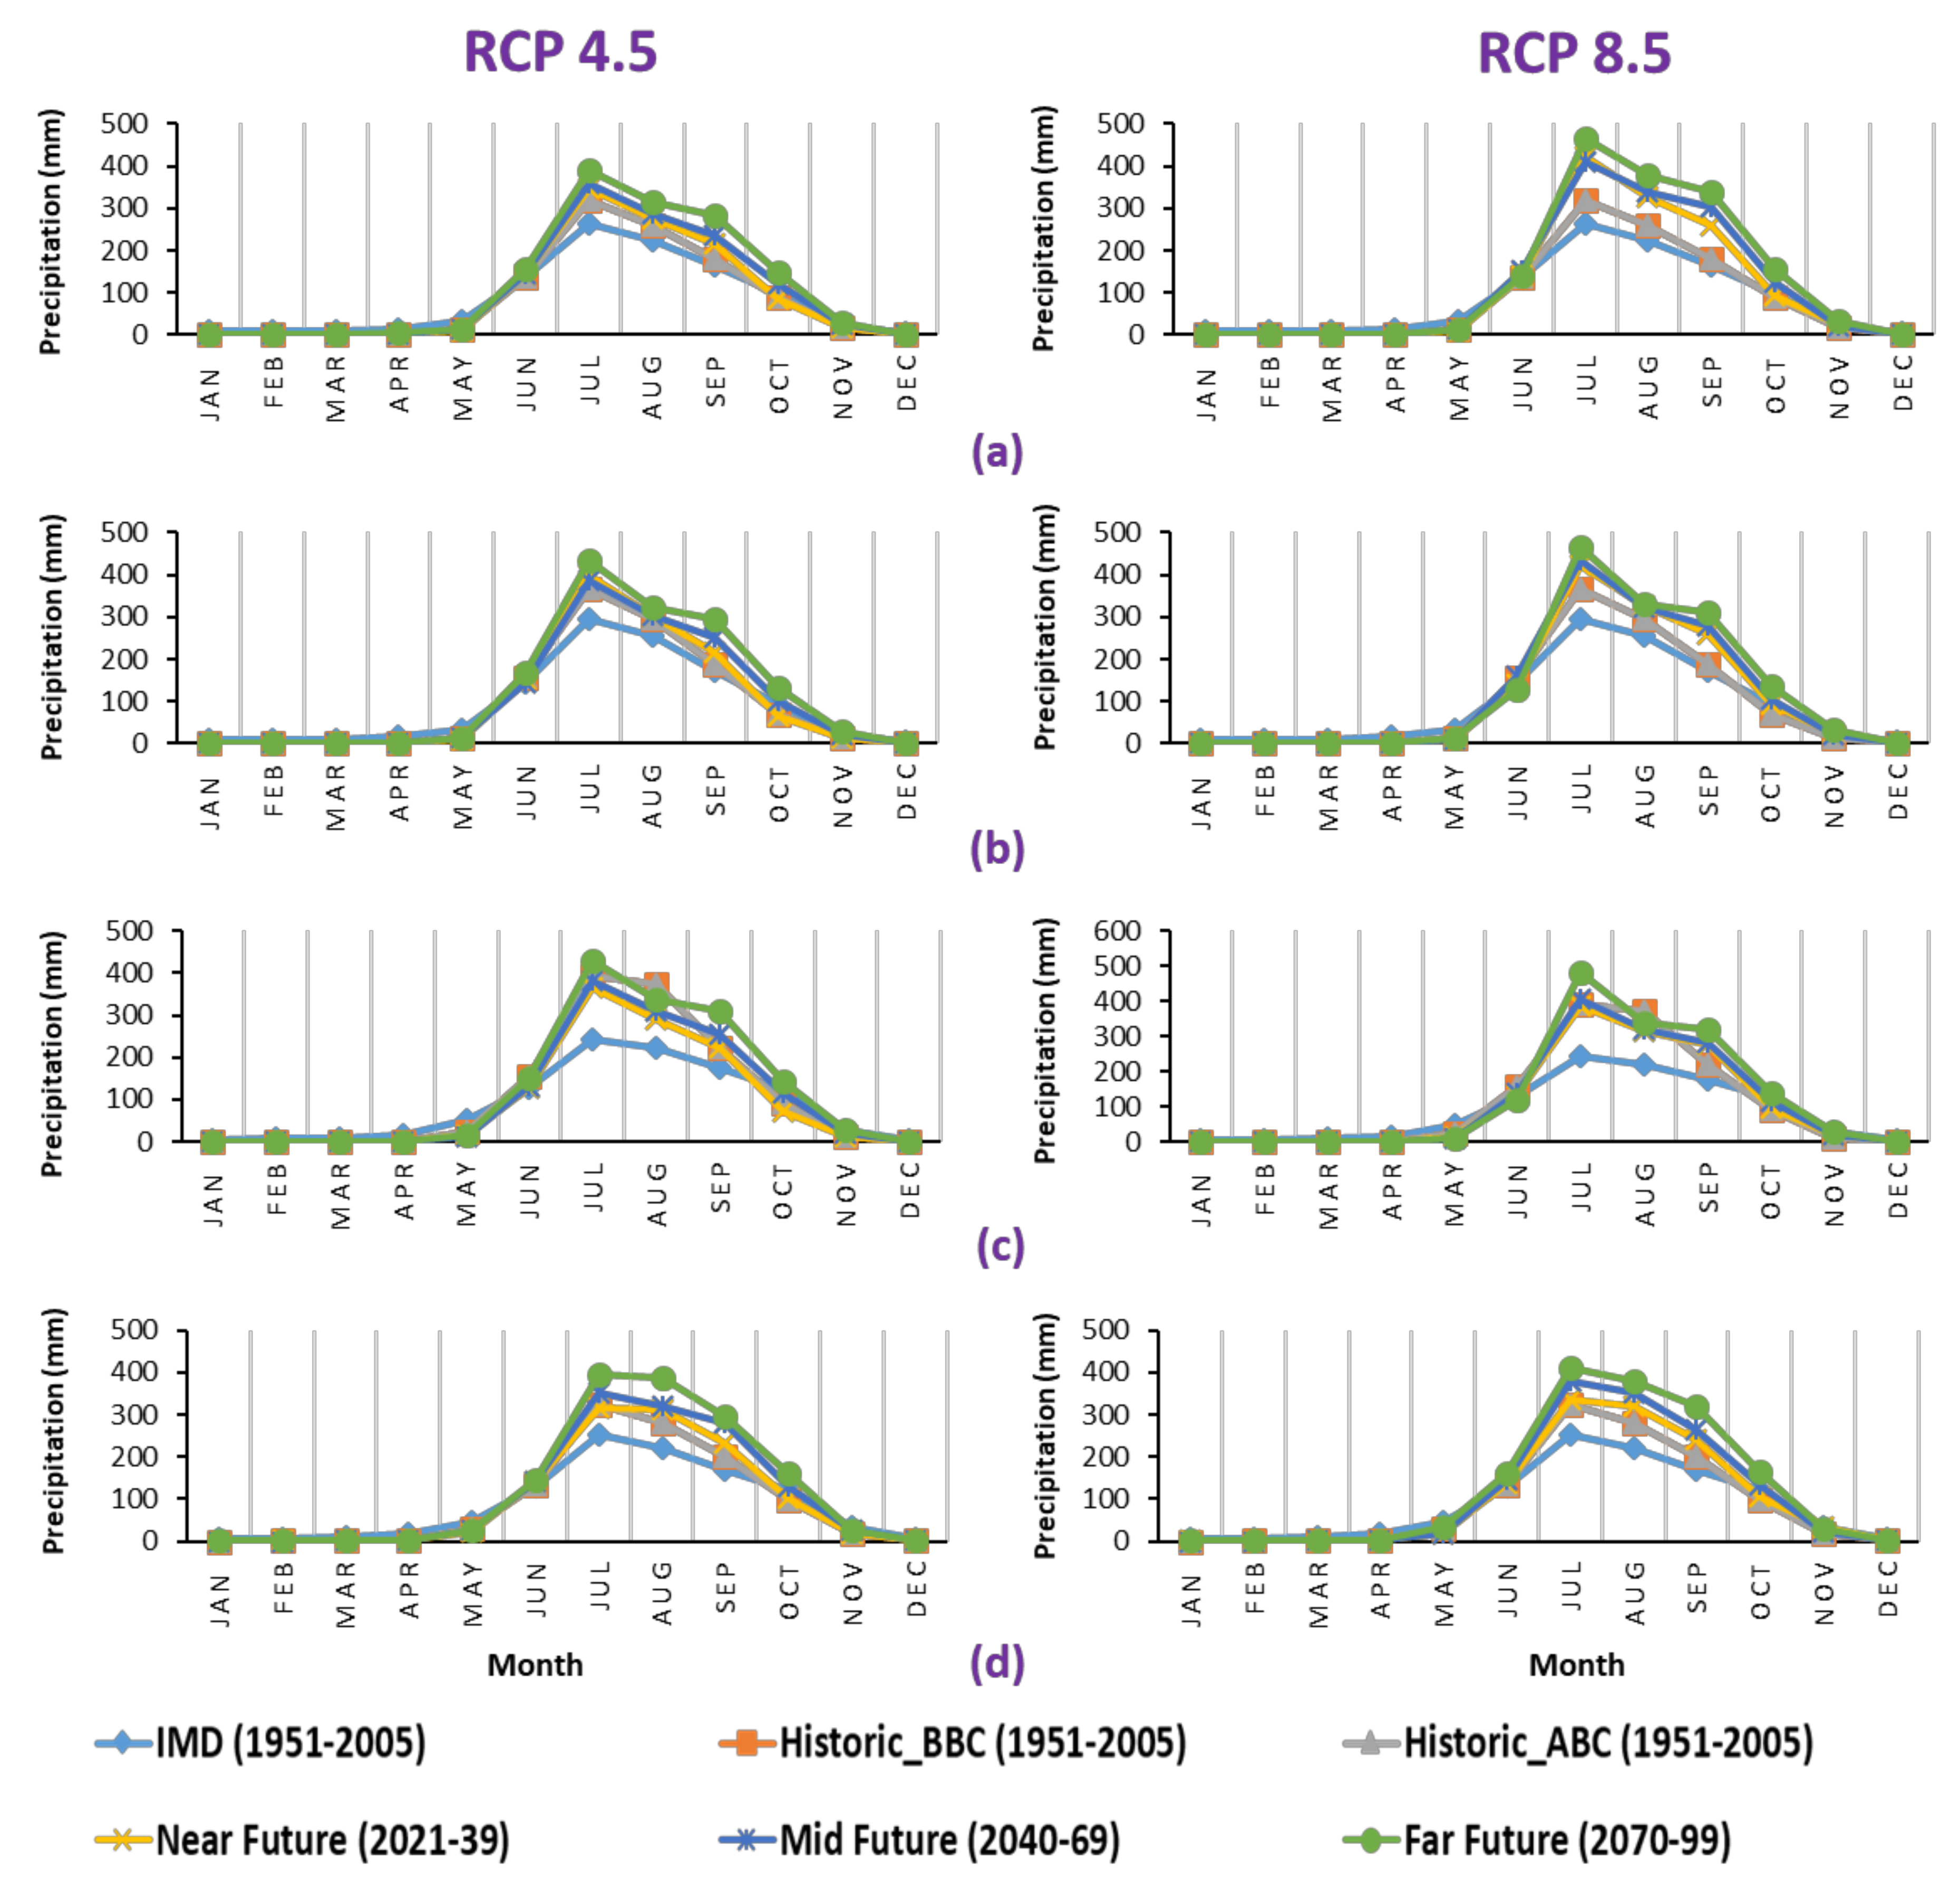
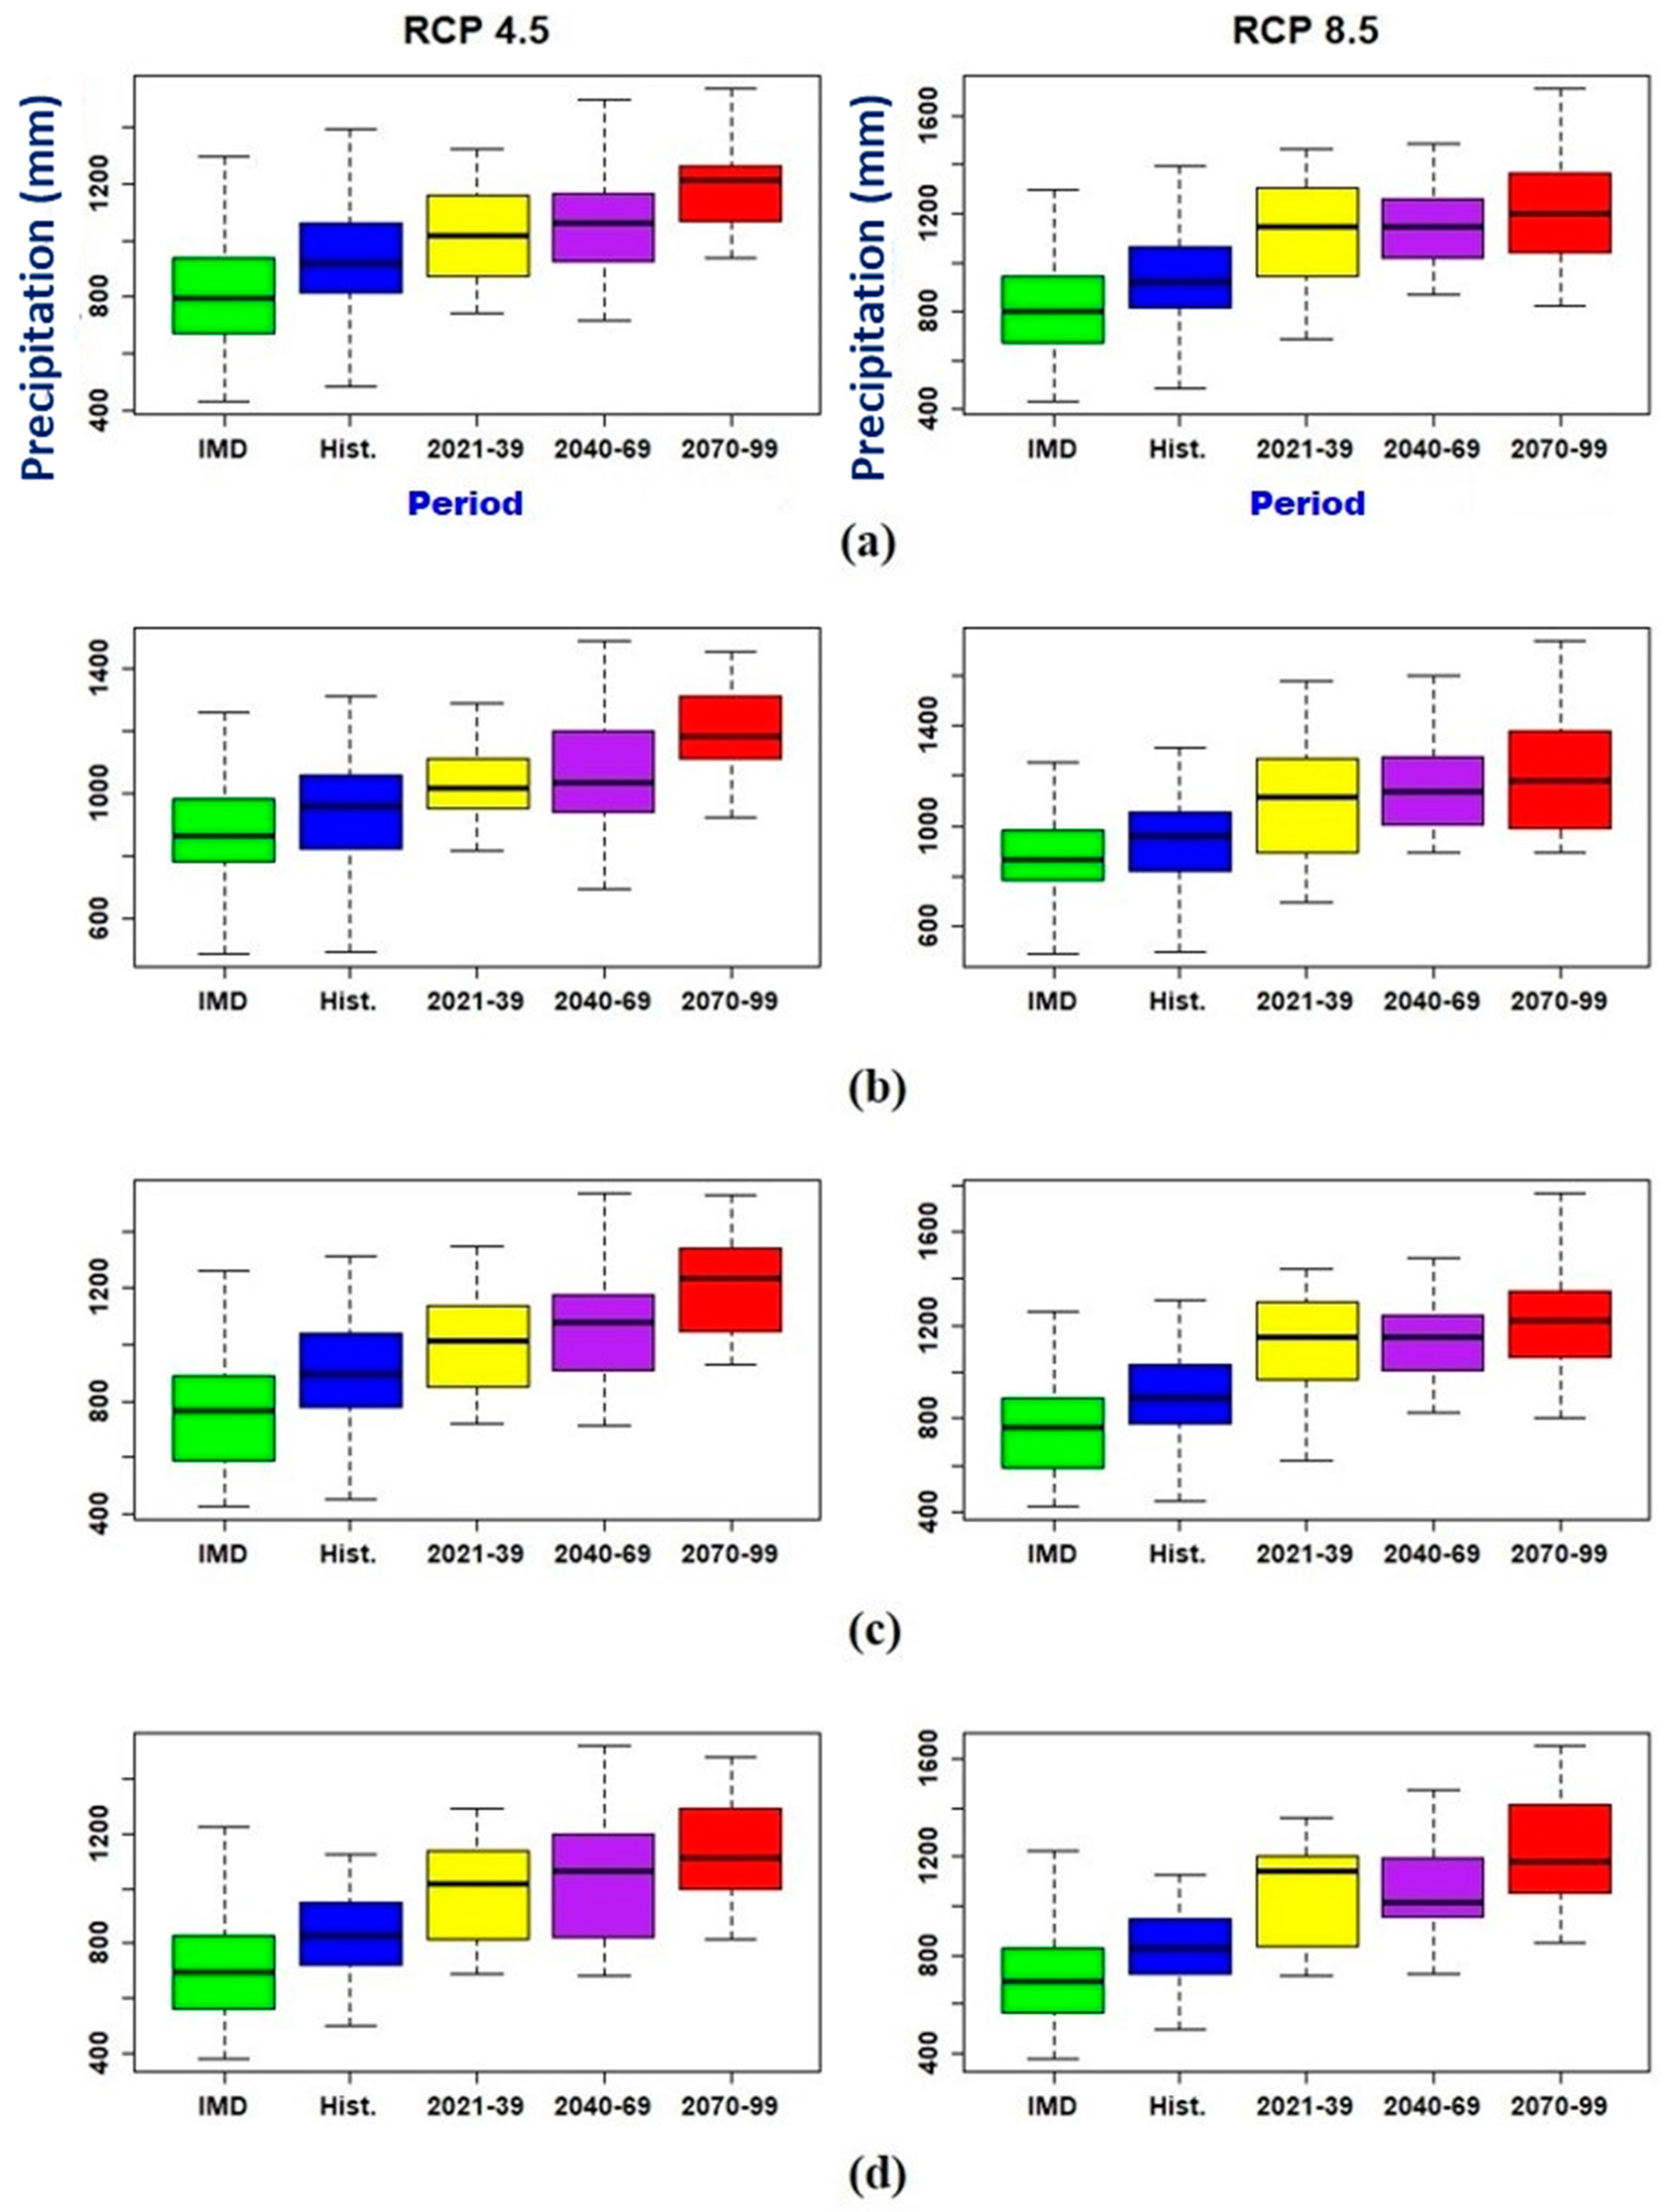
Figure 4 demonstrates the spatial variation of the annual average precipitation for different periods over the Munneru basin, clearly indicating the variation in future periods compared to the observed period. The Inverse Distance Weightage (IDW) interpolation technique is used to generate spatial plots. Table 8 represents the variations of annual average precipitation in different periods for the four sub-basins under two scenarios. When compared to the historic period, precipitation increased by 10%, 21% and 37% in the three future periods for the RCP 4.5 scenario, and by 23%, 30% and 45% for the RCP 8.5 scenario. However, the results differed from those of Sowjanya et al. (2018) [50], who worked in the lower Krishna river basin and used only five available RCM models. Within the Munneru basin, the S4 sub-basin under the RCP 4.5 scenario and the S1 sub-basin under the RCP 8.5 scenario had the greatest increase in precipitation in future periods when compared to the historic period. The monthly mean plots in Figure 5 show an increasing trend for all future periods, with no shifts in the precipitation pattern. In the study area, 90 percent of the annual rainfall falls during the monsoon (June, July, August and September) and post-monsoon (October and November) seasons. The RCP 4.5 scenario increased the annual average monsoon precipitation by 28, 34 and 51% in 2021-39, 2040-69 and 2070-99, compared to a 38, 43 and 55% increase in the RCP 8.5 scenario. Similar results were observed for the entire Krishna basin in 2041–2070 and 2073–2100 under the RCP 8.5 scenario [51]. Figure 6 and Figure S2 show box plots of average annual monsoon and post-monsoon precipitation for all periods under two scenarios.
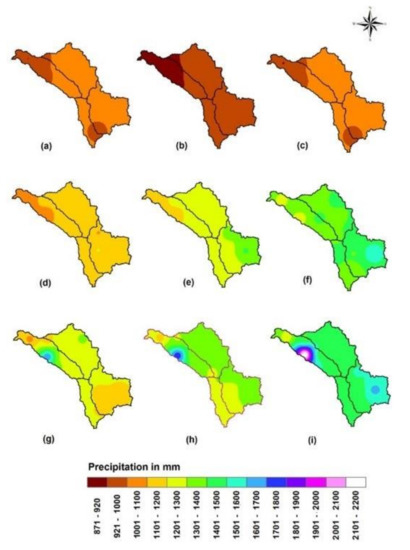
Figure 4.
Spatial variation of average annual precipitation (mm) (a) IMD, Historic period (1950–2005) (b) before bias correction (c) after bias correction, under RCP 4.5: (d) 2021–39 (e) 2040–69 (f) 2070–99, under RCP 8.5: (g) 2021–39 (h) 2040–69 (i) 2070–99.

Table 8.
Variation of annual average precipitation for different periods under the RCP 4.5 and RCP 8.5 scenarios.
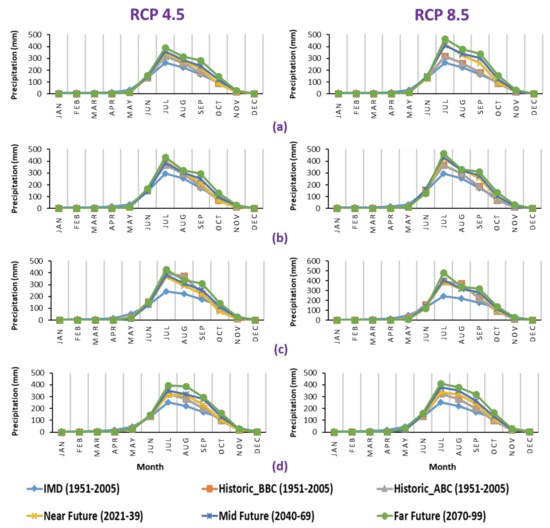
Figure 5.
Sub-basin-wise monthly mean precipitation (a) S1 (b) S2 (c) S3 (d) S4.
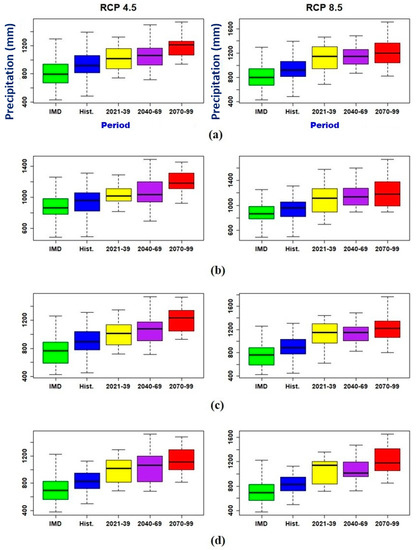
Figure 6.
Sub-basin-wise annual average monsoon precipitation (a) S1 (b) S2 (c) S3 (d) S4.
5.4. Analysis of Maximum Temperature
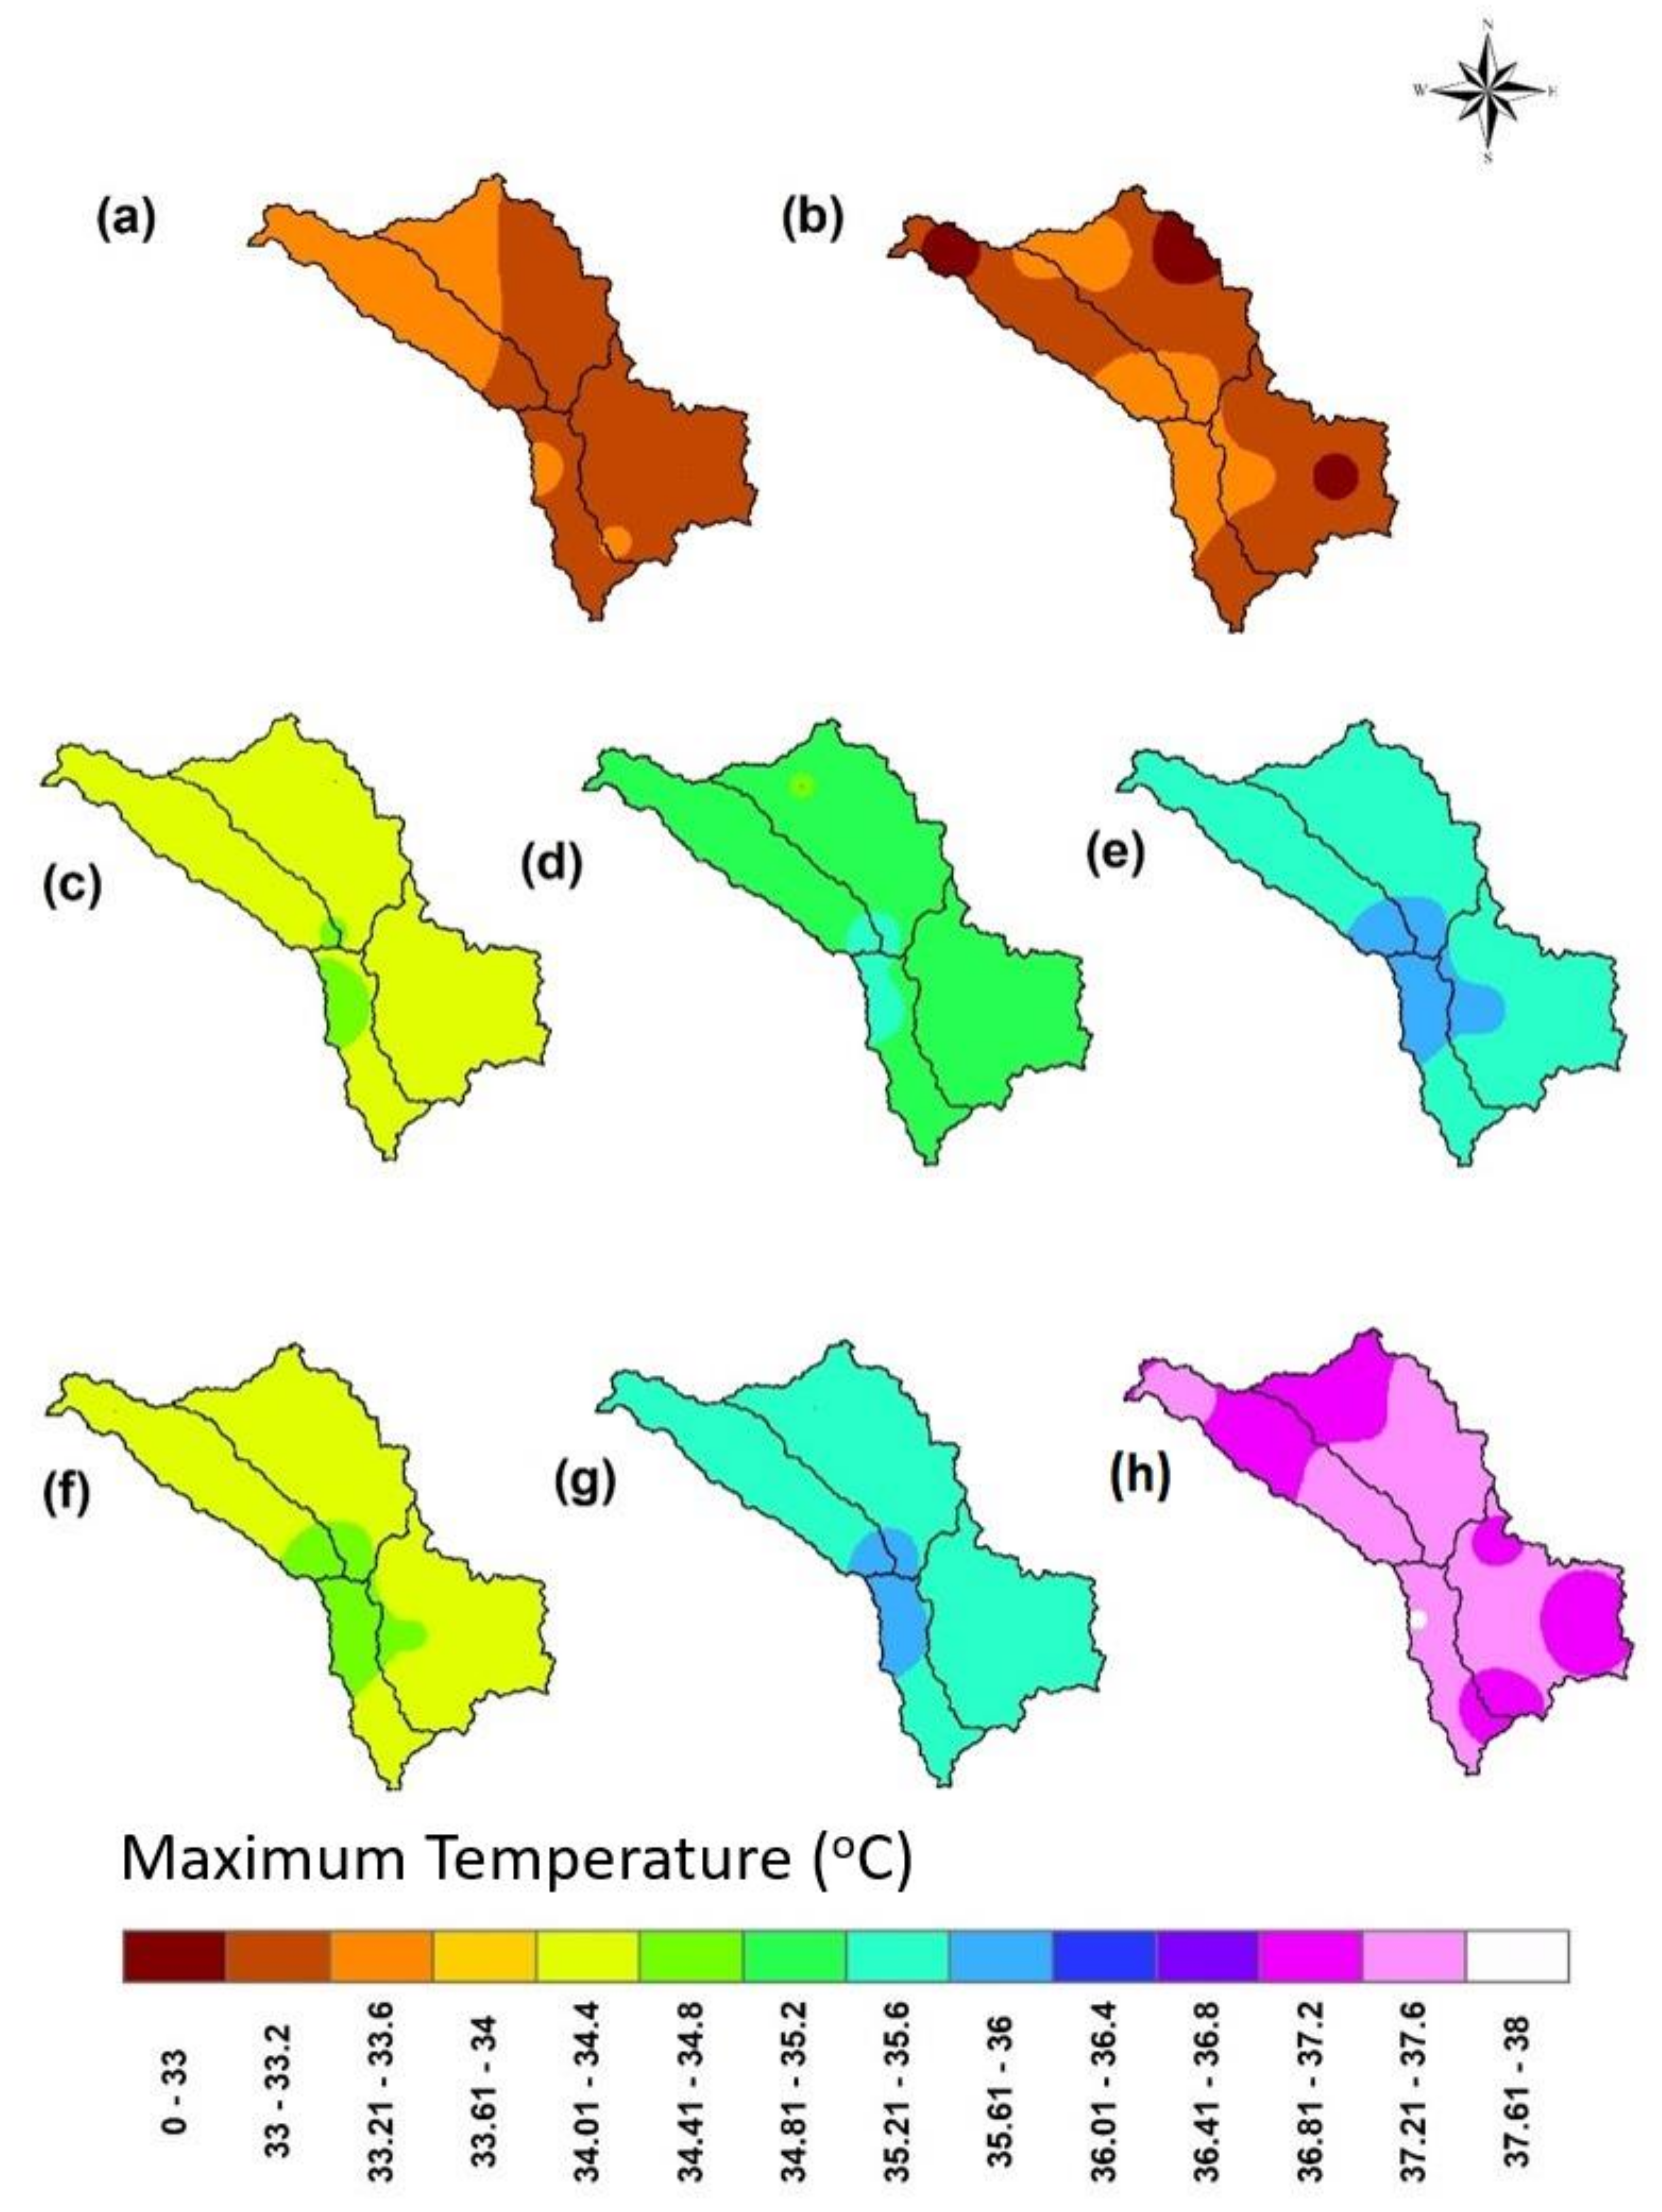
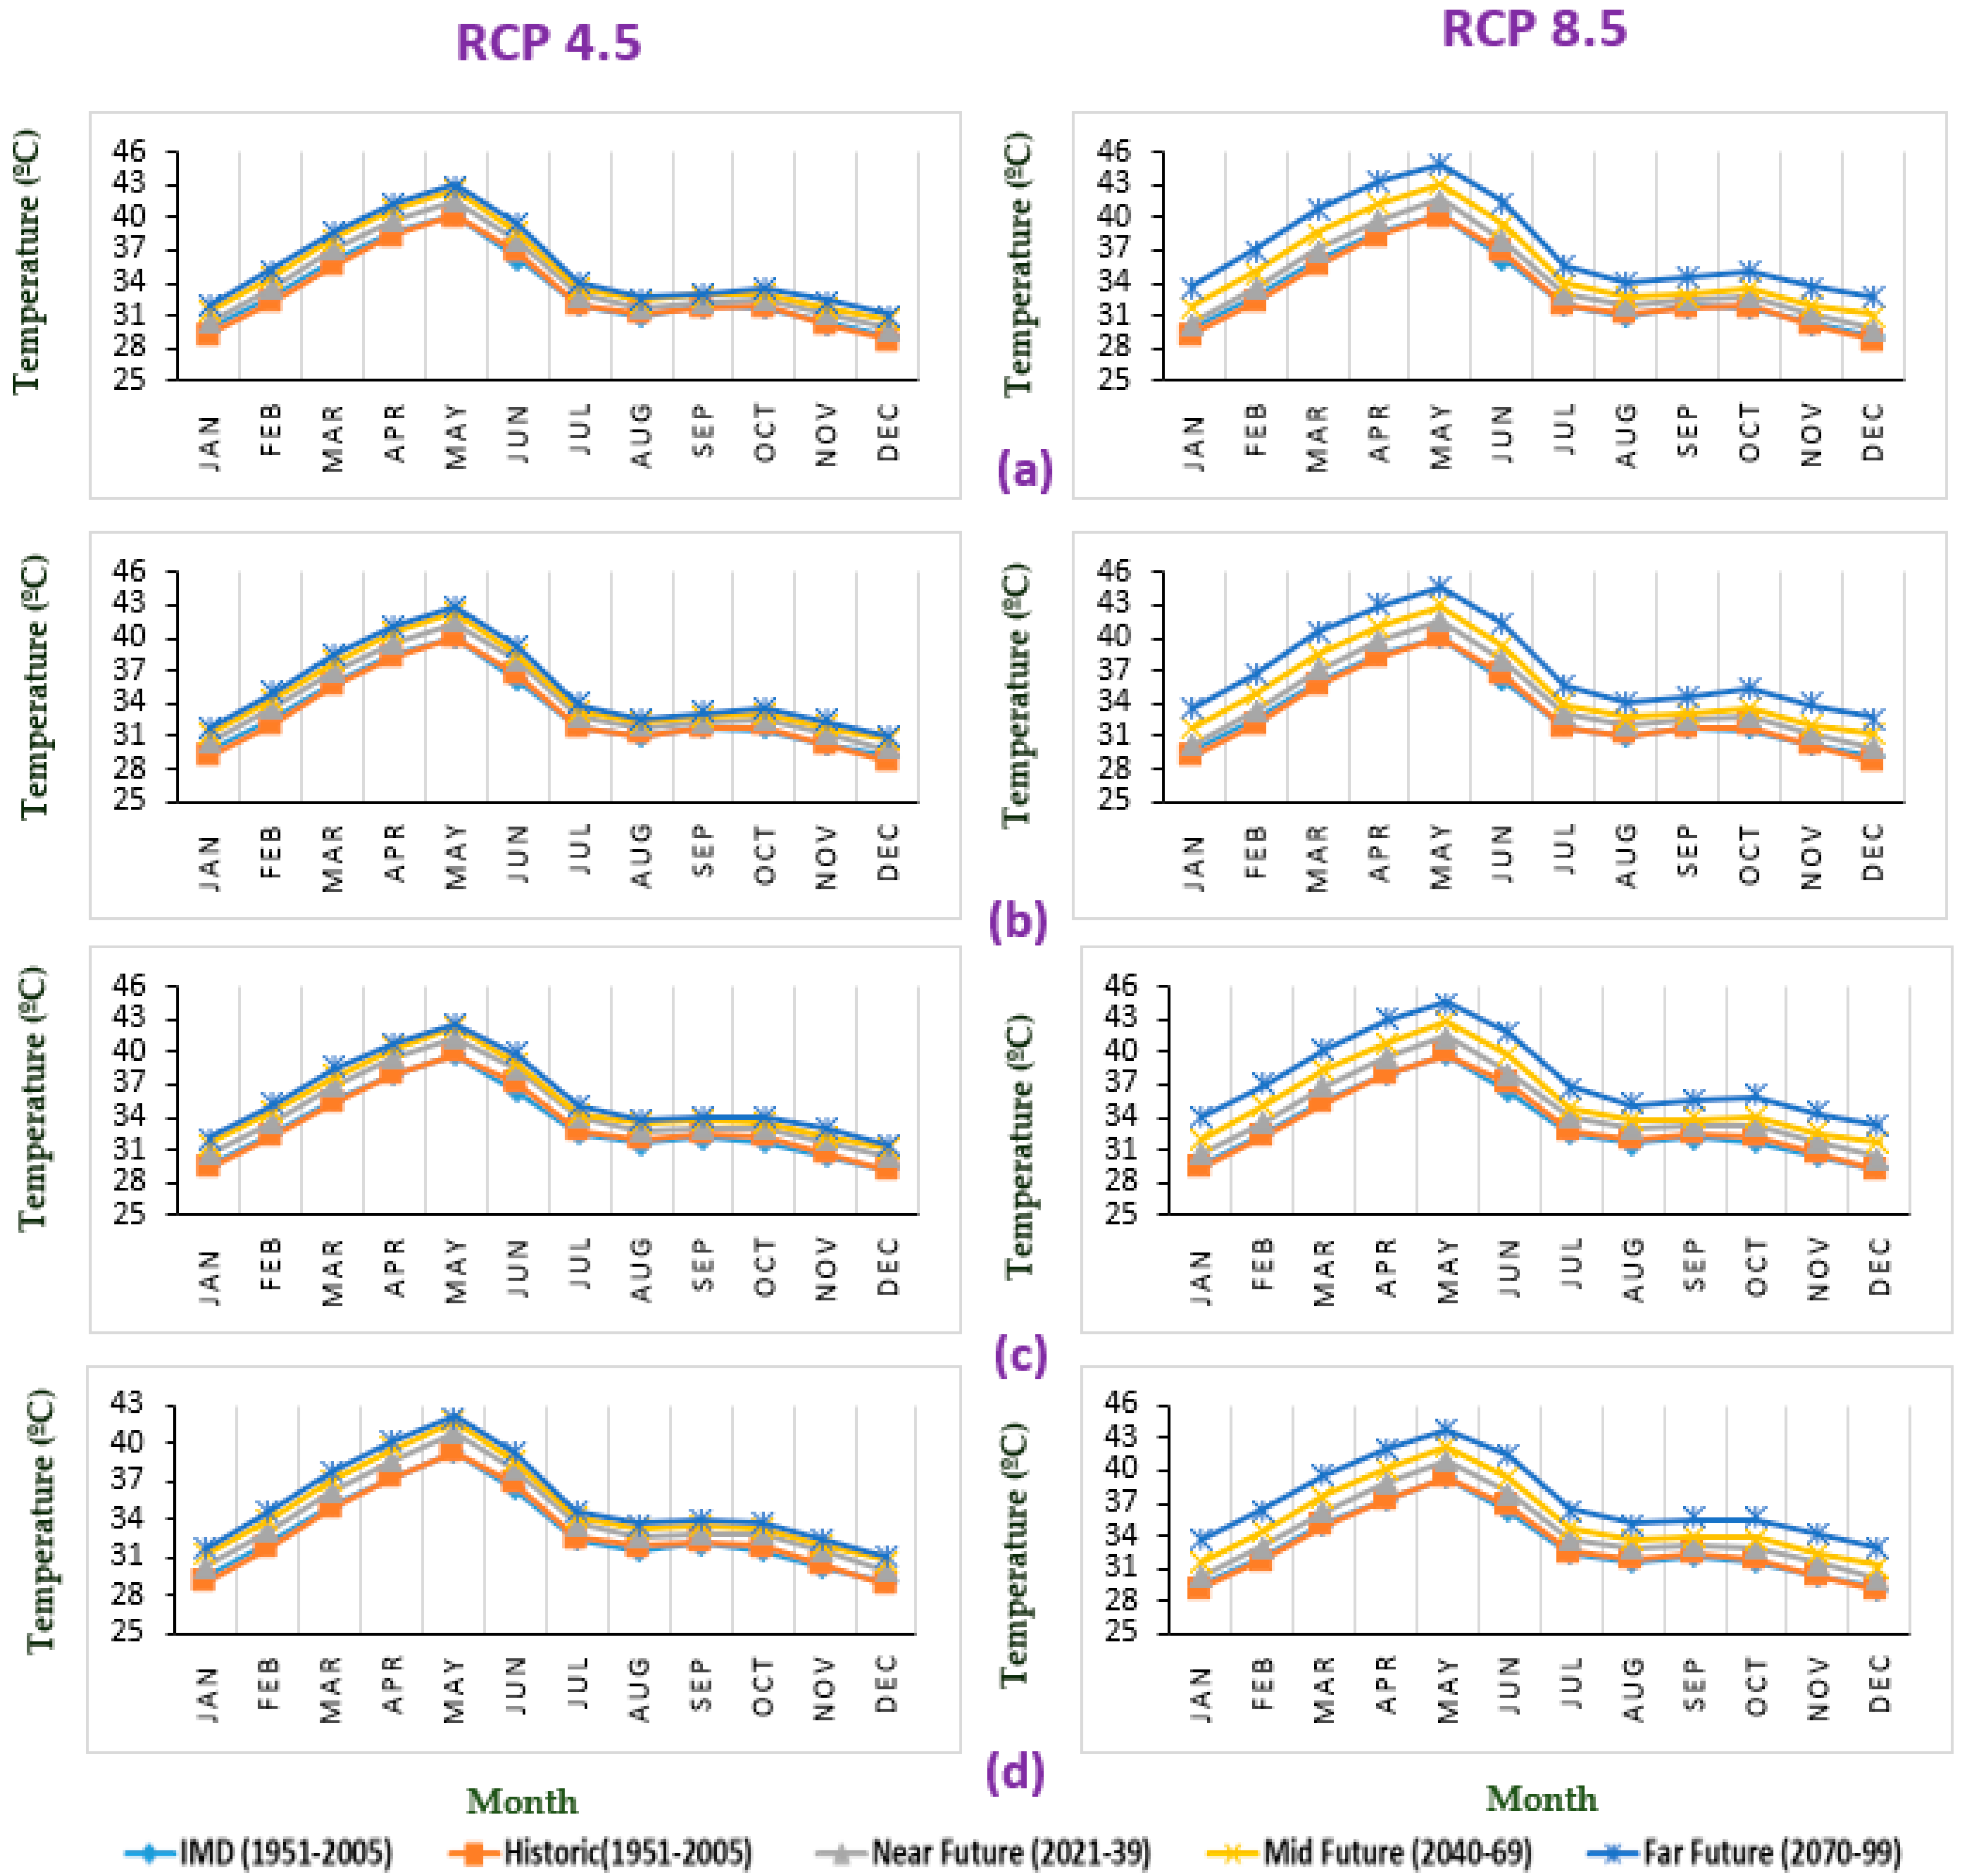
The spatial variation of the annual average maximum temperature for different periods over the Munneru river basin is shown in Figure 7, and it clearly indicates the variation in future periods compared to the historic period. Table 9 represents the future maximum temperature increase relative to the observed period for the four sub-basins under two scenarios. In three future periods for RCP 4.5, there was a rise of 1.1 °C, 1.9 °C and 2.4 °C, and for RCP 8.5 there was a rise of 1.2 °C, 2.3 °C and 4.1 °C. Within the Munneru basin, the S1 sub-basin under the RCP 4.5 scenario and the S3 sub-basin under the RCP 8.5 scenario had the greatest increase in maximum temperature in future periods when compared to the historic period. The monthly mean plots in Figure 8 showed shifts to warmer temperatures for all future periods. The annual average summer maximum temperature was expected to rise by 1.3 °C, 2.3 °C and 2.8 °C in 2021–39, 2040–69 and 2070–99 for the RCP 4.5 scenario, compared to 1.4 °C, 2.8 °C and 4.6 °C for the RCP 8.5 scenario. Figure S3 illustrates the box-plots of average annual summer maximum temperature for all periods under the two scenarios.
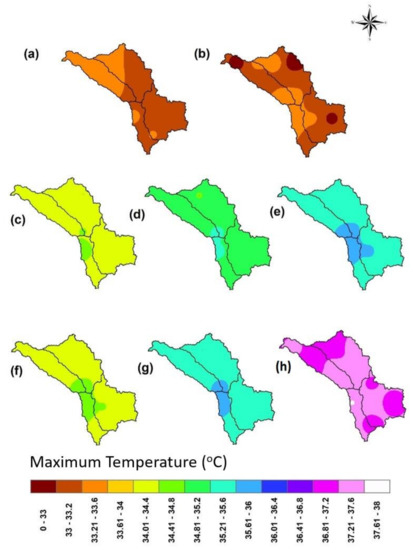
Figure 7.
Spatial variation of average annual maximum temperature (°C) (a) IMD (b) Historic period (1950–2005), under RCP 4.5: (c) 2021–39 (d) 2040–69 (e) 2070–99, under RCP 8.5: (f) 2021–39 (g) 2040–69 (h) 2070–99.

Table 9.
Variation of annual average maximum temperature for different periods under the RCP 4.5 and RCP 8.5 scenarios.
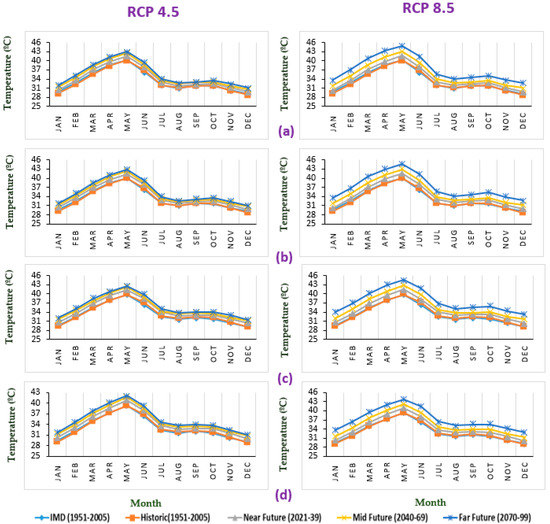
Figure 8.
Sub-basin-wise mean monthly maximum temperature (°C) (a) S1 (b) S2 (c) S3 (d) S4.
5.5. Analysis of Minimum Temperature
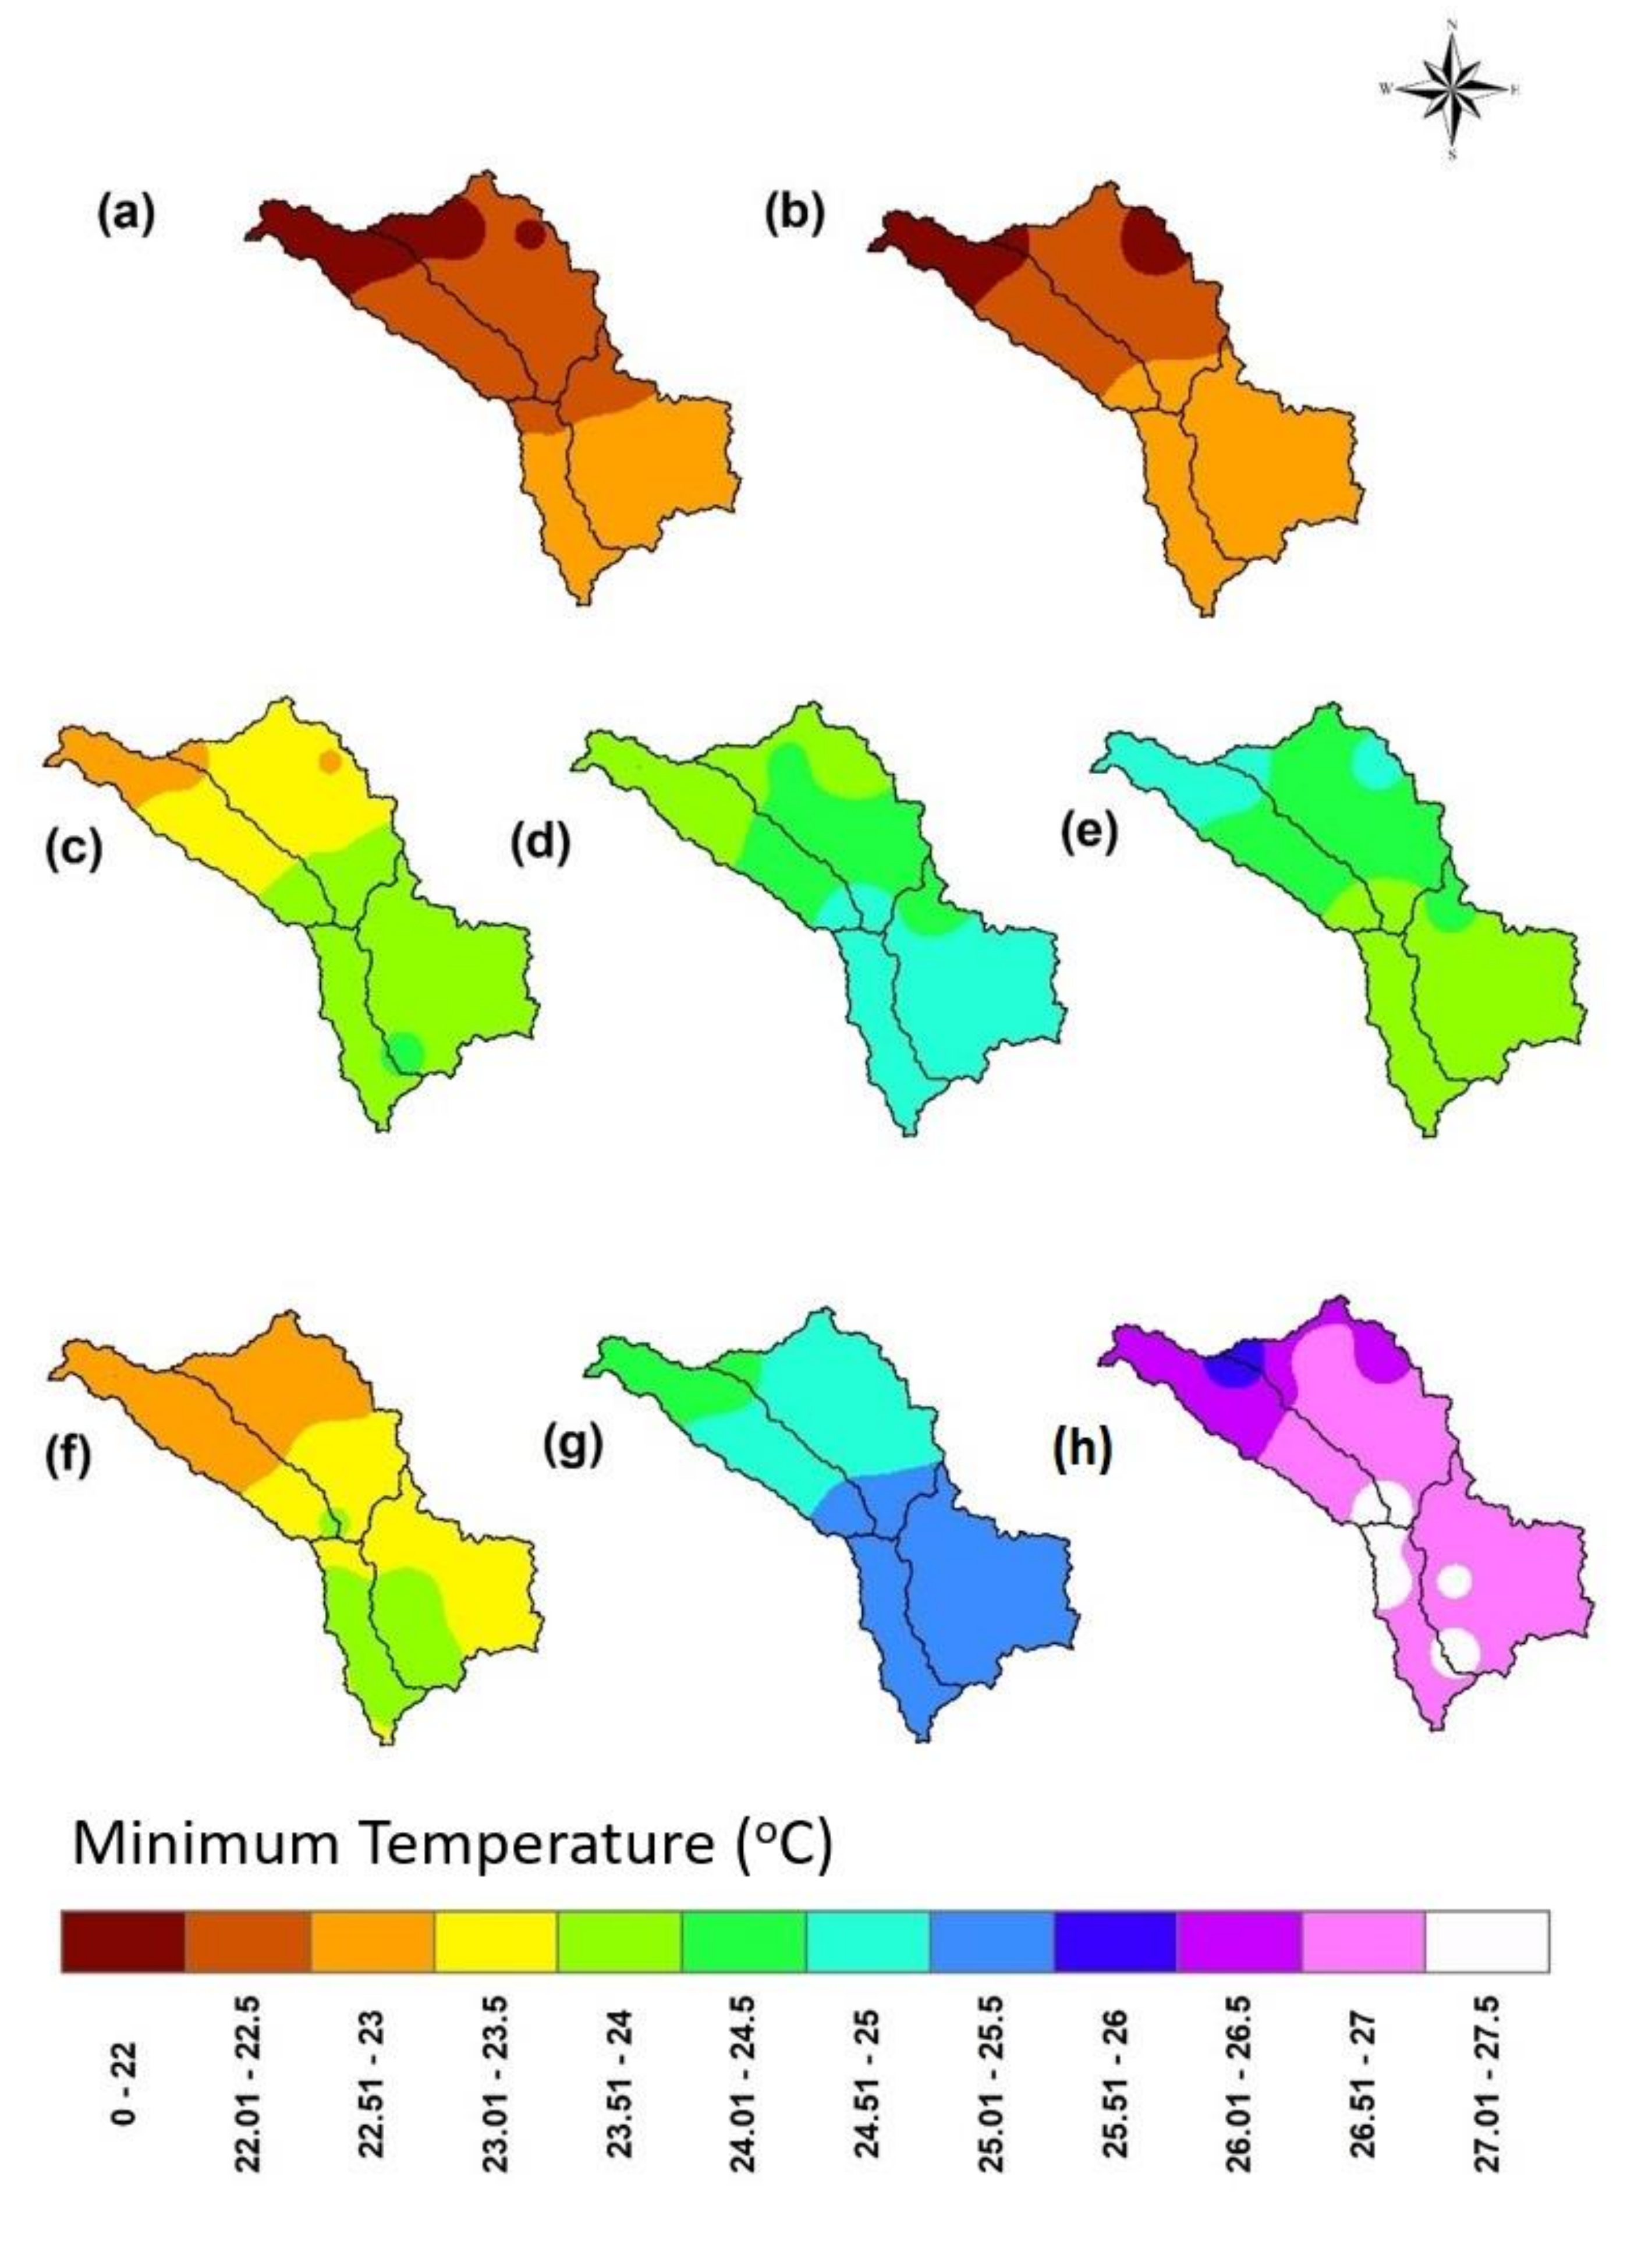
The spatial variation of the annual average minimum temperature for different periods over the Munneru river basin is shown in Figure 9, indicating that future periods might have less spatial variation. Table 10 represents the future minimum temperature increase relative to the observed period for the four sub-basins under two scenarios. There was a rise of 1.1 °C, 1.9 °C and 2.5 °C in three future periods for RCP 4.5, and 1.3 °C, 2.6 °C and 4.4 °C for RCP 8.5. Within the Munneru basin, the S1 sub-basin under the RCP 4.5 and RCP 8.5 scenarios had the greatest increase in minimum temperature in future periods when compared to the historic period. From the monthly mean plots shown in Figure S4, an increasing trend was evident for all the future periods, with no shifts in the minimum temperature pattern. The annual average winter maximum temperature was expected to rise by 1.3 °C, 2.1 °C and 2.6 °C in 2021–39, 2040–69 and 2070–99 for the RCP 4.5 scenario, compared to 1.4 °C, 2.5 °C and 4.5 °C rises for the RCP 8.5 scenario. Box-plots of average annual summer maximum temperature for all periods under two scenarios are shown in Figure S5.
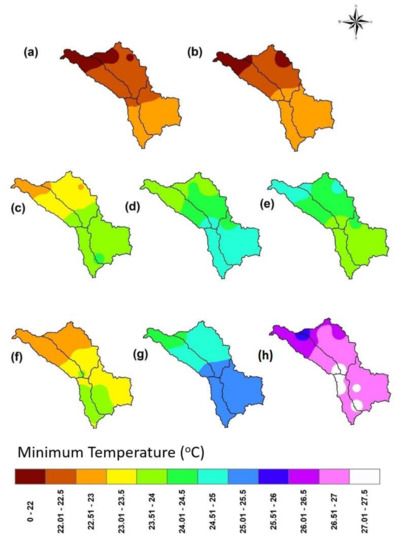
Figure 9.
Spatial variation of average annual minimum temperature (oC) (a) IMD (b) Historic period (1950–2005), under RCP 4.5: (c) 2021–39 (d) 2040–69 (e) 2070–99, under RCP 8.5: (f) 2021–39 (g) 2040–69 (h) 2070–99.

Table 10.
Variation of annual average minimum temperature for different periods under the RCP 4.5 and RCP 8.5 scenarios.
REA results demonstrated that the best suited RCMs for this study area for precipitation were BNU-ESM, MIROCHEM and MIROCESM; for the maximum temperature, they were MIROCHEM, MIROCESM, BNU-ESM and BCC-CSM-1; and for the minimum temperature, they were CSIRO-Mk3-6-0, MIROCHEM and BCC-CSM-1. The best suited models differed from those found by Chanapathi et al. (2018) [49] for the entire Krishna basin, who considered ten available models.
5.6. Impact of Extreme Indices
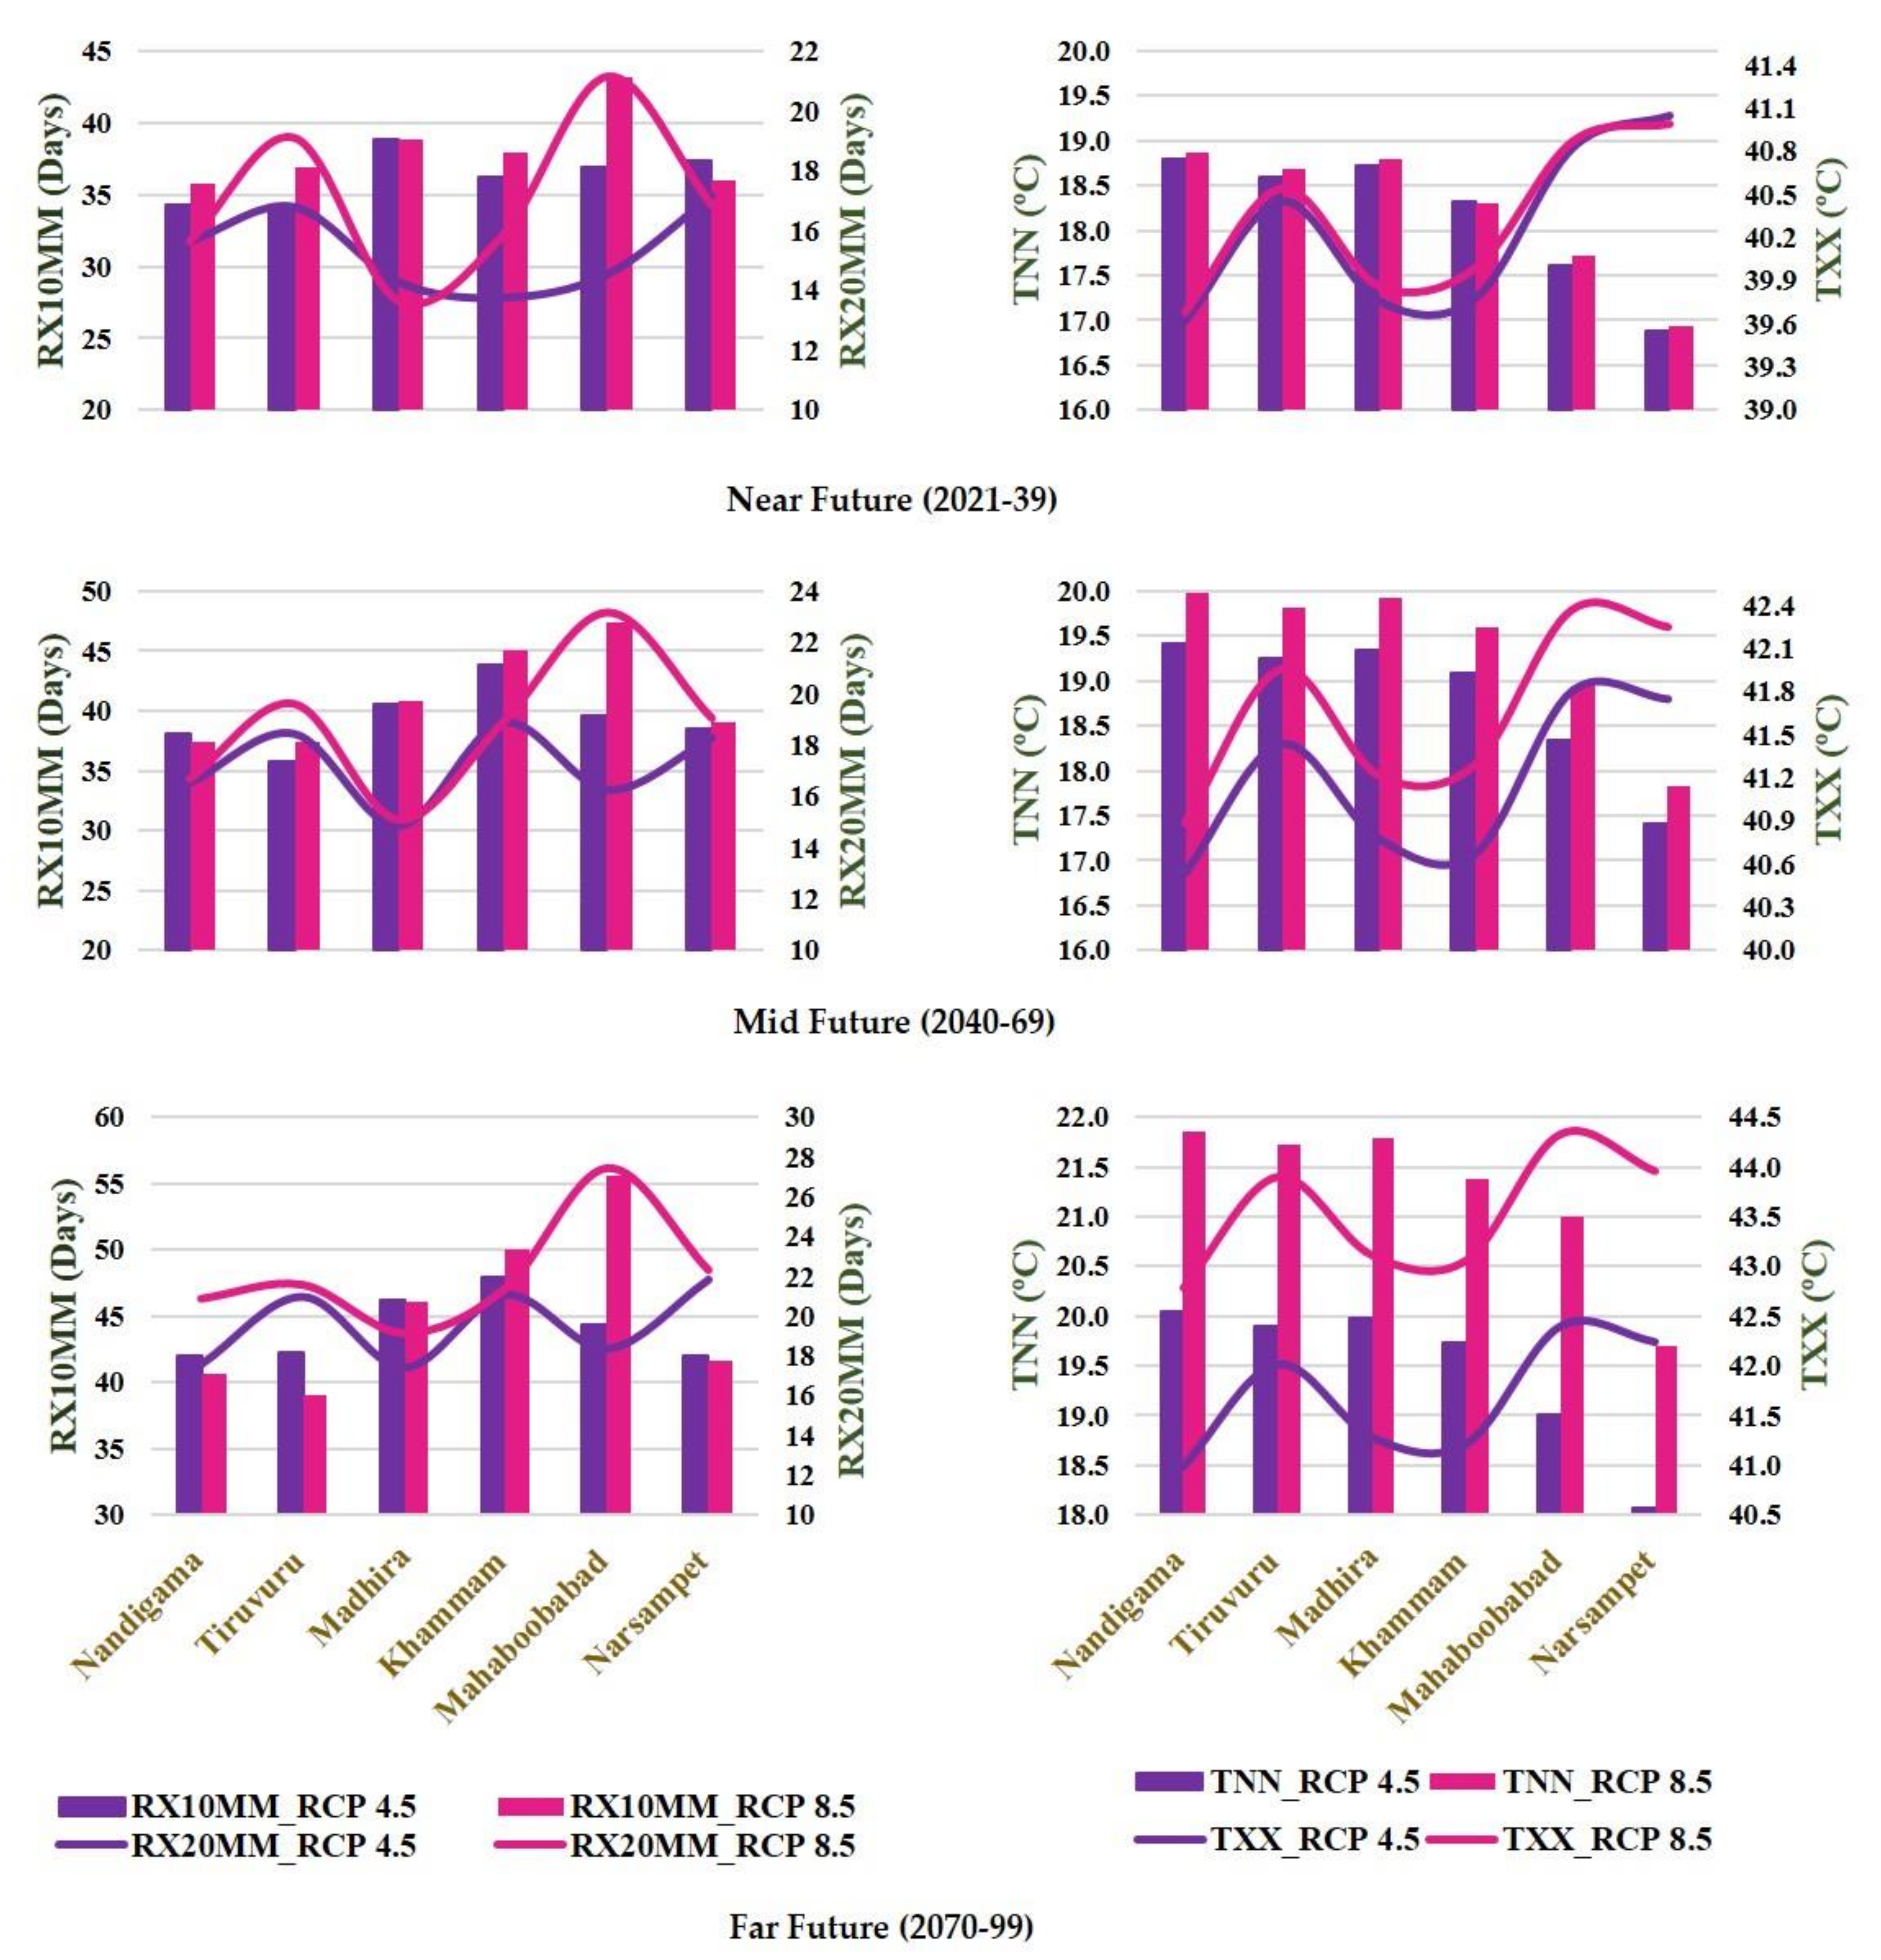
The variation of extreme indices in important urban areas was calculated over three future periods (Figure 10). For the RCP 4.5 scenario, the average maximum heavy precipitation days (RX10MM) in the near future (2020–2039) were observed in Madhira, and the average minimum heavy precipitation days were observed in Tiruvuru, Nandigama. In the RCP 8.5 scenario, Mahaboobabad and Narsampet will have the highest and lowest average heavy precipitation days, respectively. The maximum heavy precipitation days were observed in Khammam, Mahaboobabad in RCP 4.5 and RCP 8.5 scenarios in the mid-future (2040–2099) period. The minimum heavy precipitation days were recorded in Tiruvuru and Nandigama, respectively. In the far future (2070–99), similar trends were observed as in the mid-future, with the exception of Nandigama, which experienced the fewest heavy precipitation days in the RCP 4.5 scenario.
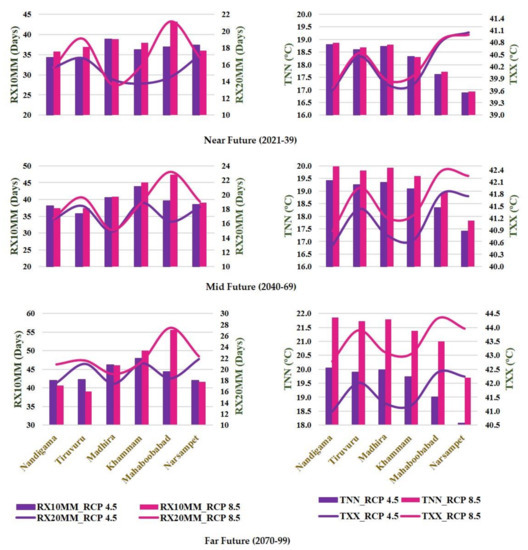
Figure 10.
Variation of RX10MM (heavy precipitation days), RX20MM (very heavy precipitation days), TNN (monthly minimum value of daily minimum temperature) and TXX (monthly maximum value of daily maximum temperature) in different periods for important urban areas present in the basin.
In the RCP 4.5 scenario, the average maximum very heavy precipitation days (RX20MM) were observed in Narsampet and the minimum days in Madhira in the near future. The same trends were observed in the remaining two periods, with the exception of Khammam city, which experienced more heavy precipitation days in the future. In the RCP 8.5 scenario, a similar pattern was observed, with Mahaboobabad having more heavy precipitation days and Madhira having fewer days in all periods.
In the near future, Narsampet had a higher average monthly maximum value of daily maximum temperature (TXX) in summer, whereas Madhira had a higher value in the remaining two periods for both the RCP 4.5 and RCP 8.5 scenarios. Nandigama had a lower average monthly maximum value of daily maximum temperature in summer for all three future periods for both scenarios. The average monthly minimum value of daily minimum temperature (TNN) in winter was higher in Nandigama and lower in Narsampet for both the RCP 4.5 and RCP 8.5 scenarios in all three future periods.
6. Summary and Conclusions
This study analyzed the impact of climate change on the Munneru river basin at a moderate resolution using NEX-GDDP projections under both the RCP 4.5 and RCP 8.5 scenarios. The uncertainties in various models were quantified. The REA methodology was used to rank the available 21 RCMs at each grid point over the study area and ensemble the best five models for future projections of precipitation and maximum and minimum temperature datasets. The best suited RCMs for this study area for precipitation were BNU-ESM, MIROCHEM and MIROCESM; for maximum temperature, they were MIROCHEM, MIROCESM, BNU-ESM and BCC-CSM-1; and for minimum temperature they were CSIRO-Mk3-6-0, MIROCHEM and BCC-CSM-1. These were used for high-resolution output post-processing.
For various time periods, spatial and temporal variations in the average annual, monthly, and seasonal variations were examined. For both the RCP 4.5 and 8.5 scenarios, precipitation and the maximum and minimum temperature increased in future periods compared to the observed period. In the RCP 4.5 scenario, the rate of increase in the annual average precipitation was 1.6 percent higher in the period 2021–2099 compared to the historic period for the monsoon season. Similarly, the rate of increase was 1.98 percent higher in the RCP 8.5 scenario. The average summer maximum temperatures and winter minimum temperatures were observed to rise in 2021–2099 when compared to the historical period. The average maximum summer temperature was expected to increase by more than 0.12 °C and 0.13 °C compared to the minimum winter temperature under the RCP 4.5 and RCP 8.5 scenarios, respectively. This research approach could provide decision-makers with an additional potential future climate scenario, and it can be especially useful in regions where changes in precipitation and temperature could be prevalent at the local level. In the context of climate change, the uncertainty associated with RCMs and scenarios must be assessed in order to implement effective management practices and make sound decisions. Under climate change scenarios, the results will be used as inputs to hydrological models and water resource management models.
Supplementary Materials
The following supporting information can be downloaded at: https://www.mdpi.com/article/10.3390/su14031715/s1, Figure S1: RCM grid points and sub-basins of the study area; Figure S2: Sub-basin wise annual average post-monsoon precipitation (a) S1 (b) S2 (c) S3 (d) S4; Figure S3: Sub-basin wise average annual summer maximum temperature (oC) (a) S1 (b) S2 (c) S3 (d) S4; Figure S4: Sub-basin wise monthly mean minimum temperature (oC) (a) S1 (b) S2 (c) S3 (d) S4; Figure S5: Sub-basin wise average annual winter minimum temperature (oC) (a) S1 (b) S2 (c) S3 (d) S4; Table S1: CMIP5 RCM models and contributing modelling centres (Source: http://cccr.tropmet.res.in/home/ftp_data.jsp); Table S2: Metric values of each Multicriterion Decision Making Technique for temperature data for 21 RCMS; Table S3: Net strengths and final ranks of each RCMs by Group Decision Making for temperature data; Table S4: Weights assigned for MME at each grid for maximum temperature data; Table S5: Weights assigned for MME at each grid for minimum temperature data.
Author Contributions
Data curation, Formal analysis, Investigation, Methodology, Software, Visualization, Writing—original draft, Writing—review and editing. E.S.B.; Conceptualization, Data curation, Funding acquisition, Investigation, Methodology, Project administration, Resources, Software, Validation, Visualization, Writing—original draft, Writing—review and editing. V.R.K.; Data curation, Formal analysis, Investigation, Methodology, Software, Visualization, Writing—original draft, Writing—review and editing. K.N.L.; Conceptualization, Investigation, Software, Supervision, Validation, Writing—review and editing. All authors have read and agreed to the published version of the manuscript. V.S.
Funding
This work is funded by the Department of Science and Technology (DST), Government of India, with Grant No: DST/IMRCD/BRICS/PilotCall2/IWMM-BIS/2018 (G). The corresponding author acknowledges the support by the Virginia Agricultural Experiment Station (Blacksburg) and the Hatch Program of the National Institute of Food and Agriculture, U.S. Department of Agriculture (Washington, DC, USA).
Institutional Review Board Statement
Not applicable.
Informed Consent Statement
Informed consent was obtained from all subjects involved in the study.
Data Availability Statement
Data available on request from the authors.
Conflicts of Interest
The authors declare no conflict of interest.
References
- IPCC. Climate Change 2014: Synthesis Report. Contribution of Working Groups I, II and III to the Fifth Assessment Report of the Intergovernmental Panel on Climate Change. Available online: https://www.ipcc.ch/site/assets/uploads/2018/05/SYR_AR5_FINAL_full_wcover.pdf (accessed on 22 January 2022).
- IPCC. Climate Change 2021: The Physical Science Basis Report. Contribution of Working Groups I to the Sixth Assessment Report of the Intergovernmental Panel on Climate Change. Available online: https://www.ipcc.ch/report/ar6/wg1/downloads/report/IPCC_AR6_WGI_Full_Report.pdf (accessed on 22 January 2022).
- Seong, C.; Sridhar, V.; Billah, M.M. Implications of potential evapotranspiration methods for streamflow estimations under changing climatic conditions. Int. J. Clim. 2018, 38, 896–914. [Google Scholar] [CrossRef]
- Kang, H.; Sridhar, V. Drought assessment with a surface-groundwater coupled model in the Chesapeake Bay watershed. Environ. Model. Softw. 2019, 119, 379–389. [Google Scholar] [CrossRef]
- Sridhar, V.; Kang, H.; Ali, S.A. Human-Induced Alterations to Land Use and Climate and Their Responses for Hydrology and Water Management in the Mekong River Basin. Water 2019, 11, 1307. [Google Scholar] [CrossRef] [Green Version]
- Ghosh, S.; Mujumdar, P.P. Climate change impact assessment: Uncertainty modeling with imprecise probability. J. Geophys. Res. Atmos. 2009, 114, D18. [Google Scholar] [CrossRef] [Green Version]
- Sridhar, V.; Jin, X.; Jaksa, W.T.A. Explaining the hydroclimatic variability and change in the Salmon River basin. Clim. Dyn. 2013, 40, 1921–1937. [Google Scholar] [CrossRef] [Green Version]
- Sridhar, V.; Billah, M.M.; Hildreth, J.W. Coupled Surface and Groundwater Hydrological Modeling in a Changing Climate. Groundwater 2018, 56, 618–635. [Google Scholar] [CrossRef]
- Sujatha, E.R.; Sridhar, V. Spatial Prediction of Erosion Risk of a Small Mountainous Watershed Using RUSLE: A Case-Study of the Palar Sub-Watershed in Kodaikanal, South India. Water 2018, 10, 1608. [Google Scholar] [CrossRef] [Green Version]
- Sridhar, V.; Hubbard, K.G.; Wedin, D.A. Assessment of Soil Moisture Dynamics of the Nebraska Sandhills Using Long-Term Measurements and a Hydrology Model. J. Irrig. Drain. Eng. 2006, 132, 463–473. [Google Scholar] [CrossRef] [Green Version]
- Sridhar, V.; Wedin, D.A. Hydrological behaviour of grasslands of the Sandhills of Nebraska: Water and energy-balance assessment from measurements, treatments, and modelling. Ecohydrol. Ecosyst. Land Water Process Interact. Ecohydrogeomorphol. 2009, 2, 195–212. [Google Scholar] [CrossRef]
- Sridhar, V.; Valayamkunnath, P. Land–Atmosphere Interactions in South Asia: A Regional Earth Systems Perspective; Springer: Cham, Switzerland, 2018; pp. 699–712. [Google Scholar] [CrossRef]
- Teng, J.; Vaze, J.; Chiew, F.H.S.; Wang, B.; Perraud, J.-M. Estimating the Relative Uncertainties Sourced from GCMs and Hydrological Models in Modeling Climate Change Impact on Runoff. J. Hydrometeorol. 2012, 13, 122–139. [Google Scholar] [CrossRef]
- Sridhar, V. Tracking the Influence of Irrigation on Land Surface Fluxes and Boundary Layer Climatology. J. Contemp. Water Res. Educ. 2013, 152, 79–93. [Google Scholar] [CrossRef]
- Sehgal, V.; Lakhanpal, A.; Maheswaran, R.; Khosa, R.; Sridhar, V. Application of multi-scale wavelet entropy and multi-resolution Volterra models for climatic downscaling. J. Hydrol. 2018, 556, 1078–1095. [Google Scholar] [CrossRef]
- Fowler, H.J.; Blenkinsop, S.; Tebaldi, C. Linking climate change modelling to impacts studies: Recent advances in downscaling techniques for hydrological modelling. Int. J. Clim. 2007, 27, 1547–1578. [Google Scholar] [CrossRef]
- Thrasher, B.; Xiong, J.; Wang, W.; Melton, F.; Michaelis, A.; Nemani, R. Downscaled Climate Projections Suitable for Resource Management. Eos Trans. Am. Geophys. Union 2013, 94, 321–323. [Google Scholar] [CrossRef]
- Bao, Y.; Wen, X. Projection of China’s near- and long-term climate in a new high-resolution daily downscaled dataset NEX-GDDP. J. Meteorol. Res. 2017, 31, 236–249. [Google Scholar] [CrossRef]
- Sahany, S.; Mishra, S.K.; Salunke, P. Historical simulations and climate change projections over India by NCAR CCSM4: CMIP5 vs. NEX-GDDP. Theor. Appl. Climatol. B 2019, 135, 1423–1433. [Google Scholar] [CrossRef]
- Raghavan, S.V.; Hur, J.; Liong, S.-Y. Evaluations of NASA NEX-GDDP data over Southeast Asia: Present and future climates. Clim. Chang. 2018, 148, 503–518. [Google Scholar] [CrossRef]
- Li, Y.; Chen, Y.; Wang, F.; He, Y.; Li, Z. Evaluation and projection of snowfall changes in High Mountain Asia based on NASA’s NEX-GDDP high-resolution daily downscaled dataset. Environ. Res. Lett. 2020, 15, 104040. [Google Scholar] [CrossRef]
- Clark, M.P.; Wilby, R.L.; Gutmann, E.D.; Vano, J.A.; Gangopadhyay, S.; Wood, A.W.; Fowler, H.J.; Prudhomme, C.; Arnold, J.R.; Brekke, L.D. Characterizing Uncertainty of the Hydrologic Impacts of Climate Change. Curr. Clim. Chang. Rep. 2016, 2, 55–64. [Google Scholar] [CrossRef] [Green Version]
- Raju, K.S.; Sonali, P.; Kumar, G.V.N. Ranking of CMIP5-based global climate models for India using compromise programming. Theor. Appl. Climatol. 2016, 128, 563–574. [Google Scholar] [CrossRef]
- Giorgi, F.; Mearns, L.O. Calculation of Average, Uncertainty Range, and Reliability of Regional Climate Changes from AOGCM Simulations via the “Reliability Ensemble Averaging” (REA) Method. J. Clim. 2002, 15, 1141–1158. [Google Scholar] [CrossRef]
- Anandhi, A.; Frei, A.; Pradhanang, S.M.; Zion, M.S.; Pierson, D.C.; Schneiderman, E.M. AR4 climate model performance in simulating snow water equivalent over Catskill Mountain watersheds, New York, USA. Hydrol. Process. 2011, 25, 3302–3311. [Google Scholar] [CrossRef]
- Johnson, F.; Sharma, A. Measurement of GCM Skill in Predicting Variables Relevant for Hydroclimatological Assessments. J. Clim. 2009, 22, 4373–4382. [Google Scholar] [CrossRef]
- Taylor, K.E.; Stouffer, R.J.; Meehl, G.A. An Overview of CMIP5 and the Experiment Design. Bull. Am. Meteorol. Soc. 2012, 93, 485–498. [Google Scholar] [CrossRef] [Green Version]
- Raju, K.; Kumar, D.N. Ranking of global climate models for India using multicriterion analysis. Clim. Res. 2014, 60, 103–117. [Google Scholar] [CrossRef]
- Raju, K.S.; Kumar, D.N. Ranking general circulation models for India using TOPSIS. J. Water Clim. Chang. 2015, 6, 288–299. [Google Scholar] [CrossRef] [Green Version]
- Raju, K.S.; Kumar, D.N. Selection of global climate models for India using cluster analysis. J. Water Clim. Chang. 2016, 7, 764–774. [Google Scholar] [CrossRef]
- Hughes, D.A.; Mantel, S.; Mohobane, T. An assessment of the skill of downscaled GCM outputs in simulating historical patterns of rainfall variability in South Africa. Water Policy 2014, 45, 134–147. [Google Scholar] [CrossRef]
- Sillmann, J.; Kharin, V.V.; Zhang, X.; Zwiers, F.W.; Bronaugh, D. Climate extremes indices in the CMIP5 multimodel ensemble: Part Model evaluation in the present climate. J. Geophys. Res. Atmos. 2013, 118, 1716–1733. [Google Scholar] [CrossRef]
- Gutjahr, O.; Heinemann, G. Comparing precipitation bias correction methods for high-resolution regional climate simulations using COSMO-CLM. Theor. Appl. Climatol. 2013, 114, 511–529. [Google Scholar] [CrossRef]
- Gudmundsson, L.; Bremnes, J.B.; Haugen, J.E.; Engen-Skaugen, T. Technical Note: Downscaling RCM precipitation to the station scale using statistical transformations–a comparison of methods. Hydrol. Earth Syst. Sci. 2012, 16, 3383–3390. [Google Scholar] [CrossRef] [Green Version]
- Mami, A.; Raimonet, M.; Yebdri, D.; Sauvage, S.; Zettam, A.; Perez, J.M.S. Future Climatic and Hydrologic Changes Estimated by Bias-Adjusted Regional Climate Model Outputs of the Cordex-Africa Project: Case of the Tafna Basin (North-Western Africa). Int. J. Glob. Warm. 2021, 23, 58–90. [Google Scholar] [CrossRef]
- Tang, X.; Zhang, J.; Wang, G.; Ruben, G.; Bao, Z.; Liu, Y.; Liu, C.; Jin, J. Error Correction of Multi-Source Weighted-Ensemble Precipitation (MSWEP) over the Lancang–Mekong River Basin. Remote Sens. 2021, 13, 312. [Google Scholar] [CrossRef]
- Wood, A.; Leung, L.R.; Sridhar, V.; Lettenmaier, D.P. Hydrologic Implications of Dynamical and Statistical Approaches to Downscaling Climate Model Outputs. Clim. Chang. 2004, 62, 189–216. [Google Scholar] [CrossRef]
- Teutschbein, C.; Seibert, J. Bias correction of regional climate model simulations for hydrological climate-change impact studies: Review and evaluation of different methods. J. Hydrol. 2012, 456–457, 12–29. [Google Scholar] [CrossRef]
- Chen, J.; Brissette, F.P.; Chaumont, D.; Braun, M. Finding appropriate bias correction methods in downscaling precipitation for hydrologic impact studies over North America. Water Resour. Res. 2013, 49, 4187–4205. [Google Scholar] [CrossRef]
- Themeßl, M.J.; Gobiet, A.; Leuprecht, A. Empirical-statistical downscaling and error correction of daily precipitation from regional climate models. Int. J. Climatol. 2011, 31, 1530–1544. [Google Scholar] [CrossRef]
- Fang, G.H.; Yang, J.; Chen, Y.N.; Zammit, C. Comparing bias correction methods in downscaling meteorological variables for a hydrologic impact study in an arid area in China. Hydrol. Earth Syst. Sci. 2015, 19, 2547–2559. [Google Scholar] [CrossRef] [Green Version]
- CWC Data. Available online: http://cwc.gov.in/kgbo/home/ (accessed on 22 January 2022).
- Loukika, K.N.; Keesara, V.R.; Sridhar, V. Analysis of Land Use and Land Cover Using Machine Learning Algorithms on Google Earth Engine for Munneru River Basin, India. Sustainability 2021, 13, 13758. [Google Scholar] [CrossRef]
- IMD Data. Available online: https://www.imdpune.gov.in/Clim_Pred_LRF_New/Grided_Data_Download.html (accessed on 22 January 2022).
- RCM Data. Available online: http://cccr.tropmet.res.in/home/ftp_data.jsp (accessed on 22 January 2022).
- Anil, S.; Manikanta, V.; Pallakury, A.R. Unravelling the influence of subjectivity on ranking of CMIP6 based climate models: A case study. Int. J. Clim. 2021, 41, 5998–6016. [Google Scholar] [CrossRef]
- Zhang, X.; Yang, F. RClimDex (1.0)—User Manual; Climate Research Branch Environment Canada Downsview: Ontario, ON, Canada, 2017. [Google Scholar]
- Sreelatha, K.; Raj, P.A. Ranking of CMIP5-based global climate models using standard performance metrics for Telangana region in the southern part of India. ISH J. Hydraul. Eng. 2021, 27, 556–565. [Google Scholar] [CrossRef]
- Morais, D.C.; de Almeida, A.T. Group decision making on water resources based on analysis of individual rankings. Omega 2012, 40, 42–52. [Google Scholar] [CrossRef]
- Sowjanya, P.N.; Reddy, K.V.; Shashi, M. Spatial and Temporal Variations of Climate Variables Over a River Basin. J. Rural Dev. 2018, 37, 383. [Google Scholar] [CrossRef]
- Chanapathi, T.; Thatikonda, S.; Raghavan, S. Analysis of rainfall extremes and water yield of Krishna river basin under future climate scenarios. J. Hydrol. Reg. Stud. 2018, 19, 287–306. [Google Scholar] [CrossRef]
Publisher’s Note: MDPI stays neutral with regard to jurisdictional claims in published maps and institutional affiliations. |
© 2022 by the authors. Licensee MDPI, Basel, Switzerland. This article is an open access article distributed under the terms and conditions of the Creative Commons Attribution (CC BY) license (https://creativecommons.org/licenses/by/4.0/).

