
A Hydrometeorological Study of Groundwater Level Changes during the COVID-19 Lockdown Year (Salento Peninsula, Italy)

 ,
,  ,
,  ,
,  and
and
Abstract
:1. Introduction
2. Methods and Material
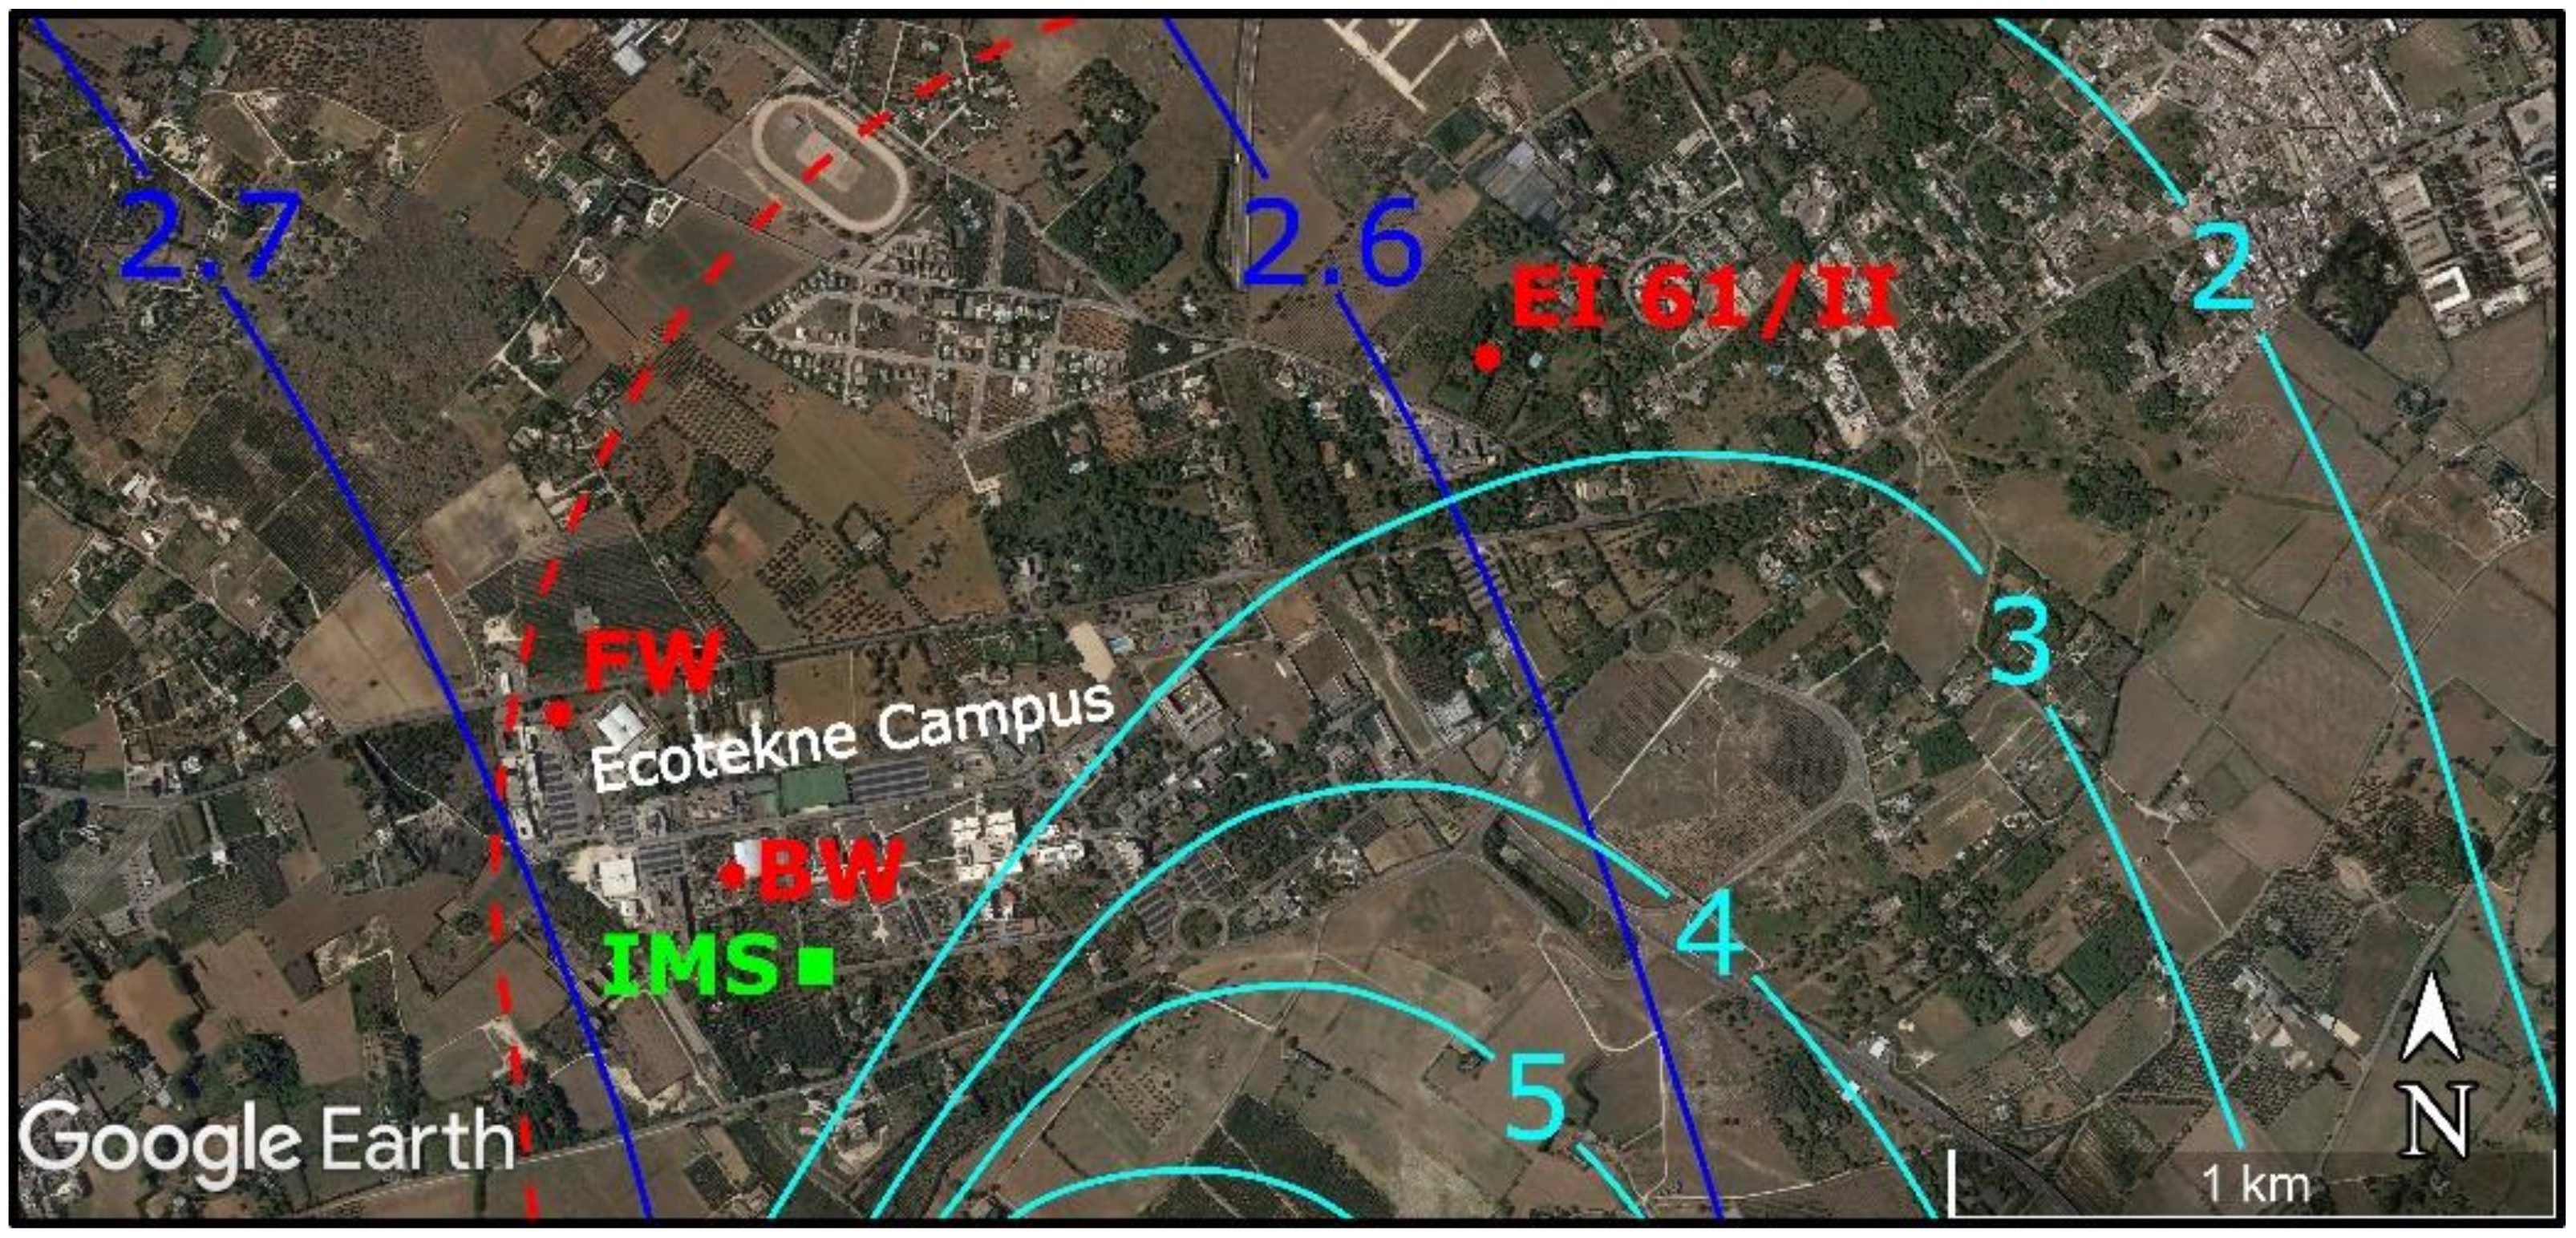
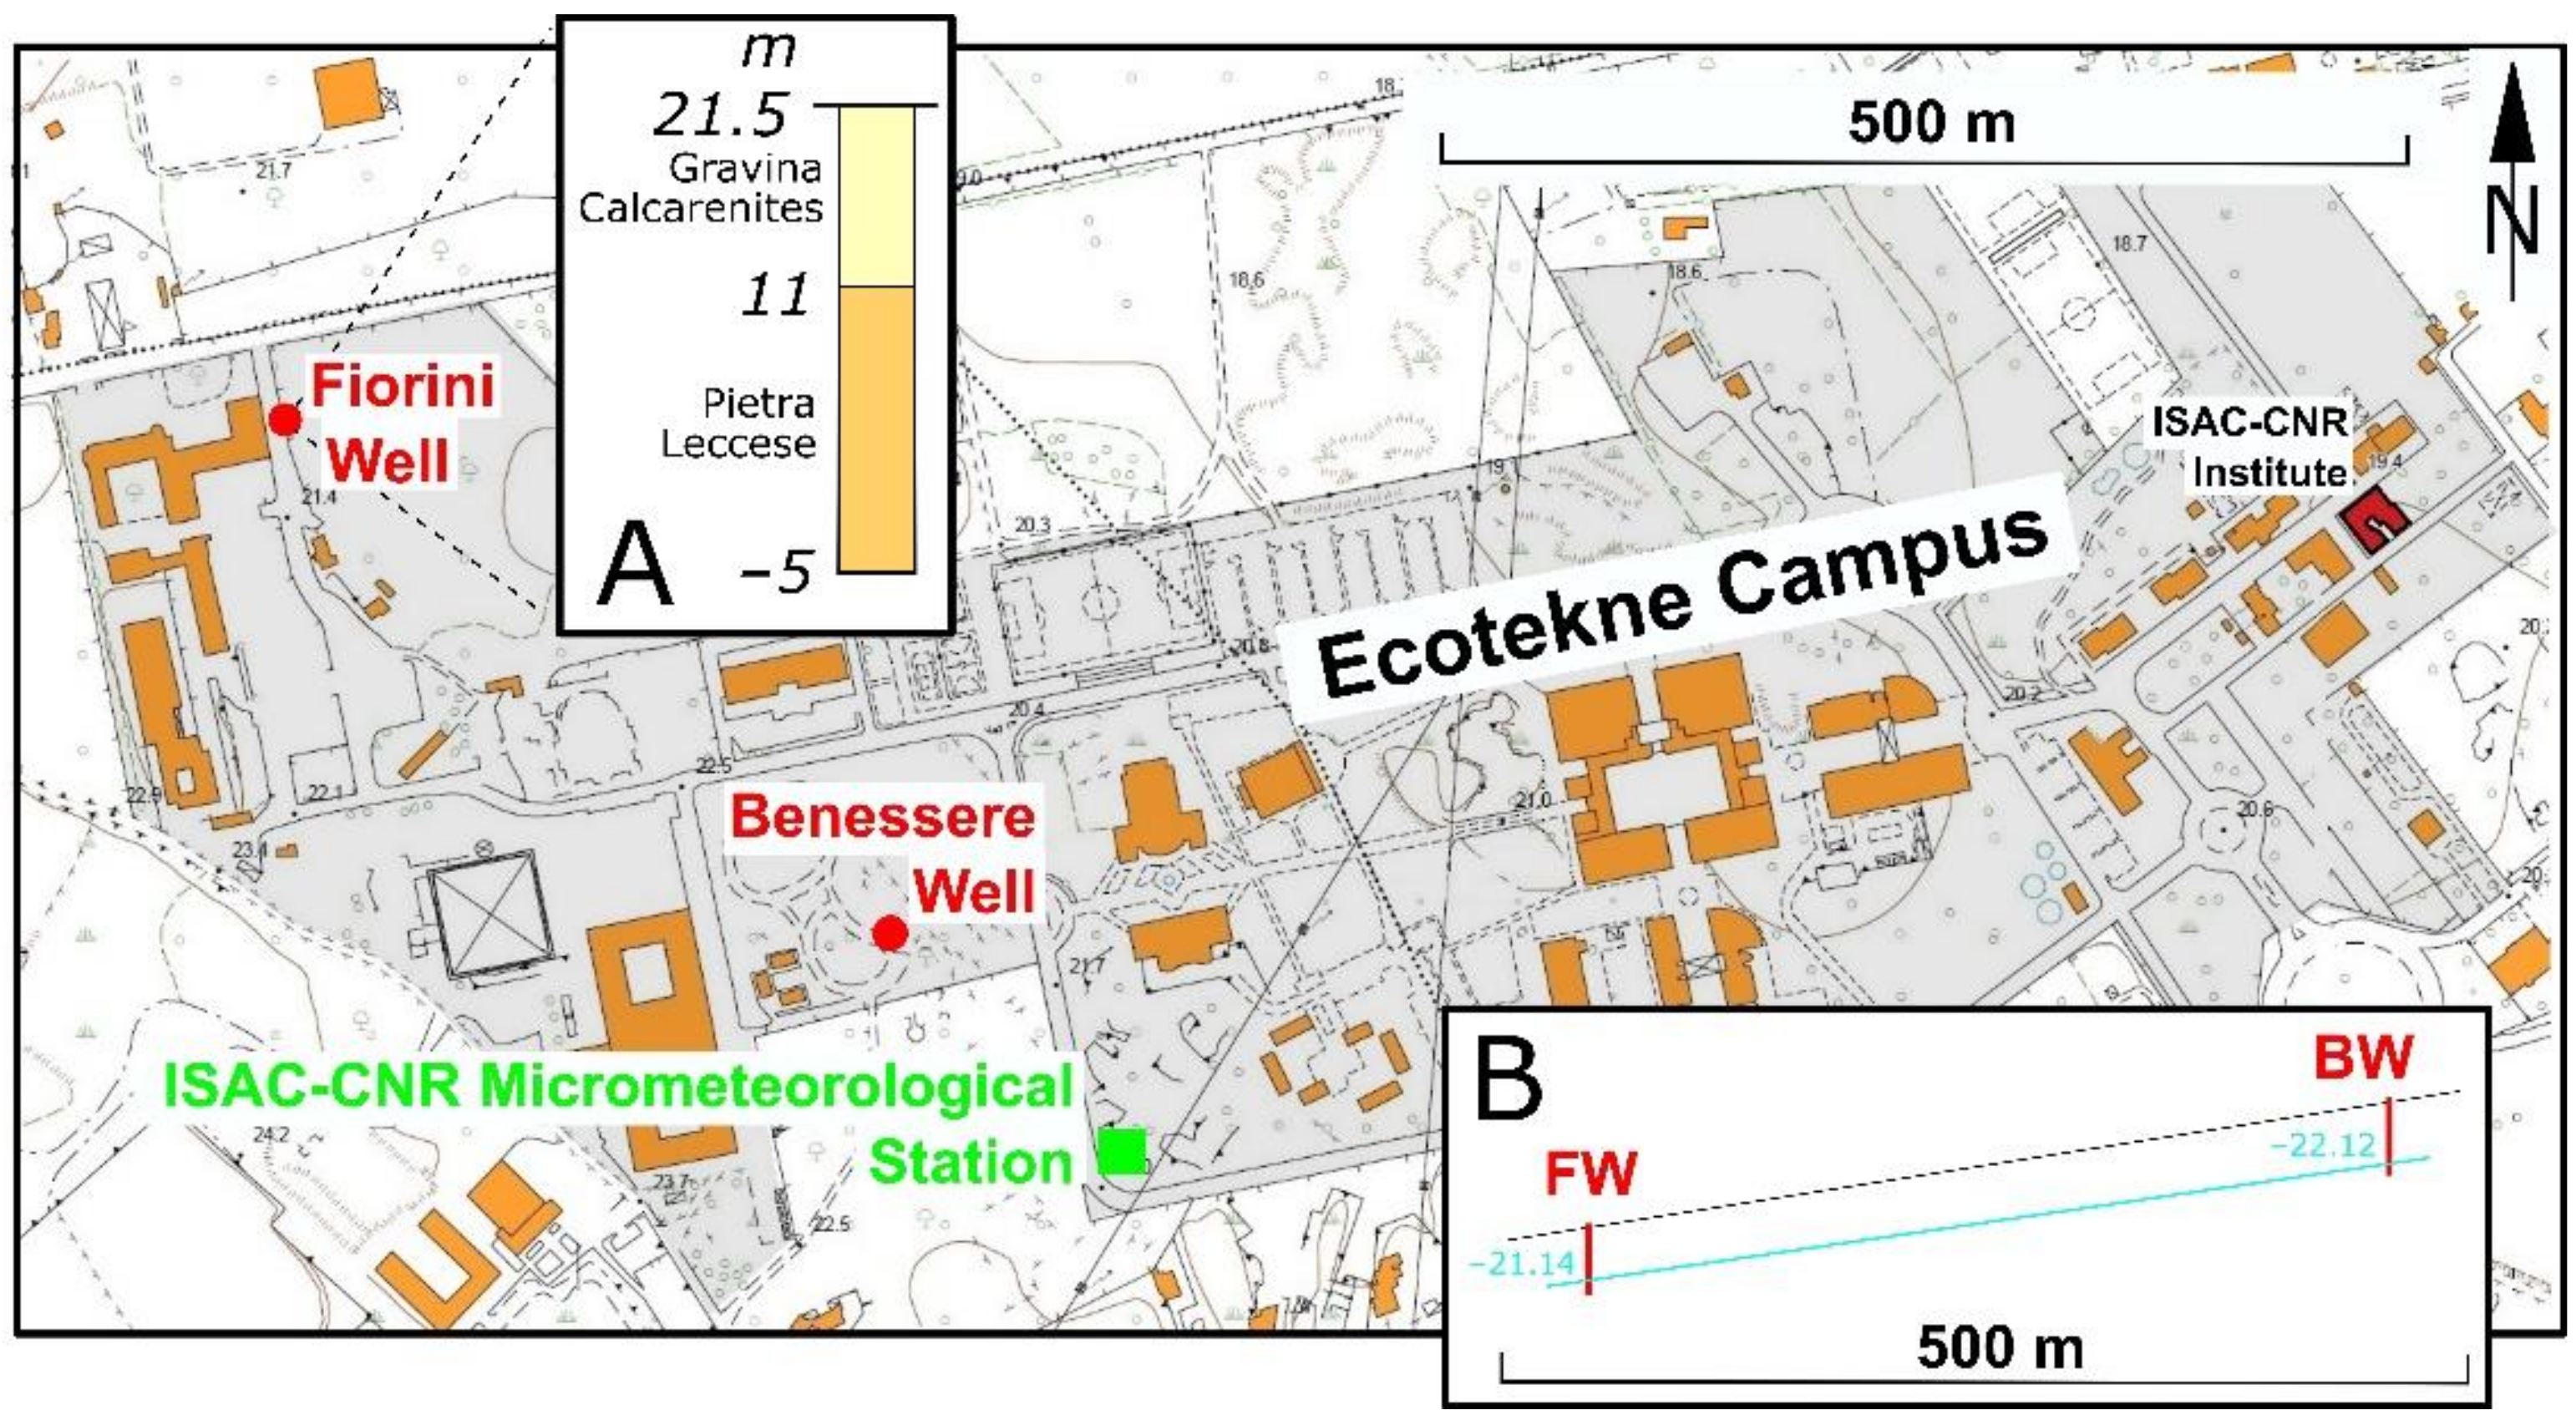
2.1. Case Study
2.2. Methods
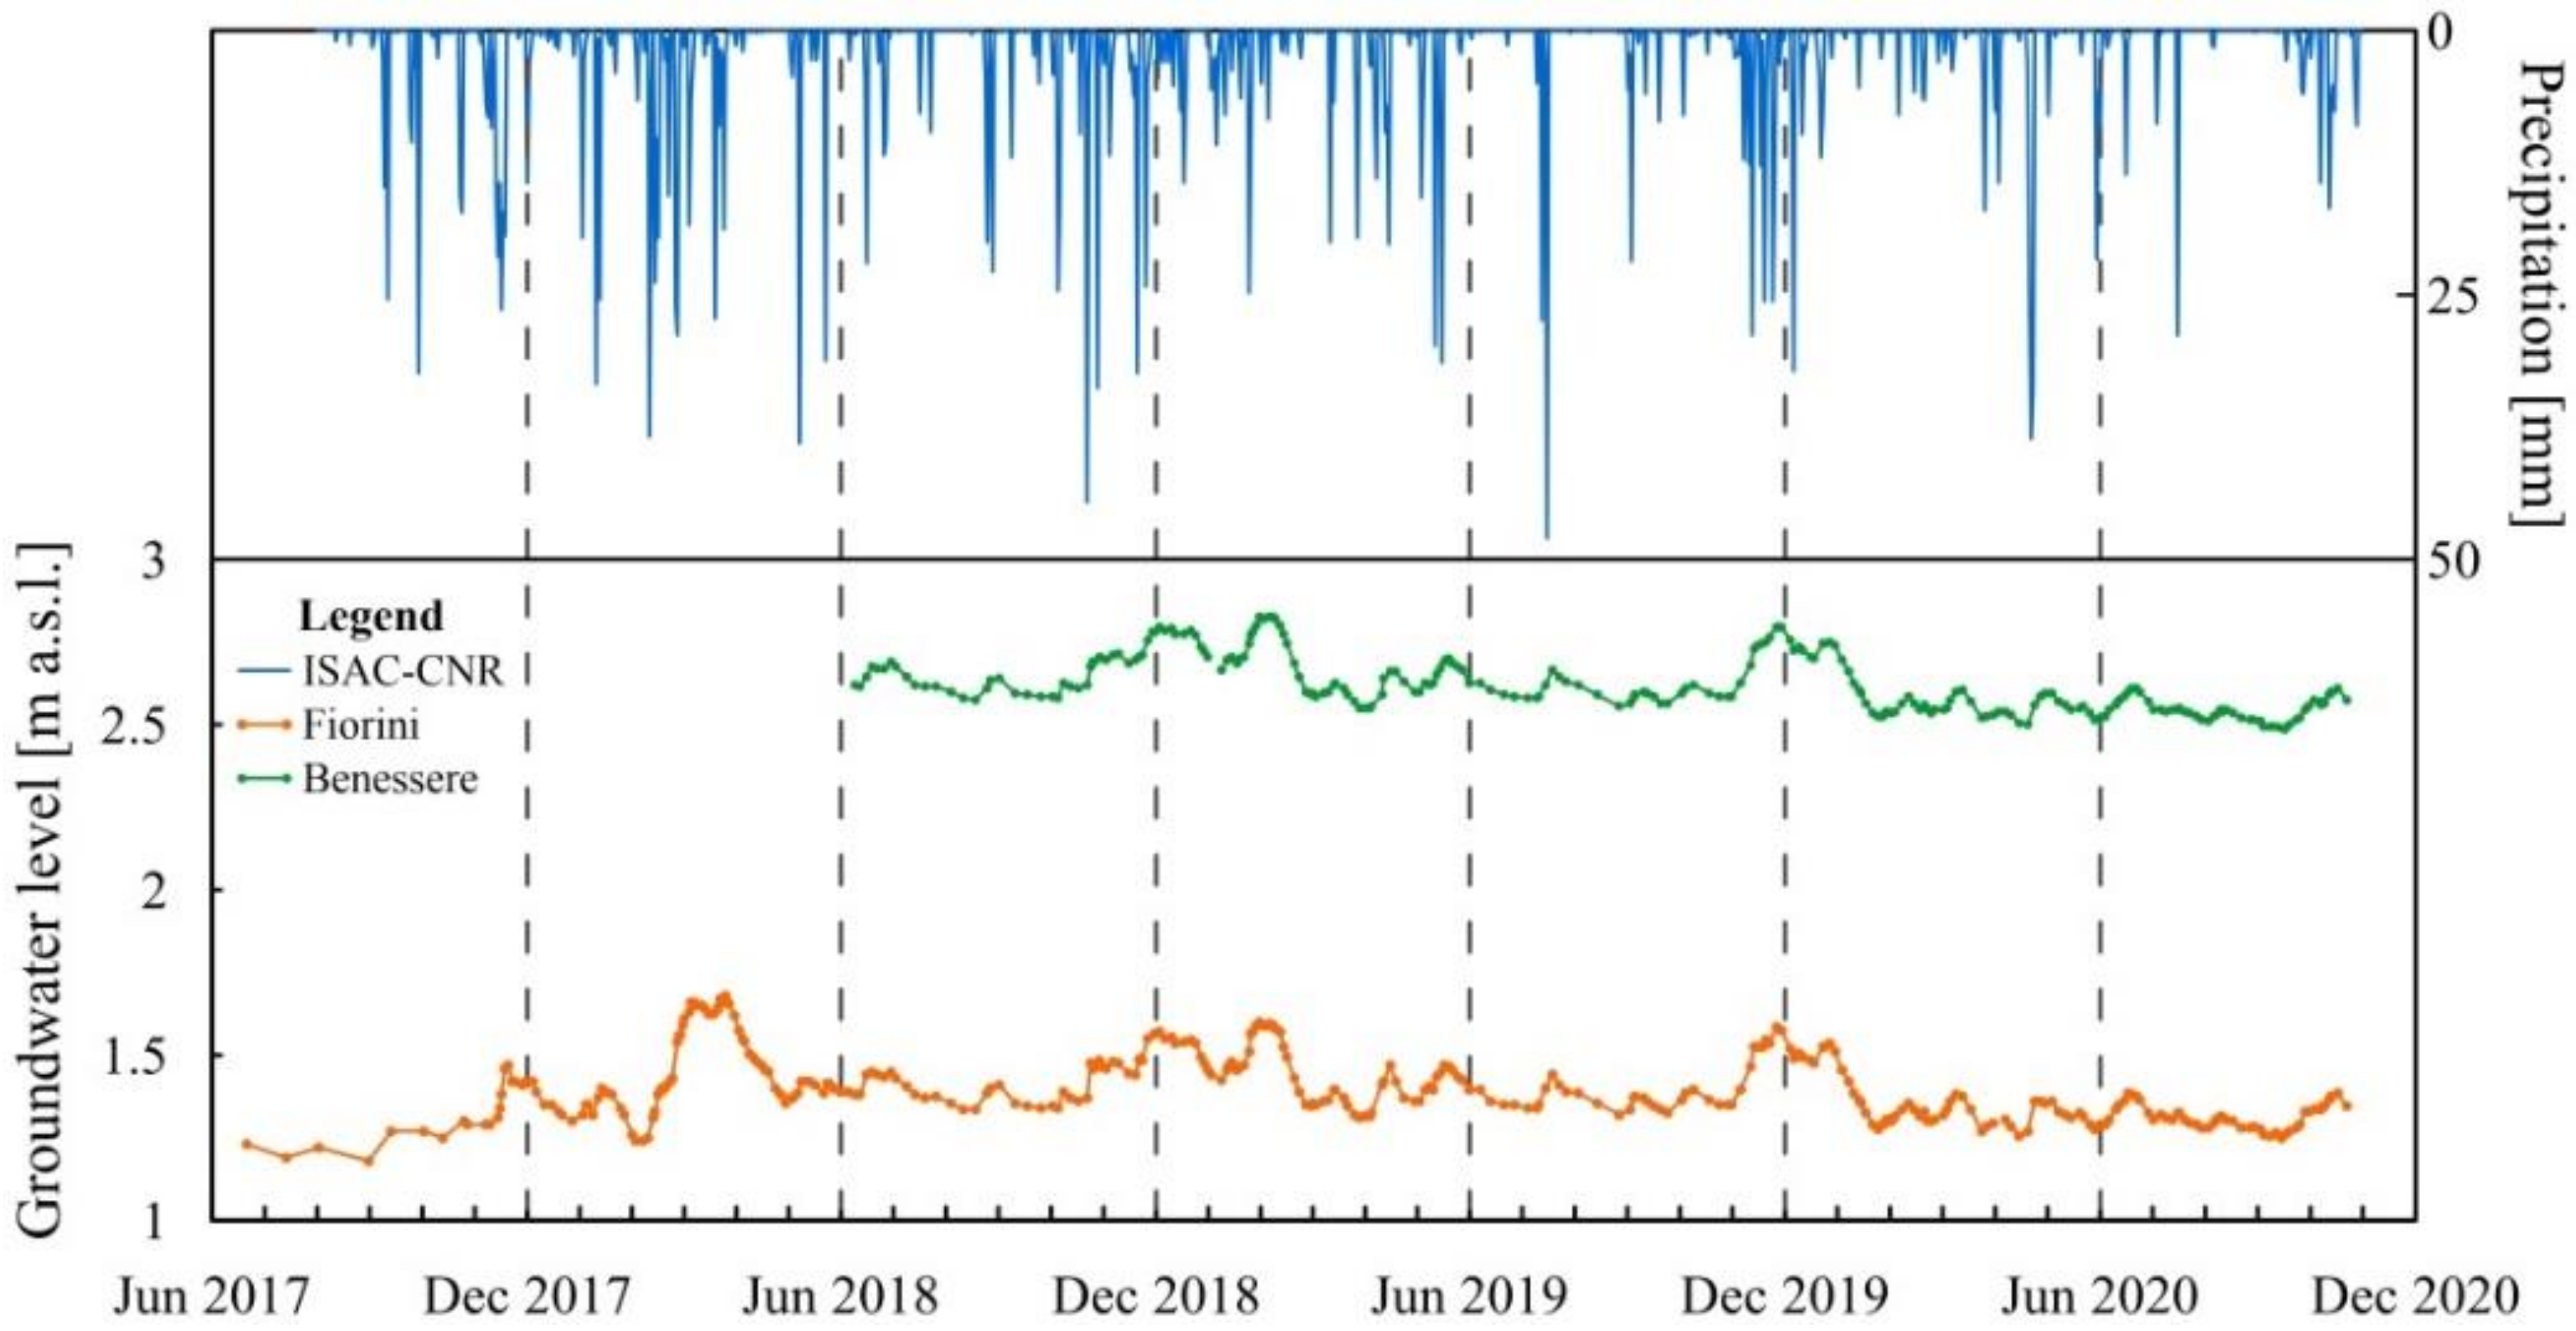
2.3. Dataset
- One Solent-Gill R2 ultrasonic anemometer and one Campbell Kh20 Krypton hygrometer, constituting the eddy-covariance system; the anemometer measures the three wind velocity components (u, v, w) at a 20 Hz frequency, and the fast-response Krypton hygrometer measures the turbulent fluctuations of the atmospheric water vapor;
- One slow-response thermo-hygrometer for reference air temperature and humidity (Rotronic MP100).
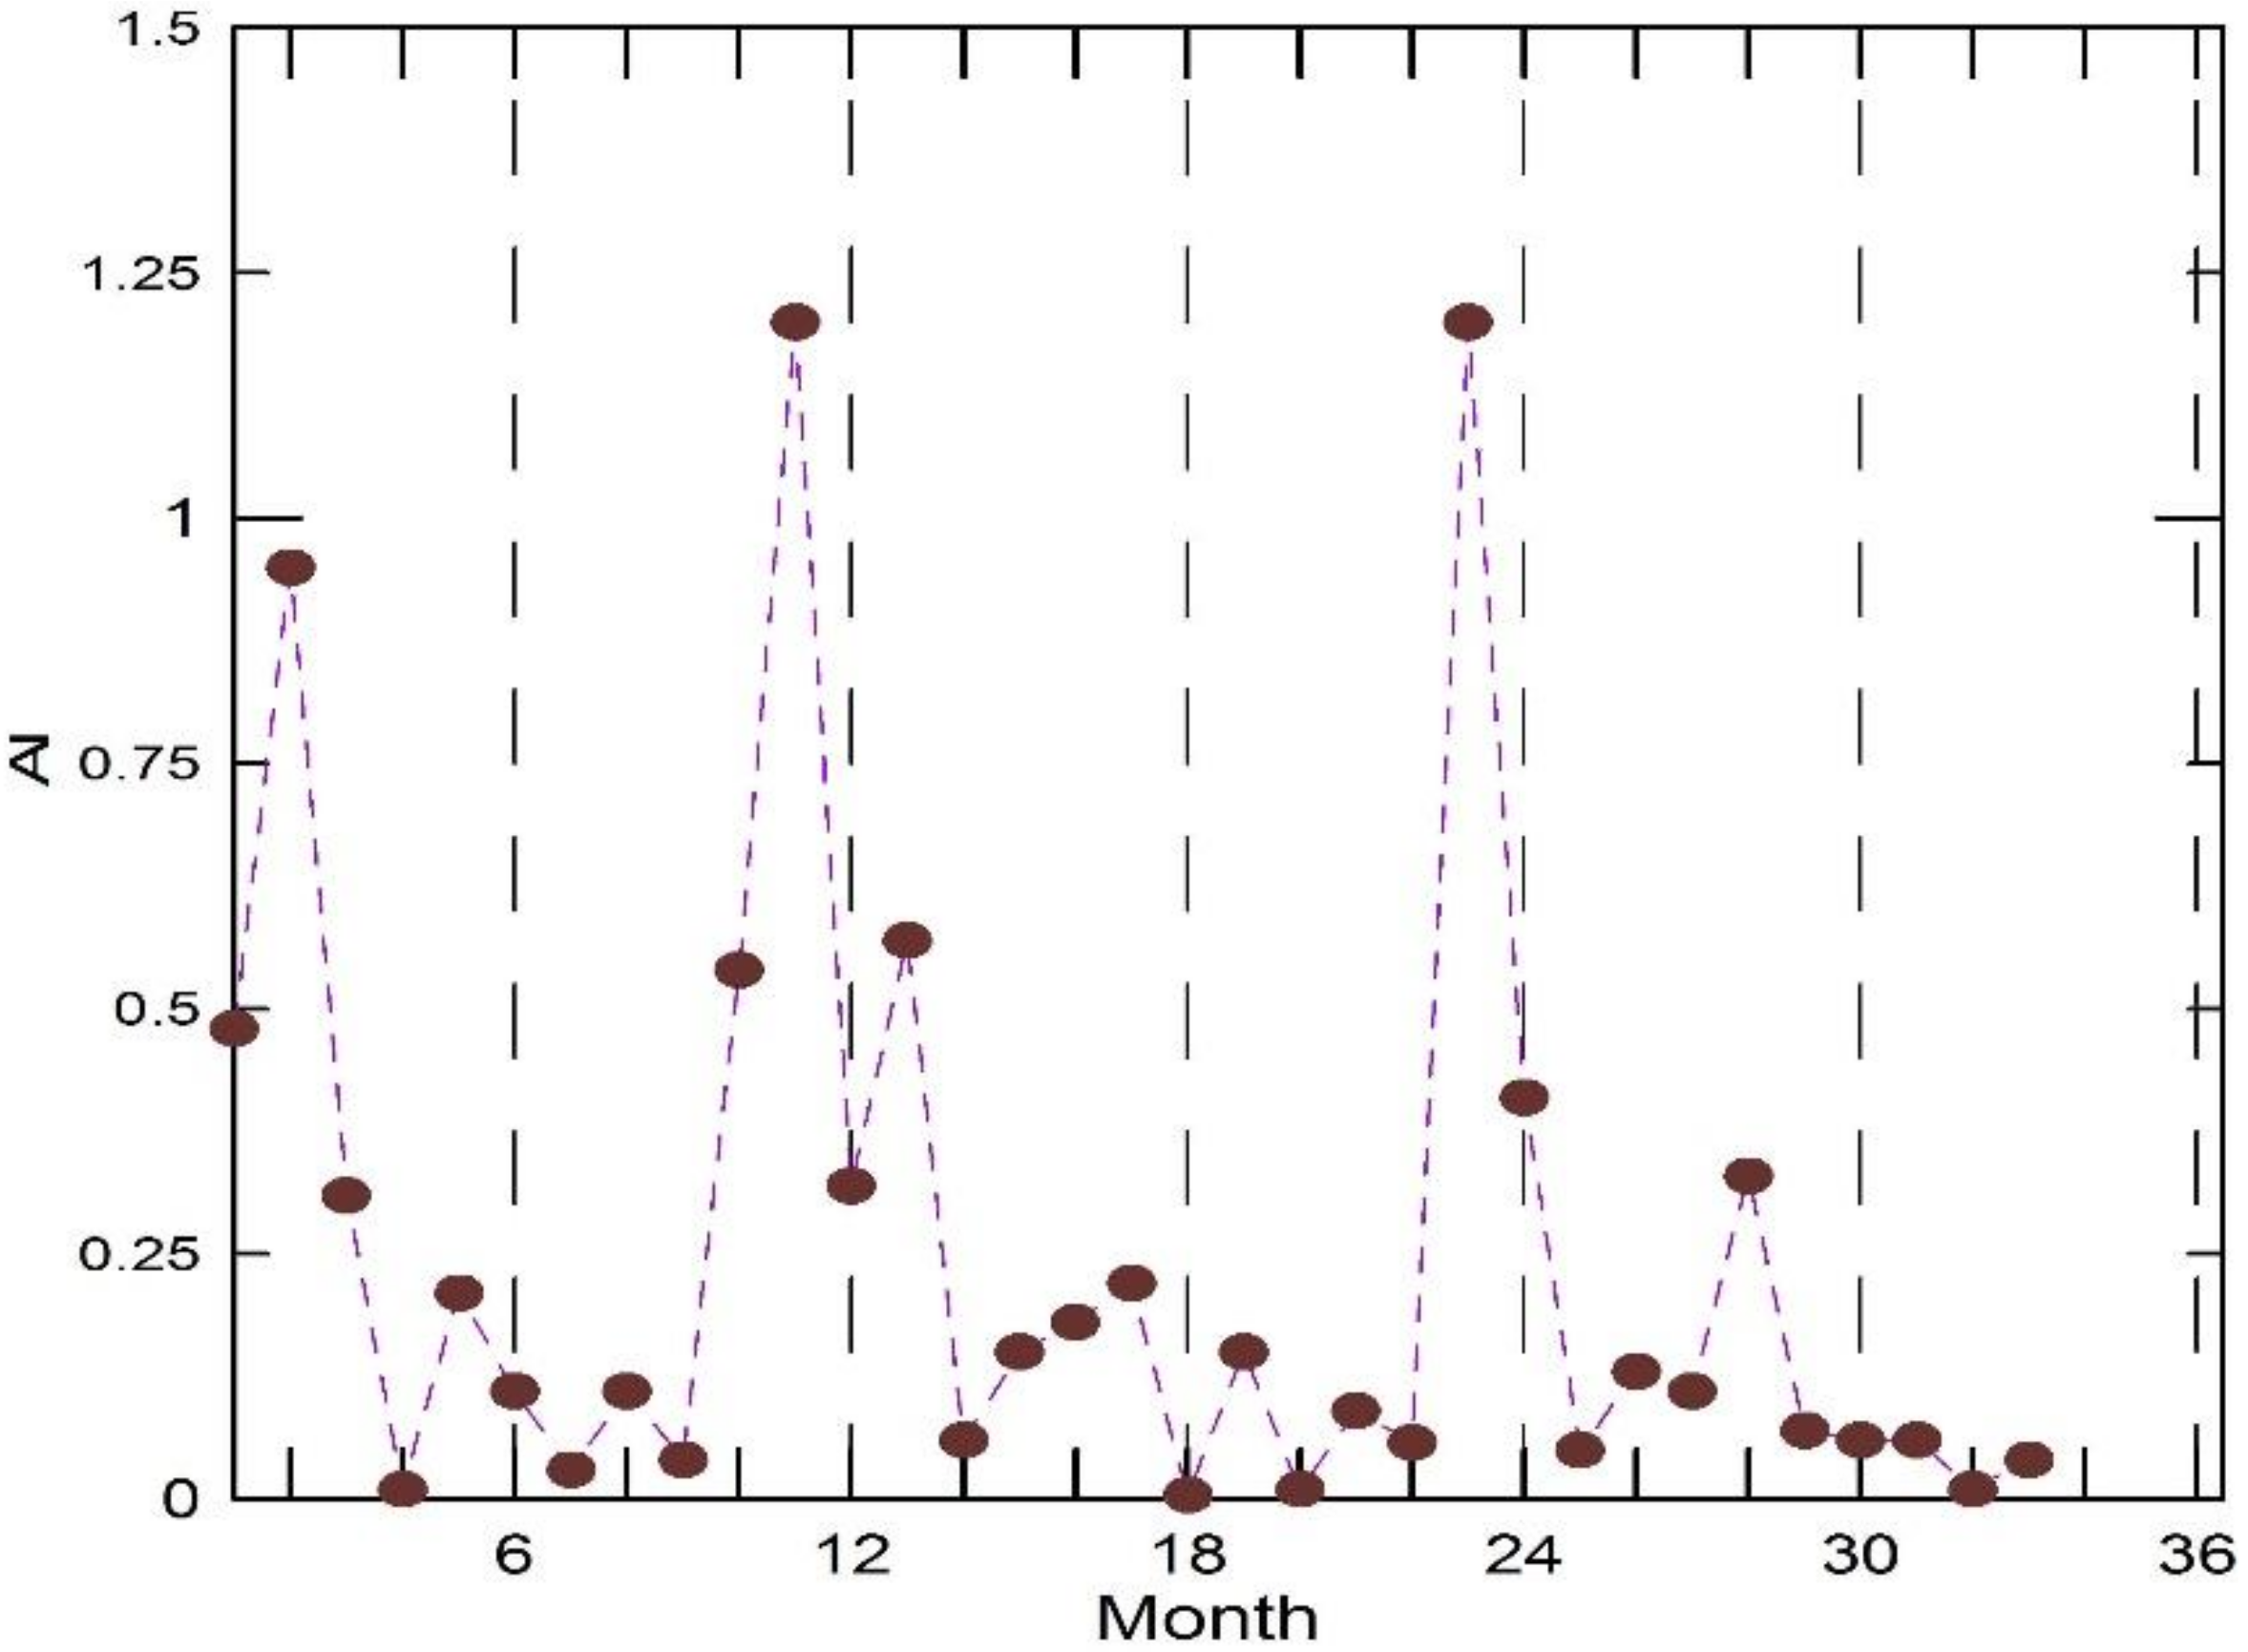
3. Results
4. Discussion
5. Conclusions
Author Contributions
Funding
Institutional Review Board Statement
Informed Consent Statement
Data Availability Statement
Acknowledgments
Conflicts of Interest
References
- Lau, H.; Khosrawipour, V.; Kocbach, P.; Mikolajczyk, A.; Schubert, J.; Bania, J.; Khosrawipour, T. The positive impact of lockdown in Wuhan on containing the COVID-19 outbreak in China. J. Travel Med. 2021, 27, taaa037. [Google Scholar] [CrossRef] [PubMed] [Green Version]
- Balacco, G.; Totaro, V.; Iacobellis, V.; Manni, A.; Spagnoletta, M.; Piccinni, A.F. Influence of COVID-19 spread on water drinking demand: The case of Puglia Region (Southern Italy). Sustainability 2020, 12, 5919. [Google Scholar] [CrossRef]
- Chen, S.; Igan, D.; Pierri, N.; Presbitero, A. Tracking the Economic Impact of COVID-19 and Mitigation Policies in Europe and the United States; IMF Working Paper No. 20/125; IMF: Washington, DC, USA, 2020.
- McKibbin, W.; Fernando, R. The economic impact of COVID-19. In Economics in the Time of COVID-19; Baldwin, R., Weder di Mauro, B., Eds.; CEPR Press: London, UK, 2020; pp. 45–51. [Google Scholar]
- Motta Zanin, G.; Gentile, E.; Parisi, A.; Spasiano, D. A preliminary evaluation of the public risk perception related to the COVID-19 health emergency in Italy. Int. J. Environ. Res. Public Health 2020, 17, 3024. [Google Scholar] [CrossRef] [PubMed]
- Chakraborty, I.; Maity, P. COVID-19 outbreak: Migration, effects on society, global environment and prevention. Sci. Total Environ. 2020, 728, 138882. [Google Scholar] [CrossRef]
- Liu, Z.; Ciais, P.; Deng, Z.; Lei, R.; Davis, S.J.; Feng, S.; Zheng, B.; Cui, D.; Dou, X.; Zhu, B.; et al. Near-real-time monitoring of global CO2 emissions reveals the effects of the COVID-19 pandemic. Nat. Commun. 2020, 11, 5172. [Google Scholar] [CrossRef]
- Lüdtke, D.U.; Luetkemeier, R.; Schneemann, M.; Liehr, S. Increase in daily household water demand during the first wave of the COVID-19 pandemic in Germany. Water 2021, 13, 260. [Google Scholar] [CrossRef]
- Balacco, G.; Alfio, M.R.; Fidelibus, M.D. Groundwater drought analysis under data scarcity: The case of the Salento aquifer (Italy). Sustainability 2022, 14, 707. [Google Scholar] [CrossRef]
- McKee, T.B.; Nolan, J.; Kleist, J. The relationship of drought frequency and duration to time scales. In Proceedings of the Eighth Conference on Applied Climatology, Anaheim, CA, USA, 17–22 January 1993. [Google Scholar]
- Vicente-Serrano, S.M.; Beguería, S.; López-Moreno, J.I. A multiscalar drought index sensitive to global warming: The standardized precipitation evapotranspiration index. J. Clim. 2010, 23, 1696–1718. [Google Scholar] [CrossRef] [Green Version]
- Beguería, S.; Vicente-Serrano, S.M.; Reig, F.; Latorre, B. Standardized precipitation evapotranspiration index (SPEI) revisited: Parameter fitting, evapotranspiration models, tools, datasets and drought monitoring. Int. J. Climatol. 2013, 34, 3001–3023. [Google Scholar] [CrossRef] [Green Version]
- Istituto Superiore di Sanità (ISS). COVID-19: L’Acqua è Sicura ma Aumentano i Consumi. Domani 22 Marzo la Giornata Mondiale Istituita dalle Nazioni Unite. Available online: https://www.iss.it/coronavirus/-/asset_publisher/1SRKHcCJJQ7E/ (accessed on 1 September 2021).
- Tadolini, T.; Tazioli, G.S.; Tulipano, L. Hydrogeology of the Idume springs area (Lecce). Geol. Appl. Idrogeol. 1971, 4, 41–63. (In Italian). [Google Scholar]
- Tadolini, T.; Tulipano, L. The evolution of fresh-water/salt-water equilibrium in connection with withd rawals from the coastal carbonate and carstic aquifer of the Salentine Peninsula (Southern Italy). Geol. Jaharb 1981, 29, 69–85. [Google Scholar]
- Tulipano, L. Temperature logs interpretation for the identification of preferential flow pathway in the coastal carbonatic and karstic aquifer of the Salento peninsula (Southern Italy). In Proceedings of the 21 Congress International Association Hydrogeologists, Guilin, China, 10–15 October 1988; Volume 2, pp. 956–961. [Google Scholar]
- Delle Rose, M. Sedimentological features of the Plio-Quaternary aquifers of Salento (Puglia). In Memorie Descrittive della Carta Geologica d’Italia; ISPRA: Rome, Italy, 2007; Volume 76, pp. 137–145. [Google Scholar]
- Delle Rose, M.; Fidelibus, C.; Martano, P. Assessment of specific yield in karstified fractured rock through the water-budget method. Geosciences 2018, 8, 344. [Google Scholar] [CrossRef] [Green Version]
- Tadolini, T.; Calò, G.; Spizzico, M.; Tinelli, R. Hydrogeological characterisation of post-cretaceous soils in the San Cesario di Lecce area (Puglia). In Proceedings of the V Congresso Internazionale sulle Acque Sotterranee, Taormina, Italy, 17–21 November 1985; p. 11. (In Italian). [Google Scholar]
- Calò, G.; Gnoni, R.; Stani, M. Hydrogeological Properties of Surface Aquifers in the Salento Peninsula and Assessment of Aquifer Vulnerability; Amministrazione Provinciale di Lecce: Lecce, Italy, 1992; pp. 1–31. (In Italian). [Google Scholar]
- SOGESID Water Protection Plan. General Report. 2009. Available online: http://www.sit.puglia.it/portal/portale_pianificazione_regionale/Piano%20di%20Tutella%20delle%20Acque (accessed on 1 September 2021). (In Italian).
- Wei, Z.Q.; Egger, P.; Descoeudres, F. Permeability predictions for jointed rock masses. Int. J. Rock Mech. Min. Sci. Geomech. Abstr. 1995, 32, 251–261. [Google Scholar] [CrossRef]
- D’Alessandro, A.; Massari, F.; Davaud, E.; Ghibaudo, G. Pliocene-Pleistocene sequences bounded by subaerial unconformities within foramol ramp calcarenites and mixed deposits (Salento, SE, Italy). Sediment. Geol. 2004, 166, 89–144. [Google Scholar] [CrossRef]
- Martano, P.; Elefante, C.; Grasso, F. A Database for long-term atmosphere-surface transfer monitoring in Salento peninsula (Southern Italy). Dataset Pap. Sci. 2013, 2013, 946431. [Google Scholar] [CrossRef] [Green Version]
- Martano, P.; Elefante, C.; Grasso, F. Ten years water and energy surface balance from the CNR-ISAC micrometeorological station in Salento peninsula (Southern Italy). Adv. Sci. Res. 2015, 12, 121–125. [Google Scholar] [CrossRef] [Green Version]
- ISAC-CNR. Micrometeorological Station. Available online: http://www.basesperimentale.le.isac.cnr.it (accessed on 10 September 2021).
- Martano, P.; Ciricugno, L.; Delle Rose, M.; Fidelibus, C.; Orlanducci, L. Hydrometeorological observations on the Miocene aquifer of central-eastern Salento during the lockdown year for COVID-19. Geol. Terr. 2020, 18, 14–22. (In Italian). [Google Scholar]
- Bossio, A.; Esu, D.; Foresi, L.M.; Girotti, O.; Iannone, A.; Luperto Sinni, E.; Margiotta, S.; Mazzei, R.; Monteforti, B.; Ricchetti, G.; et al. Galatone Formation, a new name for a lithostratigraphic unit in Salento (Puglia, Southern Italy). Atti Soc. Toscana Sci. Nat. 1998, 5, 151–156. (In Italian). [Google Scholar]
- Delle Rose, M.; Martano, P. Infiltration and short-time recharge in deep karst aquifer of the Salento peninsula (Southern Italy): An observational study. Water 2018, 10, 260. [Google Scholar] [CrossRef] [Green Version]
- Barrow, C.J. World atlas of desertification (United Nations Environment Programme). Land Degrad. Dev. 1992, 3, 242–249. [Google Scholar]
- Garratt, J.R. The Atmospheric Boundary Layer; Cambridge University Press: Cambridge, UK, 1992. [Google Scholar]
- Allen, R.G.; Pereira, L.S.; Raes, D.; Smith, M. Crop Evapotranspiration: Guidelines for Computing Crop Requirements; FAO Irrigation and Drainage Paper No. 56; FAO: Rome, Italy, 1998; p. 300. [Google Scholar]
- Allen, R.G.; Pruitt, W.O.; Wright, J.L.; Howell, T.A.; Ventura, F.; Snyder, R.; Itenfisu, D.; Steduto, P.; Berengena, J.; Yrisarry, J.B.; et al. A recommendation on standardized surface resistance for hourly calculation of reference ETo by the FAO56 Penman-Monteith method. Agric. Water Manag. 2006, 81, 1–22. [Google Scholar] [CrossRef]
- Aubinet, M.; Vesala, T.; Papale, D. (Eds.) Eddy Covariance: A Practical Guide to Measurement and Data Analysis; Springer: Dordrecht, The Netherlands, 2012. [Google Scholar]
- Granger, R.J. A complementarity relationship approach for evaporation from non-saturated surfaces. J. Hydrol. 1989, 111, 31–38. [Google Scholar] [CrossRef]
- Zito, G.; Ruggiero, L.; Zuanni, F. Meteorological and climatic aspects of Puglia. In Proceedings of the Atti 1st Workshop on Clima, Ambiente e Territorio nel Mezzogiorno, Taormina, Italy, 11–12 December 1991; pp. 43–73. (In Italian). [Google Scholar]
- Portoghese, I.; Uricchio, V.; Vurro, M. A GIS tool for hydrogeological water balance evaluation on a regional scale in semi-arid environments. Comput. Geosci. 2005, 31, 15–27. [Google Scholar] [CrossRef]
- Autorità di Bacino della Puglia. Irrigation Water Balance Assessment and Policy Proposals. 2013. Available online: https://www.adb.puglia.it/public/news.php?item.344.9 (accessed on 1 September 2021). (In Italian).
- Department of Civil, Environmental, Land, Building and Chemical Engineering. Study on Water Resources in the Provinces of Lecce, Brindisi and Taranto; Department of Civil, Environmental, Land, Building and Chemical Engineering: Bari, Italy, 2018. (In Italian). [Google Scholar]


| Drawdown (m) | Pumping Rate (L/s) |
| −0.12 | 16 |
| −0.37 | 32 |
| −0.91 | 53 |
| Hydrological Year | Annual Precipitation (m) | Winter Semester Precipitation (mm; %) | Summer Semester Precipitation (mm; %) |
|---|---|---|---|
| 2017–2018 | 849.2 | 606.8; 71.5 | 242.4; 28.5 |
| 2018–2019 | 787.2 | 478.2; 60.7 | 309; 39.3 |
| 2019–2020 | 599.8 | 347.2; 57.9 | 252.6; 42.1 |
Publisher’s Note: MDPI stays neutral with regard to jurisdictional claims in published maps and institutional affiliations. |
© 2022 by the authors. Licensee MDPI, Basel, Switzerland. This article is an open access article distributed under the terms and conditions of the Creative Commons Attribution (CC BY) license (https://creativecommons.org/licenses/by/4.0/).
Share and Cite
Alfio, M.R.; Balacco, G.; Delle Rose, M.; Fidelibus, C.; Martano, P. A Hydrometeorological Study of Groundwater Level Changes during the COVID-19 Lockdown Year (Salento Peninsula, Italy). Sustainability 2022, 14, 1710. https://doi.org/10.3390/su14031710
Alfio MR, Balacco G, Delle Rose M, Fidelibus C, Martano P. A Hydrometeorological Study of Groundwater Level Changes during the COVID-19 Lockdown Year (Salento Peninsula, Italy). Sustainability. 2022; 14(3):1710. https://doi.org/10.3390/su14031710
Chicago/Turabian StyleAlfio, Maria Rosaria, Gabriella Balacco, Marco Delle Rose, Corrado Fidelibus, and Paolo Martano. 2022. "A Hydrometeorological Study of Groundwater Level Changes during the COVID-19 Lockdown Year (Salento Peninsula, Italy)" Sustainability 14, no. 3: 1710. https://doi.org/10.3390/su14031710
APA StyleAlfio, M. R., Balacco, G., Delle Rose, M., Fidelibus, C., & Martano, P. (2022). A Hydrometeorological Study of Groundwater Level Changes during the COVID-19 Lockdown Year (Salento Peninsula, Italy). Sustainability, 14(3), 1710. https://doi.org/10.3390/su14031710