Abstract
Insular territories face important challenges in achieving effective sustainable development, mainly due to low internal availability of basic resources, which results in a high external dependency. The analysis of the energy–water nexus of islands is a powerful instrument to evaluate the sustainable goals of the region and to identify the key actions to take to fulfill these objectives in future scenarios. The aim of this study is to review the energy–water nexus applied to Tenerife (Canary Islands), considering three scenarios: the base case scenario, corresponding to the current situation, where 1.1% of consumed water is dedicated to energy production and 10.2% of the energy is supplied for water abstraction, depuration, and ocean discharge; and two projections for the year 2050: a maintained trend scenario, and an ecology-aware scenario, where the population growth and the deployment of electrical vehicles are considered. In 2018, the total energy consumed was 1954 ktoe, of which renewable energy made up 2%. In the maintained trend scenario, this amount rises to 2003 ktoe, of which renewable energies represent 29%. However, in the ecology-aware scenario, this amount could be reduced to 1710 ktoe of which 51% of energy is obtained from renewable sources.
1. Introduction
Access to water and energy is the most important challenge and a prominent need of global society. A recent study estimated that only 200,000 km3 of freshwater is available for human use and consumption, representing less than 1% of all global freshwater resources available [1]. Indeed, approximately 2.5 billion people worldwide have access to groundwater sources, and the supplies have been linearly decreasing in recent years [2]. In general, fresh water is primarily used for human consumption, but it is also required for diverse human activities, such as agriculture, manufacturing, and the electric power sector [3]. According to UNESCO, there will be a global water deficit by 2050; therefore, 40% of agriculture will be at risk and 45% of the global GDP will be affected [4].
The supply and availability of fresh water is intrinsically related to the availability of energy because energy is required for pumping from water wells, desalination, reclaiming water, wastewater treatment, transportation, and distribution, which are energy-intensive processes [5,6,7]. Indeed, global energy consumption in the water sector in 2014 reached 120 Mtoe, representing 9% of the total global consumption.
On the other hand, the Energy Information Administration has estimated that global energy consumption will grow by nearly 50% between 2018 and 2050 [8]. Between 2010 and 2014, the worldwide water withdrawals to be used to produce energy ranged between 398 and 583 billion m3 per year, and consumption to produce energy varied between 48 and 66 billion m3 [9]. These values indicate between 10% and 15% of the total water withdrawal in the world is used for energy production processes [10], mostly used in hydroelectric power plants, concentrated solar power [11], conventional power plants, and fossil fuel production [12].
The joint analysis of energy and water production and consumption as a whole system is called water-energy nexus [13], providing a strong holistic overview for analyzing the sustainability of a region. Furthermore, considering the expected population growth and the relevance of the intrinsically relation between water-energy of developing and emerging countries, their demand is expected to remarkably increase [14] jointly.
The importance of the joint analysis of the water and energy has been noted by the Joint Research Centre, which recently exposed the fact that the European energy sector currently requires 74 billion m3/year of freshwater, and the use of electricity in the water sector is expected to annually increase by 4% up to 2040 [9].
This topic has been revised and checked in more than 1185 relevant documents from 2007 to 2019 [13] because improvement in energy–water efficiency will also enhance human wellness and the water footprint [15]. These studies have also been able to establish the relationship between the water-energy nexus and other factors, such as agriculture, food, and waste in different regions [16,17,18,19].
With respect to the water in insular systems, the rate of intense abstraction and continuous consumption of underground reserves from galleries, water springs, or water wells is usually higher than the defined recharging rates, increasing erosion and desertification in these territories [20]. For example, in the case of Tenerife Island, the intensive exploitation of aquifer groundwater by means of wells and water galleries has led to a groundwater reserve depletion of approximately 2 km3 (approximately 50 Hm3/year in recent decades) [21]. In the case of strong water supply deficits, other insular systems opt to import substantial amounts of fresh water. This is the case for Taiwan’s Kinmen Island, which imports approximately 30% of water from China due to the low amounts of groundwater resources [22].
In summary, the lack of fresh water has become one of the most important weaknesses or obstacles to the economic and social development of insular systems [23]. This fact is mainly due to (i) orographic conditions, which limit their own resources, such as surface and underground water; (ii) lack of storage facilities; and (iii) continuous decrease in rainwater in recent years [24]. Therefore, desalination systems using renewable energy seem to be the best option for achieving independence from freshwater imports, reducing energy imports and costs, and enhancing their potential for sustainable development [25,26,27].
Several potential methods of obtaining fresh water in insular systems have been analyzed, such as desalinization processes, to ensure fresh water requirements continue to be met for the near future [28,29]. However, these studies have been mainly focused on the optimization of technologies to allow the conversion of seawater into drinking water. In addition, certain studies analyzed the current desalination systems that could be optimized at a minimal cost with hybrid renewable systems [30,31,32]. There are also studies in isolated areas associating desalination systems with the food sector; for example, considering a desalination system supplied by wind power to provide water to an agricultural cooperative located in the southeast of Gran Canaria [33]. Additionally, some reported studies have also been focused on the sustainability of the water cycle in island territories [34] and the negative effects of the imported bottled water for the environment [35].
Because energy for many islands is mainly provided by fossil fuels [36], insular power systems must integrate renewable energies such as wind, solar, or biomass to reduce dependence on external resources [37]. However, the optimization of energy–water networks in island territories is essential for reducing electricity consumption, improving water system efficiency, and avoiding the dependence on external resources [38].
Consequently, numerous insular territories present the greatest sustainability challenges in accomplishing the Sustainable Development Goals, in particular goals 6 (clean water and sanitation) and 7 (affordable and clean energy), mainly due to their limited surface area, dependence on imported resources, and the effects of human behavior, which affect natural resources [30]. Therefore, the challenges of supplying sustainable energy and water to these insular territories include the fact that supply is especially complicated and costly because of limited resources.
In summary, the relationship between water and energy has been partially studied in insular systems, mainly focusing on the inclusion of renewable energy to obtain water [30]. However, a joint analysis of both sectors in insular systems has not yet been reported. In the present study, the interconnections between energy and water were studied using the example of Tenerife. This island has been chosen due to its current energy mix, including fossil fuels and renewable energies, and the water abstraction technologies, where the obtained results can be effortlessly adapted to other insular territories.
Additionally, losses generated by the transport of water and losses associated with the generation and transport of electricity have been analyzed, including the treatment and discharge of water, and the associated carbon emissions into the atmosphere of every process. This study uses an interesting visualization tool to expose the results of this kind of analysis: Sankey diagrams [39]. Using as a start point the current evaluation of the water-energy nexus of the island, the present study also evaluates the two different scenarios of the energy–water nexus that we understand should be included in this kind of analysis for 2050: a maintained trend scenario and an ecology-aware scenario.
The remainder of this paper proceeds as follows. First, a general overview of the water and energy inventories is provided, identifying relevant data, and describing the subsequent analysis. Then, the methodology used to analyze the data for the proposed scenarios, as well as the definition of the scenarios themselves, is presented. The exposition of the results and Sankey diagrams are presented in the fourth section. Next, a discussion of the results for the different scenarios is presented, analyzing the implications for the energy–water nexus of the alternative studied. Finally, the main conclusions of the study and recommendations for future research are presented.
2. Materials and Methods
2.1. Socioeconomic Activity
Tenerife is a relatively small volcanic island located at the center of the Canary Archipelago (Spain), with an approximate surface area of 2034 km2 and a population of 917,841 inhabitants (2019) [40]. Along with the local population, there are a high number of tourists visiting the island, which effectively forms the so-called floating population of the island, implying an annual average of 5,322,795 tourists per year. The average tourist stay in Tenerife has been reported to be 10 days [41], indicating that the floating population of the island is equivalent to 145,830 average daily tourists. With this calculation, the simultaneity of tourists on the island is considered, meaning that the effective population of the island is ~1,063,671 inhabitants.
Regarding the economic activities on the island, most of the wealth production is concentrated along the coastal areas, due to tourism, agriculture, and commercial activities, similar to the rest of the Canary Islands. Given the socioeconomic composition of the island, the demand for water and energy can be categorized into the following sectors: residential, commercial, industry, tourism, agriculture, and transportation; these categories are used throughout this study. Other activities, for instance, waste treatment processes in GHG emissions, have been aggregated in the aforementioned sectors.
2.2. Description Analysis
2.2.1. General Description
The overall process used to analyze the interrelationships between water and energy is depicted in Figure 1 and summarized in the following paragraph.
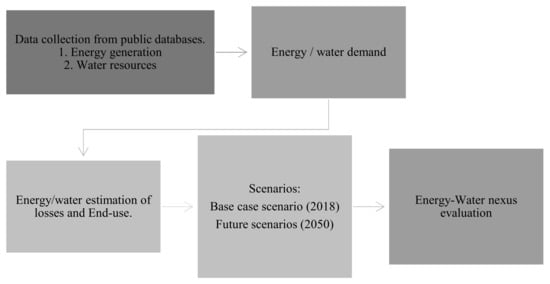
Figure 1.
Methodology for assessing the water-energy nexus in Tenerife.
In the first step, data related to energy consumption and water resources have been retrieved from different sources [42,43] and preprocessed. In the second step, the contribution of each socioeconomic sector has been identified, and the calculations to obtain the energy and water demands, segregated by sector, have been performed, considering the relationship between water and energy. Then, the losses associated with each sector have been calculated to obtain the end-uses of water and energy, considering the particularities of each sector and process. Finally, the associated carbon emissions from all the processes under study have been obtained. With all the information retrieved from the previous steps, Sankey diagrams for each of the studied scenarios have been constructed. The following subsections describe each of these steps.
In our case, energy data were directly obtained from [43]. Data preprocessing was not necessary because data from the source were readily available for the year of interest. The relevant energy data are presented separately as the energy data corresponding to the different water processes. The energy demand for water heating is detached from their respective sectors (mainly residential, tourism, and commercial) to evaluate the overall impact of this action on the energy–water nexus.
To obtain water data estimations for 2018, a linear extrapolation of the values from 2012, scaled by population growth during the 2012–2018 period, was applied. Water demand shares by sector have remained unchanged since the socioeconomic environment of the island has not been significantly altered in the last decade. The decrease in the availability of groundwater has also been considered, following the trend observed in the 2010–2015 series. Relevant data regarding water sources are presented in Appendix A.
The demand for fossil fuels by sector can be partially obtained from the original sources. In general, fossil fuels have well-defined roles and are used in energy systems (see Appendix B for more details). Gasoline and gasoil are primarily used in land transportation. Kerosene is only used for air transportation, and maritime transportation relies on the use of heavy fuel oils and gasoil. Diesel is primarily used in industrial processes and in small-scale maritime transportation. The larger heterogeneity of uses is probably encountered in LPGs because they are versatile energy carriers and can be used in several applications, such as land transport, building and water heating, and cooking. Figure 2 shows the demand share of each sector in Tenerife divided by the fuel. As can be observed, the largest demand for fossil fuels is for transport.
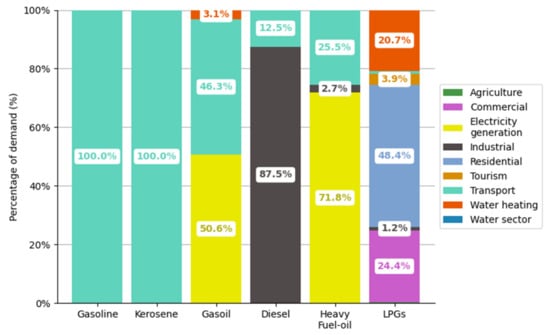
Figure 2.
Final fuel consumption by sector in 2018.
Regarding the water sector, fossil fuels are not directly used in water-related processes (they are only indirectly used for producing electricity used to power desalination plants, pumps, and other necessary equipment). The main use of fossil fuels related to water is the use of diesel and LPGs to heat water.
The distribution of fossil fuels shown in Figure 2 is used to project to the future the conditions of the fossil fuel mix, although there are some exceptions. For instance, the use of fossil fuels for electricity generation is estimated by the amount of electricity produced by thermal plants. The use of fossil fuels for land transportation is determined by the number of combustion engine vehicles present in the mix for each scenario.
Electricity demands by sector can be partially obtained directly from data sources with minor modifications (Figure 3).
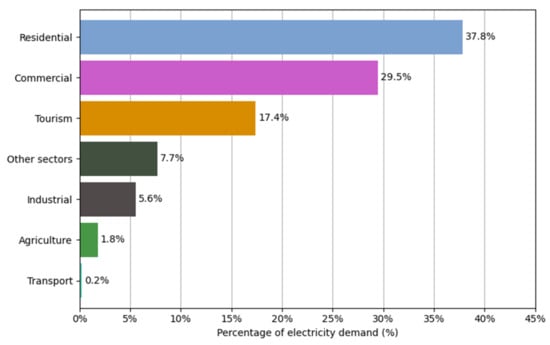
Figure 3.
Electricity consumption by sector in 2018.
However, to identify the contributions of other sectors of interest, further division of the uses of electricity is required. For instance, a small part of the electricity demand for residential and commercial sectors is used to heat water in electric water heaters. This quantity has been estimated to be 10% of the total electricity demand of both sectors in Tenerife, and it has been detached from the overall demand of those sectors to harmonize the output with the remaining steps.
Additionally, in our case, no specific data regarding water processes (such as desalination, water distribution system pumps, and wastewater-treatment plants) are provided; therefore, the demand for such processes needs to be calculated. The electricity demand in the transport sector needs to be estimated to project the future fleet of land transport vehicles, which is expected to be more electrified.
To calculate the electricity consumption for all the processes involved in the production and distribution of water, a methodology considering the specific electricity consumption of each process, in terms of the volume of water moved by each process or system, is applied. The main processes demanding energy in the water management pipeline are desalination plants, for both brackish and seawater, wastewater-treatment plants, and water pumping and distribution. In Table 1 the average energy consumption of each process used for the calculations is indicated.

Table 1.
Average specific energy consumption by water processes.
2.2.2. Electric Vehicles
The current electricity demand and trends for electric vehicles (EVs) have been also taken into account. The current lack of an EV fleet in Tenerife poses some challenges in obtaining reliable information about the electricity requirements of the land transportation sector. Electricity consumption in the transport sector () was evaluated using the following analytical expression:
where is the estimated number of EVs, is the average daily distance traveled by the vehicles in km/day, is the weighted average electricity consumption of the electric vehicle fleet (weighted by the type of vehicles in the fleet, i.e., trucks, buses, and private cars) in kWh/km, and is the average number of days of the year in which the vehicles are traveling.
- was obtained from [47], which reported that the average travel time of a car during a whole year is 666 h, meaning that the average number of days the vehicle travels is 27.75. The average specific electricity consumption per km () and average distance per day () were calculated according to the methodology described in [48,49]. The current number of EVs () was determined according to the data published by the Instituto Canario de Estadística (ISTAC) [41], although the future scenarios were scaled as explained in the corresponding section.
2.2.3. Water Demand by Sector
As mentioned in the previous sections, the latest freshwater data available for the Tenerife date from 2012. Hence, the water demand for 2018 must be calculated. To do so, the total water demand in 2012 has been scaled, according to the growth in population in 2018 [50], and the share of demand of each sector has been maintained as constant because there have not been significant changes in the socioeconomic environment or the water infrastructure of the island in recent years. In Figure 4, the share of demand for each source of fresh water is shown.
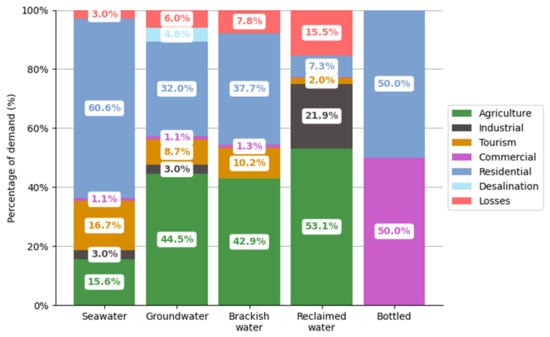
Figure 4.
Water use in Tenerife by sectors in 2018.
A significant portion (up to 105 Hm3 in 2012) of the water demanded by different sectors is provided using public supply services, that is, the public infrastructure for the distribution of water. According to the PHT [50], the sectors that make use of public water supply include residential (71.02%), industrial (4.10%), commercial (6.14%), and tourism (18.74%).
The water demand for electricity production, primarily cooling of thermal power plants and production of steam for power cycles, has been estimated by correlating the water needs with the amount of fossil fuels consumed by the thermal plants to produce electricity. Finally, the consumption of bottled water was estimated according to the sales of bottled water and the population of Tenerife [50].
2.2.4. Efficiencies and Losses
The end-use energy of each sector and the amount of dissipated energy were calculated using the different efficiency and loss coefficients for each sector.
The efficiency and loss coefficients associated with each sector were obtained from [19], in which the authors estimated an average efficiency of 21% (79% losses) for the transport sector; 65% efficiency (35% losses) for the residential, commercial, and tourism sectors; and 20% efficiency (80% losses) for the industrial sector [19]. For water processes, the overall energy efficiency was estimated to be approximately 30% (70% losses). Therefore, the energy used for each sector was calculated using the following formula:
where is the annual end-use energy in ktoe for sector , is the average energy efficiency of sector , and is the annual demand of energy in ktoe of sector . The dissipated energy () has been calculated by either subtracting the end-used energy from the total energy demand or by using the loss coefficient , as expressed in the following equation:
Data from the electric sector can be more reliably obtained from the original data sources [43], where annual fuel consumption and produced electricity are available for each thermal power plant. The average efficiency of the electric thermal generators () can then be calculated using the following expression:
where is the total electricity produced by thermal generators in ktoe, and is the sum of the thermal energy provided by the different fuels used to produce electricity, expressed in ktoe. Along with the conversion losses in thermal plants, there is another source of losses in the electric sector, which are the losses in the transport and distribution of electricity. These were obtained from the original data sources and accounted for 7.1% of the total electricity injected into the grid (including renewable plants). Therefore, the total dissipated energy, in ktoe, in the electric sector () is obtained using the following expression:
where is the total electricity injected into the grid, and is the loss coefficient of the whole system.
The water end-uses and losses can be estimated in a similar fashion to the energy ones. Once water is supplied to a certain sector, water can be either consumed (meaning that it leaves the water system) or it can be returned to the system as wastewater. The total amount of water consumed () by each sector is calculated using the following equation:
where is the total water demand for sector (in Hm3), and is the amount of wastewater generated by sector , expressed in Hm3. The amount of wastewater generated by each sector is calculated using the following expression:
where is the ratio of wastewater generated by water demanded by sector . The ratios of wastewater generation for each sector were obtained from [51]. The water that is not consumed by the sectors (wastewater) can follow three different paths: (i) it can be discharged into the subsoil through community purification systems or septic tanks and cesspools (39.50% of the total water used in the residential, commercial, and tourism sectors) [51]; (ii) water can be recovered or reused for watering golf courses or gardens (16.10% of the total water used in all sectors except agriculture) [50]; or (iii) the water can be discharged to the ocean with or without previous treatment.
Along with the end use and final destination of water, losses in the water system should be evaluated. Water losses can be categorized into two different groups: losses during the extraction, production, and treatment of water; and losses in the distribution of water, with the latter being significantly higher. Losses during extraction, production, and treatment processes were determined according to the methodology described in [50,52]. Overall losses during the extraction, production, and treatment processes were estimated to be 5.63% of the total volume of water processed. This compound percentage can be further broken down to identify the losses for each process, resulting in 5.99% losses produced during the water extraction process from the aquifers, 2.49% losses in desalinating seawater, 7.82% losses in desalinated brackish water, and 15.45% in reclaimed water in water treatment plants.
Regarding the losses associated with the distribution of water, two types of losses have been identified according to the PHT [50]: (i) deviation of sensor counter precision, and (ii) pipe leaks and unauthorized connections. An average 27% loss in the water distribution system was observed for Tenerife [52], which is slightly larger than the reported 23% average for the whole of Europe [53].
2.2.5. GHG Emissions
According to the Intergovernmental Panel on Climate Change (IPCC) inventory of GHG, in 2017, the Canary Islands emitted 13,595 kt CO2 eq [43], where 42.93% (5836 kt CO2 eq) was attributed to the island of Tenerife.
Sectorized direct emissions were obtained from the original data source [43]. Along with the energy consumption of each sector, excluding electricity, an index expressing the intensity of carbon emissions per sector () can be obtained using:
where is the total direct emissions for sector , in kt CO2 eq, and is the primary energy demanded by sector , (excluding electricity), expressed in ktoe. is later used to estimate the direct emissions of each sector in future scenarios, considering the energy consumption of each sector, also expressed in kt CO2 eq.
The second group includes indirect emissions, primarily due to the translation of emissions produced during electricity generation to electricity consumption. In this sense, emissions from electricity generation can be shared between different sectors in terms of the total electricity demanded by each sector. Therefore, the indirect emissions for each sector () can be obtained using the following equation:
where is the electricity demand of sector in ktoe, and is the yearly specific average emissions of the electric system in kt CO2 eq/ktoe, that is, the total emissions of the electric system per unit of electricity generated. Hence, the total emissions for each sector () in kt CO2 eq are obtained using:
The process of GHG emissions from water-related processes is similar. There is a small contribution to direct GHG emissions during water treatment processes (0.01% of the total direct emissions). The largest emissions associated with water processes were related to electricity consumption.
2.2.6. Scenarios
The base case scenario has been composed from the data presented in previous sections, which are mainly obtained directly from the sources. All required data have been validated by public sources, and the error was estimated to be less than 2%. We understand that these errors can be transmitted to the 2050 scenarios described below.
For the evaluation of the energy–water nexus in 2050, there are several hypotheses that need to be considered, and they can be different for each insular territory. In the case of Tenerife, (i) the expected population growth and (ii) the climatic conditions of the island, which will evolve, turning it into a more arid territory by 2050 [54], will lead to a lower availability of groundwater resources (see Appendix C for more information). Consequently, this will lead to an increase in the utilization of desalinated seawater to meet the water demands of the island, with the associated energy demands and carbon emissions depending on the electric mix. The electric mix is also expected to transition to a low-carbon electric system, where most of the electricity will come from renewable sources (mainly wind and solar photovoltaic). The electric demand will also increase due to the expected transition to an electrified land transport sector, motivated by EU regulations and technological advancements.
The maintained trend scenario aims to describe a conservative scenario in which renewable energy is deployed at a rather slow rate. The projected electric system is based on the current configuration of the electric mix (2018), following the trend of new yearly installed renewable capacity in recent years. In this scenario, the use of groundwater resources is still allowed for Tenerife, but the availability of groundwater sources is scaled down following the decreasing trend observed in recent years. The reduction in the availability of groundwater resources results in an increased need for the use of desalinated water, thereby increasing the electricity demand of the water sector.
The ecology-aware scenario describes an optimistic scenario where the energy mix is 100% renewable, with a distribution of 25% wind and 75% photovoltaic sources. This scenario considers 100% electrification of land transport. The only remaining sectors that rely on fossil fuels are maritime and air transportation, as well as a minimal contribution to industry due to operational reasons. The use of GLPs is explicitly forbidden in this scenario (both for cooking and heating), and the energy demand supplied by them will be supplied by electricity. The diesel used to heat water in the tourism sector has been replaced with electricity and solar thermal energy.
Regarding the water sector, in this scenario, the exploitation of groundwater is forbidden, as a measure to avoid desertification [55], and as a policy to allow recharge of the insular aquifer. Therefore, desalinated water is the primary source of drinking water. Imported water has not been considered to supply the population. This situation is similar to that in Qatar and Kuwait, where 100% water supply is from desalinated water [56]. In this scenario, all the generated wastewater is captured for its posterior treatment, leading to an increased wastewater capacity with the subsequent increased energy consumption of the sector (Table 2).
Table 2.
Input data of the proposed scenarios.
3. Results
3.1. Water-Energy Nexus: Sankey Diagrams
In this section, the Sankey diagrams for the base, maintained trend, and ecology-aware scenarios are presented. These diagrams illustrate the flow of the energy and water resources of the island of Tenerife, through the sectors under study to their final destination.
The energy flow is shown in green color range and the water flow in blue color range. The inset values in each square indicate the resource demanded or estimated. In the case of the energy sector, these values are expressed in ktoe/year. For the water sector, the presented values are stated in Hm3/year. In the red boxes, the calculated emissions expressed in kt CO2 eq are shown.
The initial resources (primary energy and abstracted water) are placed on the left side of the diagram, disaggregated by origin. In the center of the diagram, the flow is divided in the studied sectors (transportation, commercial, residential, tourism, industrial and agriculture). Finally, on the right side the final processes are depicted. The width of the lines are proportional to the magnitude of the different flows.
In the Figure 5, the Sankey diagram shows water-energy interactions for 2018. As a result, approximately 70% of the seawater extraction is used to cool the thermal power plants to produce electricity. Similarly, energy is present in whole water abstraction processes where desalination plants are the largest energy consumers. The diagram also reveals that agriculture is the largest water consumer sector and most of the energy is consumed by the residential sector. In the final process, the Sankey diagram reveals that dissipated energy is approximately three times higher compared with the used energy.
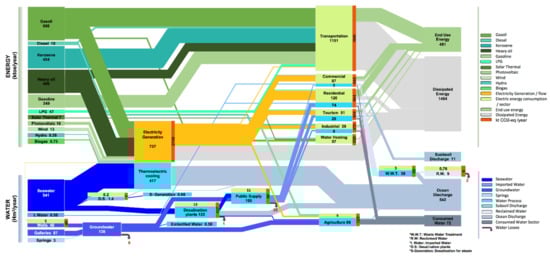
Figure 5.
Energy–water-CO2 nexus on the islands of Tenerife (2018). The red boxes at the right of some sectors represent the calculated emissions of the sector.
The major losses of fresh water occur in the distribution network (public supply), as shown in Figure 5. Also, transportation is revealed as the largest emitter of CO2 on the island. These results can be used as a starting point for more sustainable transportation considerations in future scenarios.
The Sankey diagram for the maintained trend scenario is shown in Figure 6. Compared to the base case scenario, the larger participation of renewable sources in electric generation is evident. This leads to a significant reduction in CO2 emissions on the island. However, transportation remains the most pollutant sector due to its high consumption of fossil fuels.
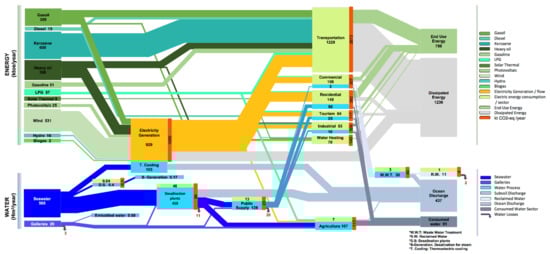
Figure 6.
Trend scenario of the energy-water-CO2 nexus (2050). The red boxes at the right of some sectors represent the calculated emissions of the sector.
In this scenario, the abstracted groundwater it is not enough to supply the water demand. Therefore, to meet demand, in comparison to the base scenario (Figure 6), the desalination process acquires more relevance. As a result, the energy consumption in the water sector is increased.
Figure 7 shows the Sankey diagram for the ecology-aware scenario. It can be observed how fossil fuels only flow to transportation (only air and maritime) and industrial sector, in comparison with the diagrams depicted in Figure 5 and Figure 6, where fossil fuels were present in the electricity generation. In this scenario, seawater is considered as the only source of freshwater.
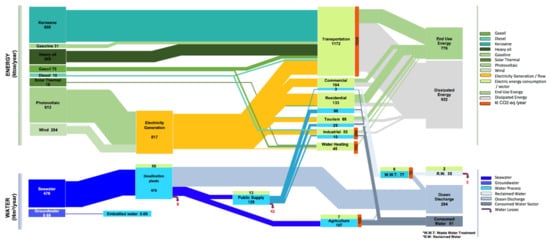
Figure 7.
The ecology-aware scenario energy-water-CO2 nexus (2050). The red boxes at the right of some sectors represent the calculated emissions of the sector.
3.2. Energy Consumption and Transformations
In Figure 8, the first bar represents the origin of energy (renewable or fossil fuels). The second bar represents the utilization of this energy, including conversion losses. The difference between the primary energy demand and conversion losses is the final energy demand of the island. The third bar represents the sectored demand for energy. The last bar represents the amount of energy that has been utilized as intended (end-use energy) and dissipated energy.
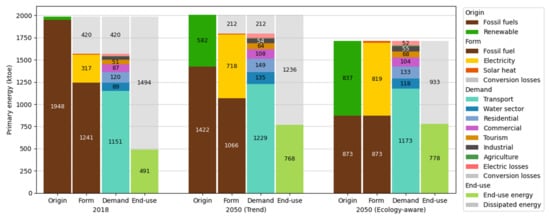
Figure 8.
Energy consumption, form, demand and end-use: 2018 (left); 2050 maintained trend scenario (centered) and 2050 ecology-aware (right) scenarios.
In 2018, 1.9% of the primary energy supplied to Tenerife was from renewable resources. By sector, the transport sector is by far the largest demander of energy. Low energy demand from the industrial sector provides an idea of the scarce industrialization of the island. The combined water sector demands 89 ktoe of energy. Finally, the amount of energy that is converted into useful energy (end-use energy) is 491 ktoe, representing an average efficiency of the energy system of 25%.
In Figure 8, the main energy results for the trend scenario are also summarized. While the final energy demand considerably increases up to 1792 ktoe (14% increase compared to the base case scenario), the primary energy demand experiences a slight decrease to 2003 ktoe (0.3% decrease compared to the base case scenario). In this sense, the more the renewable energy penetration in an energy system, the lower the conversion losses between the primary and final energy of the system.
In this scenario, only 355 ktoe of fossil fuels are used to produce electricity, which results in lower conversion losses in electric thermal plants. The remaining fossil fuels are primarily used in the transportation sector. Excluding transport, the residential sector is the most demanding sector. An analysis of the overall efficiency of the energy system showed that it has risen to 38% (13% more than in 2018), which is explained by the fact that large sources of inefficiencies in the system (such as combustion engines on land transport or thermal plants for electricity generation) have been partially replaced for more efficient solutions (EV or renewable energy plants).
A summary of the energy results for the ecology-aware scenario is also presented in Figure 8. As can be observed, the primary and final energies are equal because in this scenario, no thermal plants for generating electricity are envisioned. Moreover, the energy demand for this scenario (1710 ktoe) is slightly lower than that in the previous scenario because of the switch to more efficient devices (100% electrification in the land transport sector), and the restriction of using LPGs (water heating and cooking are performed exclusively using electricity). Focusing on the origin of the energy, up to 48.9% of the energy (837 ktoe) comes from renewable sources. The remaining 873 ktoe of fossil fuels are exclusively used by maritime and air transportation, which is a small part of the industry.
By sector, transportation remains the largest energy demander, although the absolute value decreases in comparison with that in the previous scenario. The water sector (including water heating) requires 118 ktoe, from which 49 ktoe corresponds to desalination plants.
3.3. Electricity Generation by Technology and Demand by Sector
Figure 9 shows the demand for electricity, where the first bar represents the generation of electricity, and the second bar shows the sectorized demand. Generation is dominated by fossil-fuel-based thermal generation, which accounts for 90% of the total electricity generated.
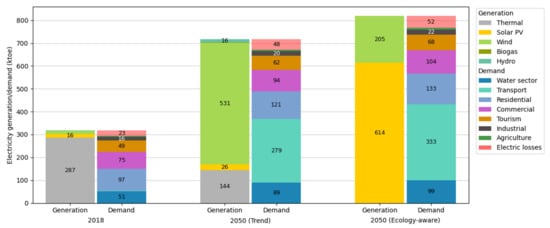
Figure 9.
Generation and electricity demand for the base scenario in 2018 (left); 2050 trend scenario (centered) and 2050 the ecology-aware scenario (right).
In the case of the 2050 trend scenario, the demand increased to 718 ktoe (126% increase with respect to 2018). This large growth is explained by the important transition to more electrified energy demand and the increase in capacity of desalination plants used to meet the demands of freshwater in this scenario. Transport has become the largest source of demand for electricity. It is also noticeable that the larger the electricity injected in the grid, the larger the electric losses associated with transport and distribution; thus, in this scenario, electric losses rose to 48 ktoe (106% higher than the previous scenario).
For the 2050 ecology-aware scenario, the demand increases by 14% more than that in the maintained trend scenario, with land transport being the sector with the largest demand. Since the remaining sectors, excluding the industrial sector, only met their demands with electricity, the values are equal to those shown for the trend scenario. The difference in the water sector between the two scenarios can be explained by the amount of solar-heated water.
3.4. Hydric Resource
Figure 10 shows the main results concerning the water sources and uses. The first bar represents the origin of the water (water source). The second bar represents the sector demand for water. The third bar represents the final water destination.
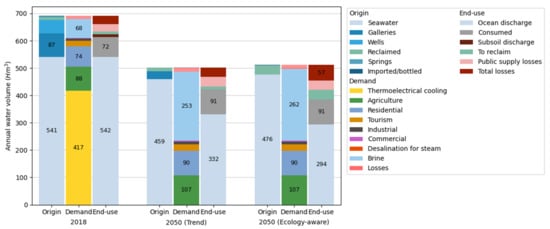
Figure 10.
Estimation of the hydric resource: in 2018 (left), based on data from PHT [50]; 2050 trend scenario (centered) and 2050 the ecology-aware scenario (right).
The total amount of water extracted from all the different sources in 2018 (Figure 10 left) was 691 Hm3. Regarding the origin of the water, seawater (541 Hm3) constitutes 69% of the total water abstracted, while the water obtained from groundwater sources reached 138 Hm3. Reclaimed water was 11.3 Hm3.
Focusing on water demand, electricity generation has a large impact on the overall water use, primarily because of the cooling needs of thermal power plants (417 Hm3). A small amount of water (1.47 Hm3) is also used for steam generation in power plants. Excluding electricity production, the total demand for fresh water was 192 Hm3. The agriculture sector (88 Hm3) is the largest consumer, mainly because of the production of bananas [55]. The brine area on the second bar of Figure 11 represents the amount of high salt concentration water that is rejected from desalination plants and discharged into the ocean.
Figure 10 (centered) illustrates the main results for water for the maintained trend scenario. The overall water abstraction decreases to 607 Hm3 (12% less water abstracted than 2018) because of the reduction in the cooling needs of thermoelectrical plants; 98% of the water abstracted is seawater. Regarding wastewater management, in this scenario, there is no discharge of wastewater to the subsoil, so proportionally, a larger share is dumped into the ocean (both with and without prior treatment).
As shown in Figure 10 (right), the total water abstracted in the ecology-aware scenario decreases to 511 Hm3 (15% less than the previous scenario and 26% less than in the base case scenario). In this scenario, groundwater abstraction is not allowed, leading to a water system relying almost entirely on desalinated seawater and recycling of wastewater, mainly for irrigation purposes. The overall effective water demand is the same as in the previous scenario (234 Hm3), as well as the distribution by sector. In this scenario, all wastewater generated by the different sectors is captured for its posterior treatment, which results in an increased availability of reclaimed water.
3.5. Water Losses
Losses in the water cycle are divided into losses in the extraction, losses in the distribution and use, and losses in the recovery and treatment processes. The losses in distribution are represented in Table 3 as public supply losses.
Table 3.
Calculated water losses in each sector.
Water losses in the 2050 trend scenario are concentrated in the distribution chain (public supply), although losses in the rest of the processes are also present; notably, losses are increased in the extraction and desalination of seawater due to the higher use of this source.
Losses in the ecology-aware scenario are considerably higher (57 Hm3) than those in the previous scenario, mainly because of the water lost during the wastewater-treatment processes.
3.6. Emissions
Figure 11 shows a summary of the emissions for the different scenarios. The first bar shows the total emissions associated with each sector. The second bar provides information regarding the source of emissions. Indirect emissions are equivalent to the emissions associated with the generation of electricity, excluding those due to electric system losses.
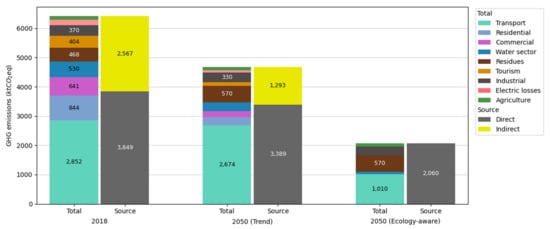
Figure 11.
Calculated GHG emissions: in 2018 (left); 2050 trend scenario (centered), and 2050 the ecology-aware scenario (right).
The total GHG emissions in 2018 were 6416 kt CO2 eq. The transport sector had the largest emissions by far, which is expected because it has the highest energy demand and most of it is met by burning fossil fuels. If the electric system were treated as an independent sector, it would be the second-largest emitter (including emissions due to electric losses). It is expected that in future scenarios with more renewable energy in the mix, the number of indirect emissions will decrease, and the total emissions will be reduced.
Figure 11 (centered) shows the emission results for the 2050 maintained trend scenario. The overall emission decreased by 23.8% compared to 2018. Transport is again the largest GHG emitter. Water sector emissions are mostly caused by water heating processes using LPGs. The rest of the water processes experience reductions in their net emissions, even desalination plants, despite the higher demand for freshwater from seawater. This is due to the fact that most of emissions were indirect (produced by the thermal electricity generators), and in this scenario, the amount of electricity generated with conventional sources was considerably smaller than that in 2018.
For the 2050 ecology-aware scenario (Figure 11 right), the total emissions represent reductions of 56% and 68% compared to those in Scenarios 1 and 2018, respectively. There are no emissions due to electricity generation because the electric mix is 100% renewable in this scenario. Direct emissions of the water sector increase because of the extended wastewater-treatment capacity added to the system, although its overall emissions decrease due to the electrification of the water heaters.
3.7. Scenarios Results
Although some comparisons have been made during the presentation of the results, the most important ones in terms of energy, water, and emissions are summarized in this section. In Table 4, the most relevant results for each scenario are listed.
Table 4.
Comparison between the results from the proposed scenarios.
As previously mentioned, the trend scenario has the highest primary energy demand, followed by the base case scenario (Figure 12). This is consistent with the fact that the energy demand will increase by 2050, according to population growth. However, when analyzing the ecology-aware scenario, it can be observed that it has the lowest primary energy demand. Since there is no conversion of fossil fuels into electricity in this scenario, no conversion losses are incurred, and hence, its primary energy demand is equal to the final energy demand.
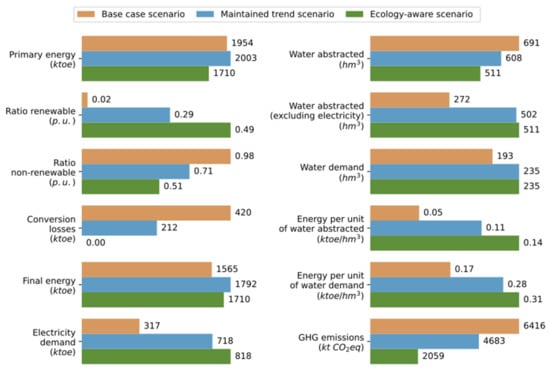
Figure 12.
Comparison between the obtained results from the base case scenario, maintained trend scenario and ecology-aware scenario.
4. Discussion
As shown in the Table 4 and Figure 12, the final energy demand of the trend scenario is slightly higher than that of the ecology-aware scenario. Although the same parameters have been used for scaling the energy demand in both scenarios, the modeled differences between the demand side of the energy systems of both had an impact on the amount of final energy required. A greater electrification of the energy demand will lead to the use of more efficient devices (for instance, EVs instead of combustion engine vehicles); therefore, the energy required for these devices should be lower than that required for less efficient devices. All these efficiency improvements are clearly reflected in the overall energy system efficiency, which increases up to 45.5% in the 100% renewable scenario.
One of the most interesting findings that can be extracted from the table is probably related to the energy consumed by the water sector per unit of water. The indexes showing this relationship (called the table ratio ktoe/Hm3) increase in both future scenarios. The limitations in groundwater availability and the increase in water demand imposed for future scenarios explain this behavior. Desalination is an energy-intensive process compared to the extraction of groundwater. As discussed in Appendix A, the majority of groundwater in Tenerife comes from galleries, which require very small amounts of energy for extraction (even wells, with their pumping requirements, are far less energy-intensive than desalination).
By analyzing the variation in GHG emissions among the scenarios, an important decrease in GHG emissions is obtained for both future scenarios, which is expected given the higher renewable energy penetration in the mix, combined with the electrification of land transportation, which is one of the largest emitters in the base case scenario.
Finally, some interesting findings arise if the results are analyzed from a lower-level perspective. For instance, in the ecology-aware scenario, solar PV and wind power were the only electricity generators. In this paper, it seems feasible, but we cannot ignore the fact that Tenerife is an island, and as such, it has certain land limitations. Considering the electricity demand in the second scenario, if a quick estimation of the required area for all that renewable generation is performed, the results show that solar PV would require approximately 193.4 km2 (considering the actual equivalent average solar hours), including roofs and land installations, and wind power would require 241 km2 of area (considering modern 3.5 MW wind turbines). This fact, along with others such as the state of electric infrastructure or saturation of electrical substations, should be considered when translating the results of this high-level study to a feasibility study. Of course, the option for offshore wind and PV installations can decrease the pressure to occupy more territory.
The proposed analysis in this work allows the interrelation between the different agents that intervene in the water and energy nexus of the island. Despite particular solutions to optimize the energy and water demand, as previously reported in the literature, for example for the case of the Mediterranean islands [37], the consideration and compression of the different sectors and their influence on the nexus presented in this work can provide new sustainable solutions and a deeper analysis of their interrelation, similar to [38].
The results obtained for the 2050 scenarios show the need to increase the renewable energies’ mix in the islands, to reduce the energy dependence. These results are in concordance with the reported results for a Greek island, Nisyros, where new photovoltaic power plants have been evaluated for energy production [57]. Compared to studies performed in continental territories, where the increase in energy demand for the 2050 scenarios is in the range of 7.8–9% [18], the scenarios proposed in this work show an increase of 2.5% for the maintained trend scenario and a reduction of 12.5% for the ecology-aware scenario.
Indeed, the reported proposals to incorporate electrical vehicles in the island grids normally only present a partial approach to the water-energy nexus [58], in which only energy demand, and therefore CO2 emissions, have been studied. However, as has been stated in this paper, water demand for energy production is an aspect that has not been considered in this type of study.
Considering the insular territory limitations, the viability of interconnections between island networks [59] is normally restricted to energy and economic issues, and the water-energy nexus, emission and its impact on the different economic sectors, are neglected.
Finally, in comparison with the sustainability challenges previously reported in Mediterranean islands [32,37], Greek islands [30] or the Maldives [24], the sustainability challenges of Tenerife are quite similar to the middle-size islands of the world. Therefore, the obtained results in this work can be easily applied to other island territories.
5. Conclusions
In this study, a review of the energy–water nexus in insular power systems is presented, and a methodology for a complete evaluation of the energy–water nexus is proposed. GHG emissions are also included in the methodology to estimate the contributions of each sector to global emissions. Sankey diagrams for Tenerife in 2018 and for the two scenarios for 2050 are discussed.
In the base case scenario, the results reveal the strength of the energy–water nexus on the island and the dependence on resource importation, which can be extended to most insular systems with scarce energy and water resources. The results also show an increase in the overall energy system efficiency as the share of renewable energy and the electrification of the demand increase, explained by the reduction in the conversion losses experienced in thermal electric plants and the higher efficiency of electric loads compared to their fossil fuel counterparts. However, as the availability of groundwater sources diminishes, the energy cost of supplying water demand will increase sharply. This is due to the higher specific consumption of desalination plants compared to the extraction of water from galleries and wells. Emissions will decrease in future scenarios, since the inclusion of renewable energy in the electric mix will lead to a smaller emission coefficient per unit of electricity consumed, even if the electric demand will grow.
The methodology presented in this study, as well as the performed analysis, could be extended in a variety of ways, as follows: (i) to apply the proposed methodology to other islands, regions, or countries; and (ii) to evaluate the inclusion of modern growing technologies in energy and water systems, such as hydrogen electrolysis, which will have a sizeable impact on the energy–water nexus because it has intensive use of both water and electricity, or even to perform a dynamic evaluation of the energy–water nexus to capture the evolution of the different variables under study. This will help to envision the timing required for the necessary transitions in energy–water systems and will provide valuable insights into the decision-making processes.
The proposed methodology verifies the importance of studying the relationship between the energy and water sectors, particularly in insular systems, because they usually lack primary resources such as fossil fuels, and they are more prone to experience energy and water restrictions in the future. Analysis of the energy–water nexus will allow better planning for both the water and energy sectors by helping in the decision-making process of sustainability and environmental protection policies and plans. Additionally, Sankey diagrams have proved to be a powerful visualization tool to explore the results of the analysis, providing insights not only about the quantities managed by each sector or process, but also providing useful information regarding the flows and interactions between different productive processes and socioeconomic sectors.
Author Contributions
Conceptualization, R.G.-L. and B.G.-D.; methodology, D.R.-U., B.G.-D. and D.C.-R.; software, D.R.-U.; validation, B.G.-D. and D.C.-R.; formal analysis, D.R.-U., B.G.-D. and R.G.-L.; investigation, D.R.-U.; resources, D.R.-U.; data curation, D.C.-R. and B.G.-D.; writing—original draft preparation, D.R.-U.; writing—review and editing, D.R.-U., B.G.-D.; visualization, D.C.-R.; supervision, R.G.-L.; project administration, B.G.-D.; funding acquisition, B.G.-D. All authors have read and agreed to the published version of the manuscript.
Funding
This research was funded by the CajaCanarias Foundation (grant number 2019SP25).
Conflicts of Interest
The authors declare no conflict of interest.
Appendix A. Water Inventory
The Figure A1 shows the population grown and the abstracted water in Tenerife from 2000 to 2018.
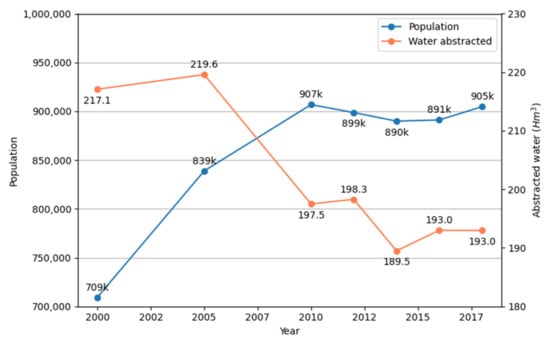
Figure A1.
Population grown and abstracted water evolution in Tenerife from 2000 to 2018.
The last water inventory data available on the island was published in 2015, although the data are from 2012. The total amount of water abstracted in Tenerife in 2012 was 651 Hm3, of which 420.3 Hm3 corresponds to seawater directly used for cooling the electric thermal generators and generating steam inside power plants, and 230.7 Hm3 corresponds to the freshwater used to meet the demand, including losses. The actual demand for freshwater for that year was 187.4 Hm3.
There are four water sources used to cover the water demand of the island: seawater, groundwater, reclaimed water, and imported water. The distribution of each source for 2012 is presented in Figure A2. It can be seen that seawater is the main source of water, at 478 Hm3; this fact is explained by the high usage of seawater in thermoelectric cooling. Groundwater is the primary source covering the demand for freshwater, accounting for 161.3 Hm3 of the total. Groundwater is obtained from galleries (101.7 Hm3), wells (56.1 Hm3), and springs (3.6 Hm3). Reclaimed water is the water recovered after water treatment processes, accounting for 11.1 Hm3, and it is mainly used for agriculture and golf course irrigation. Finally, imported water is of minor importance, accounting only for 0.57 Hm3, which is consumed in the form of bottled water in the residential and commercial sectors.
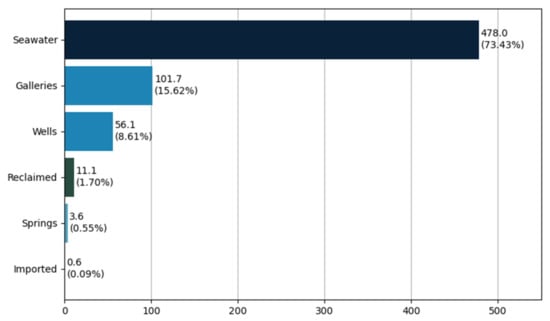
Figure A2.
Water abstracted in Tenerife by source in 2012 (Hm3).
Tenerife has 1121 galleries, 397 water wells, and 310 water springs, which provide up to 86% of drinkable water to the island. Regarding the galleries, 56.01% of them do not present any flow rate (currently inactive). The active galleries can be grouped according to their flow rates, as shown in Figure A3.
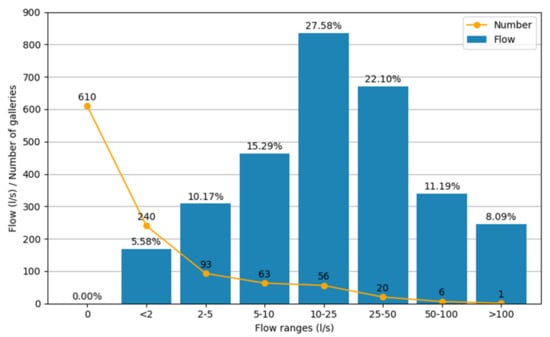
Figure A3.
Status of the conventional galleries of Tenerife in 2015. Source: Own elaboration based on data from the Insular Hydrology Plan [42].
In 2015, there were 83 galleries with flow rates greater than 10 L/s, with a combined flow rate of 2089 L/s (65.9 Hm3 yearly) (Figure A4); however, in 2018, the water production of these galleries had been reduced by 12%. This exposes the problem that water demand increases at a higher rate than aquifers can recover. In Figure A5, the galleries experiencing flow reductions between 2015 and 2018 are highlighted in red.
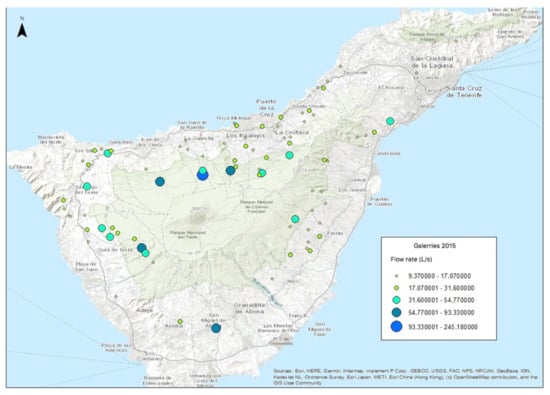
Figure A4.
Map of the active galleries in Tenerife in 2015 with average water flow rates higher than 9.37 L/s.
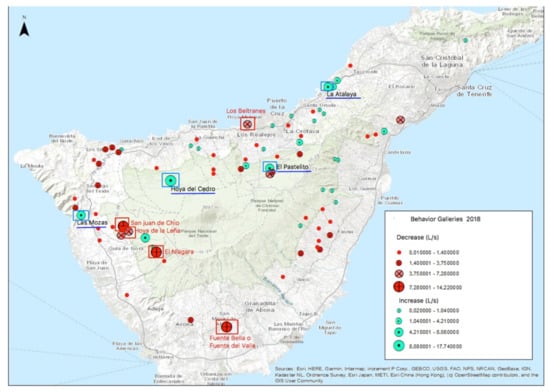
Figure A5.
Comparative map of Tenerife galleries with the highest flow variation between 2015 and 2018.
These flow rate variations can be attributed to two main factors: (i) the decrease in groundwater in the insular aquifer, and (ii) the operation and maintenance activities carried out in some galleries (mainly detection and repairs of leaks, and additional drilling), which, in general, increase the amount of water extracted. However, between 2010 and 2015, the observed global tendency was a decrease of 9.85% in the flow rates in the galleries, which effectively implies a reduction in the availability of the groundwater source on the island. Thus, the hypothesis of a continuous decrease in the availability of groundwater sources must be used for the projection of future scenarios.
Seawater has special relevance in the energy–water nexus because of the following two reasons: (i) a large share of the currently abstracted seawater is used in the cooling processes of thermal power plants [46,60], and (ii) desalination plants used to produce freshwater from seawater demand an important amount of energy, generally in the form of electricity.
Desalinated seawater is used to supply part of the demand for different sectors [45]. Desalination in the islands is mainly performed by reverse osmosis, although a relatively small part of the desalination is performed inside conventional power plants using mechanical vapor compression. There are 44 desalination plants with a total annual capacity of 50 Hm3.
In addition to seawater, some galleries on the island also provide brackish water (7.67 Hm3 in 2012), which must also be desalinated or treated prior to consumption, although the requirements for desalination (in terms of energy) and the amount of brine produced per m3 of freshwater are lower than those for desalinating seawater.
The last source of water identified was imported bottled water. Bottled water is imported to the island, mainly for residential and commercial consumption. Its participation in the overall demand is marginal, accounting for (0.57 Hm3 in 2012). It is worth mentioning that although some of the water abstracted from the galleries and wells is also bottled for human consumption, its original source is the respective groundwater source, and they are accounted for in that category.
In Tenerife, wastewater is either partially treated in wastewater-treatment plants or directly discharged into the ocean and subsoil. In 2018, the entire wastewater infrastructure in Tenerife was able to treat 38 Hm3 of water annually. This figure is clearly insufficient to deal with all the wastewater generated annually, which is slightly below 100 Hm3. The remaining wastewater generated that has not been captured by wastewater-treatment systems is discharged into subsoils or directly into seawater. This way of disposing of used water is pernicious for the coastal habitats of the island and could provoke unhealthy conditions for the inhabitants. This highlights the need for an extension of the water treatment infrastructure in the next decades.
Additionally, wastewater streams must be treated with special care. Industrial water discharges, for instance, may contain hazardous contaminants that may pose risks to the natural environment and habitats of both wildlife and humans. In this sense, 78% of industrial wastewater is captured for posterior processing. The wastewater captured from residential, commercial, and tourism sectors is estimated to be ~38% [51]. Although the wastewater is captured, this does not mean that all of the wastewater is treated. This is reflected below, where the different losses and unrecoverable water are shown in the water treatment process. Currently, only 16.1% of the captured water is recovered as reclaimed water for use, mainly in irrigation [50].
The Canarian Law of Water 12/1990, of July 26 [61], established the autonomy of each Canary Island to manage, organize, and plan the hydrological system through their respective Insular Water Council, which is responsible for water management and investment in the construction of new hydraulic infrastructures, ponds, water treatment plants, and distribution networks [20].
The Insular Water Council is also a competent body that applied the hydrological planning instrument, called the Insular Hydrology Plan (Plan Insular de Aguas, PHI). The current PHI of Tenerife was approved by Decree 168/2018, according to the European Directive 2000/60/EC, which establishes the legal framework in the field of water policy. The exploitation of groundwater, according to the aforementioned law, has been granted for 50 years. After this period, if the water flows remain according to the established requirements, an administrative concession can be claimed.
Appendix B. Energy Inventory
The primary energy consumption of the source is shown in Figure A6. As of 2018, the primary energy consumption in Tenerife was 1985 ktoe (2011 ktoe, including stock variations). Stock variations were excluded from the analysis in this study because they do not have a significant impact on the overall energy use. It can be observed that the primary energy mix of the island is dominated by fossil fuels, which account for 1974 ktoe (98.15%) of the total primary energy consumption, with a marginal contribution from renewable energy sources of 37 ktoe (1.85%).
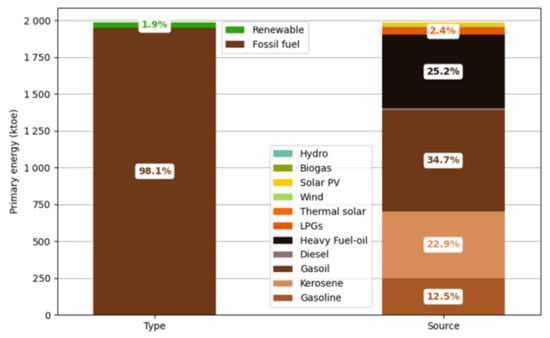
Figure A6.
Current energy mix in Tenerife (2018).
The fossil fuels present in the internal market of the island are gasoline (12.5% of the total primary energy), gasoil (34.7%), kerosene (22.9%), diesel (0.5%), fuel oils (25.2%), and liquefied petroleum gases (LPGs, 2.4%), and renewable energy sources include wind (0.6%) and solar (0.8%), with a small contribution from biogas and mini-hydro power.
Transport is, by far, the most demanding sector in terms of primary energy consumption (1151 ktoe). The transport sector can be divided into three categories: land, maritime, and air transportation. Land transportation, which consumes 535 ktoe annually, primarily relies on the use of gasoline and gasoil, with a marginal contribution of LPG and electricity. The share of EVs on the total vehicle fleet constitutes an insignificant 0.05%, but it is expected that this number will considerably increase in the next decades, given the new European regulations and the economic aid granted to the EV sector. Additionally, there is a tram in the metropolitan area of the island that contributes to electricity usage by the land transport sector. Maritime transport is by itself the largest energy consumer in the island, although, after excluding international fleets (which is usually done in this kind of analysis to counter the fact that the energy is not consumed on the island), the energy demanded by national maritime transport is 161 ktoe. Maritime transport is fueled by oil, diesel, and heavy fuel oils. Air transport demands 453 ktoe annually, and the principal demand is for kerosene. The last figure gives an overview of the importance of the international tourism sector on the island.
The electric sector is followed by transport. Electricity on the island is generated using gasoil and heavy fuel oils for thermal power plants, consuming 706 ktoe of both fossil fuels. Together with the transport sector, they account for 95% of the total fossil fuel consumption of the island. The industrial sector is not very energy intensive in the overall mix of the island, due to the absence of large industries, and demands 23 ktoe of fossil fuels. The remaining fossil fuel consumption is produced in the rest of the sectors, mainly in the form of LPGs, which are used for water heating and cooking.
The electric demand of Tenerife in 2018 was 3514 GWh [43]. Currently, there are two large thermal power plants located in Candelaria and Granadilla, which supply 82.72% of the total electricity. However, the power plant located in Candelaria reached the end of its operational lifetime at the end of 2019, and it is expected to cease its operation in the near future [62]. Only the remaining 17.28% of the electricity is generated by renewable energy resources, mainly through photovoltaic and wind sources. The current installed power capacity in Tenerife by technologies is shown in Figure A7 [43].
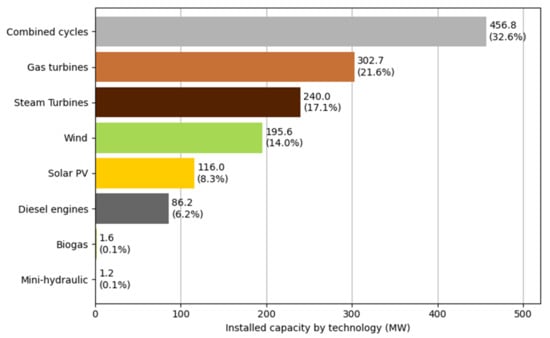
Figure A7.
Installed power capacity on 31 December 2018 [43].
Appendix C. Future Scenarios
All the common considerations made for 2050 scenarios to account for each of the abovementioned factors are listed below:
- Population and tourism projections: to calculate the population in 2050, the ratio between the population and tourists in 2018 (1.76%) was considered. In 2050, 7,061,961 tourists have been estimated to visit (Figure A8a), equivalent to 193,478 average daily tourists. According to the projection over the last six years since 2014, the population in 2050 is estimated to be 1,120,537 inhabitants, including the floating population (tourists).
- Water projections: water demand for 2050 was estimated in the same fashion as the 2018 demand, based on population growth projections. The availability of groundwater for 2050 can be estimated by projecting the decreasing trend explained in Figure A8b into the future, which yields a groundwater availability of 29 Hm3 for the year 2050. This leads to the conclusion that, to fulfill the demand for drinking water, the supply capacity of seawater desalination plants must increase considerably in the next decades, to fulfill the difference with the current 138 Hm3 extracted from groundwater sources.
- Energy demand: the energy demand in Tenerife has been estimated by considering population growth. Apart from the identified sectors that will unavoidably experience large transformations (mainly water and land transport sectors), no major changes in the socioeconomic environment of Tenerife are expected for the next decades. Hence, the distribution of electricity and energy consumption among the remaining sectors for 2050 is expected to remain identical to that for 2018, except for the sectors of interest.
- Interconnection of the electric system with La Gomera Island: there is an approved project for the interconnection of the electric systems of Tenerife and La Gomera, the island closest to Tenerife. It has a population of 22,100 inhabitants and a 73.90 GWh/year electricity demand (2018) [43]. According to the projections for the year 2050, the electricity demand of La Gomera will be 90.81 GWh (7.81 ktoe).
- Electrification of the transport sector: the share of electricity demanded by the transport sector was estimated using the procedure described in the Methodology section. The total vehicle fleet for 2050 was estimated to be 1,083,308 vehicles. Moreover, the Climate Change and Energy Transition Law considers that by 2040, the sales of internal combustion engine vehicles will be forbidden in Spain [63], which implies that from 2040 to 2050, only new vehicles will be electric. Under the current rates of car sales and the abovementioned conditions, 907,927 EVs and 175,831 internal combustion engine vehicles are projected to compose the total vehicle fleet by 2050.
- Wastewater-treatment capacity: the capacity of wastewater systems will increase by 2050, considering that wastewater discharge into the subsoil will not be allowed.
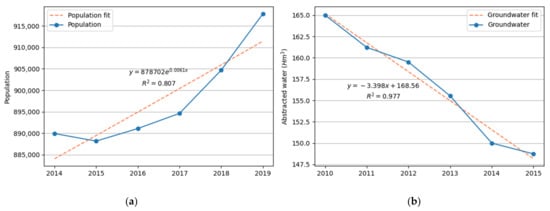
Figure A8.
Trends of population growth and groundwater in Tenerife. (a) Trend of the population growth. (b) Trend of the groundwater abstraction.
References
- Muhanji, S.O.; Farid, A.M. An enterprise control methodology for the techno-economic assessment of the energy water nexus. Appl. Energy 2020, 260, 114274. [Google Scholar] [CrossRef] [Green Version]
- Gude, V.G. Desalination of deep groundwater aquifers for freshwater supplies—Challenges and strategies. Groundw. Sustain. Dev. 2018, 6, 87–92. [Google Scholar] [CrossRef]
- Dodder, R.S.; Barnwell, J.T.; Yelverton, W.H. Scenarios for Low Carbon and Low Water Electric Power Plant Operations: Implications for Upstream Water Use. Environ. Sci. Technol. 2016, 50, 11460–11470. [Google Scholar] [CrossRef] [PubMed]
- UNESCO. Informe Mundial de las Naciones Unidas sobre el Desarrollo de los Recursos Hídricos 2019. No Dejar a Nadie Atrás. Available online: https://es.unesco.org/water-security/wwap/wwdr/2019 (accessed on 1 November 2021).
- Xiang, X.; Jia, S. China’s water-energy nexus: Assessment of water-related energy use. Resour. Conserv. Recycl. 2019, 144, 32–38. [Google Scholar] [CrossRef]
- Mateos, F.; Rodríguez, S. Estudio de Prospectiva Consumo Energético en el Sector del Agua. Available online: https://www.idae.es/uploads/documentos/documentos_Estudio_de_prospectiva_Consumo_Energetico_en_el_sector_del_agua_2010_020f8db6.pdf (accessed on 2 October 2021).
- Lorenzo, J.; Zumalacárregui, L.; Mayo, O. Integración simultánea de agua y energía: Logros y desafíos. Cent. Azúcar 2016, 43, 37–50. [Google Scholar]
- U.S. Energy Information Administration. Energy Information Administration. Choice Rev. Online 2007, 44, 3624-1–3624-44. [Google Scholar] [CrossRef]
- European Commission. JRC Science for Policy Report—Water Energy Nexus in Europe. Available online: https://publications.jrc.ec.europa.eu/repository/handle/JRC115853 (accessed on 7 November 2021).
- Zhong, Z. Proceedings of the International Conference on Information Engineering and Applications (IEA) 2012; Springer: London, UK, 2013. [Google Scholar]
- Guerrero-Lemus, R.; Shephard, L.E. Low-Carbon Energy in Africa and Latin America: Renewable Technologies, Natural Gas and Nuclear Energy; Springer: Cham, Switzerland, 2017; ISBN 9783319523095. [Google Scholar]
- Kargbo, D.M.; Wilhelm, R.G.; Campbell, D.J. Natural Gas Plays in the Marcellus Shale: Challenges and Potential Opportunities. Environ. Sci. Technol. 2010, 44, 5679–5684. [Google Scholar] [CrossRef]
- Ding, T.; Liang, L.; Zhou, K.; Yang, M.; Wei, Y. Water-energy nexus: The origin, development and prospect. Ecol. Model. 2020, 419, 108943. [Google Scholar] [CrossRef]
- Al-Ansari, T.; Korre, A.; Nie, Z.; Shah, N. Integration of greenhouse gas control technologies within the energy, water and food nexus to enhance the environmental performance of food production systems. J. Clean. Prod. 2017, 162, 1592–1606. [Google Scholar] [CrossRef]
- Lezzaik, K.; Milewski, A.; Mullen, J. The groundwater risk index: Development and application in the Middle East and North Africa region. Sci. Total Environ. 2018, 628–629, 1149–1164. [Google Scholar] [CrossRef]
- Li, M.; Fu, Q.; Singh, V.P.; Liu, D.; Li, T. Stochastic multi-objective modeling for optimization of water-food-energy nexus of irrigated agriculture. Adv. Water Resour. 2019, 127, 209–224. [Google Scholar] [CrossRef]
- Rambo, K.A.; Warsinger, D.M.; Shanbhogue, S.J.; Lienhard, V.J.H.; Ghoniem, A.F. Water-Energy Nexus in Saudi Arabia. Energy Procedia 2017, 105, 3837–3843. [Google Scholar] [CrossRef] [Green Version]
- Chen, P.-C.; Alvarado, V.; Hsu, S.-C. Water energy nexus in city and hinterlands: Multi-regional physical input-output analysis for Hong Kong and South China. Appl. Energy 2018, 225, 986–997. [Google Scholar] [CrossRef]
- U.S. Department of Energy. The Water-Energy Nexus: Challenges and Opportunities. Available online: https://www.energy.gov/sites/default/files/2014/07/f17/Water%20Energy%20Nexus%20Executive%20Summary%20July%202014.pdf (accessed on 7 August 2021).
- Ruiz de la Rosa, C.I.; García Rodríguez, J.L.; Castilla Gutiérrez, C.; Santamarta Cerezal, J.C.; Antonova, N. Agua y Turismo en Tenerife: Producción, Gestión y Consumo; Universidad de La Laguna: San Cristóbal de La Laguna, Spain, 2019; ISBN 9788409084012. [Google Scholar]
- Custodio, E.; Cabrera, M.D.C.; Poncela, R.; Puga, L.-O.; Skupien, E.; del Villar, A. Groundwater intensive exploitation and mining in Gran Canaria and Tenerife, Canary Islands, Spain: Hydrogeological, environmental, economic and social aspects. Sci. Total Environ. 2016, 557–558, 425–437. [Google Scholar] [CrossRef]
- Chen, I.-C.; Wang, Y.-H.; Lin, W.; Ma, H.-W. Assessing the risk of the food-energy-water nexus of urban metabolism: A case study of Kinmen Island, Taiwan. Ecol. Indic. 2020, 110, 105861. [Google Scholar] [CrossRef]
- Segurado, R.; Costa, M.; Duić, N. Chapter 9-Integrated Planning of Energy and Water Supply in Islands. In Renewable Energy Powered Desalination Handbook; Gude, V.G., Ed.; Butterworth-Heinemann: Oxford, UK, 2018; pp. 331–374. ISBN 978-0-12-815244-7. [Google Scholar]
- Liu, J.; Mei, C.; Wang, H.; Shao, W.; Xiang, C. Powering an island system by renewable energy—A feasibility analysis in the Maldives. Appl. Energy 2018, 227, 18–27. [Google Scholar] [CrossRef]
- Klaimi, R.; Alnouri, S.Y.; Al-Hindi, M.; Azizi, F. Optimization techniques for coupling renewable/hybrid energy options with desalination systems for carbon footprint reduction. Chem. Eng. Res. Des. 2019, 151, 270–290. [Google Scholar] [CrossRef]
- Mollahosseini, A.; Abdelrasoul, A.; Sheibany, S.; Amini, M.; Salestan, S.K. Renewable energy-driven desalination opportunities–A case study. J. Environ. Manag. 2019, 239, 187–197. [Google Scholar] [CrossRef]
- Li, Z.; Siddiqi, A.; Anadon, L.D.; Narayanamurti, V. Towards sustainability in water-energy nexus: Ocean energy for seawater desalination. Renew. Sustain. Energy Rev. 2018, 82, 3833–3847. [Google Scholar] [CrossRef] [Green Version]
- Schallenberg-Rodríguez, J.; Veza, J.M.; Blanco-Marigorta, A.M. Energy efficiency and desalination in the Canary Islands. Renew. Sustain. Energy Rev. 2014, 40, 741–748. [Google Scholar] [CrossRef]
- Gómez-Gotor, A.; del Río-Gamero, B.; Prado, I.P.; Casañas, A. The history of desalination in the Canary Islands. Desalination 2018, 428, 86–107. [Google Scholar] [CrossRef]
- Papapostolou, C.M.; Kondili, E.M.; Zafirakis, D.P.; Tzanes, G.T. Sustainable water supply systems for the islands: The integration with the energy problem. Renew. Energy 2020, 146, 2577–2588. [Google Scholar] [CrossRef]
- Mehrjerdi, H. Modeling and optimization of an island water-energy nexus powered by a hybrid solar-wind renewable system. Energy 2020, 197, 117217. [Google Scholar] [CrossRef]
- Giudici, F.; Castelletti, A.; Garofalo, E.; Giuliani, M.; Maier, H.R. Dynamic, multi-objective optimal design and operation of water-energy systems for small, off-grid islands. Appl. Energy 2019, 250, 605–616. [Google Scholar] [CrossRef]
- Serrano-Tovar, T.; Suárez, B.P.; Musicki, A.; de la Fuente Bencomo, J.A.; Cabello, V.; Giampietro, M. Structuring an integrated water-energy-food nexus assessment of a local wind energy desalination system for irrigation. Sci. Total Environ. 2019, 689, 945–957. [Google Scholar] [CrossRef]
- Aberilla, J.M.; Gallego-Schmid, A.; Stamford, L.; Azapagic, A. Synergistic generation of energy and water in remote communities: Economic and environmental assessment of current situation and future scenarios. Energy Convers. Manag. 2020, 207, 112543. [Google Scholar] [CrossRef]
- Aberilla, J.M.; Gallego-Schmid, A.; Stamford, L.; Azapagic, A. Environmental assessment of domestic water supply options for remote communities. Water Res. 2020, 175, 115687. [Google Scholar] [CrossRef]
- Blechinger, P.; Cader, C.; Bertheau, P.; Huyskens, H.; Seguin, R.; Breyer, C. Global analysis of the techno-economic potential of renewable energy hybrid systems on small islands. Energy Policy 2016, 98, 674–687. [Google Scholar] [CrossRef]
- Calise, F.; Cappiello, F.L.; Vicidomini, M.; Petrakopoulou-Robinson, F. Water-energy nexus: A thermoeconomic analysis of polygeneration systems for small Mediterranean islands. Energy Convers. Manag. 2020, 220, 113043. [Google Scholar] [CrossRef]
- Moazeni, F.; Khazaei, J.; Mendes, J.P.P. Maximizing energy efficiency of islanded micro water-energy nexus using co-optimization of water demand and energy consumption. Appl. Energy 2020, 266, 114863. [Google Scholar] [CrossRef]
- Lupton, R.C.; Allwood, J.M. Hybrid Sankey diagrams: Visual analysis of multidimensional data for understanding resource use. Resour. Conserv. Recycl. 2017, 124, 141–151. [Google Scholar] [CrossRef]
- ISTAC|Inicio ISTAC-Gobierno de Canarias. Available online: http://www.gobiernodecanarias.org/istac/ (accessed on 11 November 2021).
- Gobierno de Canarias Instituto Canario de Estadística. Available online: http://www.gobiernodecanarias.org/istac/datos-abiertos/galerias/visor/indicadores.html?tema=poblacion#data (accessed on 1 September 2021).
- Consejo Insular de Aguas de Tenerife, C. Obras de Captación de Aguas Subterráneas. Arcgis. Available online: https://www.arcgis.com/home/item.html?id=cda91956bd2541dca14236459219dcd6 (accessed on 9 September 2021).
- Insituto Canario de Estadística Anuario Energético de Canarias. Available online: http://www.gobiernodecanarias.org/istac/jaxi-istac/menu.do?uripub=urn:uuid:131cf873-66a9-408d-8cfa-537d6be05067 (accessed on 1 June 2021).
- Davara, J. Binomio Agua-Energía Caso de la Isla de Tenerife; Consejo Insular de Aguas: La Laguna, Spain, 2020.
- Gobierno de Canarias. Plan de Autogestión en la Producción y Distribución de Agua de Canarias 2014–2020. Available online: http://www.gobiernodecanarias.org/hacienda/dgplani/fondos_europeos/programas/programacion/programacion2014-2020.html (accessed on 20 November 2021).
- ENDESA S.A. Declaración Medioambiental Enero-Diciembre 2017. CT Granadilla. Available online: https://www.endesa.com/content/dam/endesa-com/home/sostenibilidad/medioambiente/gestionambiental/documentos/2017/declaracion-mediombiental-unelco-granadilla.pdf (accessed on 5 November 2021).
- How Many Hours a Year Do You Spend in a Car (and More Figures That Will Make You Think). Available online: https://noticias.coches.com/noticias-motor/cuantas-horas-pasas-al-ano-en-coche-y-mas-cifras-que-te-haran-pensar/146162 (accessed on 6 June 2021).
- CtsEMBARQ. Modelación Para la Identificación de Línea Base y Medidas de Mitigación de Emisiones de Compuestos de Efecto Invernadero para el Desarrollo Orientado al Transporte (DOT) en Guadalajara. Available online: https://pdf.usaid.gov/pdf_docs/PA00MBQ8.pdf (accessed on 23 September 2021).
- Instituto Tecnológico de Canarias, S.A. Estudio Para la Implantación del Vehículo Eléctrico en Canarias. Available online: https://datosdelanzarote.com/media/item/docs/Estudio-para-la-implantación-del-Vehículo-Eléctrico-en-Canarias.-2013.-Resumen-Ejecutivo-2020020614360435Resumen-EjecutivoEstudio_Implantacin_Vehculo_Elctrico_Resumen_Ejecutivo__Noviembre_2013.pdf (accessed on 6 September 2021).
- Consejo Insular de Aguas de Tenerife. Plan Hidrológico de Tenerife. Available online: https://www.aguastenerife.org/index.php?option=com_content&view=article&id=138&Itemid=1675 (accessed on 7 November 2021).
- Moreno, J. 21% of Tenerife’s Wastewater Is Discharged into the Sea Untreated. Available online: https://diariodeavisos.elespanol.com/2017/08/21-las-aguas-residuales-tenerife-se-vierten-al-mar-sin-tratar (accessed on 3 June 2021).
- Tenerife in Five Years Wastes More than 91 Million Euros for Leaks in Water Networks. Available online: https://diariodeavisos.elespanol.com/2016/03/tenerife-malgasta-cinco-anos-mas-91-millones-euros-fugas-las-redes-agua/ (accessed on 2 March 2021).
- The European Federation of National Water Services. Europe’s Water in Figures. Available online: https://www.eureau.org/resources/publications/1460-eureau-data-report-2017-1/file (accessed on 1 January 2021).
- Karnauskas, K.B.; Donnelly, J.P.; Anchukaitis, K.J. Future freshwater stress for island populations. Nat. Clim. Change 2016, 6, 720–725. [Google Scholar] [CrossRef]
- Custodio, E.; Andreu-Rodes, J.M.; Aragón, R.; Estrela, T.; Ferrer, J.; García-Aróstegui, J.L.; Manzano, M.; Rodríguez-Hernández, L.; Sahuquillo, A.; del Villar, A. Groundwater intensive use and mining in south-eastern peninsular Spain: Hydrogeological, economic and social aspects. Sci. Total Environ. 2016, 559, 302–316. [Google Scholar] [CrossRef] [Green Version]
- Blanco-Marigorta, A.M.; Lozano-Medina, A.; Marcos, J.D. A critical review of definitions for exergetic efficiency in reverse osmosis desalination plants. Energy 2017, 137, 752–760. [Google Scholar] [CrossRef]
- Triantafyllou, P.; Koroneos, C.; Kondili, E.; Kollas, P.; Zafirakis, D.; Ktenidis, P.; Kaldellis, J.K. Optimum green energy solution to address the remote islands’ water-energy nexus: The case study of Nisyros island. Heliyon 2021, 7, e07838. [Google Scholar] [CrossRef]
- Uche-Soria, M.; Rodríguez-Monroy, C. Energy planning and its relationship to energy poverty in decision making. A first approach for the Canary Islands. Energy Policy 2020, 140, 111423. [Google Scholar] [CrossRef]
- Ramos-Real, F.J.; Barrera-Santana, J.; Ramírez-Díaz, A.; Perez, Y. Interconnecting isolated electrical systems. The case of Canary Islands. Energy Strat. Rev. 2018, 22, 37–46. [Google Scholar] [CrossRef]
- ENDESA S.A. Declaración Medioambiental Enero-Diciembre 2017. CT Candelaria. Available online: https://www.endesa.com/content/dam/endesa-com/home/sostenibilidad/medioambiente/gestionambiental/documentos/2017/declaracion-medioambiental-unelco-candelaria.pdf (accessed on 5 November 2021).
- Gobierno de Canarias. Ley 12/1990, de 26 de Julio, de Aguas. Available online: https://www.boe.es/buscar/pdf/1990/BOE-A-1990-23087-consolidado.pdf (accessed on 5 November 2021).
- Chijeb, N. The Las Caletillas Power Plant Is Moving Towards Dismantling. Available online: https://diariodeavisos.elespanol.com/2019/10/la-central-de-las-caletillas-camina-al-desmantelamiento/ (accessed on 16 October 2019).
- BOE. Proyecto de Ley de Cambio Climático y Transición Energética. Available online: https://www.miteco.gob.es/es/ministerio/proyecto-de-ley-de-cambio-climatico-y-transicion-energetica.aspx (accessed on 11 November 2021).
Publisher’s Note: MDPI stays neutral with regard to jurisdictional claims in published maps and institutional affiliations. |
© 2022 by the authors. Licensee MDPI, Basel, Switzerland. This article is an open access article distributed under the terms and conditions of the Creative Commons Attribution (CC BY) license (https://creativecommons.org/licenses/by/4.0/).